1. Introduction
Lithium ion batteries (LIBs) are considered a reasonable energy-storage solution for electric vehicles and grid stabilization when introducing renewable energy sources [
1,
2,
3]. Future requirements needs further increase of energy density, power density and reduction of costs. Substantial production costs arise from the formation cycles, realized by the supplier [
4]. Initial cycles of LIBs based on graphite are required to form a stable protective layer covering all anode particles, what is typically done by applying specific time consuming procedures [
4]. Implementation of accelerated formation protocols is therefore crucial for the cost-reduction of state of the art LIBs [
4].
Typical operating voltage ranges used for lithium ion batteries based on graphite anodes and layered oxide Li
MO
2 cathodes (with
M = Ni, Co and Mn) are typically within 3.0–4.3 V [
5,
6]. During operation, carbon-based anodes undergo reduction potentials of typical electrolyte components [
7] like ethylene carbonate (EC), dimethyl carbonate (DMC), ethylmethyl carbonate (EMC), diethyl carbonate (DEC) and LiPF
6, while typical composite cathodes exceed potentials inducing polymerization reactions of electrolyte components in the presence of electrolyte decomposition products [
8]. Due to this issue, interphase layers of decomposition products form during operation between electrolyte and both electrode surfaces, first described by E. Peled as the solid electrolyte interphase (SEI) [
9]. Consecutively, electrolyte solvents and additives, as well as anode materials, were optimized to form stable, pin-hole-free anodic SEI layers during the first cycles [
10,
11]. Vinylene derived additives like vinylene carbonate (VC) or fluorinated solvents like fluoroethylene carbonate (FEC) are frequently used as components optimizing SEI formation on graphite anodes or silicon based composite anodes [
12,
13,
14]. Superior additive content of ≈2% VC was found for LCO/graphite cells [
15].
M. Meyerson et al. described impacts of the SEI chemistry on Li dendrite nucleation, identifying preferred Li nucleation sites at LiF-rich SEI regions [
16]. I. Buchberger et al. studied several aging mechanisms of graphite-LiNi
1/3Mn
1/3Co
1/3O
2 (NMC 111) cells with cycling at moderate conditions, elevated temperature or elevated cutoff voltage [
5]. Traces of H
2O in the cell can release HF from LiPF
6 decomposition [
17,
18], which induces cathode deformation and transition metal release, especially of Mn species, via corrosion reactions close to Hunter’s reaction [
5,
19,
20]. While losses of active cathode material have minor effects on capacity-fade, the transition metal deposition on the anodic SEI results in a significant increase of the SEI growth rate. Therefore the active lithium losses increase via lithium immobilization in the SEI, as well as the impedances both of NMC 111 cathode and graphite anode with cycling [
5]. Similar aging phenomena at elevated cutoff voltages were shown by J. Kasnatscheew et al. for graphite-LiNi
5/10Mn
3/10Co
2/10O
2 (NMC 532), graphite-LiNi
6/10Mn
2/10Co
2/10O
2 (NMC 622) and graphite-LiNi
8/10Mn
1/10Co
1/10O
2 (NMC 811) cells [
6]. Recent studies reported minor influences of parasitic electrolyte oxidation reactions on NMC 111 cathodes at cutoff voltages below 4.6 V [
21] and emphasized significant cathode capacity losses to arise mainly from partially reversible kinetic limitations due to changes in the crystal lattice of the NMC cathode particles [
22], in contrast to irreversible lithium losses induced by parasitic side reactions inducing SEI growth at graphite anodes [
5].
Influences of the formation protocol on the SEI in graphite-NMC 532 cells with 1.2 M LiPF
6 in EC:DEC (3:7) as an electrolyte, were studied by An et al. [
23]. By keeping the cell in high SOC during formation, they showed possible routes how to use accelerated formation rates up to C/5 while maintaining reduced surface resistances and lowered capacity fading along cycling [
23]. Similarly, Rago et al. described an accelerated formation protocol up to C/5 rate for silicon/graphite-NMC 532 cells using FEC-rich electrolyte, applying C/20 rate only in a small voltage region. Despite indications for a significantly thicker SEI after accelerating the formation rate, their cells did not reveal additional capacity fading at 1C cycling [
14]. Applying external pressure during operation was recently shown by Heimes et al. to considerably prolong CC charging phases at 1C formation rate of graphite-NMC 622 cells, similar to 1C formation at elevated temperature, but acting more cost efficiently [
24].
Pinson and Bazant created several theoretical models to fit and predict SEI growth, validated with published lithium ion battery fade data [
25]. Their porous electrode model clearly indicates a superior dependence of the SEI growth with time, while negligibly affected from the total number of charge/discharges cycles (in case of moderate anode thickness, charging rate and temperature) [
25].
Neutron depth profiling (NDP) was first shown by Whitney et al. as a valid technique to quantify both anodic SEI and cathodic solid electrolyte interphases (CEI) [
26,
27]. Whitney et al. described the calendaric SEI growth with respect to temperature, and the CEI growth depending on the charge/discharge rate during cycling [
27]. Hereafter, the NDP technique has been frequently used to study LIB aging aspects such as SEI trends on Si/graphite anodes [
28,
29], degradation aspects of all-solid-state batteries [
30] as well as in-situ lithium transport phenomena in LIBs [
31,
32,
33].
The lamination technique is well-known in the industrial production of LIBs for its benefits in increasing the production line speed of stacked cell compounds and for reducing reject rates due to the electrode-separator misplacement [
34]. Technical aspects have been specified by several patent applications [
35,
36] and research reports on supercapacitor production techniques [
37]. A detailed overview on the use of lamination in LIB production was given in our previous report [
38]. While mechanical benefits of the lamination technique are well-known to the scientific community, electrochemical aspects remain mostly unclear. Recent studies on lamination revealed benefits especially on the fast-charging capability of graphite NMC 111 cells [
38,
39]. The lowered capacity losses along fast-charging cycles were shown to arise from a significant reduction in SEI growth upon lamination at the anode-separator interphase [
39]. The lamination technique was also shown to tune the C-rate stability of graphite-NMC 111 cells similar to application of external cell pressure during operation [
38].
Beneficial aspects of the electrode-separator lamination technique on the SEI growth at accelerated formation rates are investigated in this study.
2. Results and Discussion
2.1. Capacity-Fade Phenomena
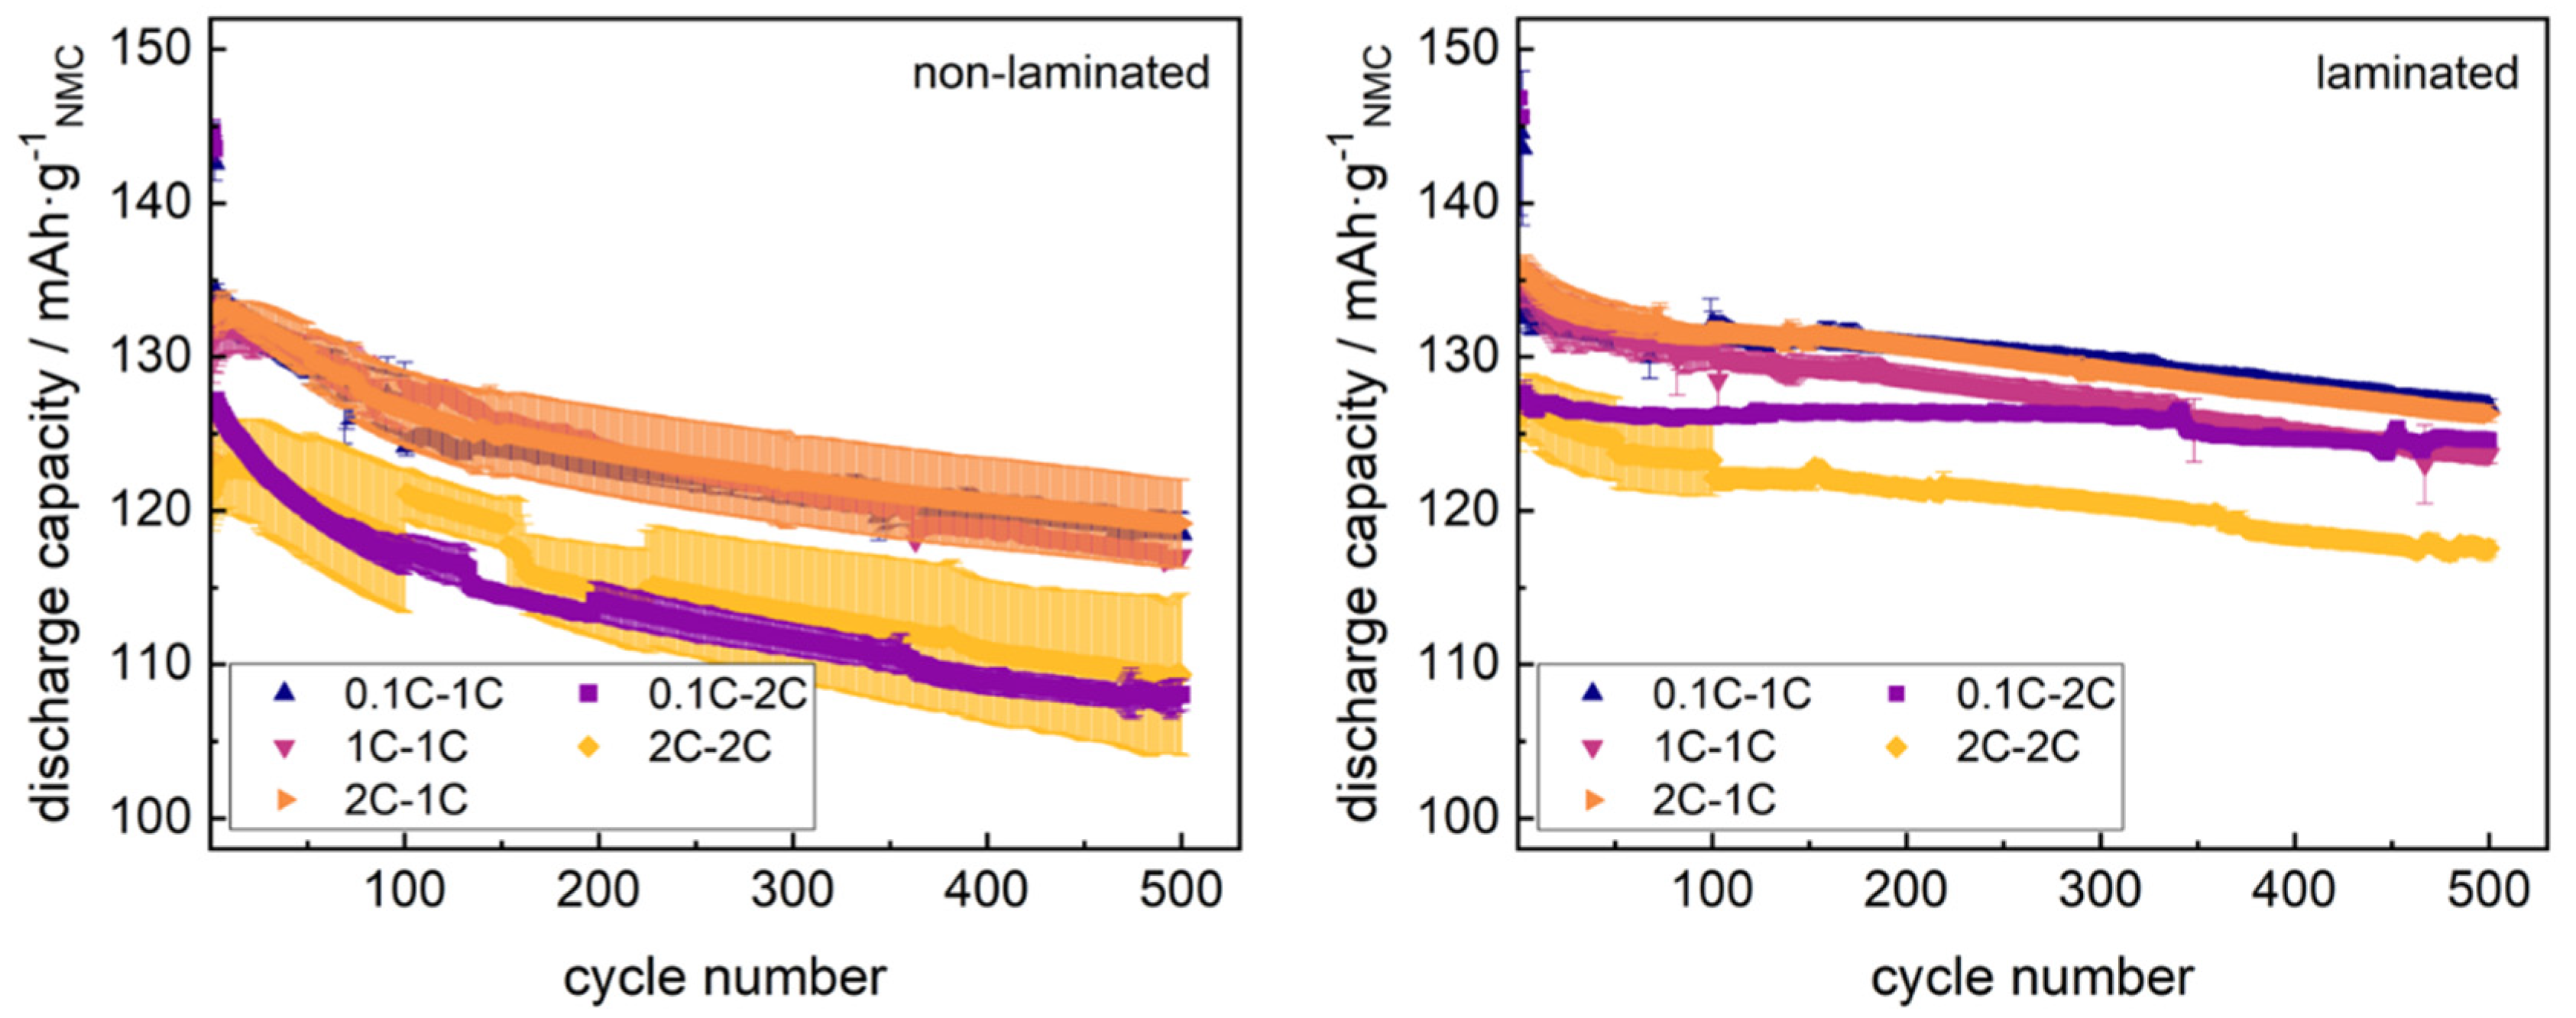
Graphite-NMC single cells in non-laminated/laminated state were cycled for 2 cycles at varied formation rates (0.1C, 1C and 2C) and at varied cycling rates (1C and 2C) for several subsequent cycles (8, 48, 98 and 498). Averaged discharge capacity trends for each formation/cycling path are shown in
Figure 1.
Due to temporary data acquisition issues with seven cells considered in
Figure 1, some cycling curves in
Figure 1 show an offset within cycles 101–211 due to a temporary reduction of representative datasets. These cycles however were excluded from further analysis.
Non-laminated cells cycled at 1C rate revealed similar capacity-fade along cycling, revealing ≈89% of the maximum discharge capacity after 500 cycles, with accelerated formation rates (1C and 2C) starting at slightly lower discharge capacities in the initial cycle, and ascending to the reference level of formation at 0.1C rate within the first 10 cycles. Increasing the cycling rate of non-laminated cells reduced both the maximum discharge capacity of the cells reached during cycling, as well as the residual capacity after 500 cycles (87%). Formation of non-laminated cells at 2C rate induced increased data spreading of the cell series, both for subsequent cycling at the 1C rate and 2C rate. Non-laminated cells both formed and cycled at the 2C rate, again revealed an inflection point of discharge capacity within the initial cycles, as well as significantly enhanced data spreading.
Laminated cells revealed no inflection point in the initial discharge capacities for any formation or cycling rate, while reducing the capacity losses within the first 500 cycles at 1C cycling (94% of maximum capacity) and 2C cycling. Laminated cells formed at 0.1C revealed the significantly lowest capacity losses at 2C cycling (98% after 500 cycles) and tended to reach similar capacity levels both at 1C and 2C cycling with increasing cycle number. Formation and subsequent cycling of laminated cells at 2C rate reduced the residual capacity (94%) after 500 cycles. An increase of data spreading during cycling for cells formed at 2C rate was clearly dampened using laminated cells. All capacity-fade trends are summarized in
Table 1.
The given trends in the discharge capacity correlated to our previous studies on single cells in the laminated and non-laminated state. A possible increase of the formation rate up to 1C rate without significant obstacles is clearly shown for both assembly modes, which overcomes previous reports of stable fast formation protocols given by An et al. or Rago et al., reporting maximum 0.5C rate formation protocols [
14,
23]. This underlines the validity of choosing vinylene carbonate as SEI precursor additive in the ratio of 2%, as suggested by Wang et al. [
15].
It is well-known that the electrode-separator lamination technique can replace the application of external cell pressure to improve the C-rate stability [
38]. The data shown in
Figure 1 and
Table 1 now underline as well the ability of the lamination technique to stabilize cells at fast-formation up to the 2C rate, similar to known effects of external cell pressure stabilizing 1C formation of graphite-NMC 622 cells [
24].
Applying the electrode-separator lamination technique previous to cycling again proves as a valid modification for the reduction of capacity fading phenomena as reported in our previous studies [
38,
39], and improves the cell performance at the 2C formation rate. As the SEI growth phenomena were shown to act as the main aging effect tuned by lamination at fast-charging protocols, the given cycling data indicate similar aging effects driving the modified cell performance at fast-formation.
2.2. SEI Growth Phenomena
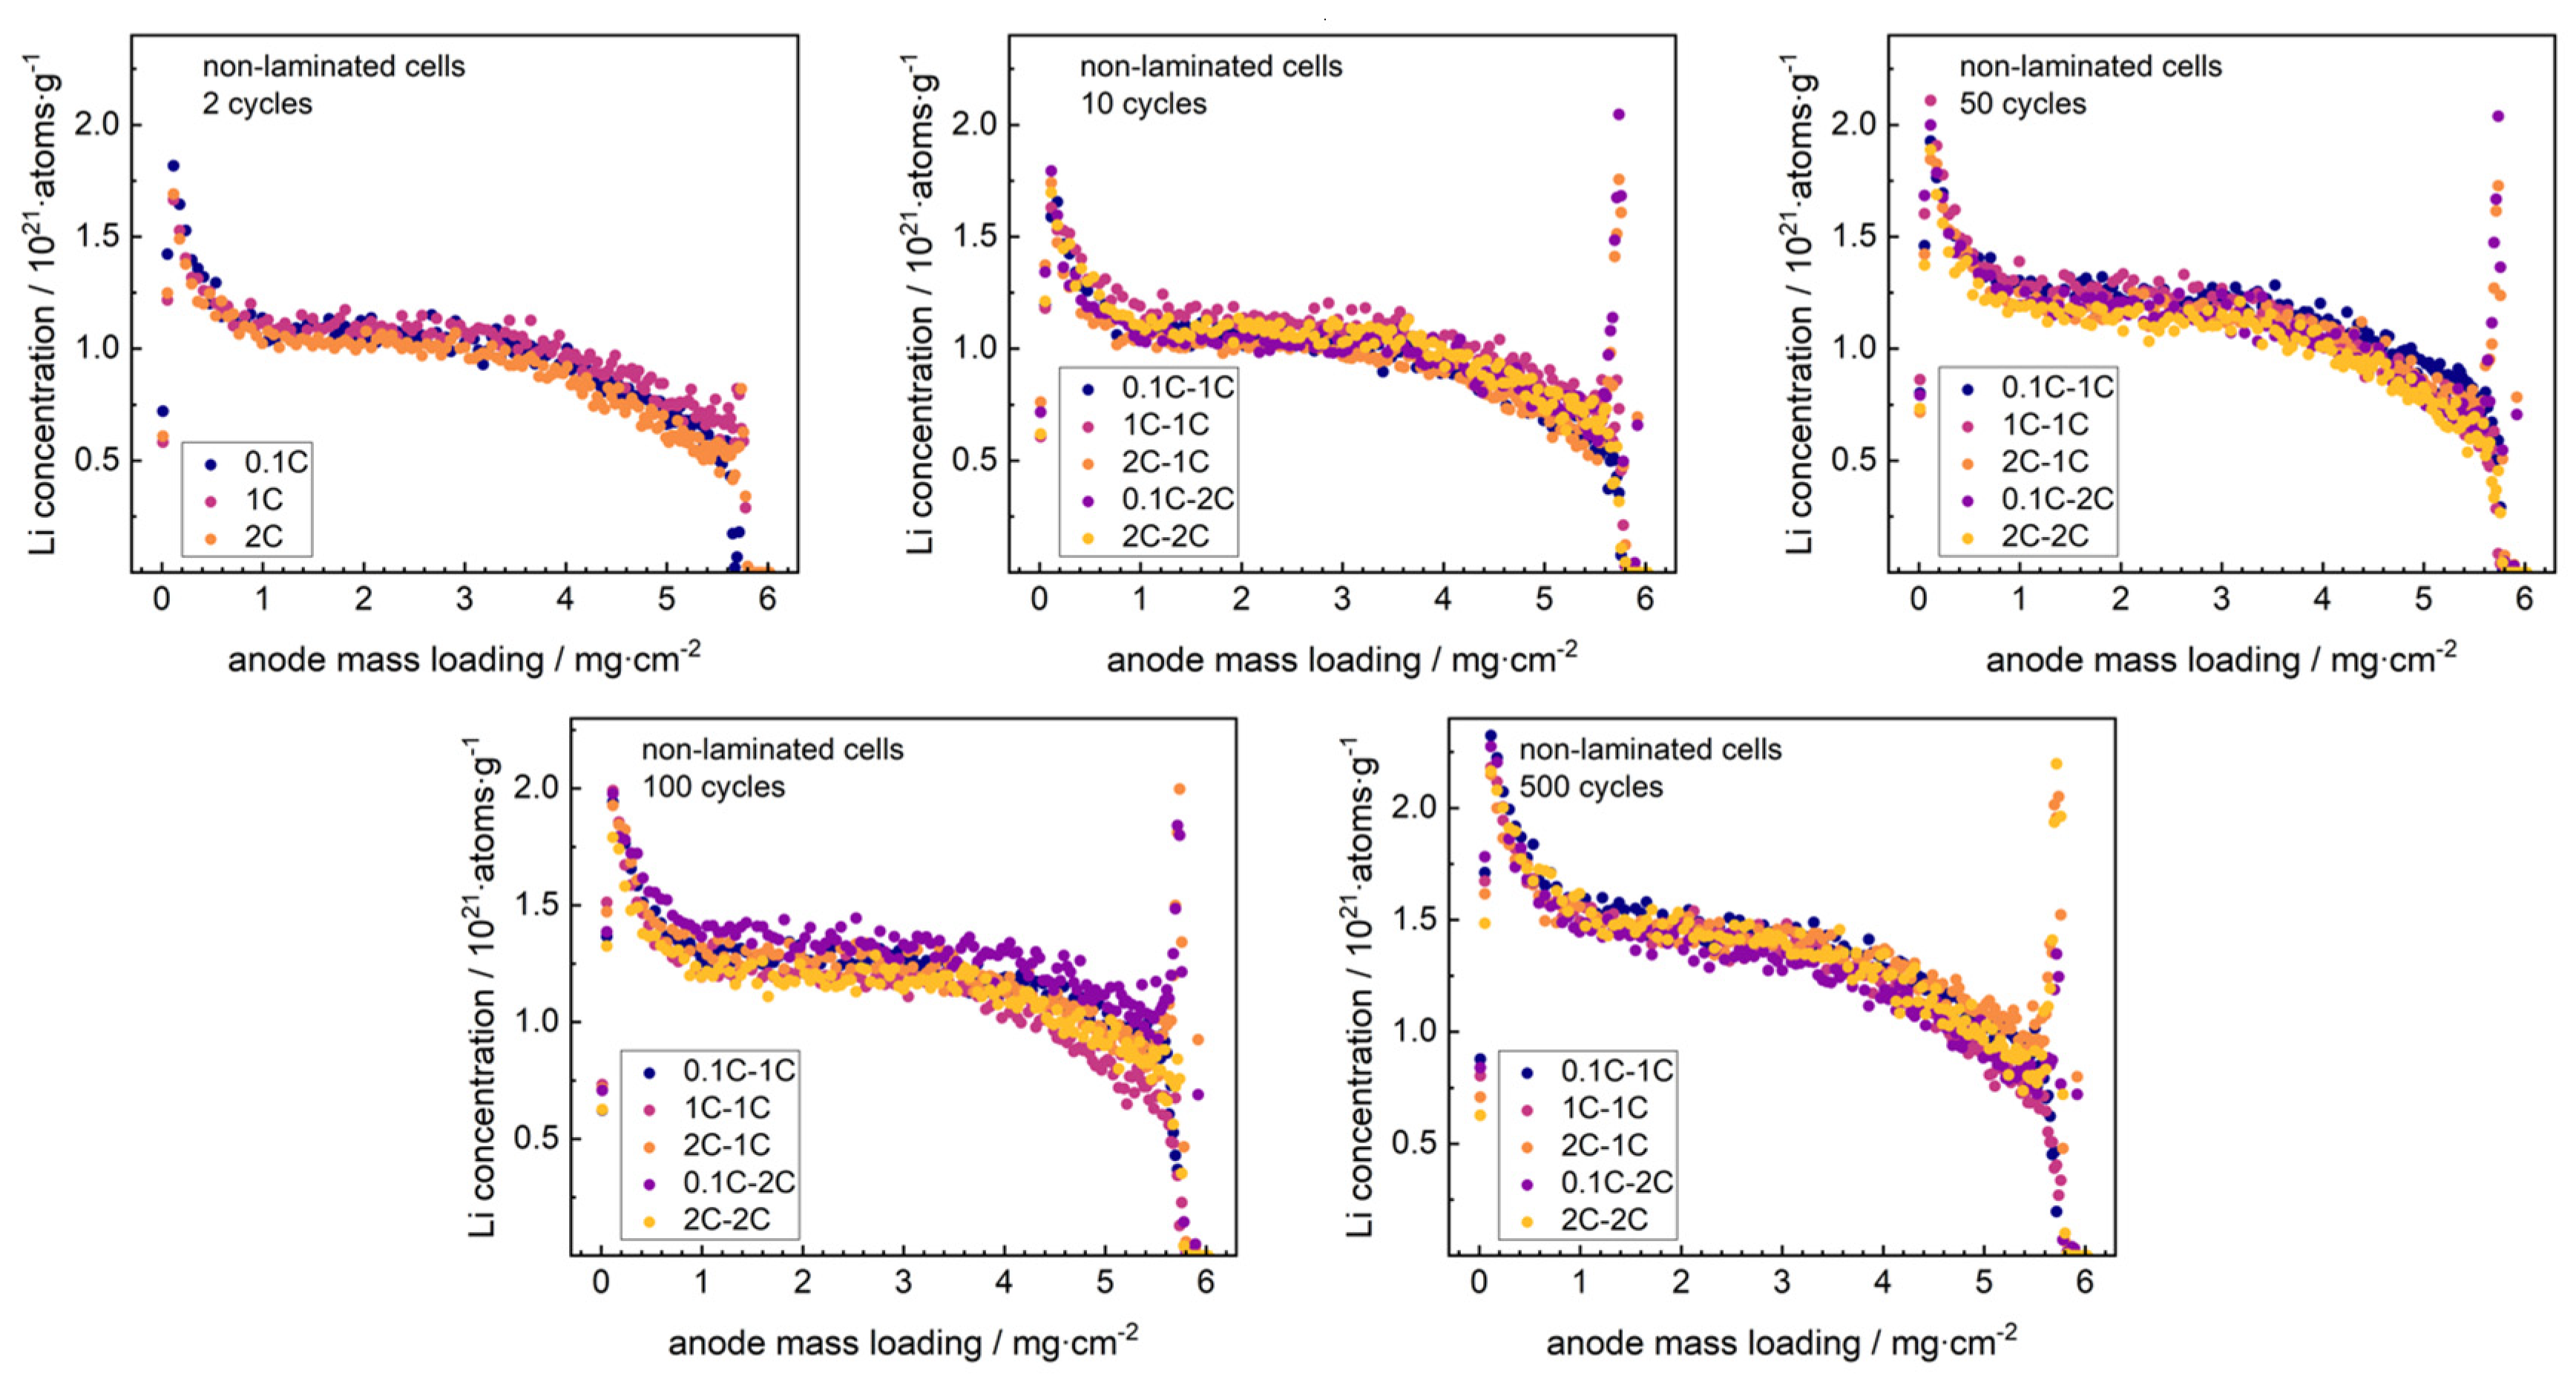
Discharged graphite anodes from non-laminated cells were studied post-mortem with NDP after varied formation rates (0.1C, 1C and 2C), cycling rates (1C and 2C) and cycle numbers (2, 10, 50, 100 and 500). Pristine non-laminated and laminated graphite anodes (i.e., with no lithium content) were used to generate reference spectra. On the low-energy end of the spectra, one can see a region with high counts, which originates from low-energy beta particles and gamma photons produced during neutron capture [
40]. This background was subtracted from all the spectra. This stripping technique does not work reliably at the lowest energies, i.e., for particles emitted near the anode/current collector interface, so this region was omitted from the further analysis. These spectra are shown in the
supplementary materials. Lithium immobilized in the SEI was revealed by detecting the energy of the
3H particle of the
6Li(n,
3H)
4He reaction. As described by Trunk et al. [
29], the lithium depth profiles were extracted from the NDP energy spectra using the SRIM software [
41] taking into account the Kapton
® separation foil and the composition of the pristine graphite anodes. The lithium depth profiles are shown in
Figure 2.
The 2 cycles datasets represent the three separate formation rates. Further separation into five different formation/cycling modes starts at the 3rd cycle, when the C-rate change to the final cycling rate is first applied. As all other possible lithium contributions (lithiated graphite, cathode and electrolyte) were removed from the samples via fully discharging the battery and rinsing of the anode, the detected signal can be assigned to irreversibly attached lithium at the anode surface, i.e., the SEI. All depth profiles reveal a similar shape. An increase of lithium is detected at the anode surface, i.e., the anode-separator interphase, which might arise from surface orientation aspects or from direct lithium accumulations [
29]. In deeper anode regions (>3 mg·cm
−2) the signal decreased, resembling the Gaussian shape of the NDP detection response function. All signals are cut at a depth of about 5.7 mg·cm
−2, which is the maximum depth limit for detection of
3H charged particles in this setup. The inflection point, which resembles the anode-Cu current collector interphase [
29], is situated around 6.0 ± 0.7 mg·cm
−2 and lies outside of the detection range. In the bulk regime (0.5–3 mg·cm
−2), a homogenous Li distribution was observed, indicating a homogenous distribution of the SEI. This correlates to the concept of the SEI as a protective layer with similar thickness covering all anode particles. The signal shape agrees well to reports of NDP data on post-mortem Si/C composite anodes [
28].
At all formation rates, a major portion of the SEI was formed after 2 cycles. This enhanced indications from the cycling data for the electrolyte to form a homogenous and comparable SEI also at accelerated formation rates. With increasing charge–discharge rates, the immobilized lithium was found to increase in a similar manner for all cycling rates, without changing the signal shape. This indicates a continuous growth of the SEI with minor dependence on the cycling rate. While the capacity-fade increased with rising cycling rate, the SEI growth was found similar for both cycling paths, which indicates a significant influence from separate aging effects.
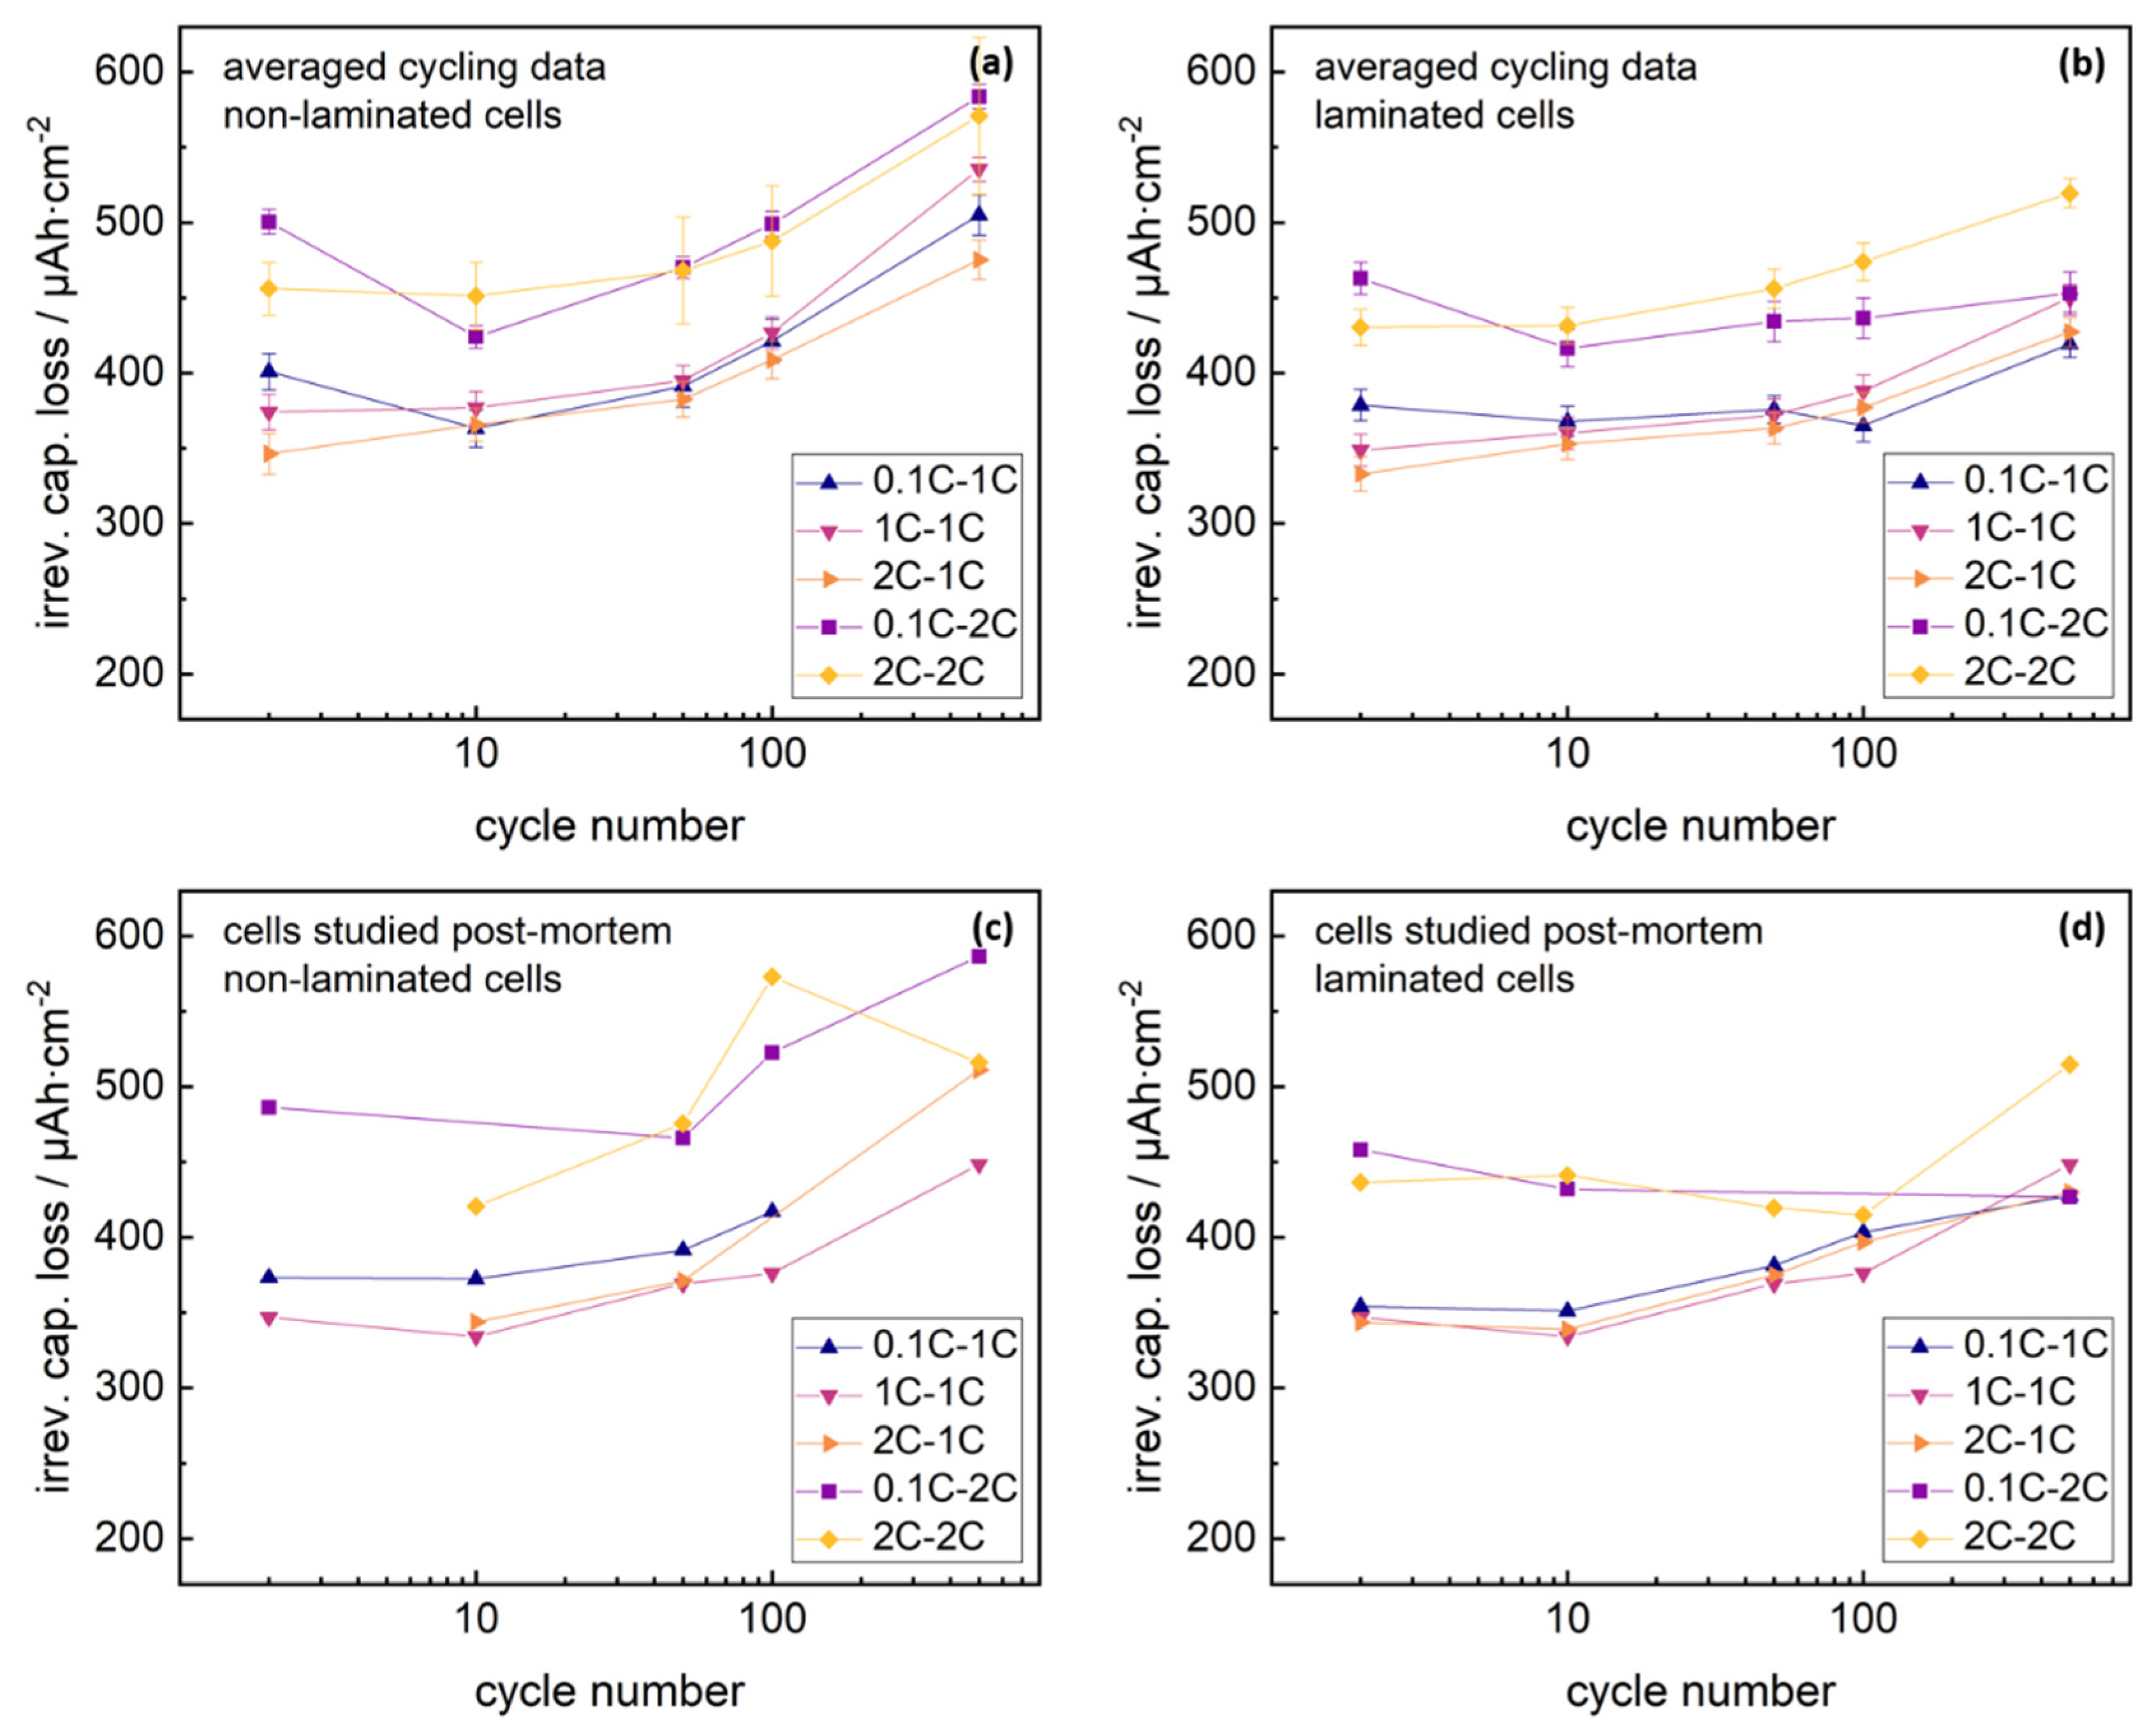
A further comparison of cycling studies and NDP data, requires direct calculation of irreversible capacity losses at cycle numbers studied with NDP. Results are presented in the
supplementary materials. As the C-rate was changed after 2 cycles for some cells, the discharge capacities of these studied cells dropped with varying amount due to the limited C-rate stability of the cells, which gives an artificial signal shift of the irreversible capacity loss signal after two cycles. Given knowledge about the C-rate levels at the 0.1C, 1C and 2C rate of non-laminated and laminated cells can be used to correct this inevitable signal shift at the data points at two cycles. Corrected datasets are shown in
Figure 3.
For precise analysis, the active lithium loss of the exemplary cell series studied post mortem (
Figure 3c,d) was compared to the averaged active lithium loss signals (
Figure 3a,b) arising from the analysis of all cycled cells at the respective assembly mode, formation rate and cycling rate. Averaged signals for the irreversible capacity losses correlated to the discharge capacity trends shown in
Figure 1. Irreversible capacity losses of the individual cells studied post-mortem with NDP revealed similar values as the averaged datasets.
Integrating the background-corrected NDP signals allows for an estimation of the lithium immobilized in the SEI, and consequently for a capacity evaluation of the immobilized lithium using Faraday’s law. Comparison of the measured capacity losses during cycling and lithium immobilization losses driven by SEI growth via NDP, are presented in
Figure 4. NDP detection range was corrected via Gaussian extrapolation as described in previous studies [
29].
Lithium immobilization lay at similar levels for all formation and cycling rates, and increased with cycling analogous to the total irreversible capacity loss signals. Lithium immobilization within the SEI reflected 70–80% of the total capacity losses for non-laminated cells cycled at 1C rate, compared to 55–70% for cells cycled with 2C rate. Differences in the SEI loss capacity ratio for the 1C or 2C cycling rate might arise from different C-rate drops of the cells. The residual capacity losses of the non-laminated graphite-NMC 111 cells, aside from lithium immobilization in the SEI, might arise from increasing kinetic limitations due to ongoing changes in the crystal lattice of the NMC cathode particles [
5,
6]. Again, no significant influence from the formation rate was visible.
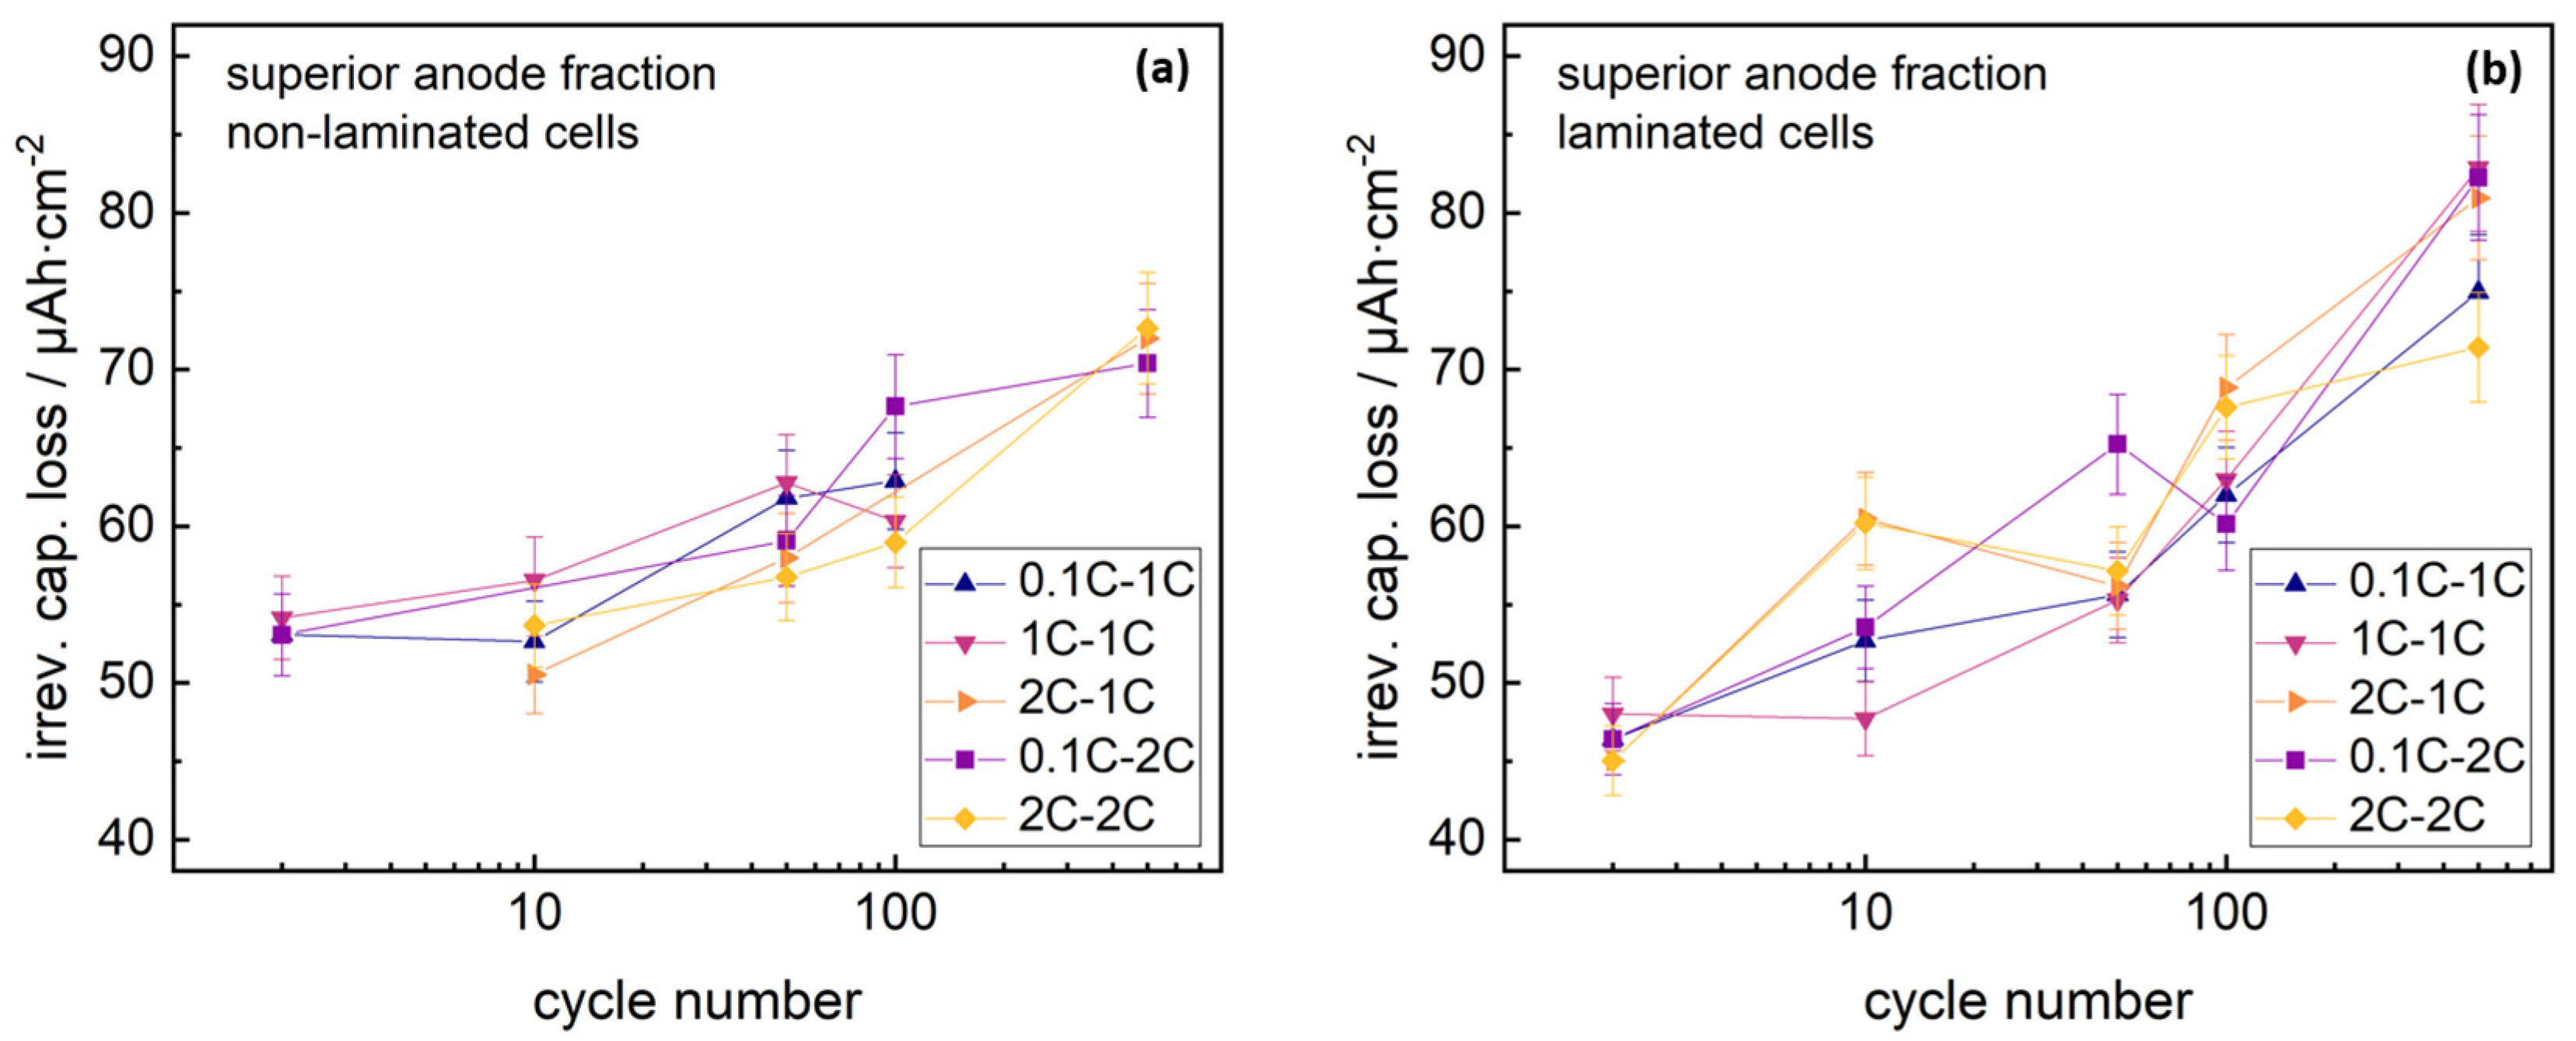
Discharged anode-separator stacks from laminated cells were studied post-mortem with NDP after varied formation rate (0.1C, 1C and 2C), cycling rate (1C and 2C) and cycle numbers (2, 10, 50, 100 and 500). Raw data are presented in the
supplementary materials. The additional material of the laminated separator reduces the maximum depth in the anode accessible with
3H particles. However, the SEI accumulation in the superior layer of the anode/separator stack could be tracked and compared to non-laminated anodes. Integrating the NDP signal arising from superior anode fractions both from laminated and non-laminated cells allowed for a quantification of lithium immobilized in the examined anode fractions. Datasets are shown in
Figure 5.
Both laminated and non-laminated cells revealed similar lithium immobilization (increasing with cycle number) for all formation and cycling rates.
This trend in lithium immobilization in superior anode fractions indicates no clear correlation with the capacity losses found in the cycling studies. The signal discrepancy either indicates non-homogenous SEI growth with electrode depth for laminated cells, or significant influence of separate aging phenomena.
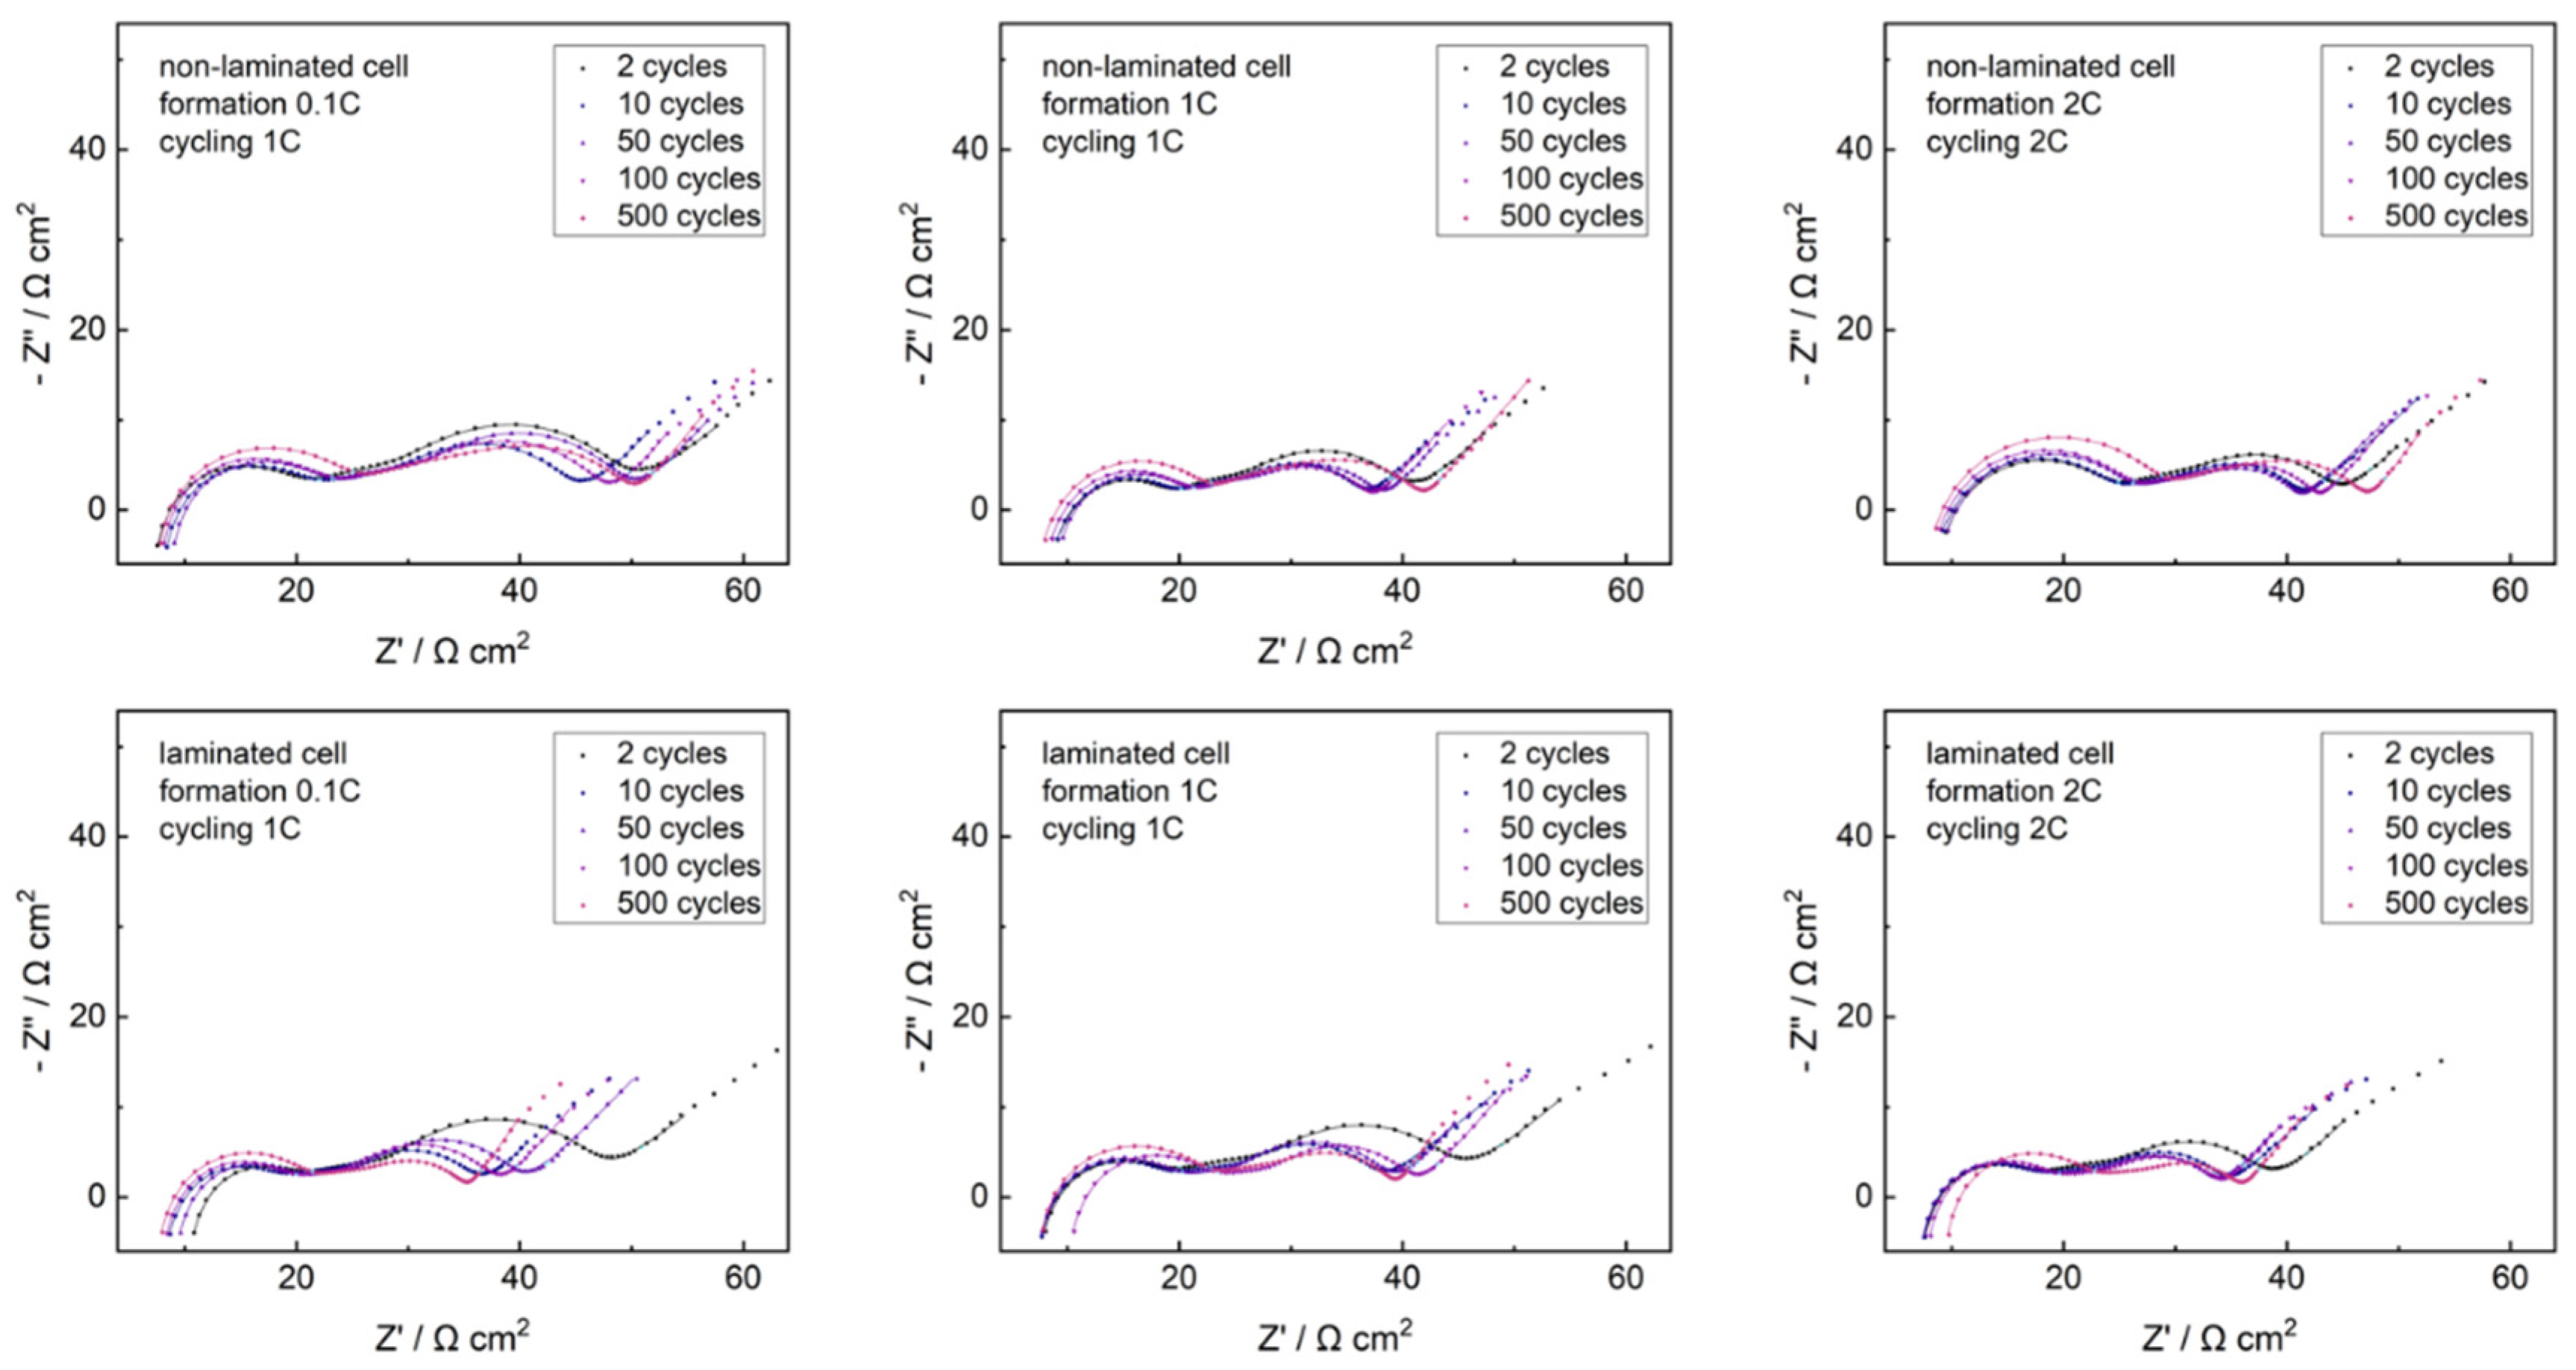
2.3. Surface Resistance Growth Phenomena
Graphite-NMC single cells were studied with electrochemical impedance spectroscopy (EIS) along cycling in non-laminated and laminated state. Nyquist plots of datasets and fitting curves are shown in
Figure 6.
All Nyquist datasets reveal similar structure of the EIS response, correlating to our previous studies [
39]. The highest frequency domains were dominated by inductive effects, resulting from the EIS setup environment. Three subsequent semicircles arise from surface resistance phenomena, the anode charge–transfer reaction and cathode charge–transfer reaction, respectively. The lowest frequency responses were governed by solid-state diffusion characteristics, splitting into closed and open Warburg type data. The surface resistance semicircle increased with cycling for all cells. The highlighted data point set at 940 Hz lay close to the minimum between the 1st and 2nd semicircle for all datasets, with no shift along cycling. Analogously, the highlighted data point set at 0.104 Hz lay in the closed Warburg regime, close to the 3rd semicircle, with no shift along cycling. This indicates negligible changes in the time constants with cycling for all cells, what agrees well with literature [
39,
42]. Further information can be extracted using EIS fit analysis, excluding open Warburg data points due to the structure of the chosen equivalent circuit fit model. Fit parameter trends and equivalent circuit fit models are shown in
Figure 7.
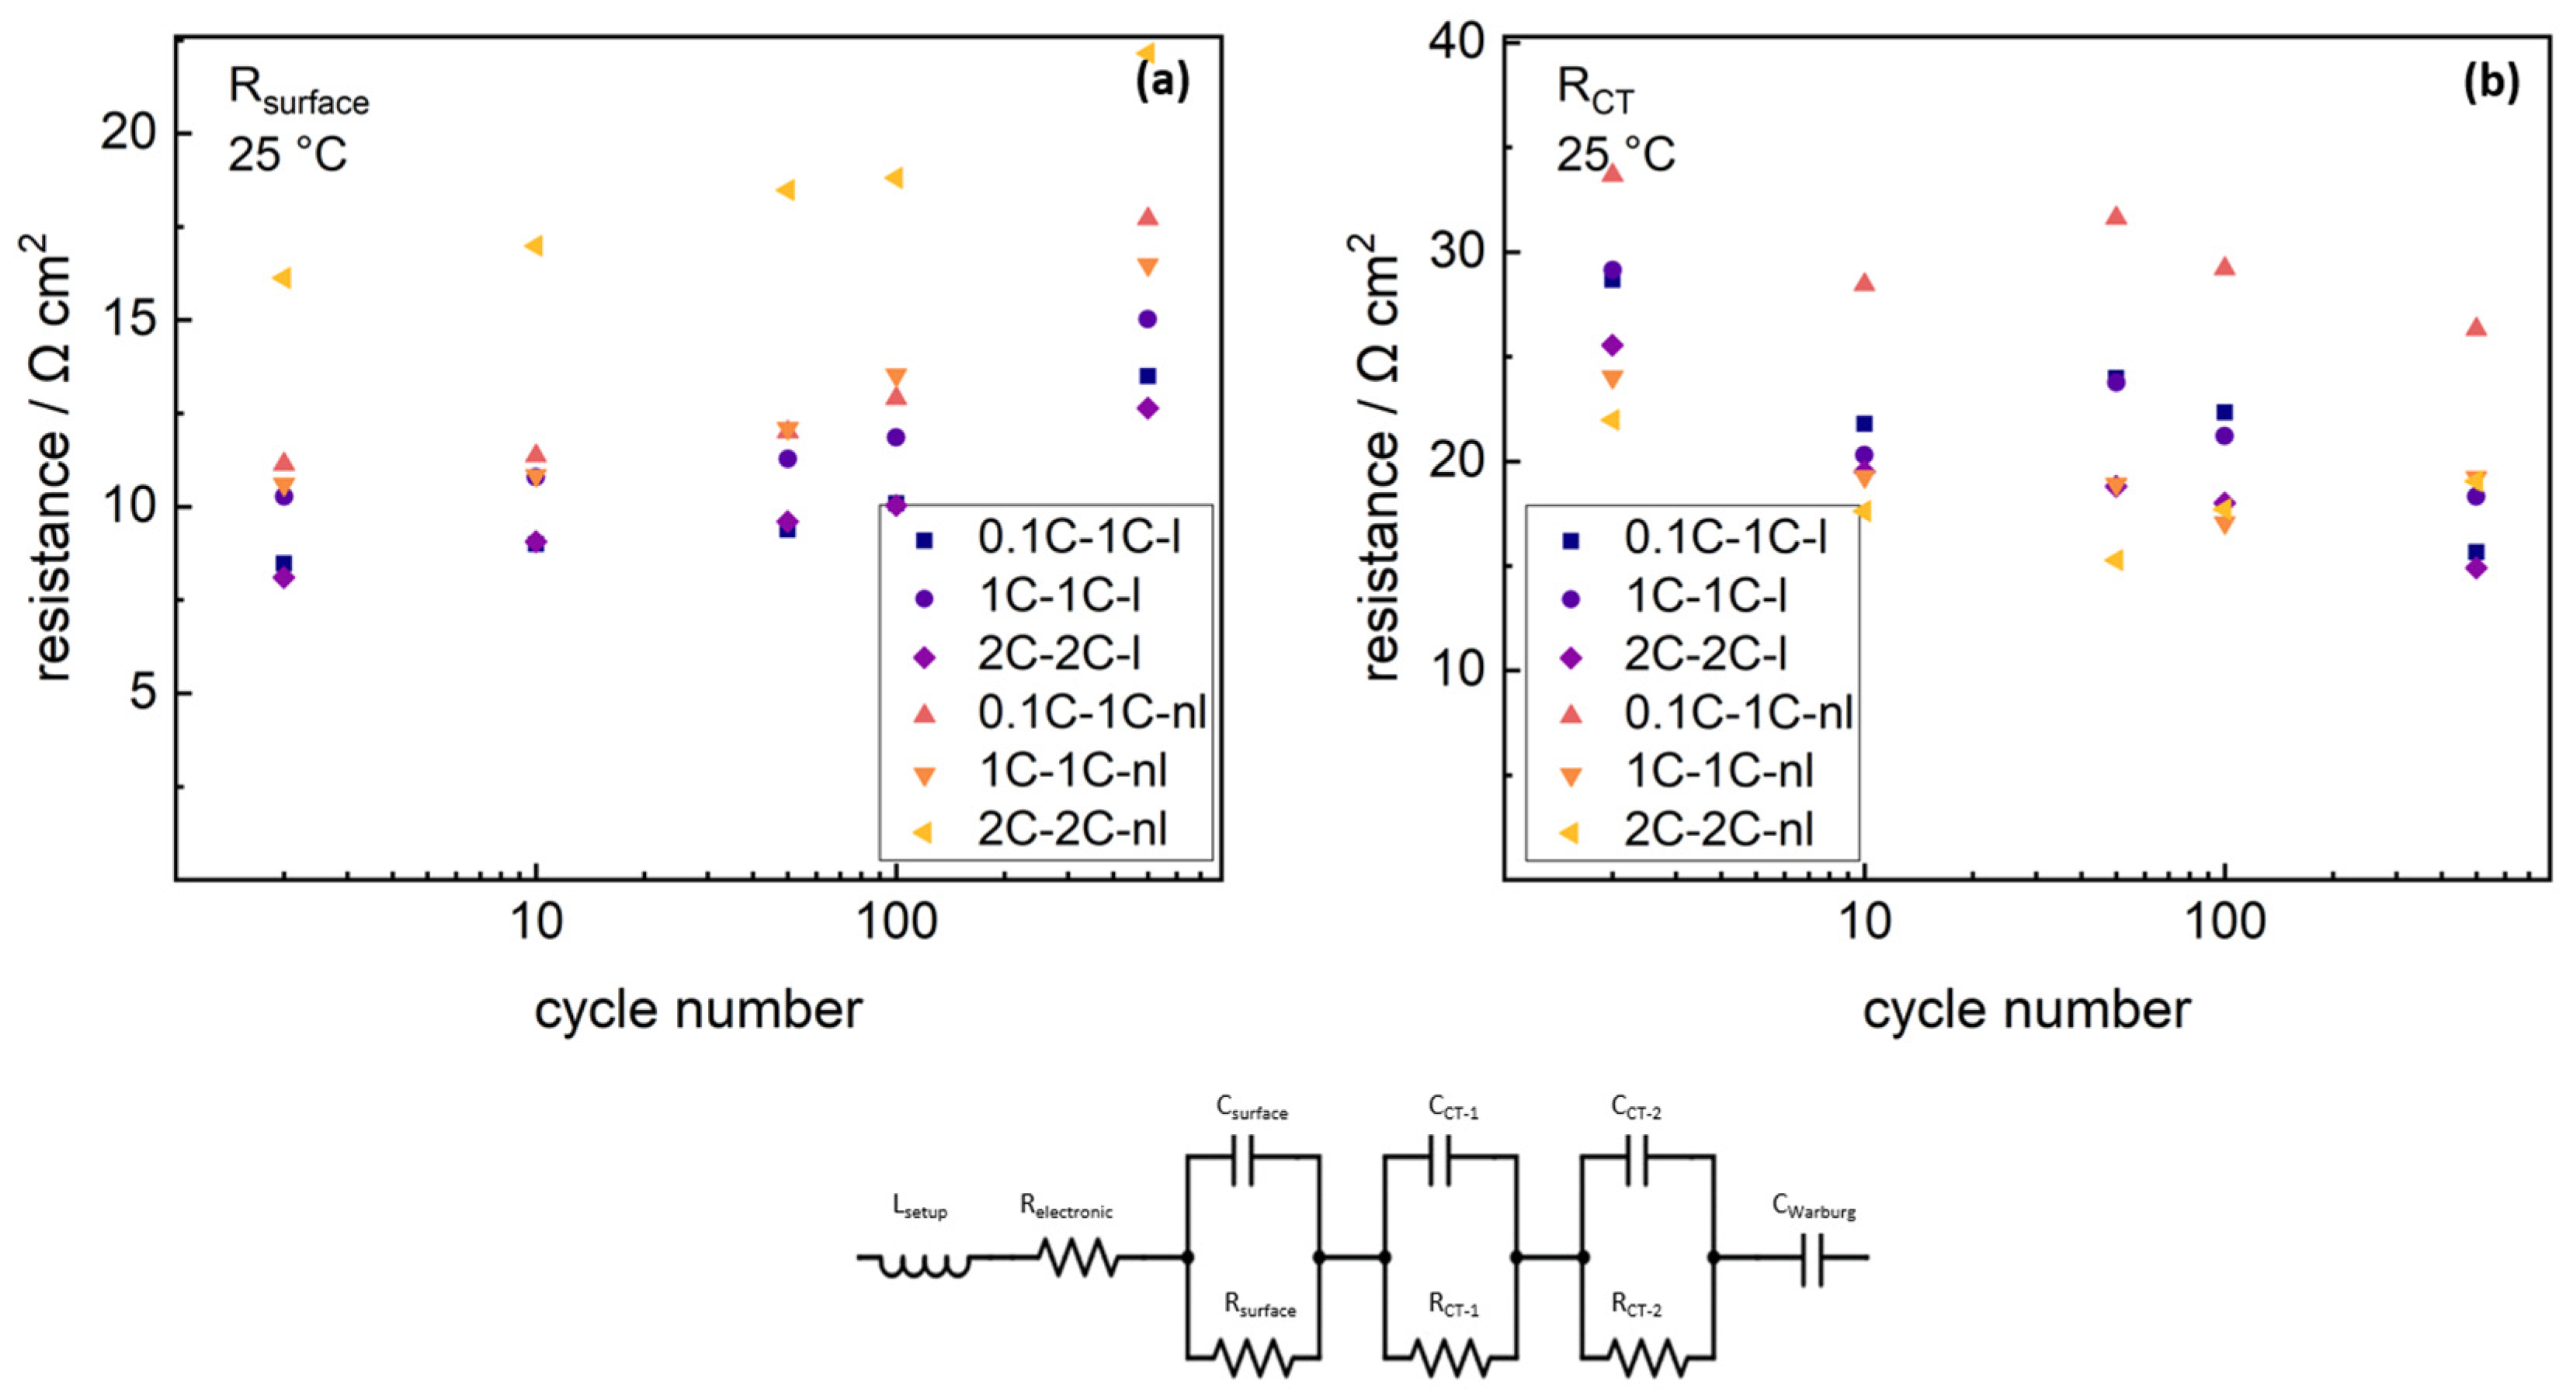
Due to strong overlapping of graphite charge–transfer semicircle and NMC charge–transfer semicircle, only the sum of both charge–transfer resistances can be detected precisely. The charge–transfer resistance revealed no clear trend with cycling for any cell. The capacitance fit parameters for graphite semicircles, NMC charge–transfer semicircles and surface resistance semicircle are shown in the
supplementary materials. Laminated cells show reduced surface resistances (≈8 Ω·cm
2, ≈10 Ω·cm
2 and ≈8 Ω·cm
2) after 2 cycles for all formation rates (0.1C, 1C and 2C), compared to non-laminated cells (≈11 Ω·cm
2, ≈11 Ω·cm
2 and ≈6 Ω·cm
2), which was shown to arise from cathode optimization effects by the lamination technique [
39]. The surface resistance increased with cycling for all cells. As the starting condition of the surface resistance was purely defined on cathode porosity and cathode contact situation aspects, valid information on aging phenomena along cycling can only be extracted from the normalized surface resistance. Therefore, surface resistance trends were normalized to changes from the starting value after 2 cycles. Comparison of the normalized surface resistance trends and discharge capacity trends of the respective cells, are shown in
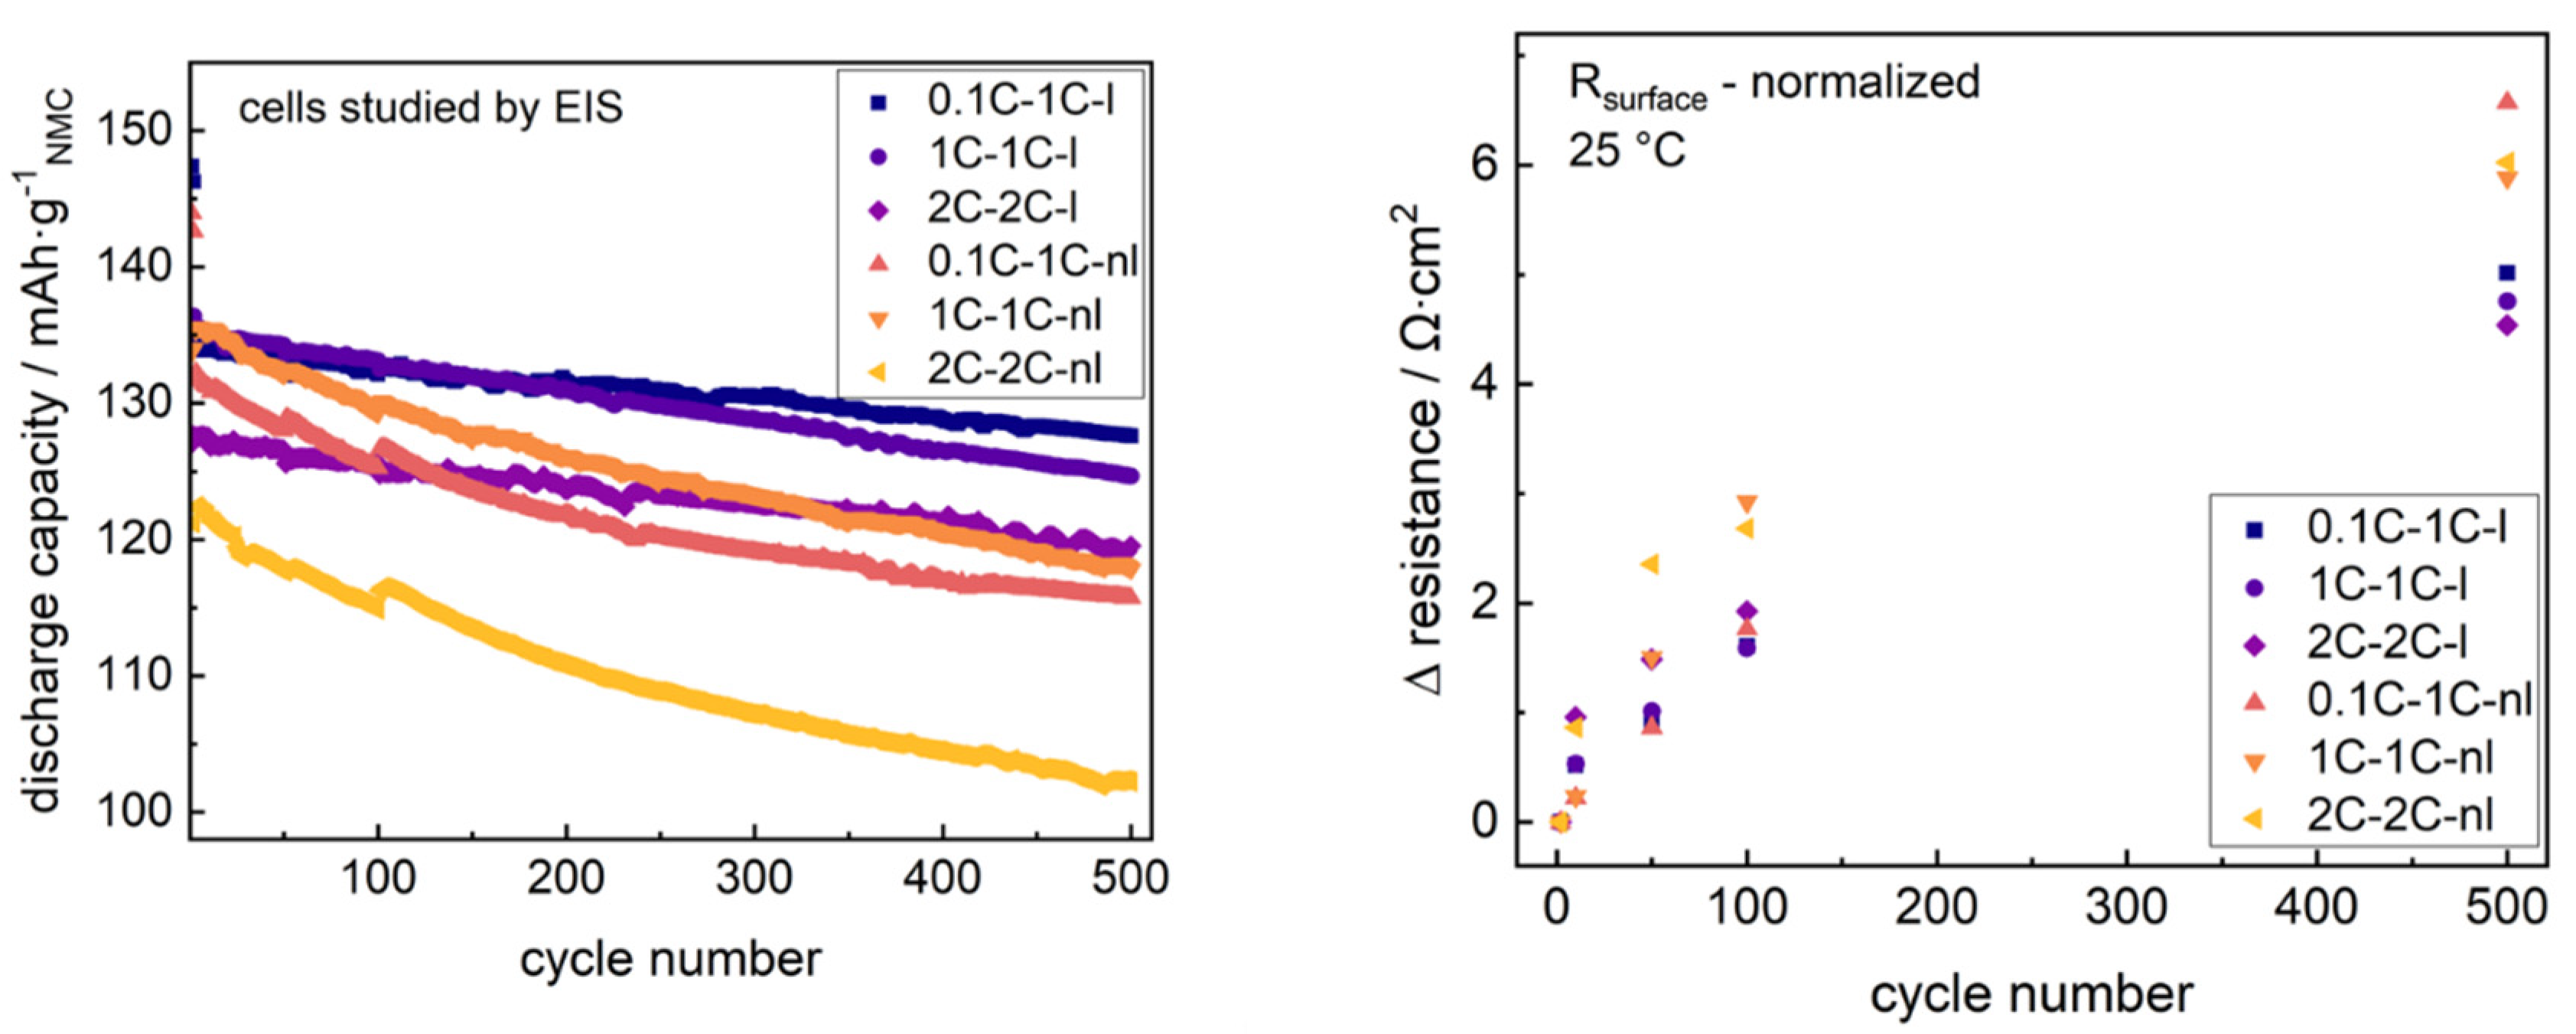
Figure 8.
Both non-laminated cells cycled at 1C reveal similar capacity-fade, reaching 88.2% (0.1C formation) and 87.1% (1C formation), respectively, of the maximum capacity after 500 cycles. The cell formed and cycled at 2C dropped to 84.0%. The substantial capacity fading clearly correlated to the increase in surface resistance of +6.5 Ω·cm2 (0.1C formation, 1C cycling), +5.8 Ω·cm2 (1C formation, 1C cycling) and +6.0 Ω·cm2 (2C formation, 2C cycling) after 500 cycles.
Laminated cells reduce the capacity-fade losses for all formation and cycling rates, revealing 95.2% (0.1C formation, 1C cycling), 92.2% (1C formation, 1C cycling) and 93.8% (2C formation, 2C cycling) remaining capacity after 500 cycles for the studied formation rates and cycling rates. The surface resistance increased (+5.0 Ω·cm2, +4.7 Ω·cm2, +4.5 Ω·cm2) and was lowered for the laminated cells at the respective formation and cycling modes.
As is well known from the literature, the surface resistance changes along cycling reflect both SEI growth as well as further surface resistance aspects like electrode–current collector contacts [
43], without further setup normalization like cathode lamination [
39], temperature decrease [
44] or the introduction of reference electrodes [
45,
46]. As found from the NDP studies, the SEI growth in superior anode fractions was similar for all formation and cycling rates both in non-laminated and laminated state. This clearly indicates the reduction in capacity-fade of laminated cells at fast-formation, to arise either from non-homogenous SEI growth or further surface resistance impacts like reduced electrode delamination effects.
3. Materials and Methods
3.1. Materials
For assembly of both cathodes and anodes, commercially available battery grade LiNi1/3Mn1/3Co1/3O2 (NM-3102h, BASF TODA America, Battle Creek, USA) and graphite (MAGE3, HITACHI CHEMICAL, Sakuragawa, Japan) were used as active materials, with polyvinylidene difluoride (PVDF; Solef® 5130, SOLVAY, Milan, Italy) as a binder and a series of carbonaceous conductive additives (Super C65, KS6L, SFG6L, IMERYS, Bodio, Switzerland). The solvent used was N-methyl-pyrrolidone (NMP, Overlack, Mönchengladbach, Germany). The electrolyte consisted of 1 M LiPF6 in EC:EMC 3:7 (Selectilyte LP57, BASF, Florham Park, USA) with 2 wt % VC (Vinylene Carbonate E, BASF) were used as electrolyte components. For the pouch cell setup, a self-standing inorganic filled alumina/PVDF-HFP separator (67:33) was stacked with the electrodes. An aluminum foil (20 µm, GELON LIB, Hong Kong, China) and a copper foil (15 µm, GELON LIB) served as current collectors for cathodes and anodes, respectively. All materials were used as received.
3.2. Electrode Preparation
Anode slurries were processed by blending graphite (MAGE3, 90 wt %), binder polymer (PVDF, 7 wt %), carbon black (Super C65, 2 wt %) and conductive graphite (SFG6L, 1 wt %) with NMP to have a solid content of 46 wt %. Processing of cathode slurries was done by mixing the active material (NMC 111, 93 wt %), binder (PVDF, 3 wt %), carbon black (Super C65, 3 wt %) and conductive graphite (KS6L, 1 wt %) with NMP to give a final solid content of 60 wt %. A planetary mixer (TX-2, INOUE, Isehara, Japan) was used for mixing of electrode slurries. Electrode slurries were cast onto current collectors by doctor-blade technique in a roll-to-roll process. Electrodes were dried in a two-stage drying tunnel at 135–150 °C. Active mass loadings of anode and cathode electrodes were ≈4.4 mg·cm−2 (1.57 mAh·cm−2) and ≈8.7 mg·cm−2 (1.35 mAh·cm−2), respectively. In all full cells, balancing of cathodes: anodes was ≈1:1.16.
3.3. Pouch Cell Preparation
The cathode, anode and separator were punched (5 × 8 cm
2, 5.4 × 8.4 cm
2 and 5.8 × 8.8 cm
2) and stacked to form single cells in the pouch cell configuration; the setup was described in detail in our previous studies [
38,
39]. For the fully laminated condition, cathode-separator-anode stacks were additionally laminated into single stacks by using a roll laminator (BLE 282 D, MANZ Italy, Bologna, Italy) with a line force of 157 N·cm
−1, roll speed at 1.4 m·min
−1 and temperatures within 100–120 °C. The stacks were partially sealed in pouch foil and dried under vacuum at 110 °C for 12 h. In an argon filled glovebox (MB20, H
2O and O
2 content <0.1 ppm, MBraun, Garching, Germany) all single cell stacks were filled with a 1000 µL electrolyte before vacuum sealing. Cells rested at room temperature for 24 h before formation.
3.4. Electrochemical Characterization
Charge/discharge cycles were performed with a battery test system (CTS-LAB, BaSyTec, Asselfingen, Germany), using the constant current (CC) and constant voltage (CV; until the current dropped below 0.05C rate) modes for the charging step and CC-mode for the discharge step. The voltage range was adjusted to 3.0 V–4.2 V. C-rates for formation and aging cycles were calculated according to the NMC weight in the cell, using the nominal NMC capacity of 155 mAh·g−1, given by the supplier.
The error bars in the NDP spectra were derived from the systematic uncertainties of the setup and the calibration, as well as the statistical uncertainties of the measurement using the common rules of error propagation. For cycling studies, at least 3 cells for each formation rate and cycling rate were studied for 500 cycles, in addition to cells stopped at lower cycle numbers for post-mortem analysis. Indicated error bars represent the standard deviation between these cells. Separate cell sets were prepared and studied via EIS.
All EIS measurements were controlled by a potentiostat (PGSTAT204, Metrohm Autolab, Filderstadt, Germany) in a climate chamber (INCU-Line® IL 68R, VWR, Ismaning, Germany) at a constant temperature of 25 °C. EIS analysis along cycling was performed by charging the cells up to 3.6 V/3.7 V/3.8 V depending on the current C-rate 0.1C/1C/2C, followed by a controlled relaxation time of 2 h in open circuit voltage previous to each EIS measurement. EIS measurements were done in the potentiostatic mode in a frequency range of 50 kHz–10 mHz and an adjusted amplitude of 10 mVrms. Data fitting was performed using Z-fit implemented in the BT-Lab software (BT-Lab V1.55, BioLogic SAS via GAMEC, Illingen, Germany).
3.5. Post-Mortem Anode Characterization
For preparation of the post-mortem analysis, pouch cells were opened and disassembled in an argon filled glovebox. For laminated stacks, only the cathode was pulled off the anode-separator stack, for non-laminated stacks, the graphite anode was directly extracted. All extracted anode/anode-separator samples were rinsed using EMC and subsequently dried under argon atmosphere in order to remove lithium residuals from the electrolyte. For NDP measurements, circular samples with a diameter of 14 mm were punched out from the central parts of the anode sheets. The anode/anode-separator samples were studied at the N4DP setup at the PGAA facility of the Heinz Maier-Leibnitz Zentrum (MLZ) in Garching, Germany [
28,
29,
40,
47]. The anode/anode-separator samples were assembled in a vacuum chamber (10
−5 mbar) facing the collimated cold neutron beam (12.6 mm
2, 3 × 10
9 ncm
−2·s
−1) at an angle of 45°. The cold neutron beam was adjusted to hit central parts of the anode/anode-separator samples; details on the specialized NDP setup and the specialized electrode sample holder were described in previous studies [
29,
40]. Each sample was individually measured for 15 min. A nominal 7.5 µm thick Kapton
® separation foil (DuPont, Wilmington, USA) was used to suppress signals from
4He particles of the
6Li(n,
3H)
4He reaction.

 ,
, 


