Article

Energy Management of a DC Microgrid Composed of Photovoltaic/Fuel Cell/Battery/Supercapacitor Systems

1
Faculty of postgraduate studies for Advanced Sciences, Beni-Suef University, Beni Suef 62511, Egypt
2
College of Engineering at Wadi Addawaser, Prince Sattam bin Abdulaziz University, Alkharj 11942, Saudi Arabia
3
Electrical Engineering Department, Faculty of Engineering, Minia University, Minia 61519, Egypt
4
Electrical Department, Faculty of Engineering, Beni-Suef University, Beni Suef 62511, Egypt
*
Author to whom correspondence should be addressed.
Batteries 2019, 5(3), 63; https://doi.org/10.3390/batteries5030063
Submission received: 26 June 2019 / Revised: 9 August 2019 / Accepted: 10 September 2019 / Published: 19 September 2019
(This article belongs to the Special Issue Electrochemical Capacitors)

Abstract

:
In this paper, a classic proportional–integral (PI) control strategy as an energy management strategy (EMS) and a microgrid stand-alone power system configuration are proposed to work independently out of grid. The proposed system combines photovoltaics (PVs), fuel cells (FCs), batteries, and supercapacitors (SCs). The system supplies a dump load with its demand power. The system includes DC/DC and DC/AC converters, as well as a maximum power point tracking (MPPT) to maximize the harvested energy from PV array. The system advantages are represented to overcome the problem of each source when used individually and to optimize the hydrogen consumption. The classic PI control strategy is used to control the main system parameters like FC current and the state-of-charge (SOC) for the battery and SC. In order to analyze and monitor the system, it was implemented in the MATLAB/Simulink. The simulation done for fuzzy logic and high frequency decoupling and state machine control strategies to validate the PI classic control strategy. The obtained results confirmed that the system works efficiently as a microgrid system. The results show that the SOC for the battery is kept between 56 and 65.4%, which is considered a proper value for such types of batteries. The DC bus voltage (VDC) is kept within the acceptable level. Moreover, the H2 fuel consumption is 12.1 gm, as the FCs are used as supported sources working with the PV. A big area for improvement is available for cost saving, which suggests the need for further research through system optimization and employing different control strategies.

Graphical Abstract

1. Introduction

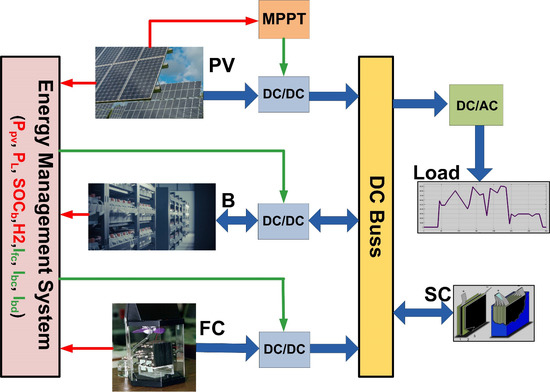
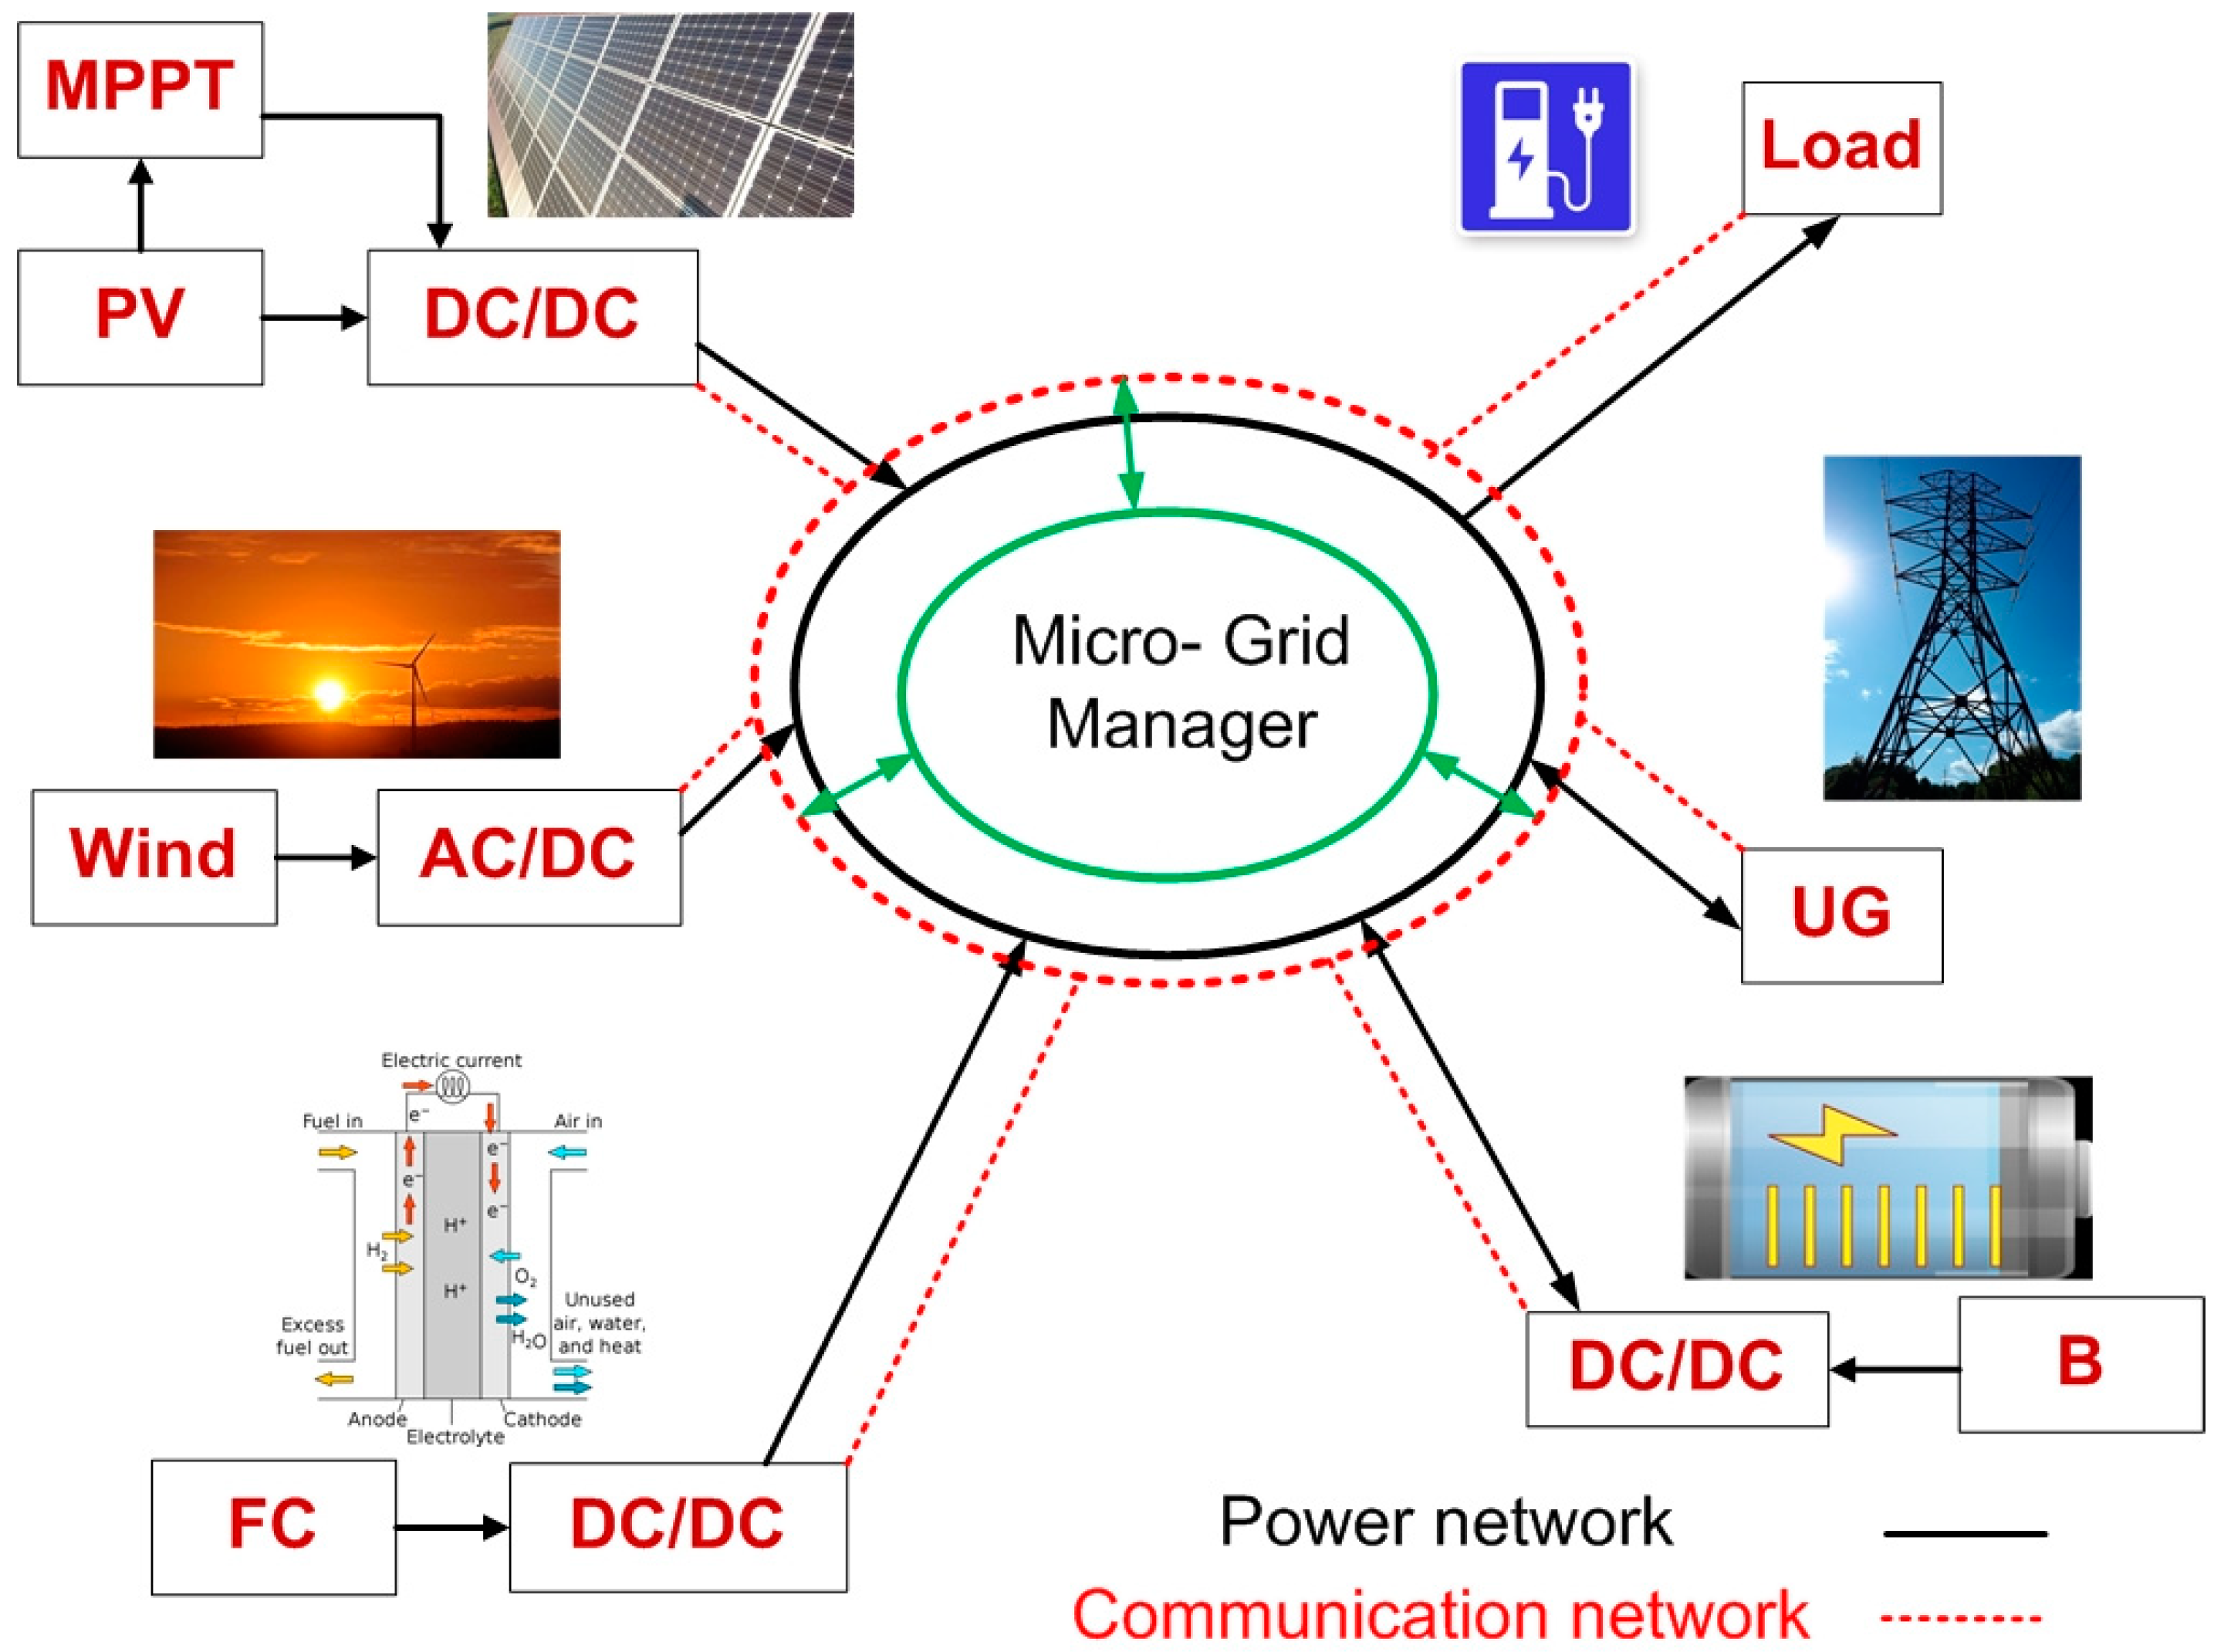
In power system grids, the microgrid is identified as a distributed energy system (DES), including generators, energy storage elements like batteries (B) and supercapacitors to balance the generated power and the consumed power [1,2,3], an energy management system to control the entire operation of the microgrid sources [4,5], and load. All of these items are combined together and work in parallel with the utility grid, or out of grid as a stand-alone system used for a small area and few consumers [6,7]. Generally, the microgrid is considered a cluster of the utility grid [8], as shown in Figure 1. Using a utility grid for power distribution has some disadvantages, such as transmission losses, especially when the generating plants are far away from the consumers, bad environmental impact because of emission, and climate change due to the use of conventional resources in the generation phase. Microgrids represent an alternative option that has the potential to overcome these problems. Microgrids can minimize power losses through transmission, reduce CO2 emissions, and limit climate change, especially when using renewable energy resources in electricity generation. It also saves money in several ways, such as preventing outage, selling electricity to national grids through feed, and tariff or net metering systems. Using power systems that combine renewable sources with zero emission besides energy storage elements makes the system able to achieve maximum efficiency compared to systems containing conventional sources [9,10,11]. An energy management system is a system that controls the operation of the microgrid (MG) system. It uses many approaches and control strategies to get maximum system performance. These control strategies may include a state machine, a classic proportional–integral (PI) control, a fuzzy logic control, an external energy maximization, an equivalent minimization, and a frequency decoupling control strategy [12].
Manoj et al. [13] discussed the two main types of MG: Alternative current microgrid (ACMG) and direct current microgrid (DCMG). The DCMG has some advantages over the ACMG, such as high efficiency, easy connection on the DC bus, and system reliabilities. They confirmed that in DCMGs, there are three factors influencing power disturbance: Fluctuation of power exchange, power variation between the storage system and the power sources, and the fast change in the DC bus load. Ravichandrudu et al. [14] designed an MG system using renewable sources, which has the benefits of utilizing renewable energy sources and reducing transmission losses when using wind and hydro. The proposed microgrid system has three operation modes. Phurailatpam et al. [15] proposed a DCMG system that includes a photovoltaic (PV) power system and uses the battery as an energy storage system. The DC/DC converters were discussed, as well as the maximum power point tracking (MPPT) for the PV. The system performance at constant and variable values for irradiance, wind speed, and load was monitored and analyzed. The simulation results showed that the system maintained the DC bus voltage at constant value, which confirmed the advantages of the DCMG compared with the ACMG. Elsied et al. [16] proposed a novel energy management strategy based on binary particle swarm optimization (BPSO) to optimize the performance of the MG, maximize the micro grid power, and decrease the system CO2 emissions. The system was supported by an experimental lab test. The obtained results proved that the BPSO is efficient when used with the MG. For a DCMG hybrid system, Garita et al. [17] examined the efficiency of an energy management strategy (EMS) used in a DCMG configuration containing a PV and a battery integrated together in one unit. An energy management system was used with three main system configurations. It works through seven operation modes as power flow direction under two different case studies (OFF—grid and peak shaving) to achieve maximum system performance. In their study of DCMG, Eghtedarpour et al. [18] propose three levels of control to improve the performance of the DCMG. The first level is where no communication is required and the control is done based on the local measurements. The second level is based on a DC microgrid energy management system. The third level is the top level of control, which controls multi-microgrids. Shehata et al. [19] proposed an energy management strategy for DCMG based on a multi-agent system applied using the JADE framework, where PI controllers are used as an EMS. The interface between the multi-agent system and the MATLAB/Simulink software was done through the MACSimJX interface. An analytical solution used as a reference model supported by a numerical method was proposed by Hadj-Said et al. [20] to confirm the suitability of the proposed EMS used in parallel hybrid electric vehicles (HEV) to achieve maximum system performance. The proposed EMS was applied successfully on continuous and discrete optimization cases. Sedaghati et al. [21] discussed a PV–FC–B–SC hybrid system based on grid-connected microgrids. A control strategy called adaptive fractional fuzzy sliding mode control (AFFSMC) was used for the inverter. The fuzzy rules are designed to accurately estimate the uncertain parameters. The results showed that the proposed strategy works efficiently. When the analytical solution was applied for a certain model, such as the optimal auxiliary functions method (OAFM) proposed by Herisanu et al. [22], it was found to be a reliable and efficient tool for mechanical and electrical performance of the system. For the PV/wind hybrid system in a microgrid, the wind turbine generator is characterized by its slow response, while the PV array enjoys a fast response. If both generators are combined in one system, the voltage of the DC bus takes a long time to reach a stable condition that affects the overall system response, especially when the load is variably switching [23]. For the battery/supercapacitor hybrid system, as proposed by Vasily et al. [24], a number of the internal problems of the battery negatively affects the system’s overall performance, such as its short life cycle and its low efficiency due to the number of charging/discharging times, causing fast breakdown of the battery. For the PV/FC hybrid power system, the main problem is the efficiency of both the PV and the FC, and the low density and high initial cost of the PV arrays. Despite the concerns raised for the mentioned hybrid systems, sometimes the configuration itself cannot achieve its target, as [25], when all the system components are connected in a series and, as a result, if there is a problem in any component (PV, Electrolyzer, storage, and FC), the power production could be affected, thus impacting the system’s financial return and cost. Using the PV as a preliminary source decreases the unwanted side effects of using the FC, such as low efficiency during the operation period, high cost, unstable low generated voltage, and finally, the high ripple current linked to the output voltage which reduces the FC lifetime [26,27].
Along the same lines, a number of studies explored the same application with the same configuration; however, compared with the present paper, it was found that all the previous works that have the same components connected the SC to the DC bus through a DC/DC converter to control the charging/discharging of the SC [28,29,30]. By contrast, in the present paper, the SC has been directly connected to the DC, which has two advantages over other connection methods. The first one is reducing the cost of the system through removing one DC/DC converter, and the second advantage is the fast response of the SC to load changing. One of the important parameters for the proton exchange membrane fuel cell (PEMFC) used in this paper is that it works at low temperatures, which gives the chance to enhance its size to achieve maximum power production. The solid oxide fuel cell (SOFC) used for the hybrid system [
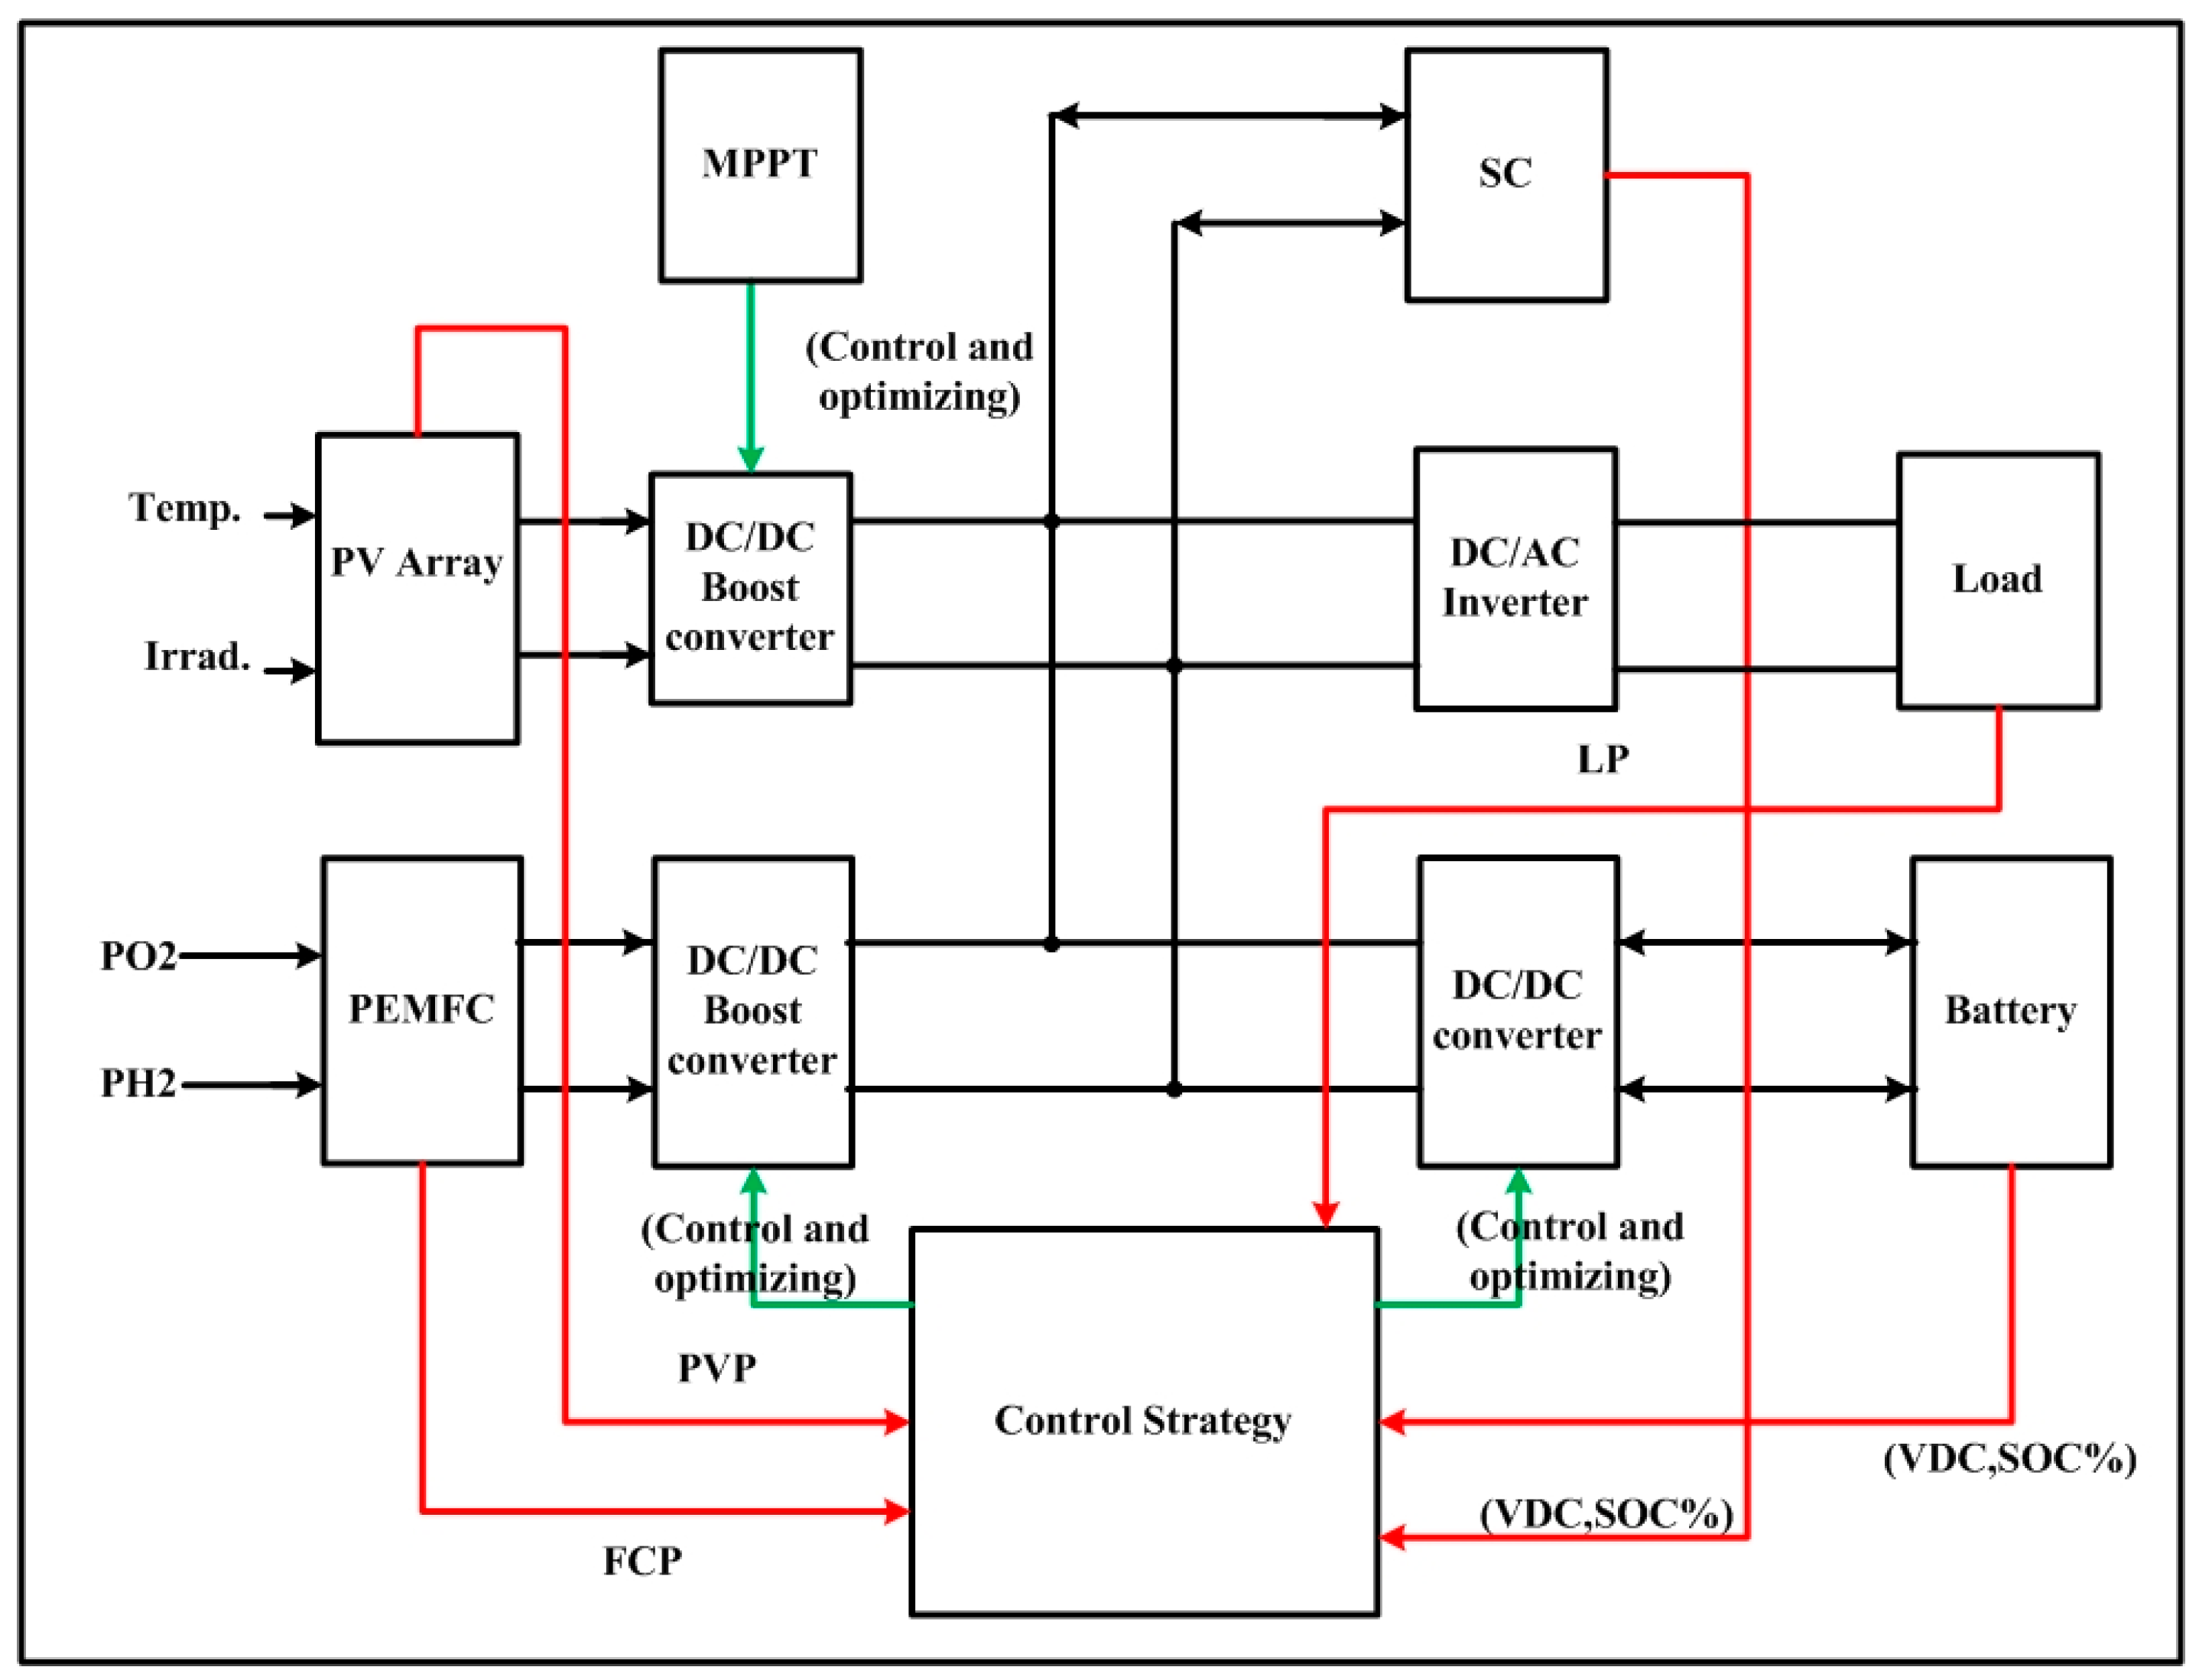
21], by contrast, needs long start-up times and requires insulation and heat dispersion due to temperature concerns. In addition, the PEMFC has higher efficiency, more fuel flexibility, smaller size as it does not require cooling or thermal dissipation, and is less expensive compared to SOFC. The main contribution of this paper is to propose an MG configuration containing PV/FC/B/SC to supply a dump AC variable load with its needed power. It also proposes a classic PI control strategy as an EMS to control the FC current and calculate the hydrogen consumed by the fuel cell. For the proposed system, the PV system decreases the FC hydrogen consumption during day light when it is available, especially in areas of high irradiance values, for a long time. It also gives a chance to increase the size of the clean power generated to decrease greenhouse gasses and global warming, which is good for the environment and climate change. Also, using a battery and a supercapacitor as storage elements gives the system an advantage over individual systems, as the specific power is low, while the specific energy is high—but the supercapacitor has a high specific power and low specific energy [31,
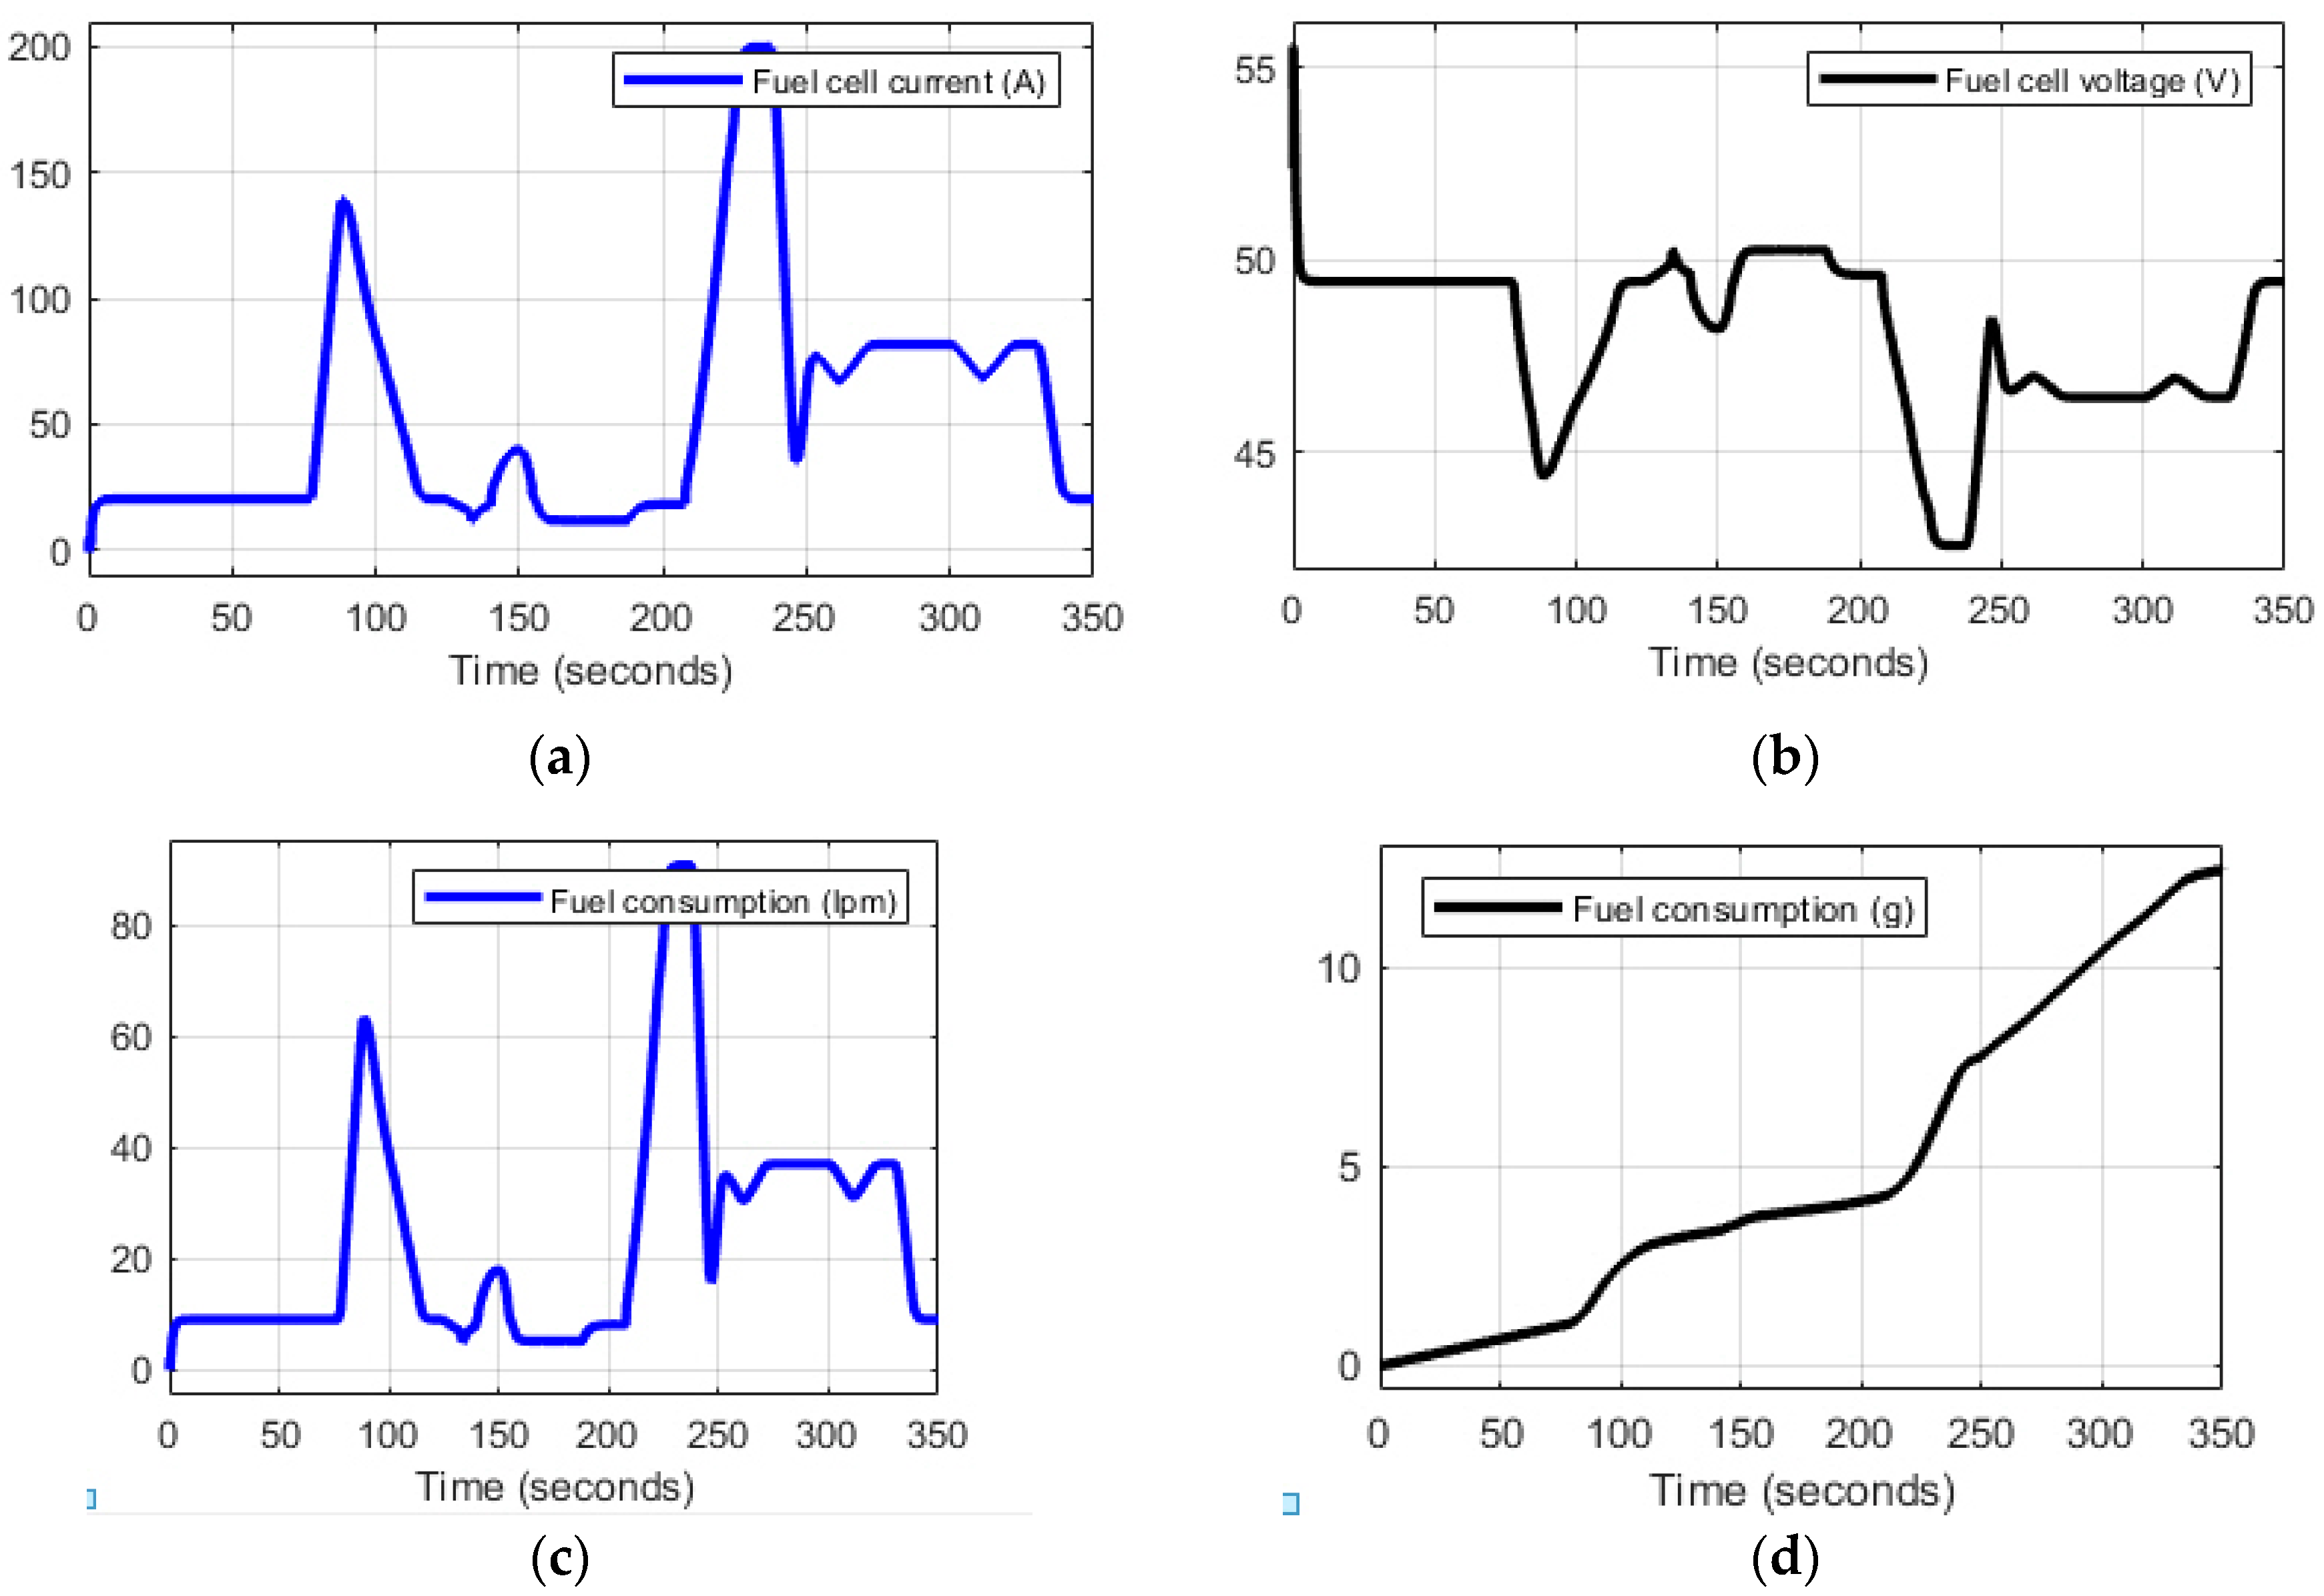
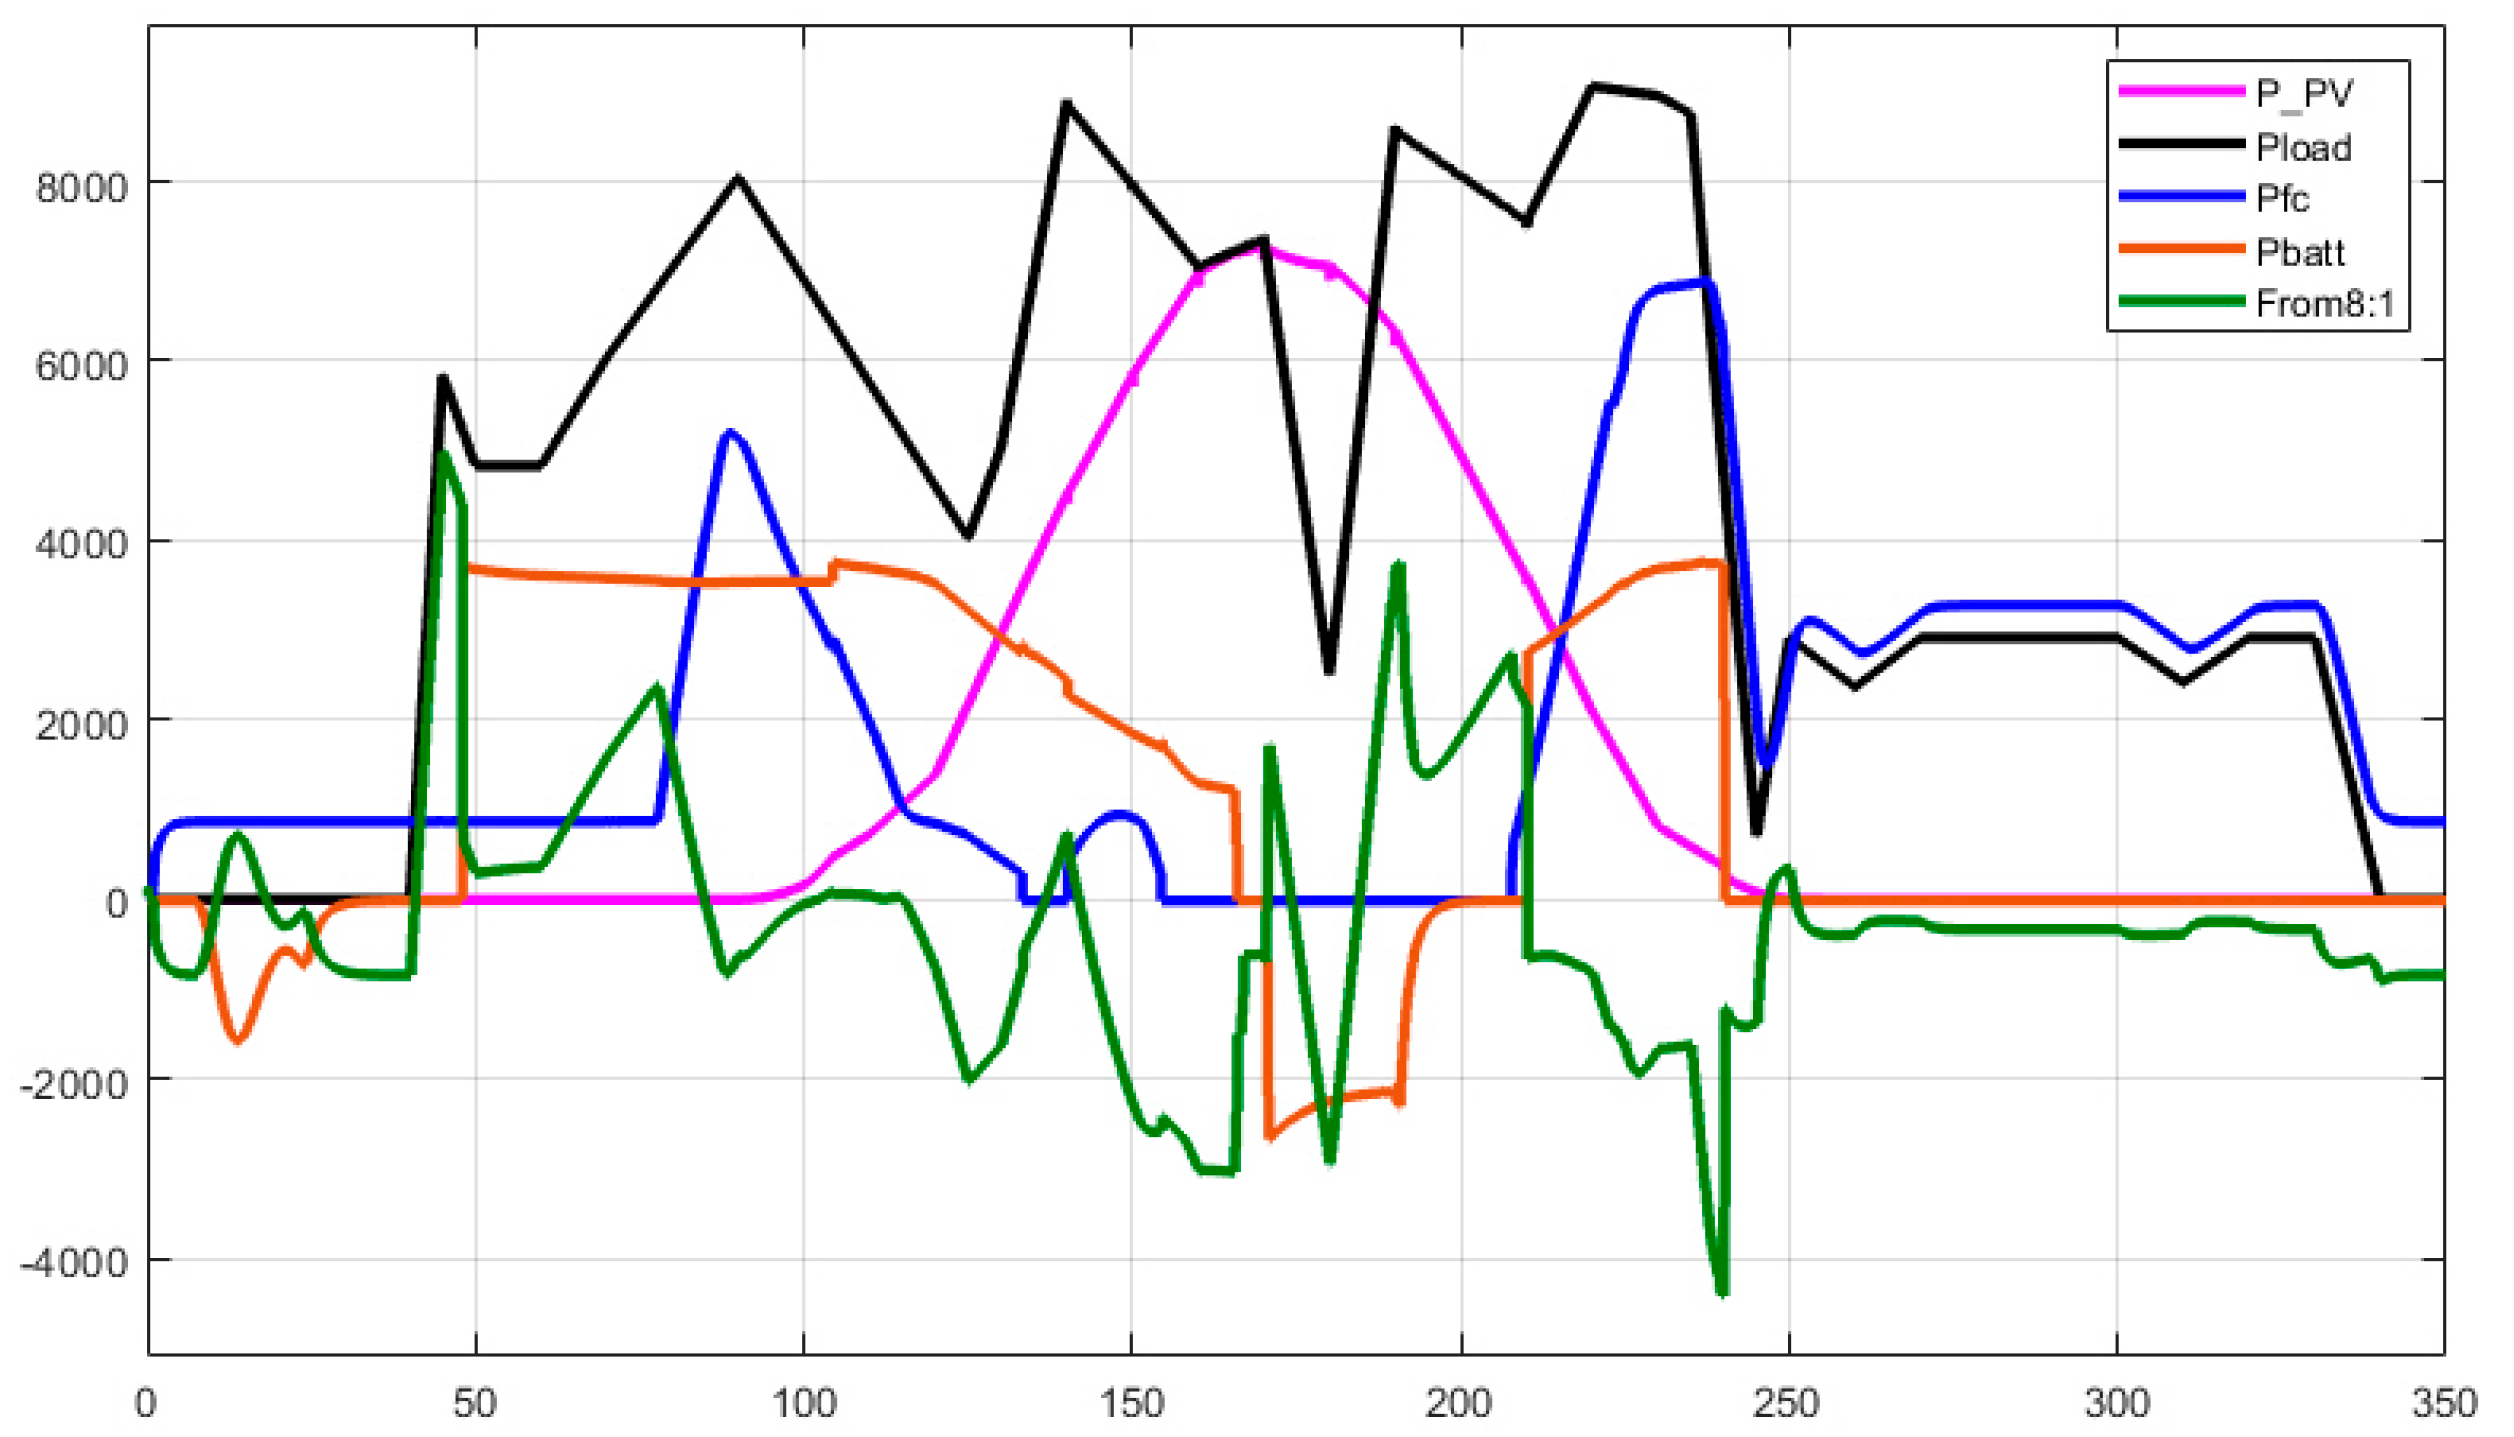
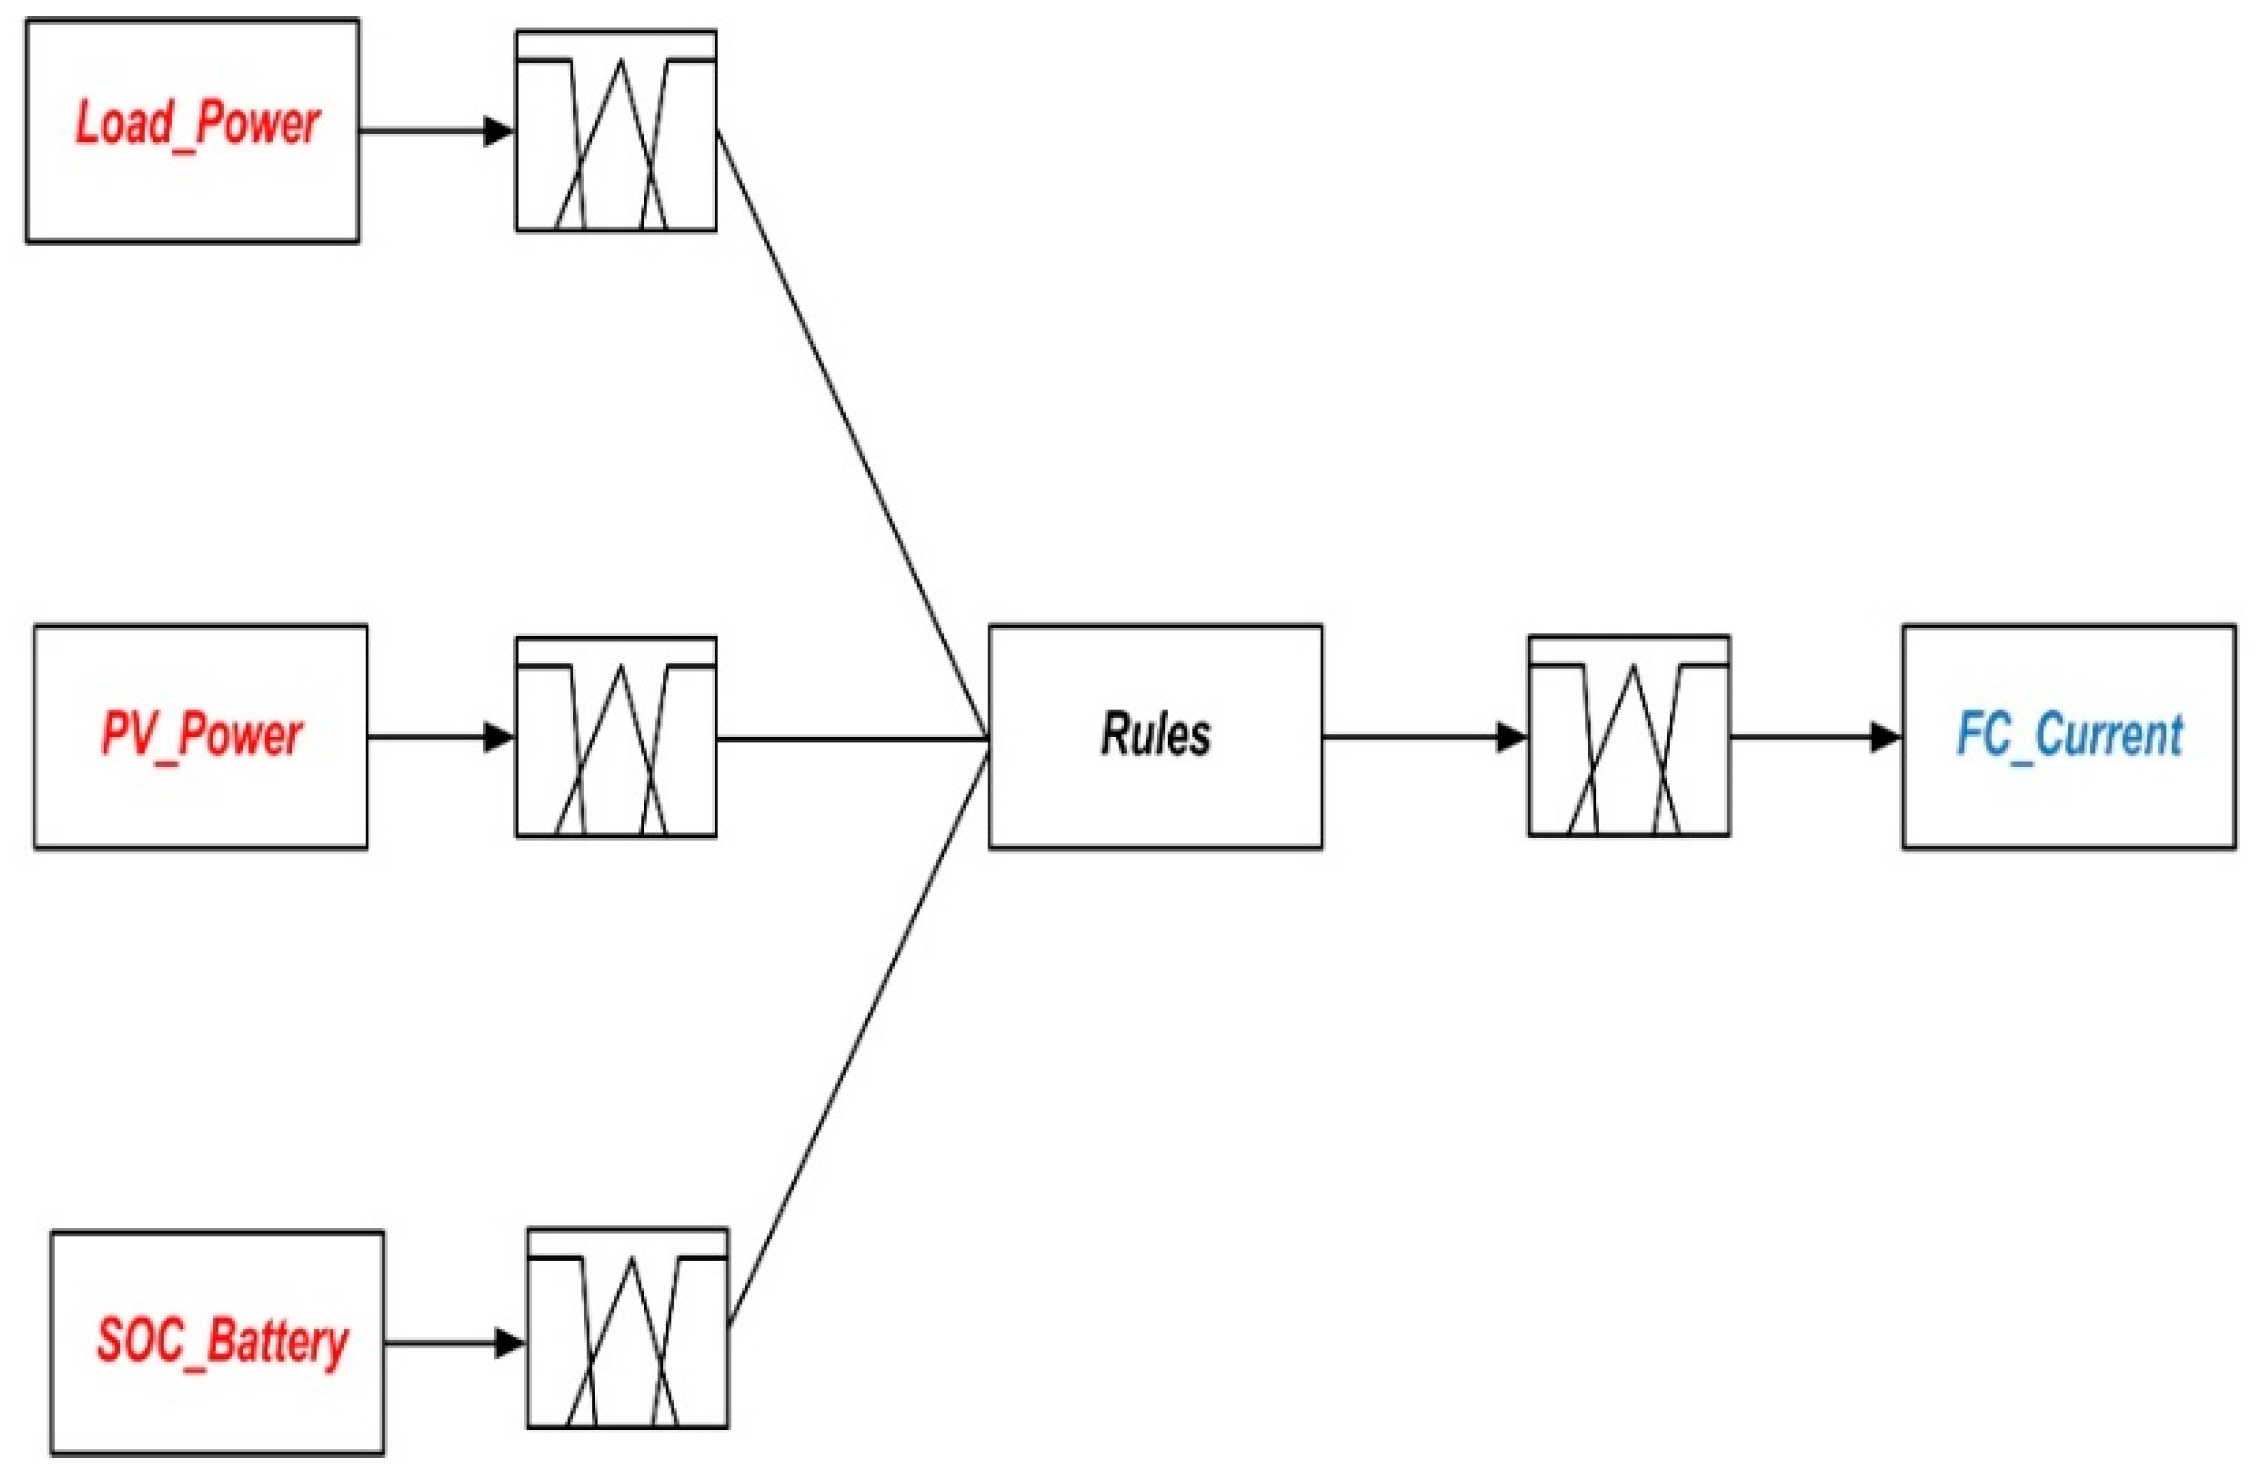
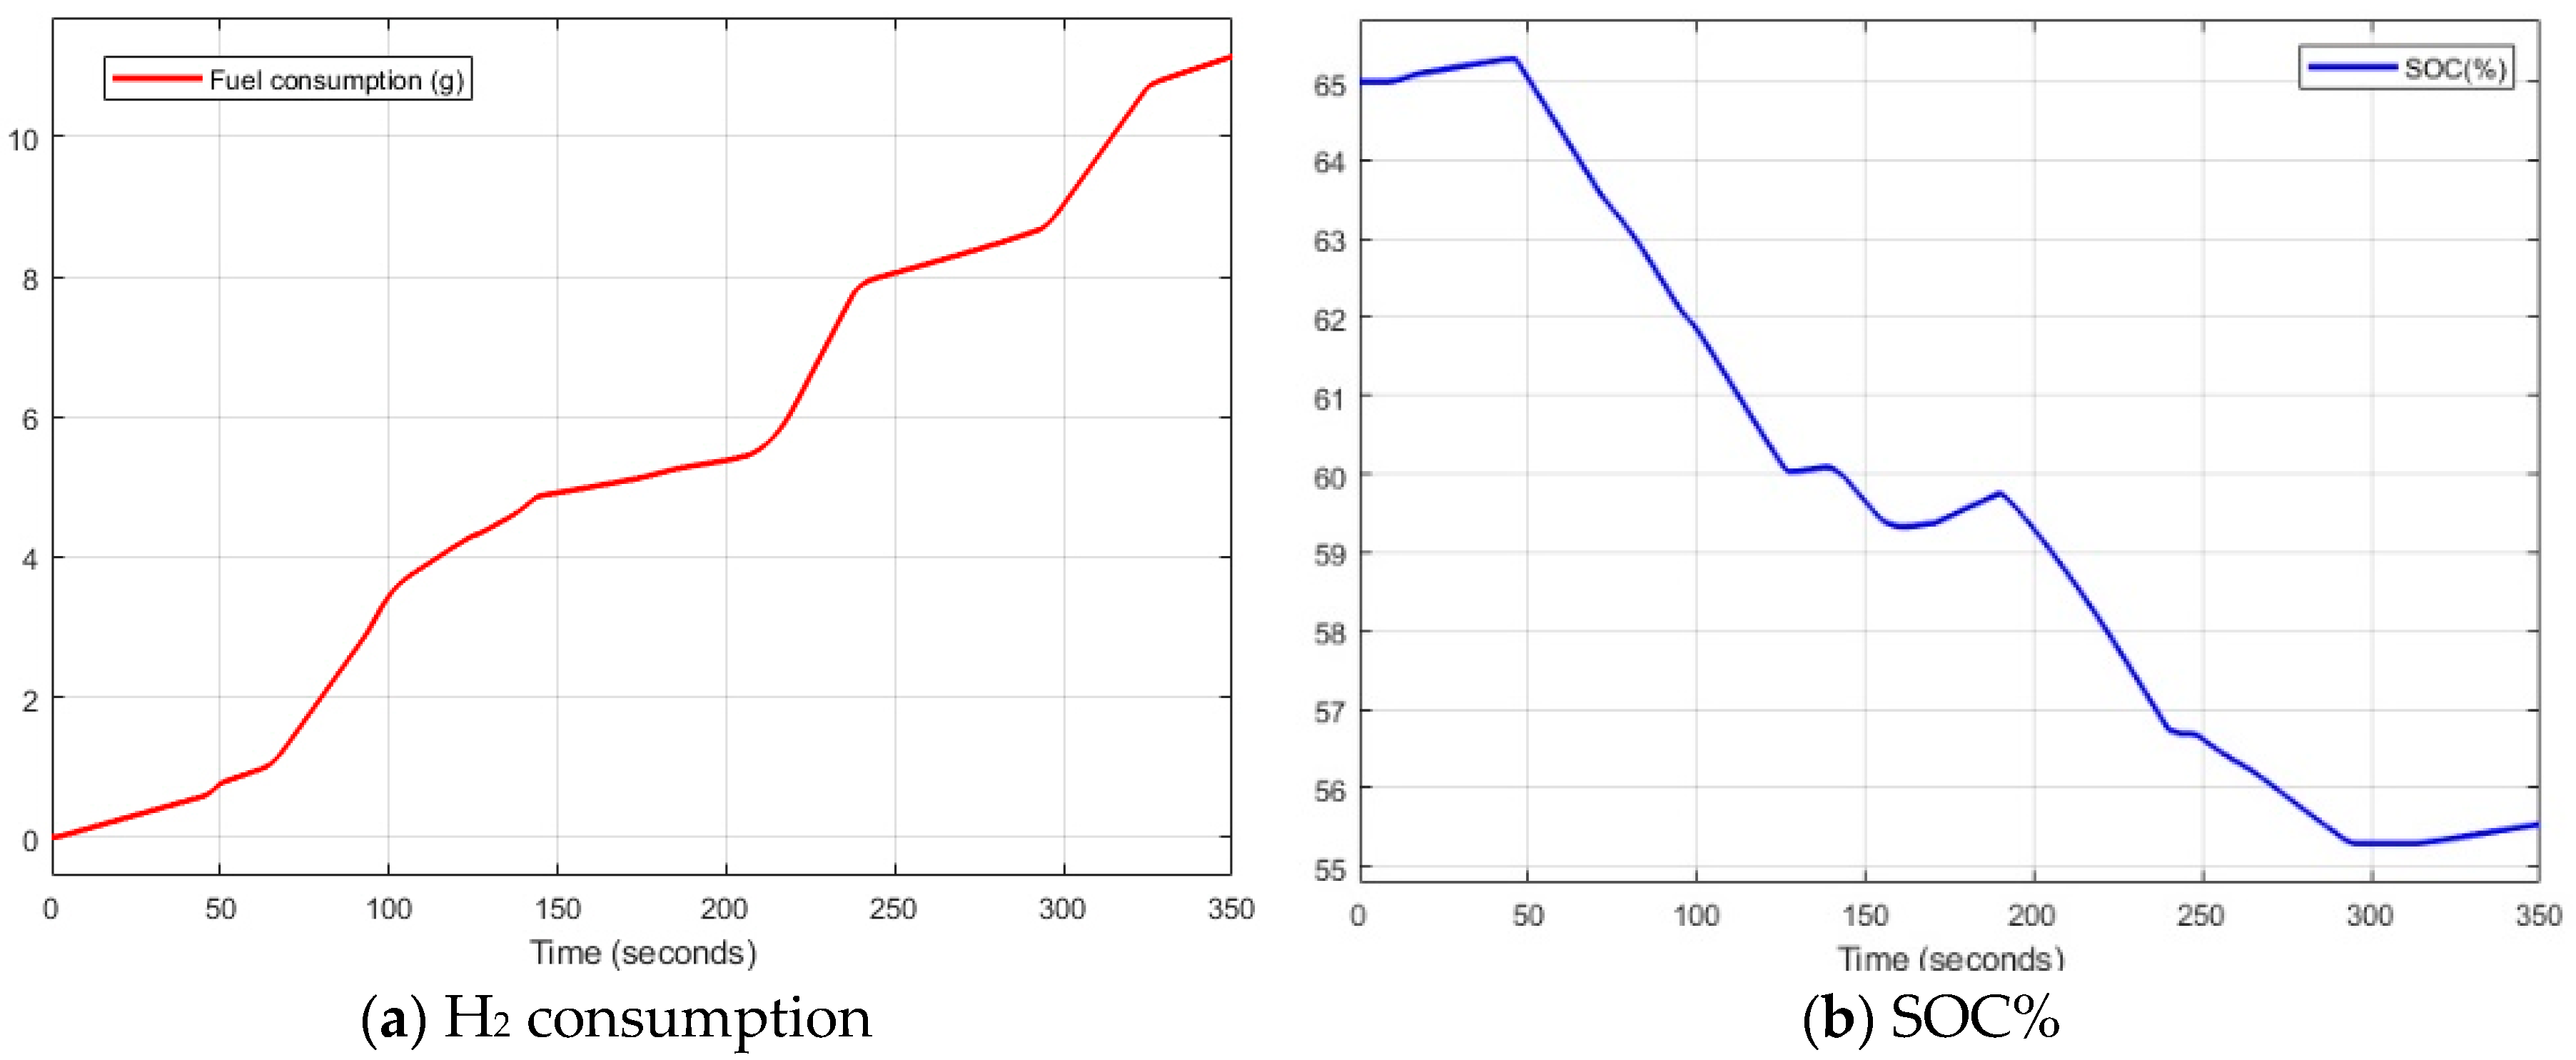
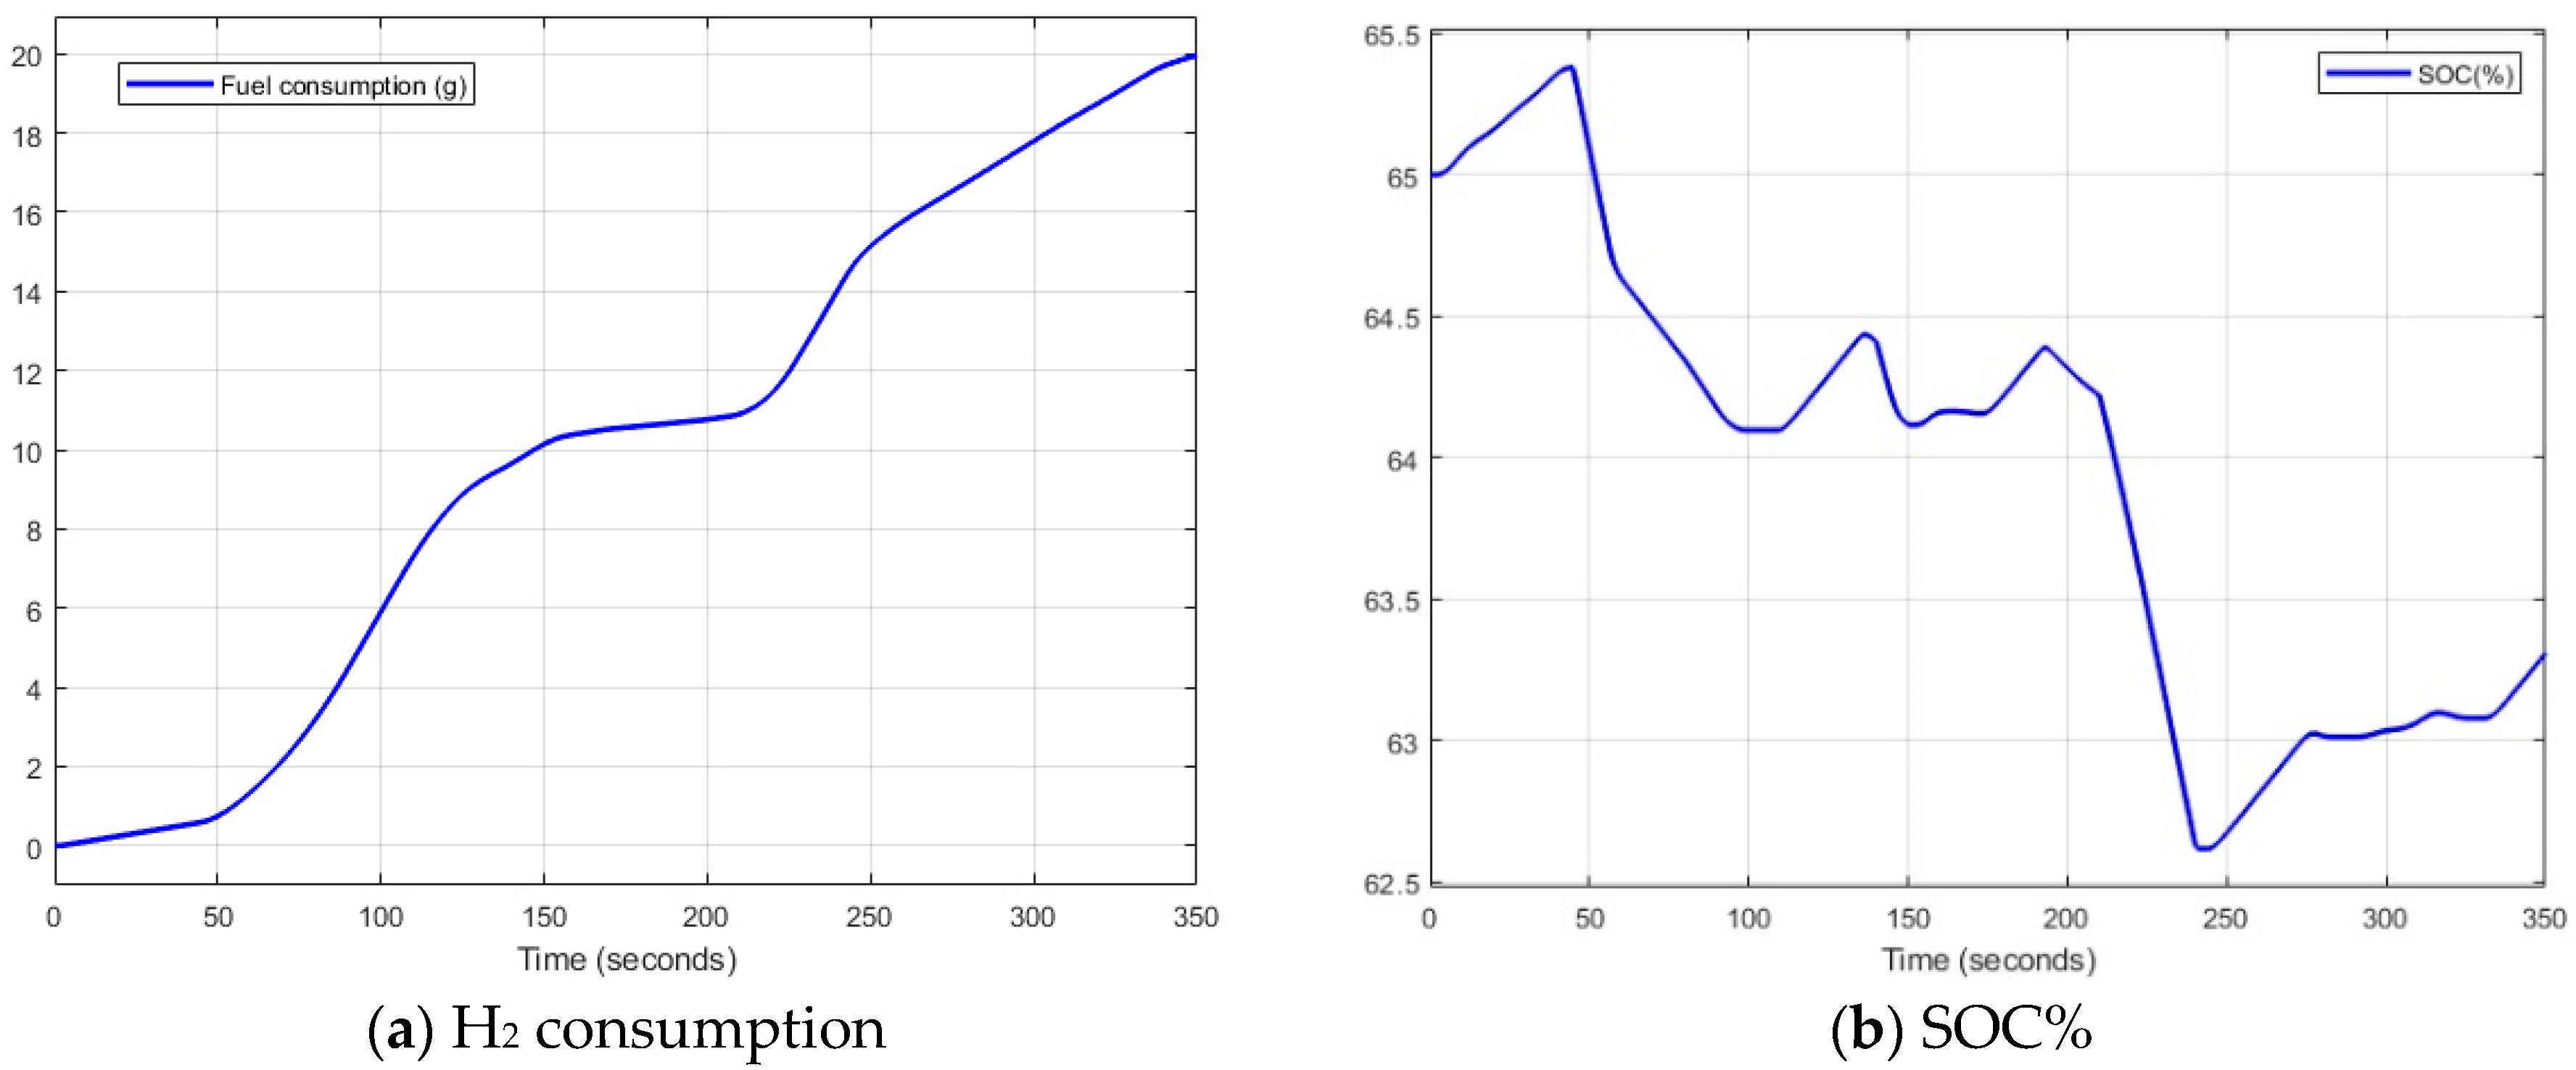
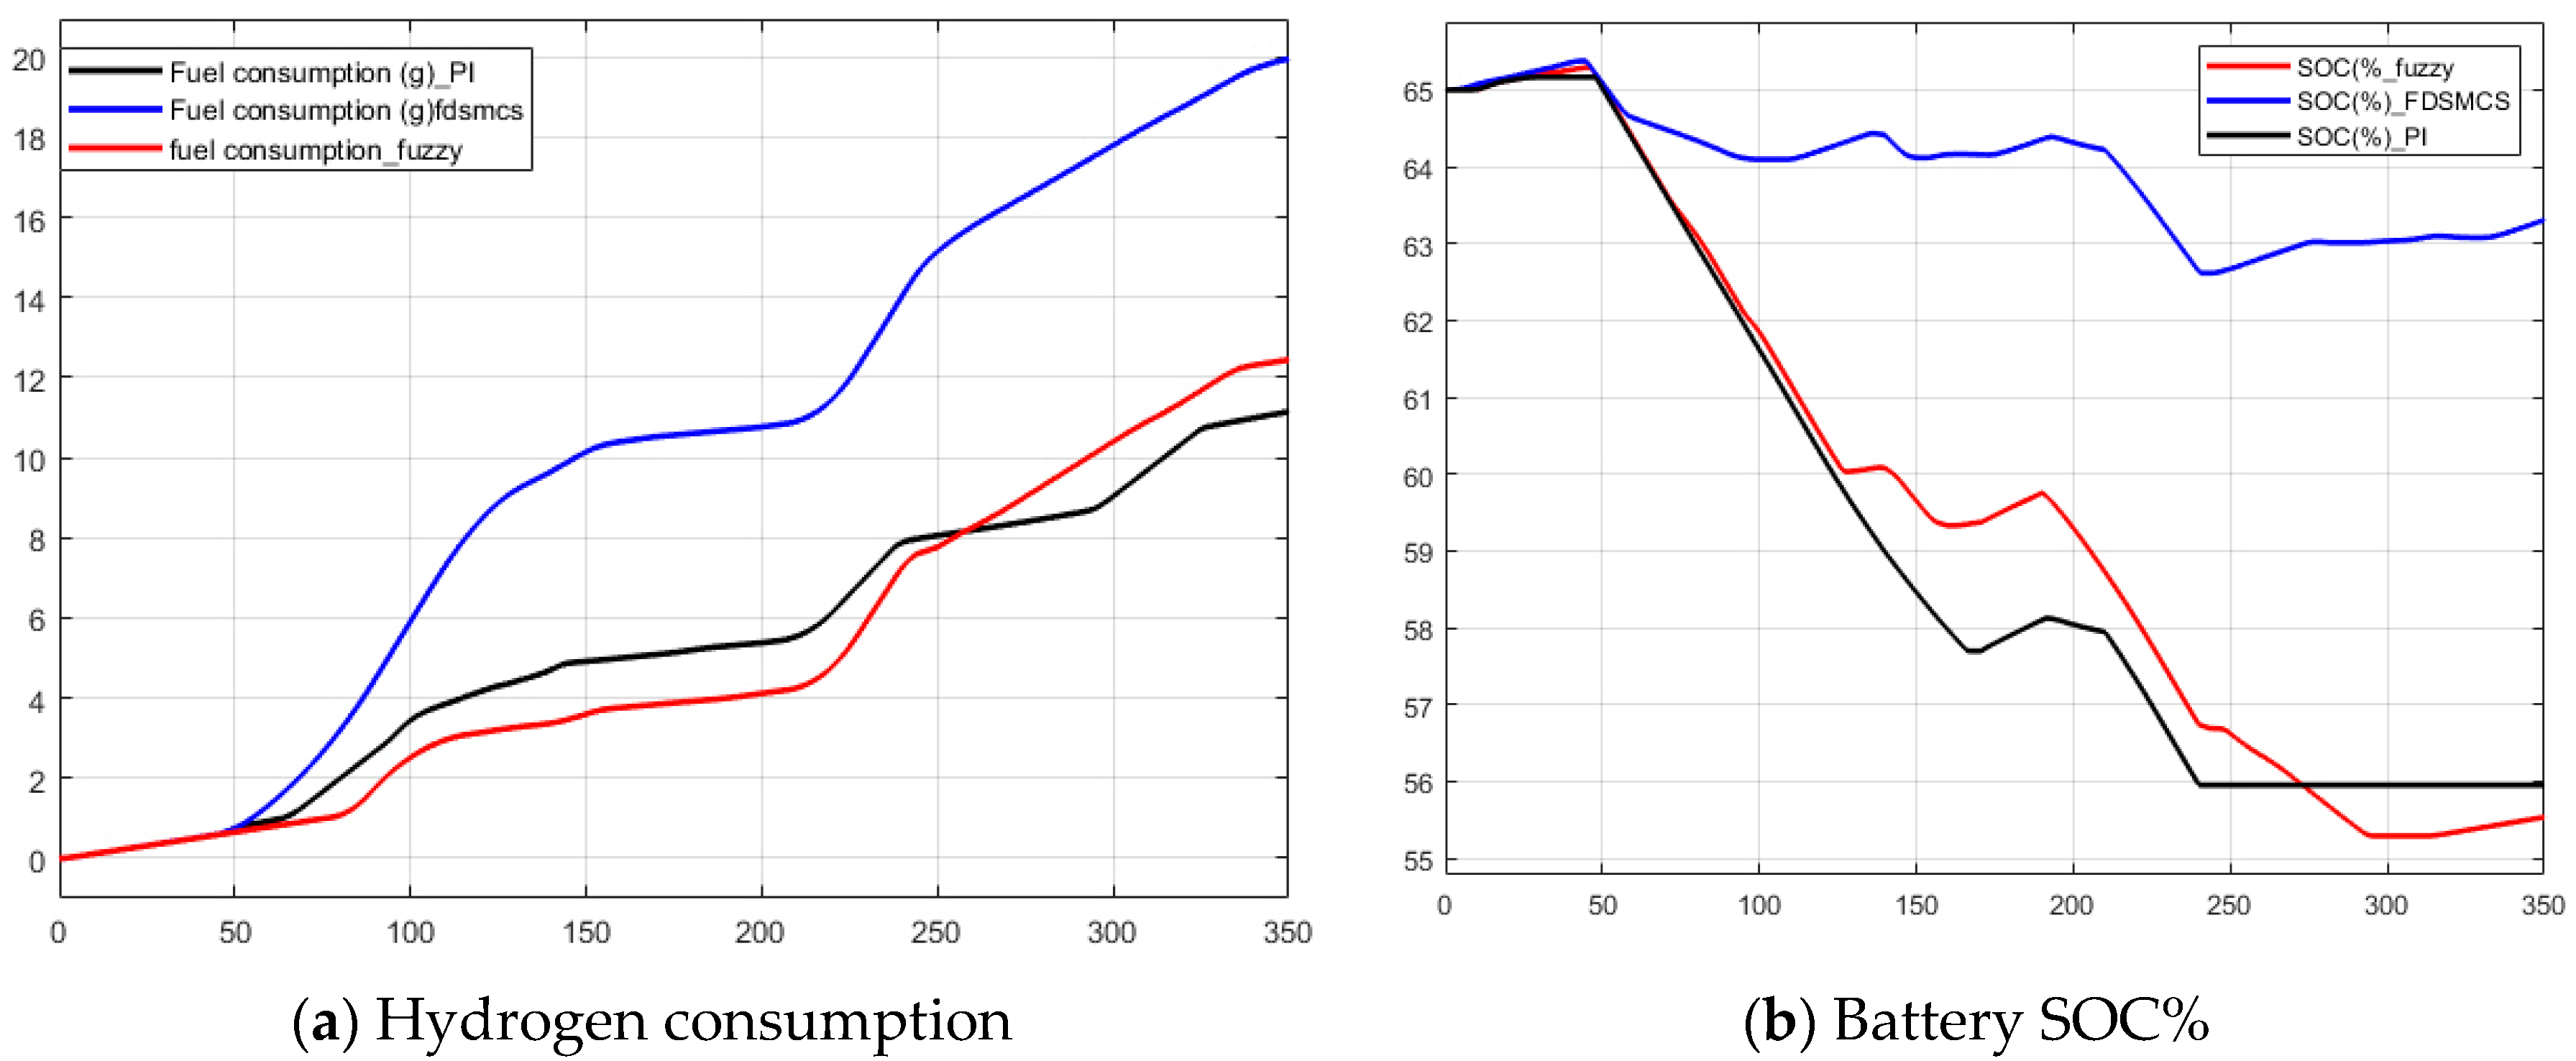
32]. In this paper, the performance of the system is simulated using two different energy management strategies (fuzzy logic control strategy and high frequency decoupling and state machine control strategies) to validate the proposed PI control strategy. The simulation results show that the PI control strategy is better than the high frequency decoupling and state machine control strategy in terms of hydrogen consumption. Although the hydrogen consumed by the fuzzy logic control strategy is close to the consumed value by PI, the PI control strategy is easy and simple for implementation. The overall system performance proves that the system works efficiently when applied for a three-phase AC variable load. The cost optimization issue was not calculated in this study, and could be considered in future papers. The next sections of this paper present the overall system description of the proposed system structure, system components, the control strategy, results and discussion, and finally, the conclusion.

2. Overall System Description

A hybrid power system containing a PV, FC, battery, and SC is designed to examine the optimal configuration for the power system shown in Figure 2. It is implemented and simulated in MATLAB/Simulink (version 2018a) software to monitor, control, and analyze the system. The PV panel is connected to a DC/DC boost converter, which is controlled through an MPPT based on perturb and observe (P&O) to get the maximum power of the solar panels. The irradiance values were assumed through the Simulink signal builders and the temperature is fixed at 25 °C. The system component was chosen to get the maximum system performance when working together to cover the disadvantages of each source when operating as a stand-alone source. The system is designed to supply a dump load with its demand power. The system covers the disadvantages of each individual power system when working as a separate system. The surplus power from PV is utilized in charging the SC and battery. It keeps their state-of-charge (SOC) in proper value for operation.

3. System Components

3.1. PV Arrays

The equivalent circuit for the PV solar cell is represented in Figure 3 [33,34], where IL is the current generated inside the solar cell according to the sunlight. As a basic configuration, the solar cell is a P–N junction, so the diode current ID is taken into consideration.
The output current is calculated by applying Kirchhoff’s law and is displayed as follows:
I   =   I L I 0   ( exp   ( ( V o + I R s ) a V T ) 1 ) V o + I R s R SH
where I denotes the output current; I0 is the diode saturation current; V denotes the output voltage; a is the identifying factor of the cells; and VT is called the thermal voltage [35,36]. Solving Equation (1) for short circuit current and RP value is very large compared to the series resistance. The saturation current as a function of temperature is calculated directly by the following equation [37]:
I 0   =   I 0 . ref   ( T ref T ) 3   exp { q E g a k   ( 1 T ref   1 T ) }
where Tref and T are the reference and ambient temperatures, respectively, and Eg denotes the energy gap of the material. The relation between the photon current generated and the solar irradiance is represented as follows [38]:
I L   =   G G a   ( I L . ref   +   V sc   Δ T )
where: G is the solar irradiance; Ga is the reference solar irradiance, which is equivalent to 1 KW/m2 at the standard test condition (STC); Δ T denotes the temperature difference between the actual temperature and the temperature at STC, which is 25 °C; and Vsc is the temperature coefficient [39]. Rezk et al. represent in [40] the modeling of the IV curve of the PV under all conditions of irradiance and temperature. Table 1 represents the data sheet of the solar panels used in the proposed system in this paper.
Figure 4 shows the relationship between the generated current and output power, along with the voltage for the type TPB 156x156-72-P-295W PV solar module used in this paper. The maximum value of the current, called ISC current, when the output terminals are shorted and the maximum value of voltage is the Voc at the value of zero current.
Several researches discussed in detail the MPPT algorithms and how to use them for maximizing the generated power from PV [41,42,43,44,45]. In this paper, the MPPT used is based on the perturb and observe (P&O) algorithm with the flowchart shown in Figure 5. P&O is the most common technique in which the power is compared at several samples and perturbs the current. This process is repeated until the difference in power is zero. Larminie et al. discussed several techniques of MPPT, including P&O [46].

3.2. Fuel Cell

The advantages of the proton exchange membrane fuel cell (PEMFC) include its high efficiency, reaching up to 45%, high energy density out of small dimensions (up to 2 W/cm2), silent operation, low-temperature operation, fast start-up, and system robustness [47,48]. The most important advantage of the PEMFC is the minimum pollutants, where the hydrogen fuel used in FC has no adverse effects on the environment [49,50]. In spite of the FC advantages, the FC has some disadvantages like its slow response to the load variation, its unstable output voltage, its short lifetime because of the increase in current ripple, and its relatively high cost. The overall equivalent circuit for the FC discussed by Outeiro et al. is shown in Figure 6 [50].
The modeling and simulation of the FC were discussed in [51] as follows:
A   =   R T z α F
Eoc = En Kc
i o   =   z F k ( P H 2   +   P O 2 ) R H   e Δ G R T
where R is 8.3145 J/(mol K); Kc denotes voltage constant at nominal condition of operation; T is temperature of operation (K); F is 96,485 A s/mol; ΔG is size of the activation barrier, which depends on the type of electrode and catalyst used; h denotes Planck’s constant = 6.626 × 10⁻³⁴ J s; z is number of moving electrons; k denotes Boltzmann’s constant = 1.38 × 10⁻²³ J/K; P O 2 denotes partial pressure of oxygen inside the stack (atm); P H 2 is partial pressure of hydrogen inside the stack (atm); En is Nernst voltage, which is the thermodynamics voltage of the cells and depends on the temperatures and partial pressures of reactants and products inside the stack (V); and α is charge transfer coefficient, which depends on the type of electrodes and catalysts used. For block A in the FC equivalent circuit, the utilization factor for the fuel and the air (H2 and O2) is calculated as follow:
U f O 2   =   n O 2 r n O 2 i n   =   6000 R T N i f c 2 z F P a i r V l m p ( a i r )   y %
U f H 2   =   n H 2 r n H 2 i n   =   6000 R T N i f c z F P f u e l V l m p ( f u e l )   x %
where Pfuel is absolute supply pressure of fuel (atm); Pair is absolute supply pressure of air (atm); N denotes number of cells; Vlpm(air) is air flow rate (L/min); Vlpm(fuel) is fuel flow rate (L/min); y denotes percentage of oxygen in the oxidant (%); x denotes percentage of hydrogen in the fuel (%); and the 60,000 constant comes from the conversion from the L/min flow rate used in the model to m3/s (1 L/min = 1/60,000 m3/s). The Nernst voltage is determined in Block B as follows:
E N e r n s t   t   =   1 . 229 ( T 298 . 15 )   44 . 43 z F   +   R T z F   ln   ( P H 2   P O 2 1 2 ) ,   when   T     100   ° C
E N e r n s t   t   =   1 . 229 ( T 298 . 15 )   44 . 43 z F   +   R T z F   ln   ( P H 2 P O 2 1 2 P H 2 O ) ,   when   T   >   100   ° C
The partial pressure for H2, O2, and H2O are calculated also in block B as follows:
P H 2   =   ( 1 U f H 2 )   x %   P f u e l
P H 2 O   =   ( W   +   2 y % U f O 2 )   P a i r
P O 2   =   ( 1 U f O 2 )   y %   P a i r
where W denotes percentage of water vapor in the oxidant (%) and P H 2 O is partial pressure of water vapor inside the stack (atm). The updated values of the exchange current io and the open circuit voltage are calculated according to the partial pressure and the Nernst voltage. The (IV) curve of the FC used in this paper is represented in Figure 7. It represents the relation between the current density and the FC voltage. Table 2 represents the data sheet for FC used in present case study.

3.3. Battery

The main target of using and integrating a battery and a supercapacitor with the renewable energy resources power configuration is to store the surplus of energy produced from the other sources and reuse it whenever there is a shortage in energy [52,53]. In this paper, the proposed design was built based on the lithium-ion battery. The battery parameters are shown in Table 3 and the discharge parameters are shown in Table 4.
For batteries, there are three main modeling types: Mathematical model, electro-chemical model, and equivalent circuit model [54]. Honorat et al. discussed the three methods of fast characteristics of automotive lithium-ion second life batteries [55], whereas madani et al. [56] discussed the electrical equivalent circuit for second order batteries. Jiuchun et al. [57] argue that the electrical equivalent circuit is the best model for representing the battery, due to the unsuitability of the mathematical model for actual application and the complexity of the electro-chemical model. Valant et al. [58] tested the modules used in secondary application of grid in lab conditions. Generally, the equivalent circuit of the ideal battery combines the open circuit voltage and the battery internal resistance. Figure 8 represents the equivalent battery circuit and Figure 9 represents the battery performance—where Vb is the battery voltage; ib is the battery current; Voc is the open circuit voltage as a function of SOC h (t); Rp and Cp are the resistance and the capacitance of the battery polarization; and Rs is the internal resistance.
For discharge mode, the battery voltage equation is represented as follow [59]:
V b a t t   =   E 0     K   ( Q Q i t )   i *     K   ( Q Q i t )   i t   +   A   e B i t   ( i *   >   0 )
For charge mode, the battery voltage equation is represented as follows:
V b a t t   =   E 0     K   ( Q i t + 0 . 1   Q )   i *     K   ( Q Q i t )   i t   +   A   e B i t   ( i *   <   0 )
The fully charged state voltage is displayed as follows:
Vfull = E0Ri + A
The exponential section voltage is calculated as follows:
V e x p   =   E 0   K   ( Q Q Q e x p )   ( Q e x p   +   i )     R i   +   A   e 3 Q e x p Q e x p
And finally, the nominal zone cell voltage is calculated as follows:
V n o m   =   E 0   K   ( Q Q Q n o m )   ( Q n o m   +   i )     R i   +   A   e 3 Q e x p Q n o m
where E0 is constant voltage, in V; K is polarization constant, in Ah−1; i* is low frequency current dynamics, in A; i is battery current, in A; it is extracted capacity, in Ah; Q is maximum battery capacity, in Ah; A is exponential voltage, in V; and B is exponential capacity, in Ah−1. SOC is estimated according to coulomb counting by accumulating the capacity during battery charging/discharging:
S O C = S O C 0     1 Q n 0 t η i d t

3.4. Supercapacitors (SC)

The SC is used with the battery to decrease the peak current in the battery when the load is highly fluctuating because of its high specific power. As the battery cannot supply the needed power at a high rate because of it characteristics, the SC covers this power shortage. SC has a high-efficiency cycle (about 100%) which is suitable for both frequent charge/discharge cycles and storage of energy, compared to the battery, which is used to supply the average needed power. It means that the SC delivers the power faster and has more charge/recharge cycles than the battery [60]. That is why the supercapacitor is used as a complementary element with other electrical sources that have different dynamic behavior and different energy storage quantities [61]. The main parameters of the supercapacitor source used in this paper are shown in Table 5, while the self-discharge parameters are listed in Table 6.
Figure 10 shows the electrical equivalent circuit for the SC [62], where C is the capacitance of SC, EPR is the equivalent parallel resistances, and ESR is the equivalent series internal resistances of SC.
E U C = 1 2 C ( V i 2     V f 2 ) E U C
where EUC is the dragged energy from the SC and ( V i 2 V f 2 ) is the voltage change between the final and initial voltage. The series/parallel configuration of the capacitors in SC was determined by the value of the terminal voltage. The total capacitance and resistance for the SC can be determined as follows:
R t o t a l   =   n s E S R n p
E S R   =   Δ V d I d
C t o t a l   =   n p C n s
C   =   I d ( t 2     t 1 ) ( V 2     V 1 )
where Id is the discharging current; ns is the number of connected capacitors in series; and np is the number of series strings in parallel. The characteristics of the supercapacitor charge is shown in Figure 11.

4. Energy Management System

As the proposed system in this paper contains multi-electrical power sources like FC and PV, an energy storage element could be used as a power source when discharging. Hence, there is a need for an energy management strategy, based on a computer program to control, monitor, and optimize the system operation to get maximum system performance [63]. The EMS is used to increase the system overall efficiency, decrease the hydrogen fuel consumption in the FC power system when the FC is used as a component of the hybrid system, increase the life cycle of the system component to keep the stability of the DC voltage, and control the SOC and prevent its deep discharge [64]. There are many EMSs and control strategies that are used with renewable hybrid power systems, such as state machine control, fuzzy logic control (FLC), Control loop cascade, proportional–integral–derivative (PID) control approach, and instantaneous optimization approach. The PI cascaded control was promoted in this paper as a microgrid control strategy. This control strategy calculates and sets the reference values of FC current, battery charge, and discharge currents. Figure 12 shows the flowchart of the fuel cell current control with each comparison step between the reference values of SOC, load power with PV power, and finally, the minimum and maximum values for the DC bus voltage (VDC). Regarding the EMS used in the present case study, the classic PI controller gives the simplest way because it has a few number of inputs, is easy to be configured, has feedback, and is inexpensive compared with other EMSs like FLC. FLC has more rules for more accuracy, low speed performance, and much more cost with regard to the programming and hardware interface [65].
The PI control strategy is simulated in MATLAB/Simulink, as illustrated in Figure 13. Figure 13a shows the actual percentage of SOC measured in the simulation program compared with a predetermined value (60%). According to the difference, the program increases/decreases the reference power of the fuel cell. Figure 13b illustrates the shortage power from load/PV comparison, where the behavior of the strategy output is calculated according to the difference between the load and the PV power. Figure 13c shows the reference value of the fuel cell current according to the reference power, and Figure 13d shows the fuel cell reference current according to VDC limits.
The control of the charging/discharging battery current is done according to PI control strategy. It depends on a summation of two PI controllers. One of them is based on the power difference between the load and the PV power, and the other is based on the difference between the actual and the reference of the VDC, which is 270 VDC in this case. According to the result of these two PI controllers, the output of the strategy by charge/discharge the battery. Figure 14 shows the flowchart of the battery charge/discharge procedure.
Figure 15 shows the PI control strategy MATLAB model for battery.
The system is designed to supply a variable three-phase dump load, as shown in Figure 16a, with its needed power. The load profile is assumed to be variable with different levels of power in order to test the performance of the proposed system at variable value of load (from about 0 to 9 kW) along the total duration of simulation. The system is implemented and simulated in MATLAB/Simulink for a total simulation time of 350 s. During this period, the behavior of the system could be divided into three different stages according to the PV power, as shown in Table 7.

4.1. Performance during Stage #1

The start of this stage is at 0 s, and its end is determined at 90 s. In this period, the PV power is zero, as shown in Figure 16c. In this stage, the zero PV power is because of no solar irradiance, as shown in Figure 16b. During the period from 0 to 40 s, there is a surplus of power because the load is zero. The fuel cell current is at minimum (ifc = 20 A) because the SOC initial value (60%) is greater than its reference value (60%), which leads the VDC to increase more than 270 V, which is the set point for the system DC bus voltage. The battery and supercapacitor start to charge, as per battery charging current (Figure 17a).
Figure 18 shows line voltage, phase current, fuel cell power, and battery power. At 40 s, the load starts to increase and the supercapacitor starts to supply the load with the power faster than the fuel cell and battery because of its charge/discharge response. Then, the battery and fuel cell start to supply their power at 43 s and 44 s, as illustrated in Figure 18c,d. The fuel cell power, the battery, and the supercapacitor power follows the load power until the end of this stage at 90 s, according to the PI control strategy.

4.2. Performance during Stage #2

This stage is initiated at 90 s and ends at 250 s. The PV output power increases with the increasing of the irradiance value according to day light. As the temperature is assumed to be constant (t = 25 °C), the PV power is mainly dependent on the PV current shown in Figure 16d. The EMS estimates the difference between the load power Pload and the PV power, and then determines the new values of the fuel cell current and the battery charge/discharge current. In this case, the PV power interferes in controlling the battery charging/discharging, as well as controlling the FC current (Figure 19a).
The PV power reaches its maximum value of 7326 watt at 170 s. At this point, the generated PV power exceeds the load demand, leading to a surplus of power. This surplus power is used to charge the battery and supercapacitor through the PI control strategy, and simultaneously decreases the power consumed from the fuel cell at the same time until 180 s. During the period from 80 to 250 s, the load demand is more than the generated PV power and there is no surplus power. The battery and supercapacitor then discharge and share the load power with the PV array and fuel cell. Figure 20 shows the results for all of the system collected together.

4.3. Performance during Stage #3

This stage starts at 250 s up until 350 s. In this stage, the generated PV power is zero and the load is supplied by the fuel cell power, battery power, and the supercapacitor power, the same as stage 1. At the end of this stage, the load power is zero and the fuel cell supplies power for charging the battery and supercapacitor. As a result, the VDC increases again and reaches the value of 285 VDC by the end of this stage. The system keeps working in this manner until the end of the simulation. Figure 20 shows the performance of all power sources along the overall simulation period from 0 to 350 s.

5. Comparison Study

In order to validate the results of the classic PI control strategy as a satisfying energy management system to control hybrid energy sources working in a microgrid, the results of a classic PI control strategy simulation were compared with the results of a fuzzy control strategy and a high frequency decoupling and state machine control strategy. Qi Li et al. [66] discussed the fuzzy logic control strategy as an energy management system for a FC/battery/supercapacitor hybrid vehicle. It was used for enhancing the fuel to increase the mileage of the journey, and the results show that the system achieved the power requirement at four standard driving cycles. In the current research, the FIS function in MATLAB was configured with three input signals to the FIS, which were load power, PV power, and battery SOC%, while the output was configured as the FC current. Eight rules were assigned to represent the operation of the system during the simulation periods. Figure 21 shows the Fuzzy FIS configuration used in the simulation.
Table 8 shows the eight rules of the fuzzy control system which control the fuel cell current output signal. The eight rules contain the most conditions so that the system can act accordingly.
High frequency decoupling control strategy is used to decrease the effect of the transient load change by insulating the PEMFC current from the high frequency transient load change [67]. The configuration of the frequency decoupling and state machine control strategy implemented in this paper is shown in Figure 22.
Figure 23 displays the results of the fuzzy logic control strategy, where Figure 23a shows the hydrogen consumption along the simulation period. Figure 23b shows the SOC of the battery.
Figure 24 displays the results of the high frequency decoupling and state machine control strategy. The hydrogen consumption along the simulation period is 19.9 (g), as shown in Figure 24a. Figure 24b shows the SOC of the battery.
For the main two parameters, hydrogen consumption and SOC (%), Figure 25 shows the comparison between three control strategies. Figure 25a shows the fuel consumption for PI, fuzzy, and high frequency decoupling and state machine. The high frequency decoupling and state machine is the biggest strategy for hydrogen consumption, while the fuzzy and the PI are close.
Table 9 summarizes the comparison among the classic PI control strategy, fuzzy logic control strategy, and high frequency decoupling and state machine control strategy.

6. Conclusions

The microgrid combined with a renewable hybrid power system is a very promising, efficient, and clean power generation system. It can replace the conventional fuels easily. In this study, the obtained results prove that the designed hybrid power system—which combines PV, FC, battery, and SC—works efficiently at decreasing the effects of the FC disadvantages. It solves the problems of the individual source and supplies the load with sufficient and stable power. The PV array supplies the main power and the FC compensates for the power shortage because of shading and night time. The battery and SC are used to solve the problems of slow response of the FC during the fast change of the load power and to remove the peak power from the system. In cases where surplus power exists, this power is used to charge the battery to keep battery SOC% at a healthy level (between 57 and 65.4%), and sustain the VDC within the range of 265 to 285 in good condition. Moreover, the H2 fuel consumption is 12.13 gm, as the FC is used as supported sources working with the PV. The system was simulated for another two control strategies, fuzzy and high frequency decoupling state machines. The results for comparison prove that the PI control strategy is better than the high frequency decoupling state machine. In addition, for the fuzzy control strategy, although the results were close, the PI is easier for implementation. Future researches could focus on improving the system with regard to cost optimization. It is also suggested that an electric electrolyzer should be attached to the system to use the surplus power in hydrogen production. Further researches could focus on helping environment interests such as global warming and climate change, in addition to using other EMS strategies and optimization techniques to improve the system overhaul performance.

Author Contributions

Conceptualization, H.R. and A.A.K.; methodology, H.R. and A.A.K.; software, H.R. and A.A.K.; validation, H.R. and A.A.K.; formal analysis, H.R. and A.A.K.; investigation, H.R. and A.A.K.; resources, H.R., A.A.K., N.S. and J.T.; writing—original draft preparation, H.R. and A.A.K.; writing—review and editing, H.R., A.A.K., N.S. and J.T.

Funding

This research received no external funding.

Conflicts of Interest

The authors declare no conflict of interest.

Nomenclature

MGMicrogrid
ACMGAlternative current microgrid
DCMGDirect current microgrid
PEMFCProton exchange membrane fuel cell
PVPhotovoltaic
HESSHybrid energy storage system
BBattery
BESSBattery energy storage system
IbatBattery current (A)
MPPTMaximum power point tracking
OAFMOptimal auxiliary function method
O&PObserve and perturb
VDCVoltage in direct current side (V)
SCADASupervisory control and data acquisition
EMSEnergy management system
PbatBattery power (KW)
JADEJava agent development framework
BPSOBinary particle swarm optimization
AFFSMCAdaptive fractional fuzzy sliding mode control
CO2Carbon dioxide (gm)
PHPositive high
PLPositive low
PloadLoad demand (KW)
PscSupercapacitor power (KW)
PsurSurplus power (KW)
iFCFull cell current (A)
REHSRenewable energy hybrid system
SCSupercapacitor
ICAImperialist competitive algorithm
PSOParticle swarm optimization
QPSOQuantum behaved particle swarm optimization
ACOAnt colony optimization
COACuckoo optimization algorithm
PCMPower control management
SOCState-of-charge (%)
VDCDC bus voltage (V)
SOCbatState-of-charge of battery (%)
SOCscState-of-charge of supercapacitor (%)

References

  1. El-Shahat, A.; Sumaiya, S. DC-Microgrid System Design, Control, and Analysis. Electronics 2019, 8, 124. [Google Scholar] [CrossRef]
  2. Einan, M.; Hossein, T.; Mahdi, P. Optimized fuzzy-cuckoo controller for active power control of battery energy storage system, photovoltaic, fuel cell and wind turbine in an isolated micro-grid. Batteries 2017, 3, 23. [Google Scholar] [CrossRef]
  3. García-Quismondo, E.; Almonacid, I.; Martínez, M.A.C.; Miroslavov, V.; Serrano, E.; Palma, J.; Salmerón, J.P.A. Operational Experience of 5 kW/5 kWh All-Vanadium Flow Batteries in Photovoltaic Grid Applications. Batteries 2019, 5, 52. [Google Scholar] [CrossRef]
  4. Sao, C.K.; Lehn, P.W. Control and power management of converter fed micro-grids. IEEE Trans. Power Syst. 2008, 23, 1088–1098. [Google Scholar] [CrossRef]
  5. Jiayi, H.; Chuanwen, J.; Rong, X. A review on distributed energy resources and MicroGrid. Renew. Sustain. Energy Rev. 2008, 12, 2472–2483. [Google Scholar] [CrossRef]
  6. Tolba, M.; Rezk, H.; Diab, A.A.; Al-Dhaifallah, M. A novel robust methodology based Salp swarm algorithm for allocation and capacity of renewable distributed generators on distribution grids. Energies 2018, 11, 2556. [Google Scholar] [CrossRef]
  7. Zeh, A.; Müller, M.; Naumann, M.; Hesse, H.; Jossen, A.; Witzmann, R. Fundamentals of using battery energy storage systems to provide primary control reserves in Germany. Batteries 2016, 2, 29. [Google Scholar] [CrossRef]
  8. Majumder, R.; Ghosh, A.; Ledwich, G.; Zare, F. Power management and power flow control with back-to-back converters in a utility connected microgrid. IEEE Trans. Power Syst. 2010, 25, 821–834. [Google Scholar] [CrossRef]
  9. Rezk, H.; Sayed, E.T.; Al-Dhaifallah, M.; Obaid, M. Fuel cell as an effective energy storage in reverse osmosis desalination plant powered by photovoltaic system. Energy 2019, 175, 423–433. [Google Scholar] [CrossRef] [Green Version]
  10. Rezk, H. A comprehensive sizing methodology for stand-alone battery-less photovoltaic water pumping system under the Egyptian climate. Cogent Eng. 2016, 3, 1242110. [Google Scholar] [CrossRef]
  11. Pelegov, D.; José, P. Main Drivers of Battery Industry Changes: Electric Vehicles—A Market Overview. Batteries 2018, 4, 65. [Google Scholar] [CrossRef]
  12. Fathy, A.; Rezk, H.; Nassef, A.M. Robust Hydrogen-Consumption-Minimization Strategy Based Salp Swarm Algorithm for Energy Management of Fuel cell/Supercapacitor/Batteries in Highly Fluctuated Load Condition. Renew. Energy 2019, 139, 147–160. [Google Scholar] [CrossRef]
  13. Lonkar, M.; Ponnaluri, S. An overview of DC microgrid operation and control. In Proceedings of the IEEE IREC2015 the Sixth International Renewable Energy Congress, Sousse, Tunisia, 24–26 March 2015; pp. 1–6. [Google Scholar]
  14. Ahshan, R.; Iqbal, M.T.; Mann, G.K.; Quaicoe, J.E. Micro-grid system based on renewable power generation units. In Proceedings of the IEEE CCECE 2010, Calgary, AB, Canada, 2–5 May 2010; pp. 1–4. [Google Scholar]
  15. Phurailatpam, C.; Sangral, R.; Rajpurohit, B.S.; Singh, S.N.; Longatt, F.G. Design and analysis of a dc microgrid with centralized battery energy storage system. In Proceedings of the 2015 Annual IEEE India Conference (INDICON), New Delhi, India, 17–20 December 2015; pp. 1–6. [Google Scholar]
  16. Elsied, M.; Oukaour, A.; Gualous, H.; Lo Brutto, O.A. Optimal economic and environment operation of micro-grid power systems. Energy Convers. Manag. 2016, 122, 182–194. [Google Scholar] [CrossRef]
  17. Vega-Garita, V.; Ramirez Elizondo, L.; Bauer, P.; Sofyan, M.F.; Narayan, N. Energy Management System for the Photovoltaic Battery-Integrated Module. Energies 2018, 11, 3371. [Google Scholar] [CrossRef]
  18. Eghtedarpour, N.; Farjah, E. Distributed charge/discharge control of energy storages in a renewable-energy-based DC micro-grid. IET Renew. Power Gener. 2014, 8, 45–57. [Google Scholar] [CrossRef]
  19. Shehata, E.G.; Gaber, M.S.; Ahmed, K.A.; Salama, G.M. Implementation of an energy management algorithm in DC MGs using multi-agent system. Int. Trans. Electr. Energy Syst. 2019, 29, e2790. [Google Scholar] [CrossRef]
  20. Hadj-Said, S.; Colin, G.; Ketfi-Cherif, A.; Chamaillard, Y. Analytical solution for energy management of parallel hybrid electric vehicles. IFAC-PapersOnLine 2017, 50, 13872–13877. [Google Scholar] [CrossRef]
  21. Sedaghati, R.; Shakarami, M.R. A novel control strategy and power management of hybrid PV/FC/SC/battery renewable power system-based grid-connected microgrid. Sustain. Cities Soc. 2019, 44, 830–843. [Google Scholar] [CrossRef]
  22. Herisanu, N.; Marinca, V.; Madescu, G.; Dragan, F. Dynamic response of a permanent magnet synchronous generator to a wind gust. Energies 2019, 12, 915. [Google Scholar] [CrossRef]
  23. Chaib, A.; Djalloul, A.; Mohamed, K. Control of a solar PV/wind hybrid energy system. Energy Procedia 2016, 95, 89–97. [Google Scholar] [CrossRef]
  24. Chirkin, V.G.; Khripach, N.A.; Petrichenko, D.A.; Papkin, B.A. A review Of Battery-Supercapacitor Hybrid Energy Storage System Schemes for Power Systems Applications. Int. J. Mech. Eng. Technol. (IJMET) 2017, 8, 699–707. [Google Scholar]
  25. Nowdeh, S.A.; Chitsaz, M.; Shojaei, H. Designing of Stand-alone PV/FC Hybrid System for Sale Electrisity. IJECCT 2013, 7, 41–47. [Google Scholar]
  26. Aldo, S. Solar thermochemical production of hydrogen––A review. Solar Energy 2015, 78, 603–615. [Google Scholar]
  27. Reddy, D.; Barendse, P.; Khan, M. Power electronic interface for combined heat and power systems using high temperature PEM fuel cell technology. In Proceedings of the Power Engineering Society Conference and Exposition in Africa (PowerAfrica), Johannesburg, South Africa, 9–13 July 2012. [Google Scholar]
  28. Sikkabut, S.; Mungporn, P.; Ekkaravarodome, C.; Bizon, N.; Tricoli, P.; Nahid-Mobarakeh, B.; Pierfederici, S.; Davat, B.; Thounthong, P. Control of high-energy high-power densities storage devices by Li-ion battery and supercapacitor for fuel cell/photovoltaic hybrid power plant for autonomous system applications. IEEE Trans. Ind. Appl. 2016, 52, 4395–4407. [Google Scholar] [CrossRef]
  29. Biswas, I.; Bajpai, P. Control of PV-FC-Battery-SC hybrid system for standalone DC load. In Proceedings of the 2014 IEEE Eighteenth National Power Systems Conference (NPSC), Guwahati, India, 18–20 December 2014; pp. 1–6. [Google Scholar]
  30. Samson, G.T.; Undeland, T.M.; Ulleberg, O.; Vie, P.J. Optimal load sharing strategy in a hybrid power system based on pv/fuel cell/battery/supercapacitor. In Proceedings of the 2009 IEEE International Conference on Clean Electrical Power, Capri, Italy, 9–11 June 2009; pp. 141–146. [Google Scholar]
  31. Njoya Motapon, S. Design and Simulation of a Fuel Cell Hybrid Emergency Power System for A More Electric Aircraft: Evaluation of Energy Management Schemes. Ph.D. Thesis, École de technologie supérieure, Montréal, QC, Canada, 2013. [Google Scholar]
  32. Motapon, S.N.; Dessaint, L.A.; Al-Haddad, K. A Robust H2 Consumption-Minimization-Based Energy Management Strategy for a Fuel Cell Hybrid Emergency Power System of More Electric Aircraft. IEEE Trans. Ind. Electron. 2014, 61, 6148–6156. [Google Scholar] [CrossRef]
  33. Al-Dhaifallah, M.; Nassef, A.M.; Rezk, H.; Nisar, K.S. Optimal parameter design of fractional order control based INC-MPPT for PV system. Solar Energy 2018, 159, 650–664. [Google Scholar] [CrossRef]
  34. Rezk, H.; Aly, M.; Al-Dhaifallah, M.; Shoyama, M. Design and Hardware Implementation of New Adaptive Fuzzy Logic-Based MPPT Control Method for Photovoltaic Applications. IEEE Access 2019, 7, 106427–106438. [Google Scholar] [CrossRef]
  35. Park, J.; Kim, H.; Cho, Y.; Shin, C. Simple Modeling and Simulation of Photovoltaic Panels Using Matlab/Simulink. Adv. Sci. Technol. Lett. 2014, 73, 147–155. [Google Scholar]
  36. Bellia, H.; Youcef, R.; Fatima, M. A detailed modeling of photovoltaic module using MATLAB. NRIAG J. Astron. Geophys. 2014, 3, 53–61. [Google Scholar] [CrossRef] [Green Version]
  37. Haberlin, H. Chapter 3, Solar Cells: Their Design Engineering and Operating Principles. In Photovoltaic System Design and Practice; Wiley: Hoboken, NJ, USA, 2012; pp. 79–125. [Google Scholar]
  38. Bouraiou, A.; Hamouda, M.; Chaker, A.; Sadok, M.; Mostefaoui, M.; Lachtar, S. Modeling and simulation of Photovoltaic module and array based on one and two diode model using Matlab/Simulink. International Conference on Technologies and Materials for Renewable Energy, Environment and Sustainability, TMREES15. Energy Procedia 2015, 74, 864–877. [Google Scholar] [CrossRef]
  39. Diab, A.A.Z.; Rezk, H. Global MPPT based on flower pollination and differential evolution algorithms to mitigate partial shading in building integrated PV system. Solar Energy 2017, 157, 171–186. [Google Scholar] [CrossRef]
  40. Rezk, H.; Fathy, A. Simulation of global MPPT based on teaching–learning-based optimization technique for partially shaded PV system. Electr. Eng. 2017, 99, 847–859. [Google Scholar] [CrossRef]
  41. Rezk, H.; Fathy, A. A Novel Methodology for Simulating Maximum Power Point Trackers Using Mine Blast Optimization and Teaching Learning Based Optimization Algorithms for Partially Shaded PV System. J. Renew. Sustain. Energy 2016, 8, 023503. [Google Scholar]
  42. Karami, N.; Moubayed, N.; Outbib, R. General review and classification of different MPPT Techniques. Renew. Sustain. Energy Rev. 2017, 68, 1–18. [Google Scholar] [CrossRef]
  43. Rezk, H.; Hasaneen, E.-S. A new MATLAB/Simulink model of triple-junction solar cell and MPPT based on artificial neural networks for photovoltaic energy systems. Ain Shams Eng. J. 2015, 6, 873–881. [Google Scholar] [CrossRef] [Green Version]
  44. Rezk, H.; Eltamaly, A.M. A comprehensive comparison of different MPPT techniques for photovoltaic systems. Solar Energy 2015, 112, 1–11. [Google Scholar] [CrossRef]
  45. Fathy, A.; Rezk, H. Multi-Verse Optimizer for Identifying the Optimal Parameters of PEMFC Model. Energy 2018, 143, 634–644. [Google Scholar] [CrossRef]
  46. Rezk, H. Performance of incremental resistance MPPT based proton exchange membrane fuel cell power system. In Proceedings of the 2016 Eighteenth International Middle East Power Systems Conference (MEPCON), Cairo, Egypt, 27–29 December 2016. [Google Scholar]
  47. Larminie, J.; Dicks, A. Fuel Cell Systems Explained, 2nd ed.; John Wiley & Sons Ltd.: Hoboken, NJ, USA, 2003; pp. 1–418. [Google Scholar]
  48. Gebregergis, A.; Pillay, P.; Rengaswamy, R. PEMFC fault diagnosis, modeling and mitigation. Trans. Ind. Appl. 2010, 46, 295–303. [Google Scholar] [CrossRef]
  49. Mwinga, M.; Groenewald, B.; McPherson, M. Design, Modelling, And Simulation of a Fuel Cell Power Conditioning system. J. Therm. Eng. 2015, 1, 408–419. [Google Scholar] [CrossRef]
  50. Tremblay, O.; Louis-A, D. A generic fuel cell model for the simulation of fuel cell vehicles. In Proceedings of the 2009 IEEE Vehicle Power and Propulsion Conference, Dearborn, MI, USA, 7–10 September 2009. [Google Scholar]
  51. Outeiro, M. MatLab/Simulink as design tool of PEM Fuel Cells as electrical generation systems. Eur. Fuel Cell Forum 2011, 28, 1–9. [Google Scholar]
  52. Bajpai, P.; Dash, V. Hybrid renewable energy systems for power generation in stand-alone applications: A review. Renew. Sustain. Energy Rev. 2012, 16, 2926–2939. [Google Scholar] [CrossRef]
  53. Boulmrharj, S.; NaitMalek, Y.; Elmouatamid, A.; Bakhouya, M.; Ouladsine, R.; Zine-Dine, K.; Khaidar, M.; Siniti, M. Battery Characterization and Dimensioning Approaches for Micro-Grid Systems. Energies 2019, 12, 1305. [Google Scholar] [CrossRef]
  54. Fotouhi, A.; Auger, D.J.; Propp, K.; Longo, S.; Wild, M. A review on electric vehicle battery modelling: From Lithium-ion toward Lithium–Sulphur. J Renew. Sustain. Energy Rev. 2016, 56, 1008–1021. [Google Scholar] [CrossRef]
  55. Quinard, H.; Redondo-Iglesias, E.; Pelissier, S.; Venet, P. Fast Electrical Characterizations of High-Energy Second Life Lithium-Ion Batteries for Embedded and Stationary Applications. Batteries 2019, 5, 33. [Google Scholar] [CrossRef]
  56. Madani, S.S.; Schaltz, E.; Knudsen Kær, S. An Electrical Equivalent Circuit Model of a Lithium Titanate Oxide Battery. Batteries. 2019, 5, 31. [Google Scholar] [CrossRef]
  57. Jiang, J.; Liang, Y.; Ju, Q.; Zhang, L.; Zhang, W.; Zhang, C. An equivalent circuit model for lithium-sulfur batteries. Energy Procedia 2017, 105, 3533–3538. [Google Scholar] [CrossRef]
  58. Valant, C.; Gaustad, G.; Nenadic, N. Characterizing Large-Scale, Electric-Vehicle Lithium Ion Transportation Batteries for Secondary Uses in Grid Applications. Batteries 2019, 5, 8. [Google Scholar] [CrossRef]
  59. Saw, L.H.; Somasundaram, K.; Ye, Y.; Tay, A.A. Electro-thermal analysis of Lithium Iron Phosphate battery for electric vehicles. J. Power Sources 2014, 249, 231–238. [Google Scholar] [CrossRef]
  60. Donghwa, S.; Kim, Y.; Seo, J.; Chang, N.; Wang, Y.; Pedram, M. Battery-supercapacitor hybrid system for high-rate pulsed load applications. In Proceedings of the Design, Automation & Test in Europe, Grenoble, France, 14–18 March 2011; pp. 1–4. [Google Scholar]
  61. Van Mierlo, J.; Van den Bossche, P.; Maggetto, G. Models of energy sources for EV and HEV: Fuel cells, batteries, ultracapacitors, flywheels and engine-generators. J. Power Sources 2003, 128, 76–89. [Google Scholar] [CrossRef]
  62. Uzunoglu, M.; Onar, O.C.; Alam, M.S. Modeling, control and simulation of a PV/FC/UC based hybrid power generation system for stand-alone applications. Renew. Energy 2009, 34, 509–520. [Google Scholar] [CrossRef]
  63. Rullo, P.; Braccia, L.; Luppi, P.; Zumoffen, D.; Feroldi, D. Integration of sizing and energy management based on economic predictive control for standalone hybrid renewable energy systems. Renew. Energy 2019, 140, 436–445. [Google Scholar] [CrossRef]
  64. Merabet, A.; Ahmed, K.T.; Ibrahim, H.; Beguenane, R.; Ghias, A.M. Energy management and control system for laboratory scale microgrid based wind-PV-battery. IEEE Trans. Sustain. Energy 2016, 8, 145–154. [Google Scholar] [CrossRef]
  65. Behrooz, F.; Mariun, N.; Marhaban, M.H.; Radzi, M.A.M.; Ramli, A.R. Review of control techniques for HVAC systems—Nonlinearity approaches based on Fuzzy cognitive maps. Energies 2018, 11, 495. [Google Scholar] [CrossRef]
  66. Li, Q.; Chen, W.; Li, Y.; Liu, S.; Huang, J. Energy management strategy for fuel cell/battery/ultracapacitor hybrid vehicle based on fuzzy logic. Electr. Power Energy Syst. 2012, 43, 514–525. [Google Scholar] [CrossRef]
  67. Liu, G.; Zhang, J.; Sun, Y. High frequency decoupling strategy for the PEM fuel cell hybrid system. Int. J. Hydrogen Energy 2008, 33, 6253–6261. [Google Scholar] [CrossRef]
Figure 1. Configuration of DC microgrid.
Batteries 05 00063 g001
Figure 2. Block diagram of the proposed system.
Batteries 05 00063 g002
Figure 3. Equivalent circuit for solar cell.
Batteries 05 00063 g003
Figure 4. Characteristics of TPB 156x156-72-P-295W PV solar module.
Batteries 05 00063 g004
Figure 5. The perturb and observe (P&O) maximum power point tracking (MPPT) flowchart.
Batteries 05 00063 g005
Figure 6. Fuel cell (FC) equivalent circuit.
Batteries 05 00063 g006
Figure 7. IV curve for the FC used in proposed system.
Batteries 05 00063 g007aBatteries 05 00063 g007b
Figure 8. Battery equivalent circuit.
Batteries 05 00063 g008
Figure 9. The battery performance.
Batteries 05 00063 g009
Figure 10. Electrical equivalent circuits for the SC.
Batteries 05 00063 g010
Figure 11. Characteristics of the supercapacitor charge.
Batteries 05 00063 g011
Figure 12. Fuel cell current control flow chart.
Batteries 05 00063 g012
Figure 13. (a) State-of-charge (SOC) % check, (b) power shortage, (c) fuel cell current, (d) fuel cell reference current according to DC bus voltage (VDC).
Batteries 05 00063 g013
Figure 14. Battery charge/discharge flowchart according Pload and Ppv.
Batteries 05 00063 g014
Figure 15. PI control strategy for battery charge/discharge.
Batteries 05 00063 g015
Figure 16. (a) Load profile, (b) irradiance, (c) PV power, (d) PV current.
Batteries 05 00063 g016
Figure 17. (a) Battery charging current, (b) battery discharging current, (c) battery SOC%, (d) battery power.
Batteries 05 00063 g017
Figure 18. (a) Line voltage, (b) phase current, (c) fuel cell power, (d) SC Power.
Batteries 05 00063 g018aBatteries 05 00063 g018b
Figure 19. (a) Fuel cell current, (b) fuel cell voltage, (c) fuel cell rate, (d) fuel consumption.
Batteries 05 00063 g019
Figure 20. All power sources along the simulation period.
Batteries 05 00063 g020
Figure 21. The fuzzy inference system (FIS) function configuration.
Batteries 05 00063 g021
Figure 22. Frequency decoupling and state machine configuration.
Batteries 05 00063 g022
Figure 23. Performance of the fuzzy logic control strategy.
Batteries 05 00063 g023
Figure 24. Performance of the high frequency decoupling and state machine control strategy.
Batteries 05 00063 g024
Figure 25. Comparison among considered control strategies (a) hydrogen consumption and (b) battery SOC%.
Batteries 05 00063 g025
Table 1. Data sheet for the TPB 156x156-72-P-295W.
Module TypeTPB 156x156-72-P-295W
Module power class295 Wp
Composition72 (156 × 156 mm) polycrystalline silicon solar cells per module
Max. power (Pmpp) (in W)295
Max. voltage (Umpp) (in V)35.3
Max. current (Impp) (in A)8.36
Open-circuit voltage (Uoc) (in V)44.3
Short-circuit current (ISC) (in A)8.67
Cell temperature (TNOCT) (in °C)46
Module efficiency (in %)15.2
Table 2. Data sheet parameters of the proton exchange membrane fuel cell (PEMFC).
Parameters
Nominal power (w)10,287.5
Max power (w)12,544
Nernst voltage (V)1.1491
Hydrogen (H2)98.98%
Oxidation (O2)42.885
Fuel flow rate (lpm)114.9
Air flow rate (lpm)732
System Temp (K)318
P Fuel (bar)1.16
P Air (bar)1
Table 3. Battery parameters.
Parameters
Nominal voltage (V)48
Rated capacity (Ah)40
Initial state-of-charge (%)65
Table 4. Battery discharge parameters.
Discharge
Maximum capacity (Ah)40
Fully charged voltage (V)55.8714
Nominal discharge current (A)17.3913
Capacity (Ah) at nominal voltage36.1739
Exponential zone [Voltage (V), Capacity (Ah)][52.3, 1.96]
Discharge current [i1, i2, i3, …] (A)[20, 80]
Table 5. Supercapacitor (SC) main parameters.
Parameters
Rated capacitance (F)15.6
Equivalent DC series resistance (Ohms)1.50 × 10⁻¹
Rated voltage (V)291.6
Initial voltage (V)270
Operating temperature (Celsius)25
Table 6. Supercapacitor (SC) self-discharge parameters.
Self-Discharge
Current prior open-circuit (A)10
Voltage at 0 s, 10 s, 100 s, and 1000 s [Voc, V3, V4, V5] (V)[48, 47.8, 47.06, 44.65]
Charge current [i1, i2, i3, …] (A)[10, 20, 100, 500]
Table 7. Simulation stages and its boundaries.
StagesTimePV Power (Watt)
Stage #1From 0 to 90 s0
Stage #2From 90 to 250 s0 > PV > 7326
Stage #3From 250 to 350 s0
Table 8. Fuzzy control system rules.
RuleLoadPVSOCIFC
1LowLowOKLow
2OKLowOKOK
3OKOKOKLow
4HighLowOKHigh
5HighOKOKLow
6HighHighOKLow
7HighHighLowLow
8LowLowHighLow
Table 9. Comparison among considered control strategies.
MethodPIFuzzyHigh Frequency Decoupling and State Machine
H2 consumption (gram)12.131319.9
SOC%56–6555–6563.19–65.39

