Design Strategies for High Power vs. High Energy Lithium Ion Cells


Abstract
:
1. Introduction
2. Results

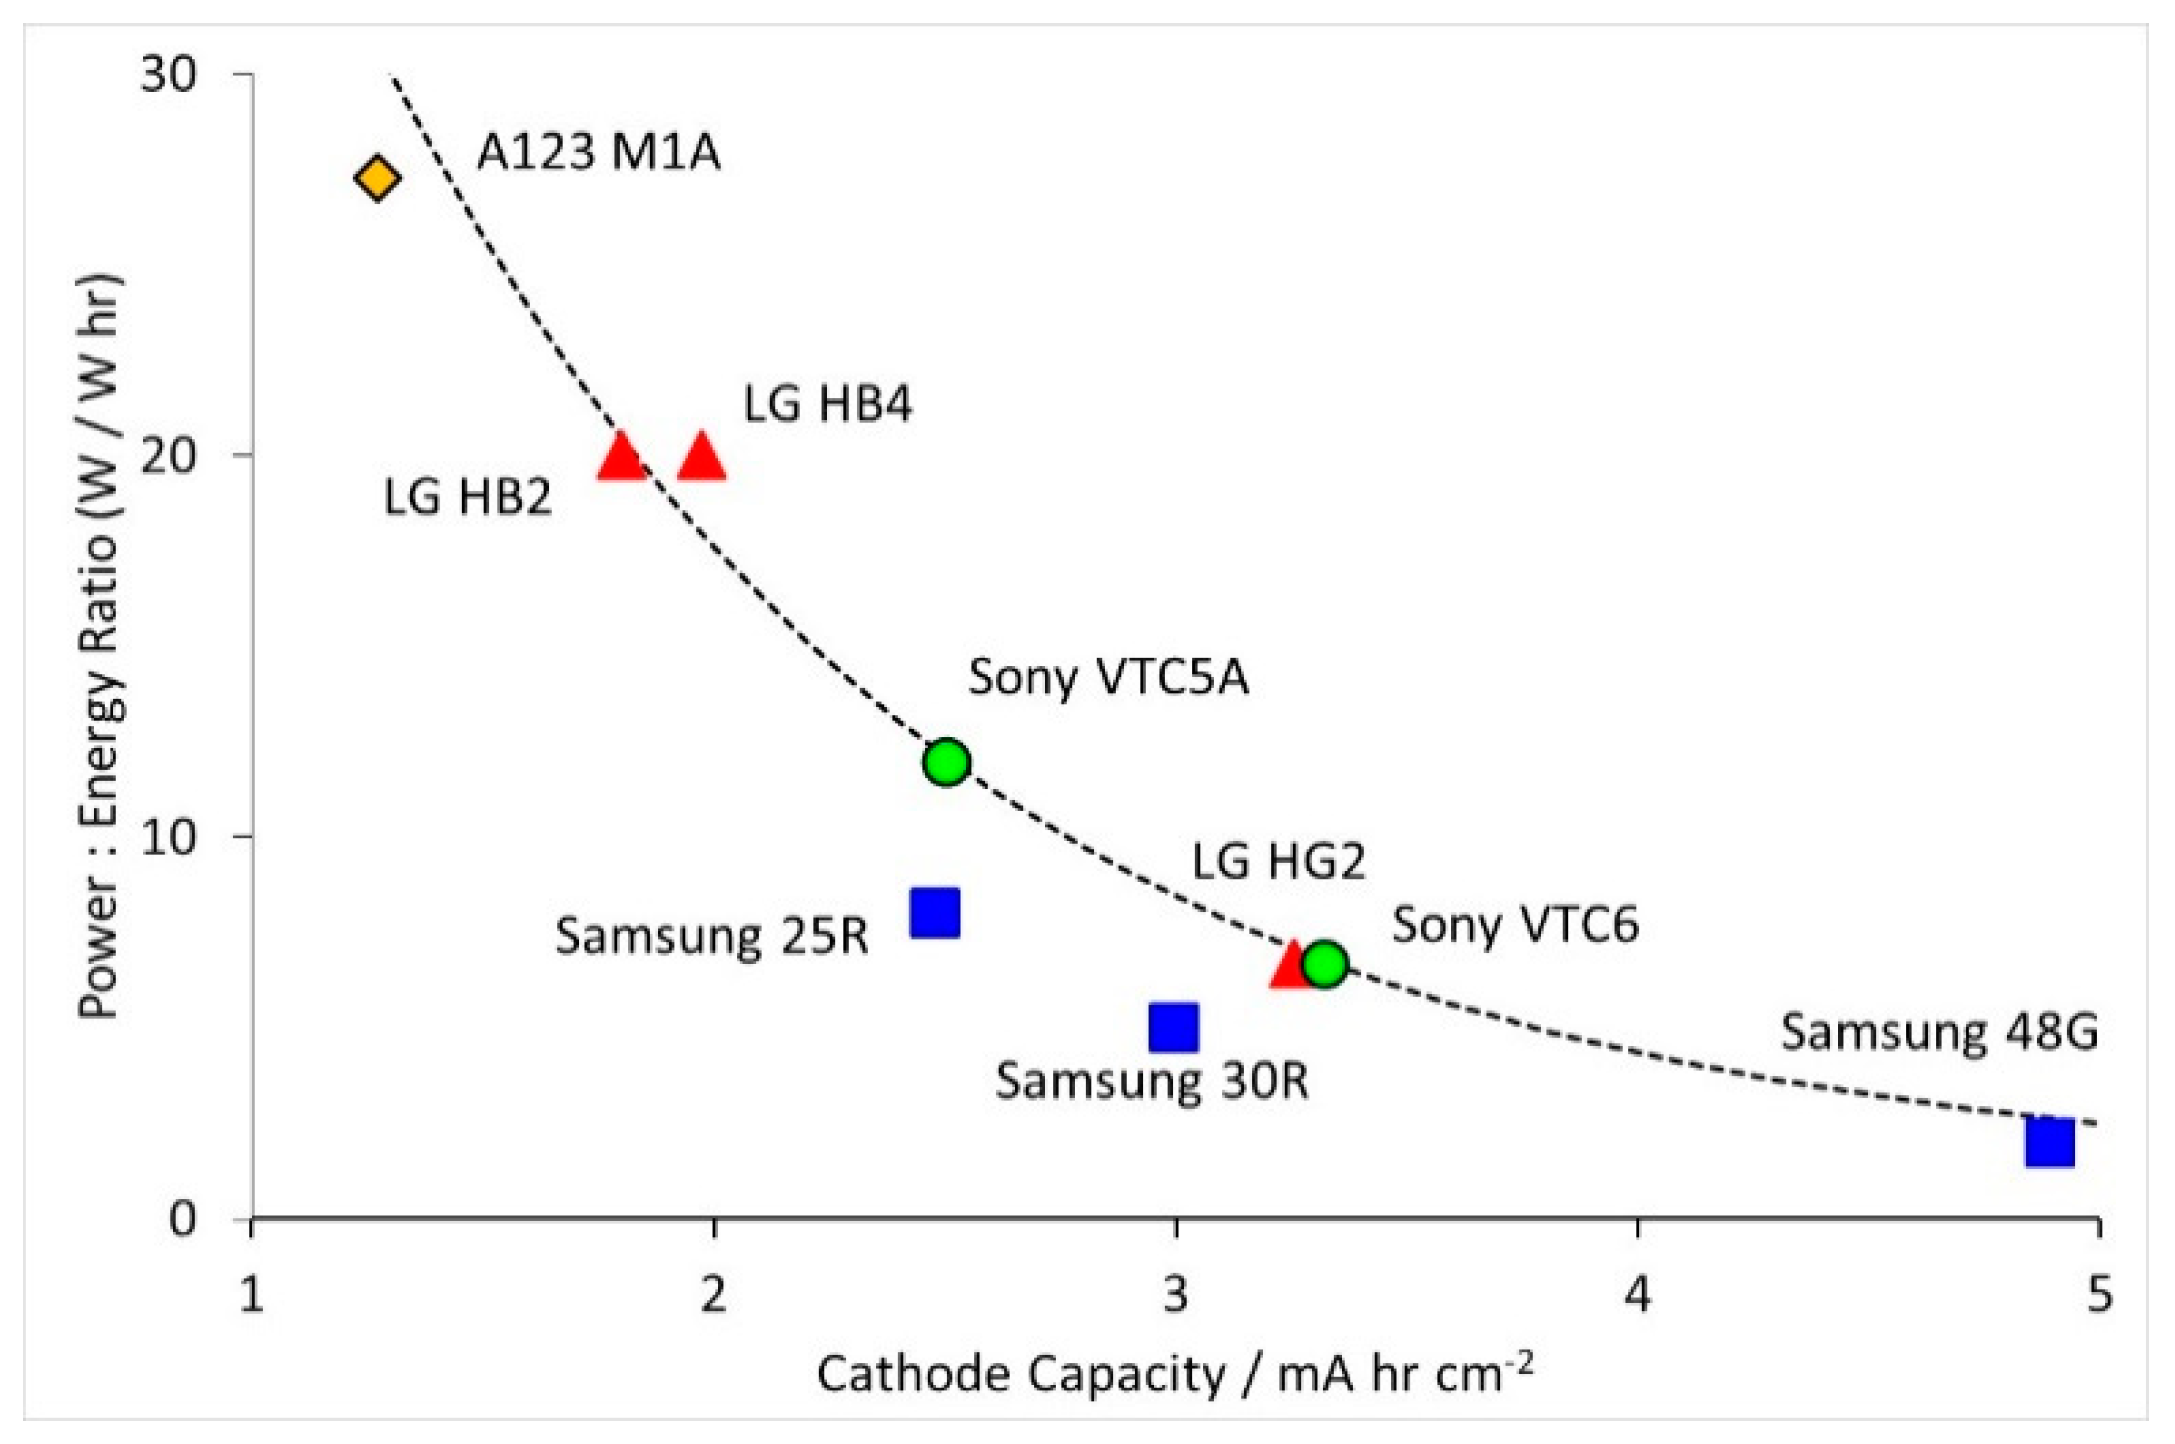
| Manufacturer | Model | Size | Rated Capacity/A hr | Disch. Current/A | Power:Energy/W:W hr | Design Date |
|---|---|---|---|---|---|---|
| A123 | M1A | 18650 | 1.1 | 30 | 27.3 | 2009 [6] |
| LG | HB2 | 18650 | 1.5 | 30 | 20.0 | 2011 [7] |
| LG | HB4 | 18650 | 1.5 | 30 | 20.0 | 2011 [8] |
| LG | HG2 | 18650 | 3.0 | 20 | 6.7 | 2014 [9] |
| Samsung | 25R | 18650 | 2.5 | 20 | 8.0 | 2013 [10] |
| Samsung | 30Q | 18650 | 3.0 | 15 | 5.0 | 2014 [11] |
| Samsung | 48G | 21700 | 4.8 | 10 | 2.1 | 2015 [12] |
| Sony | VTC5A | 18650 | 2.5 | 30 | 12.0 | 2015 [13] |
| Sony | VTC6 | 18650 | 3.0 | 20 | 6.7 | 2015 [14] |
3. Discussion
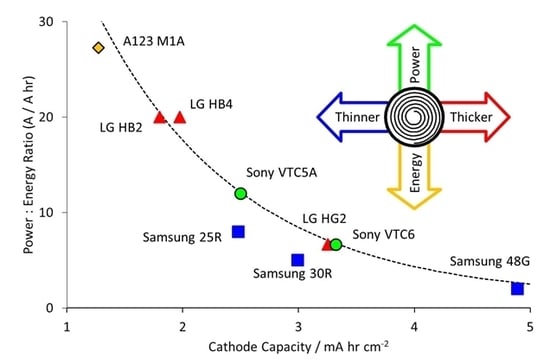
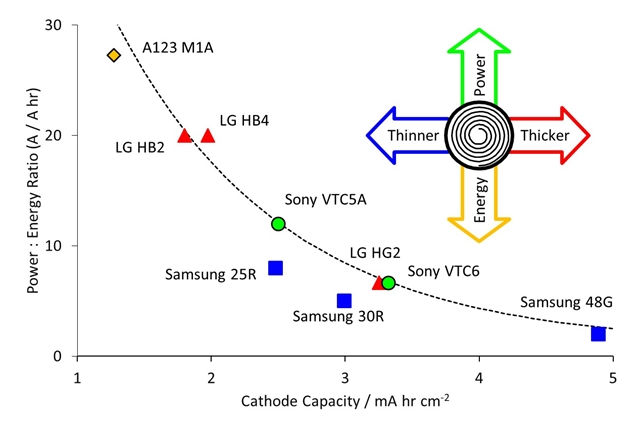
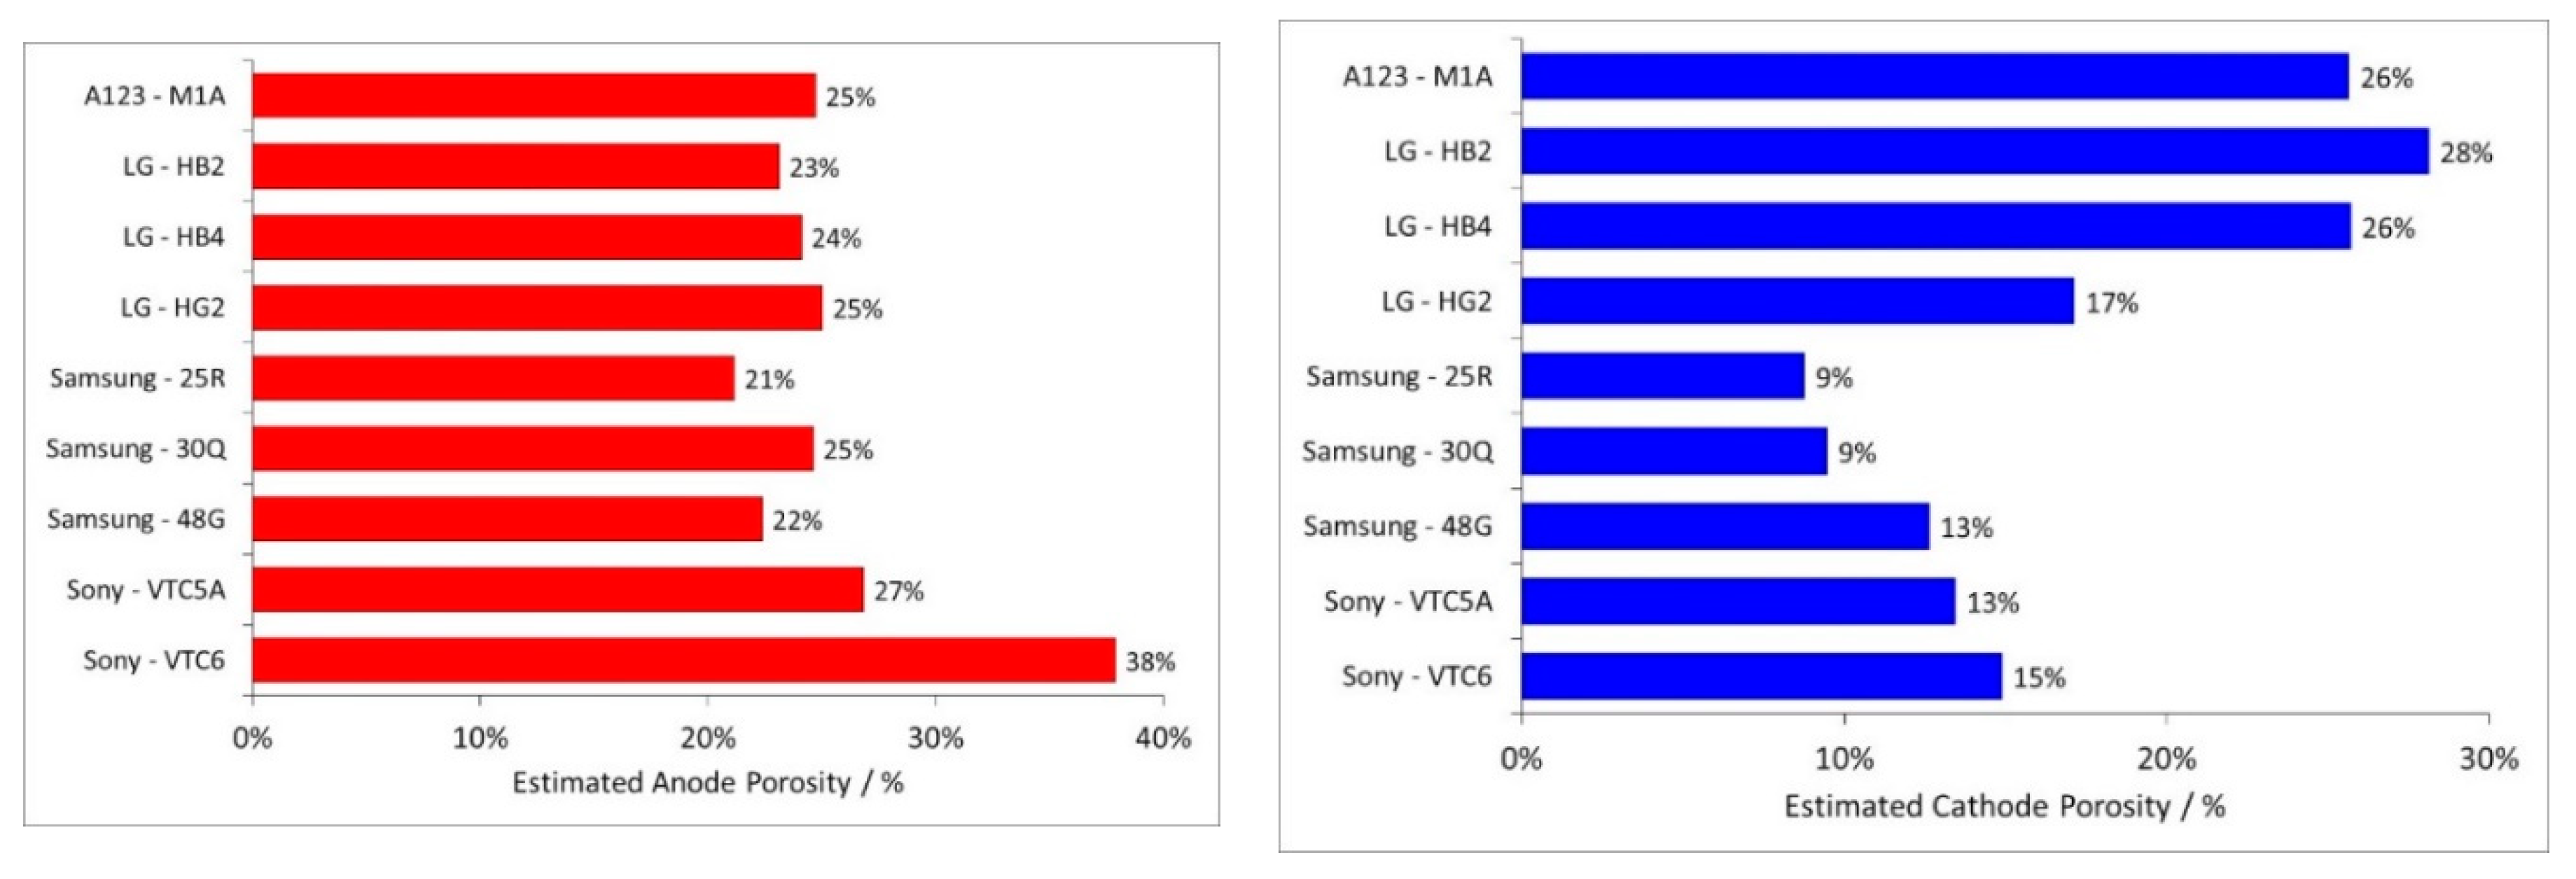
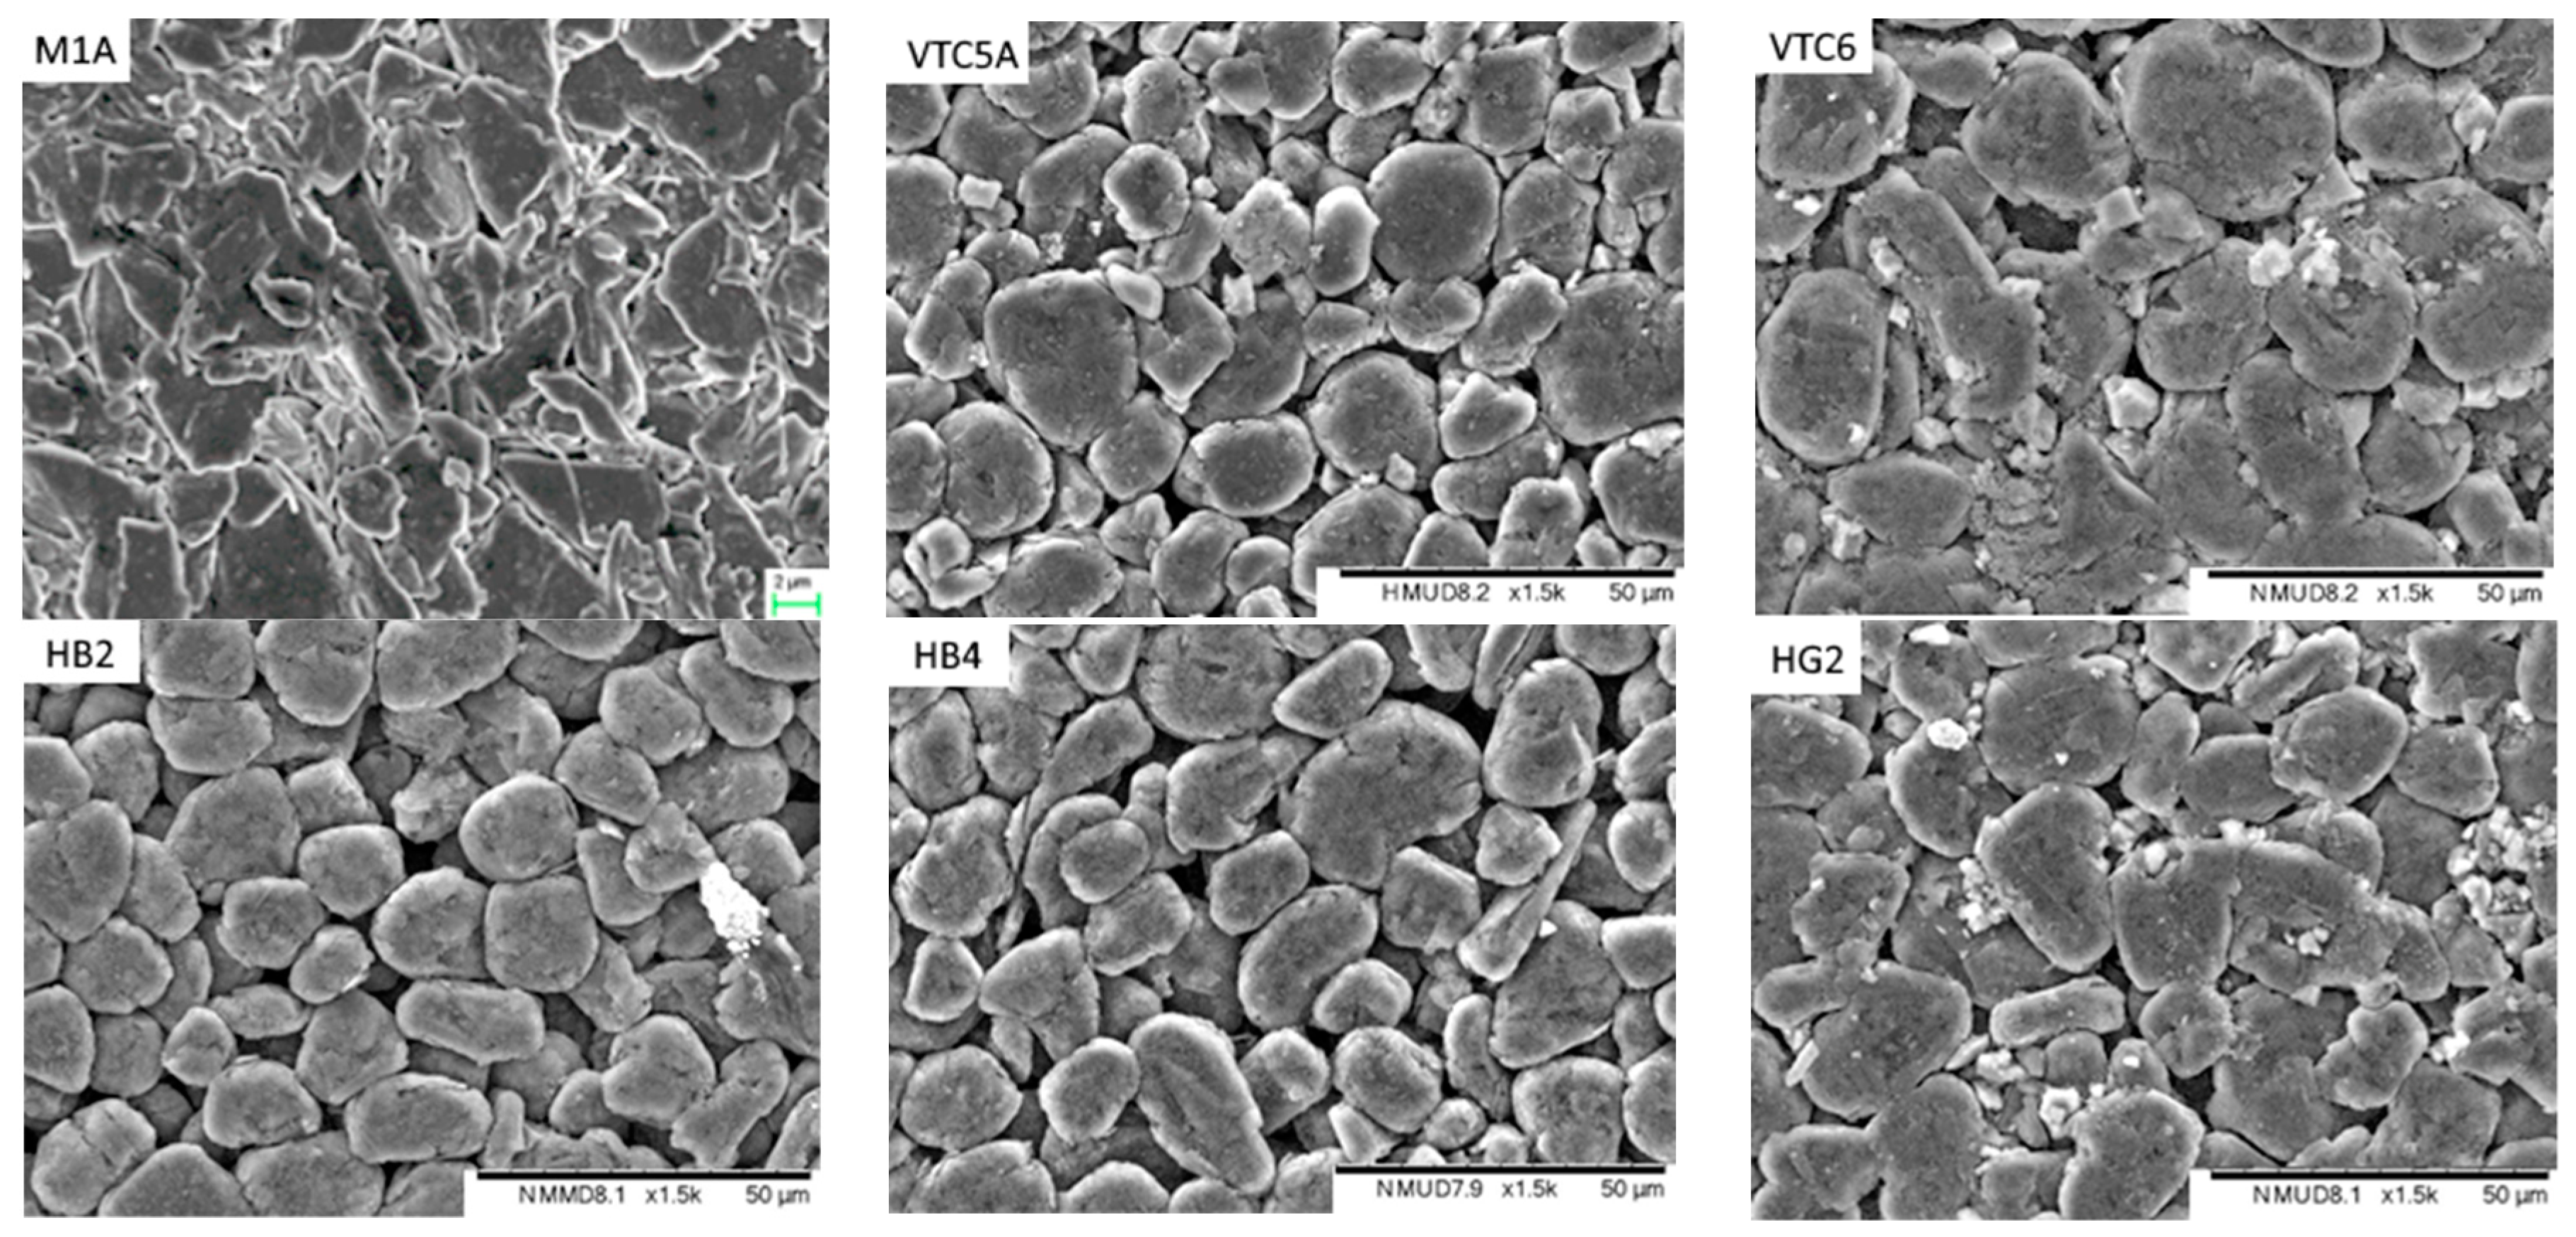
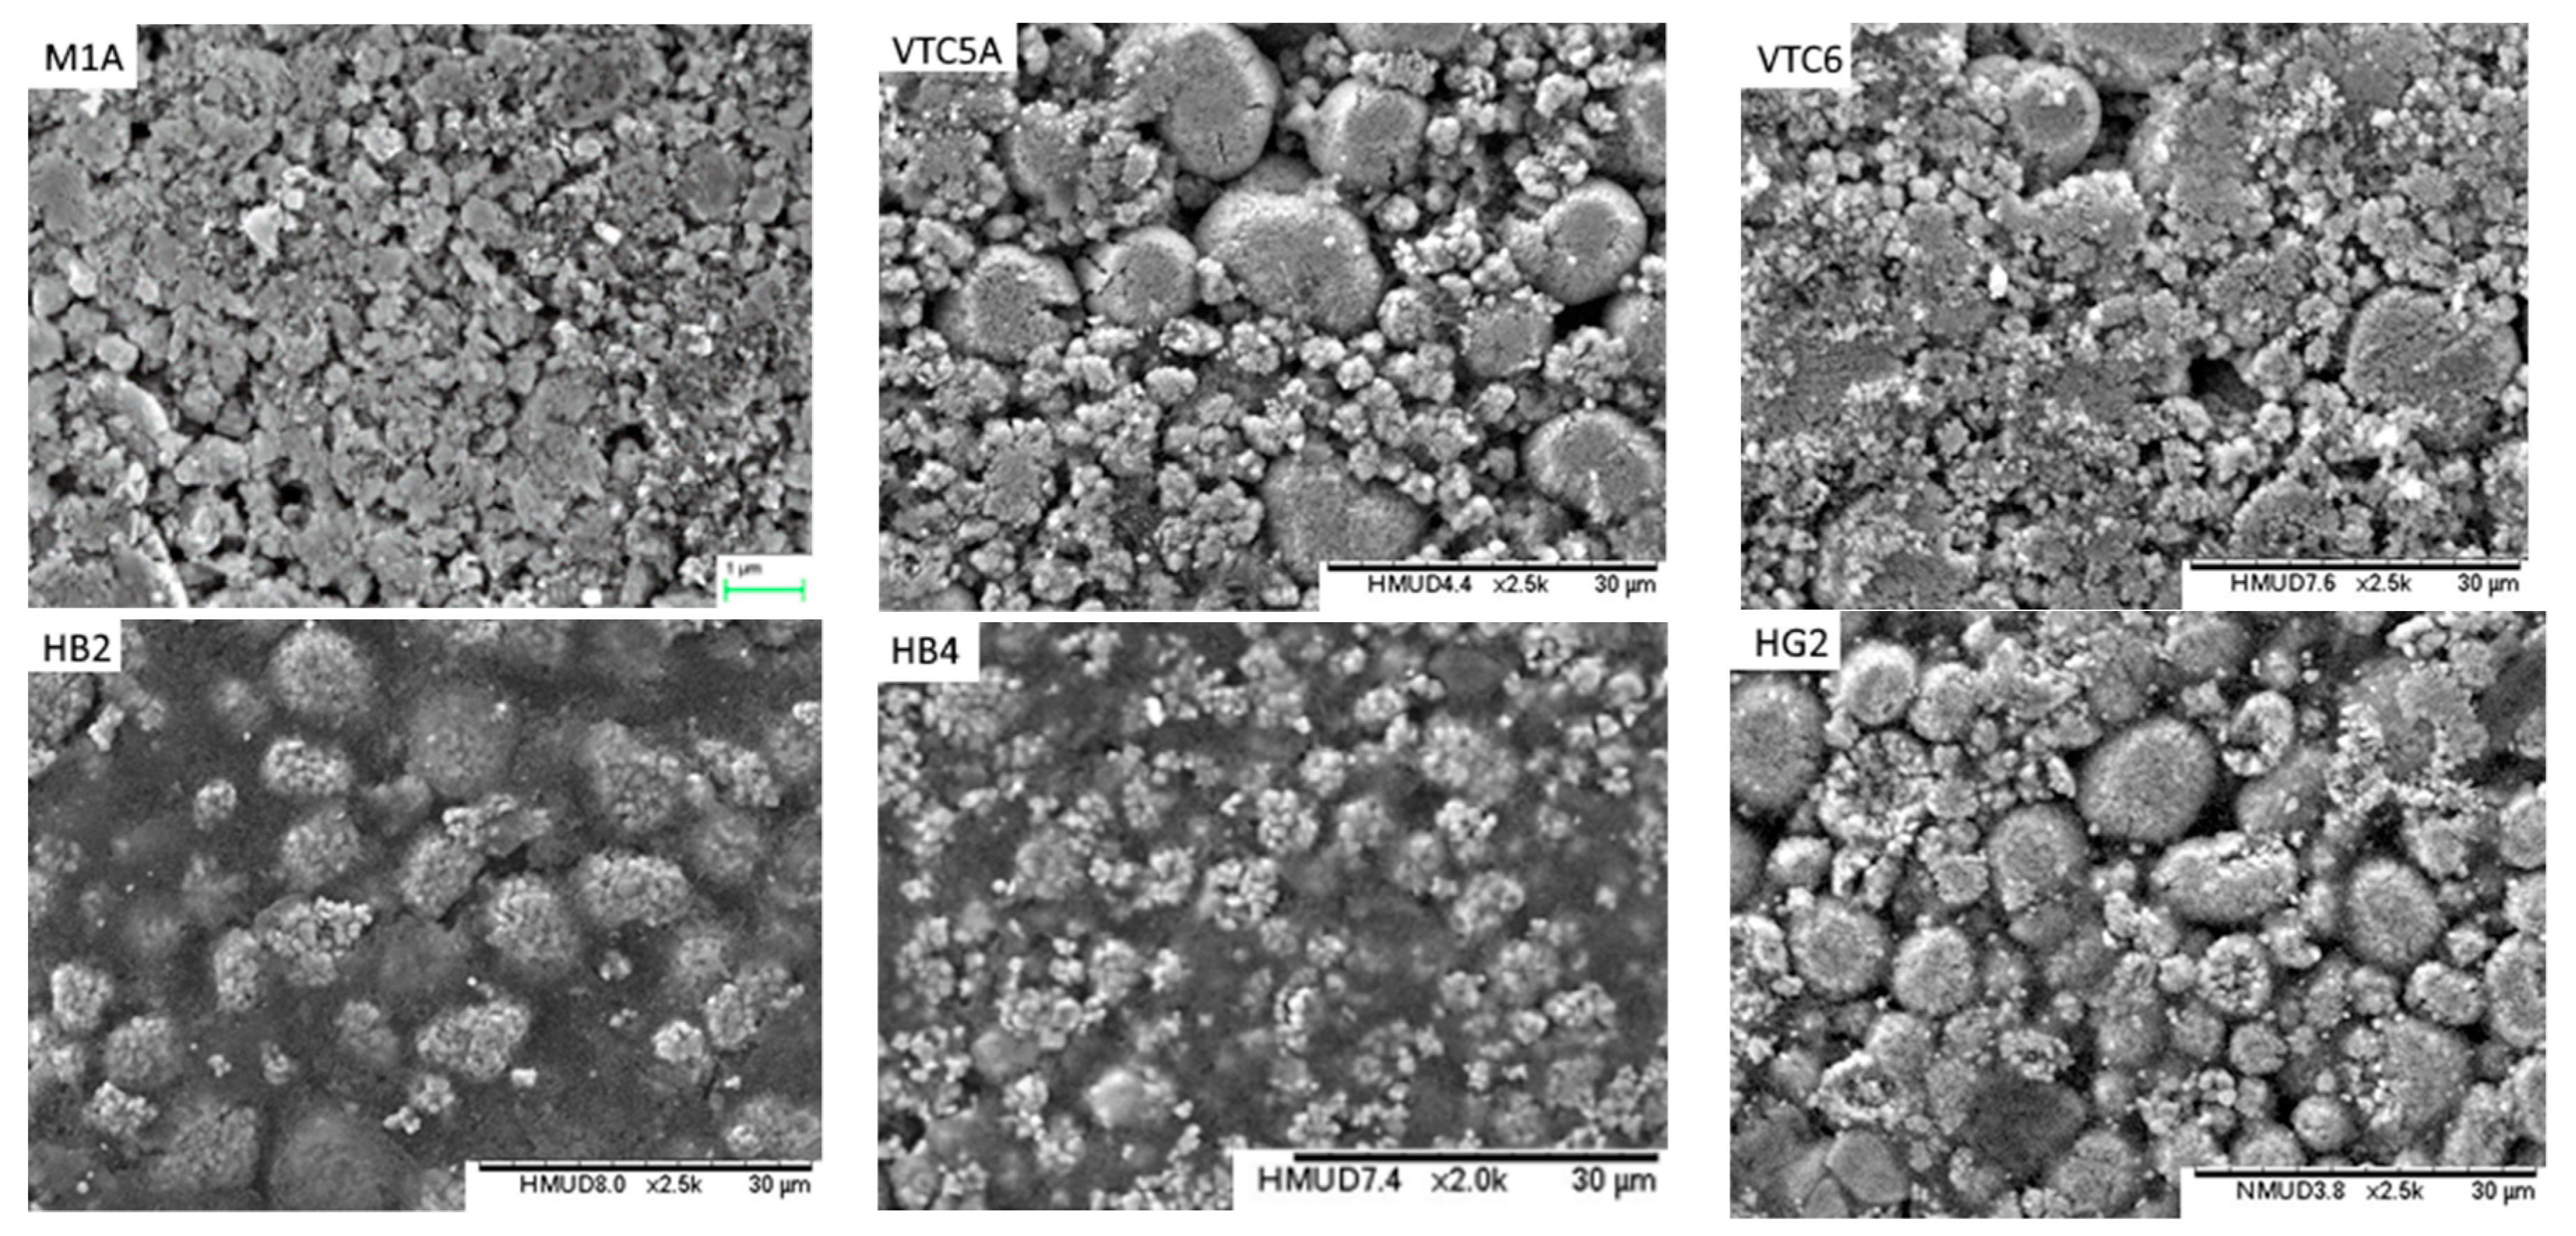
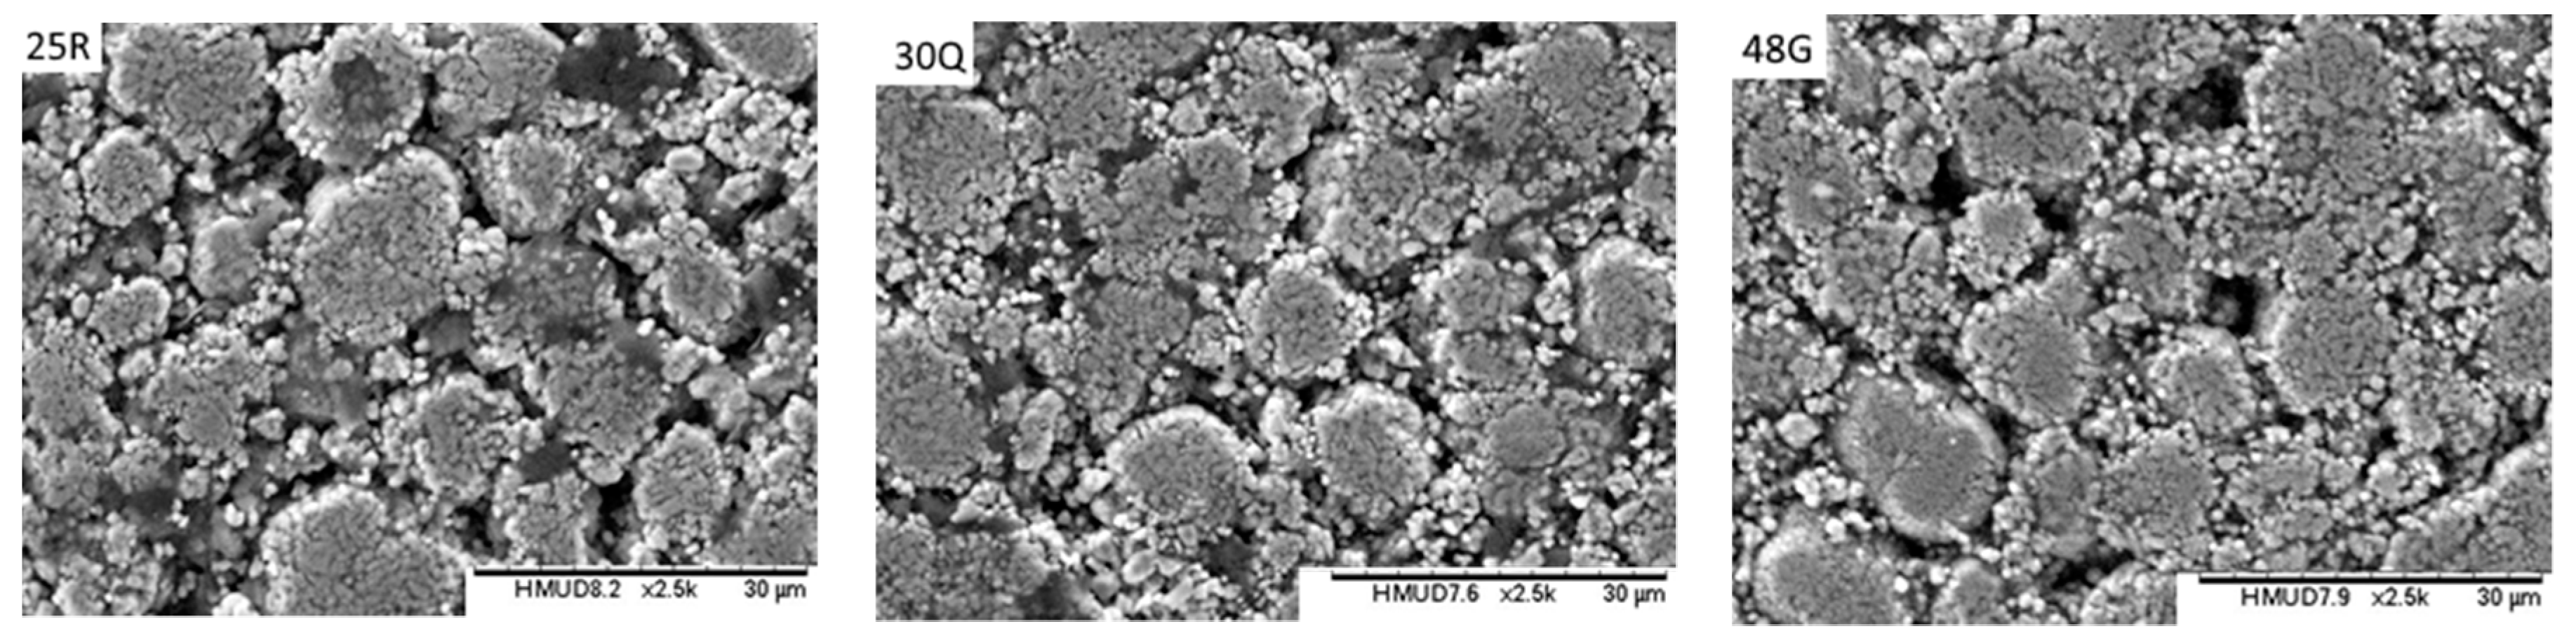
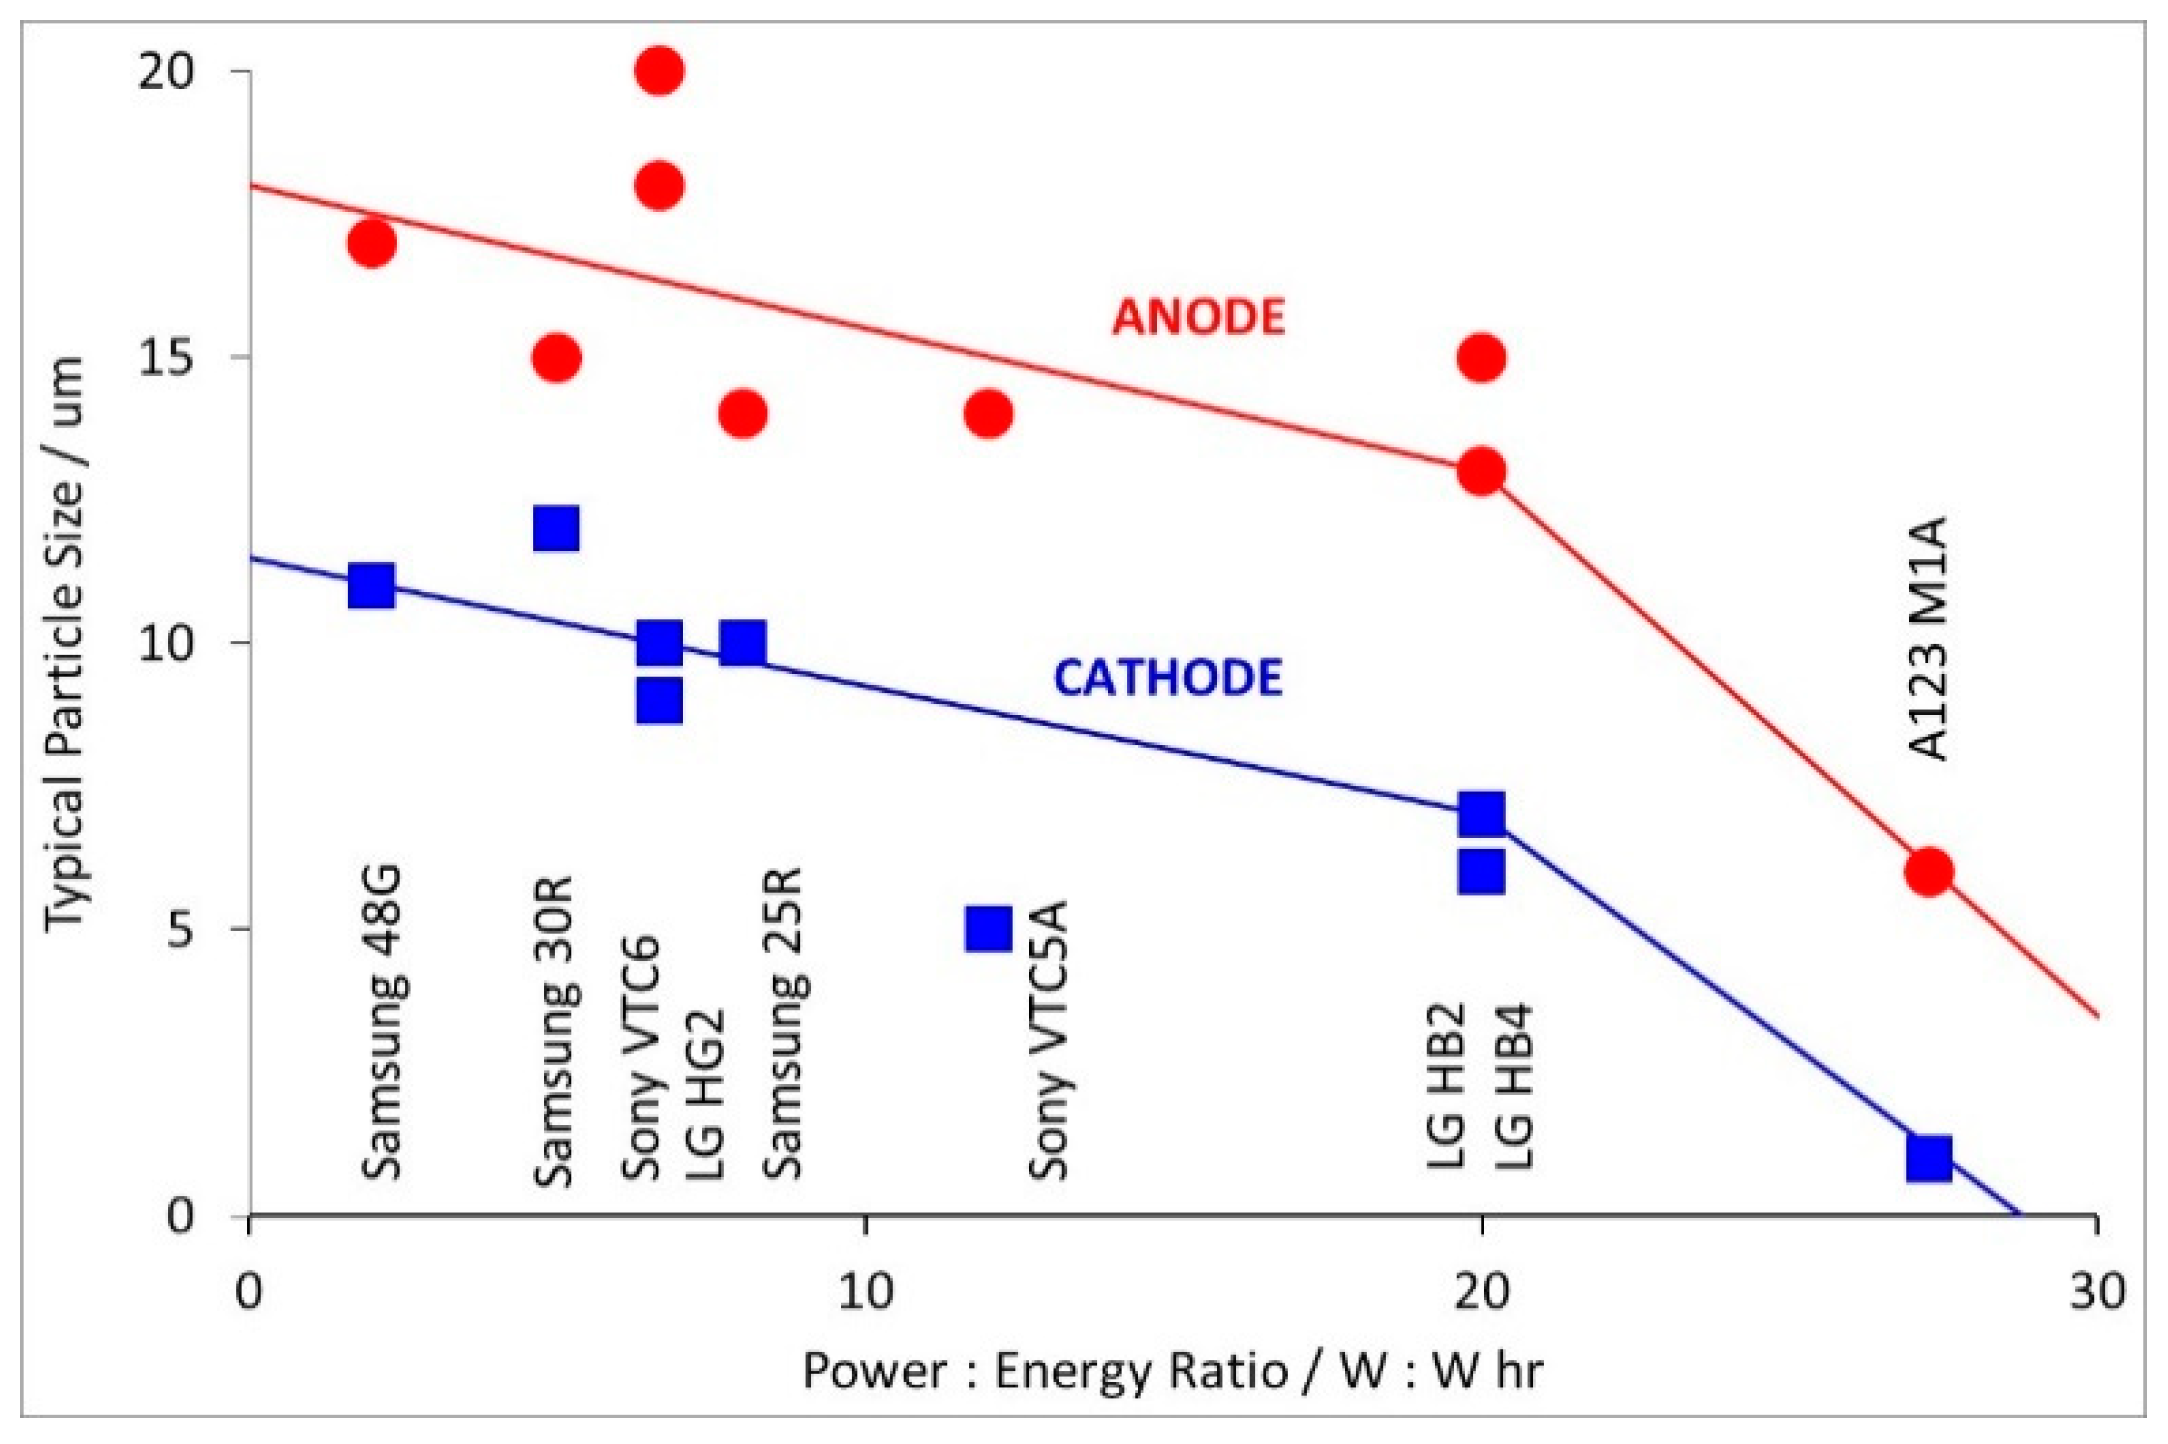
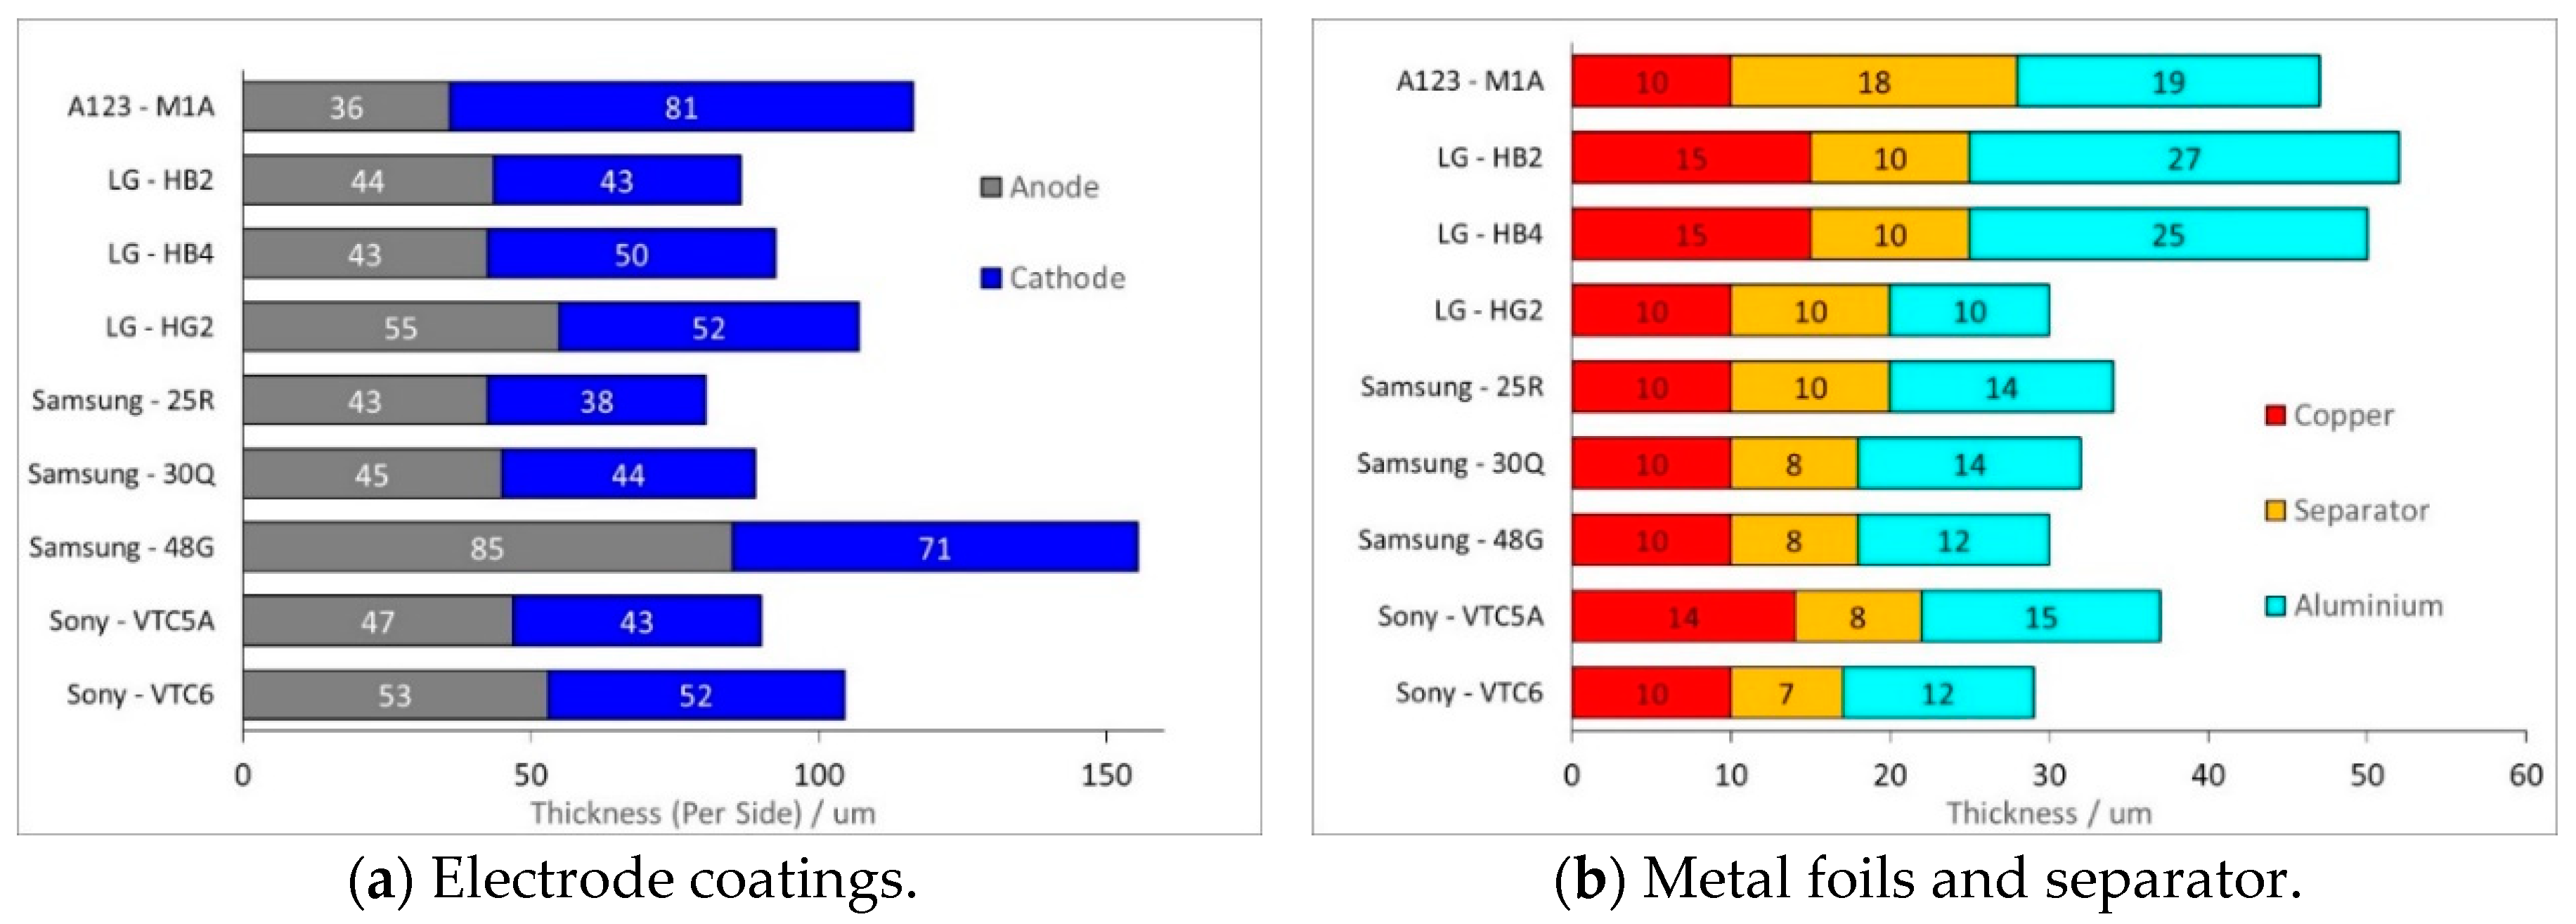
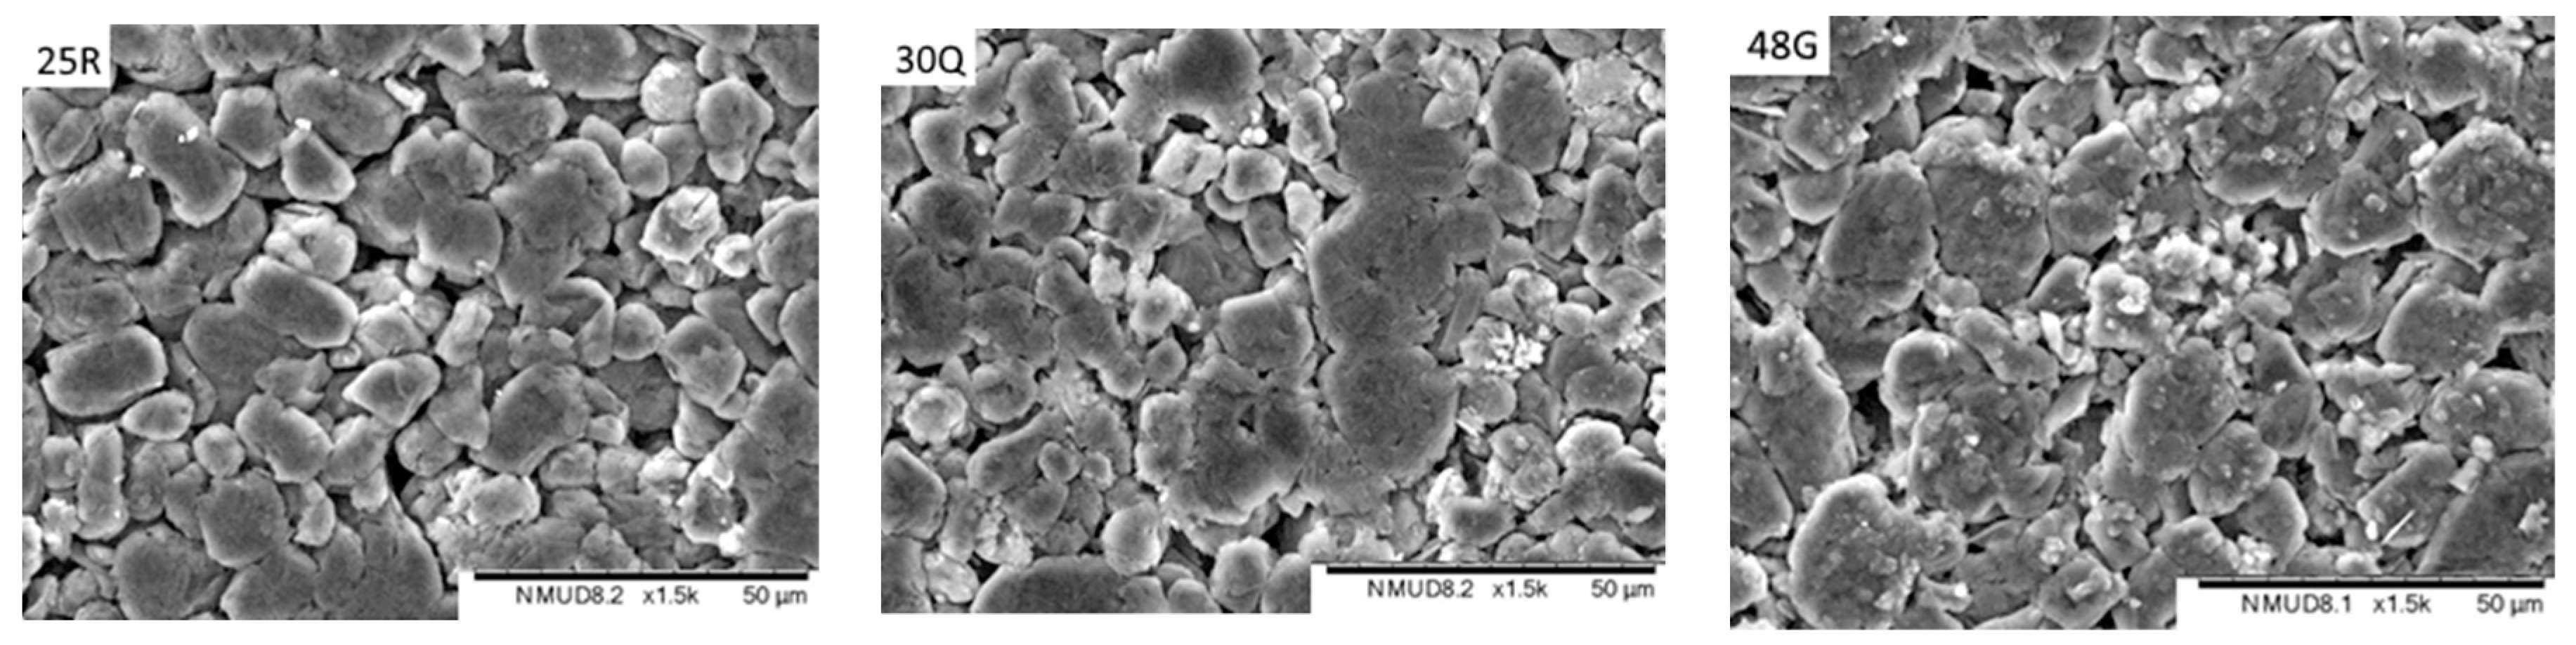
- Electrodes. Higher power density is achieved by using lower coat weights, lower areal capacities, smaller active particles and higher cathode porosities. All the electrodes appeared to be heavily calendared.
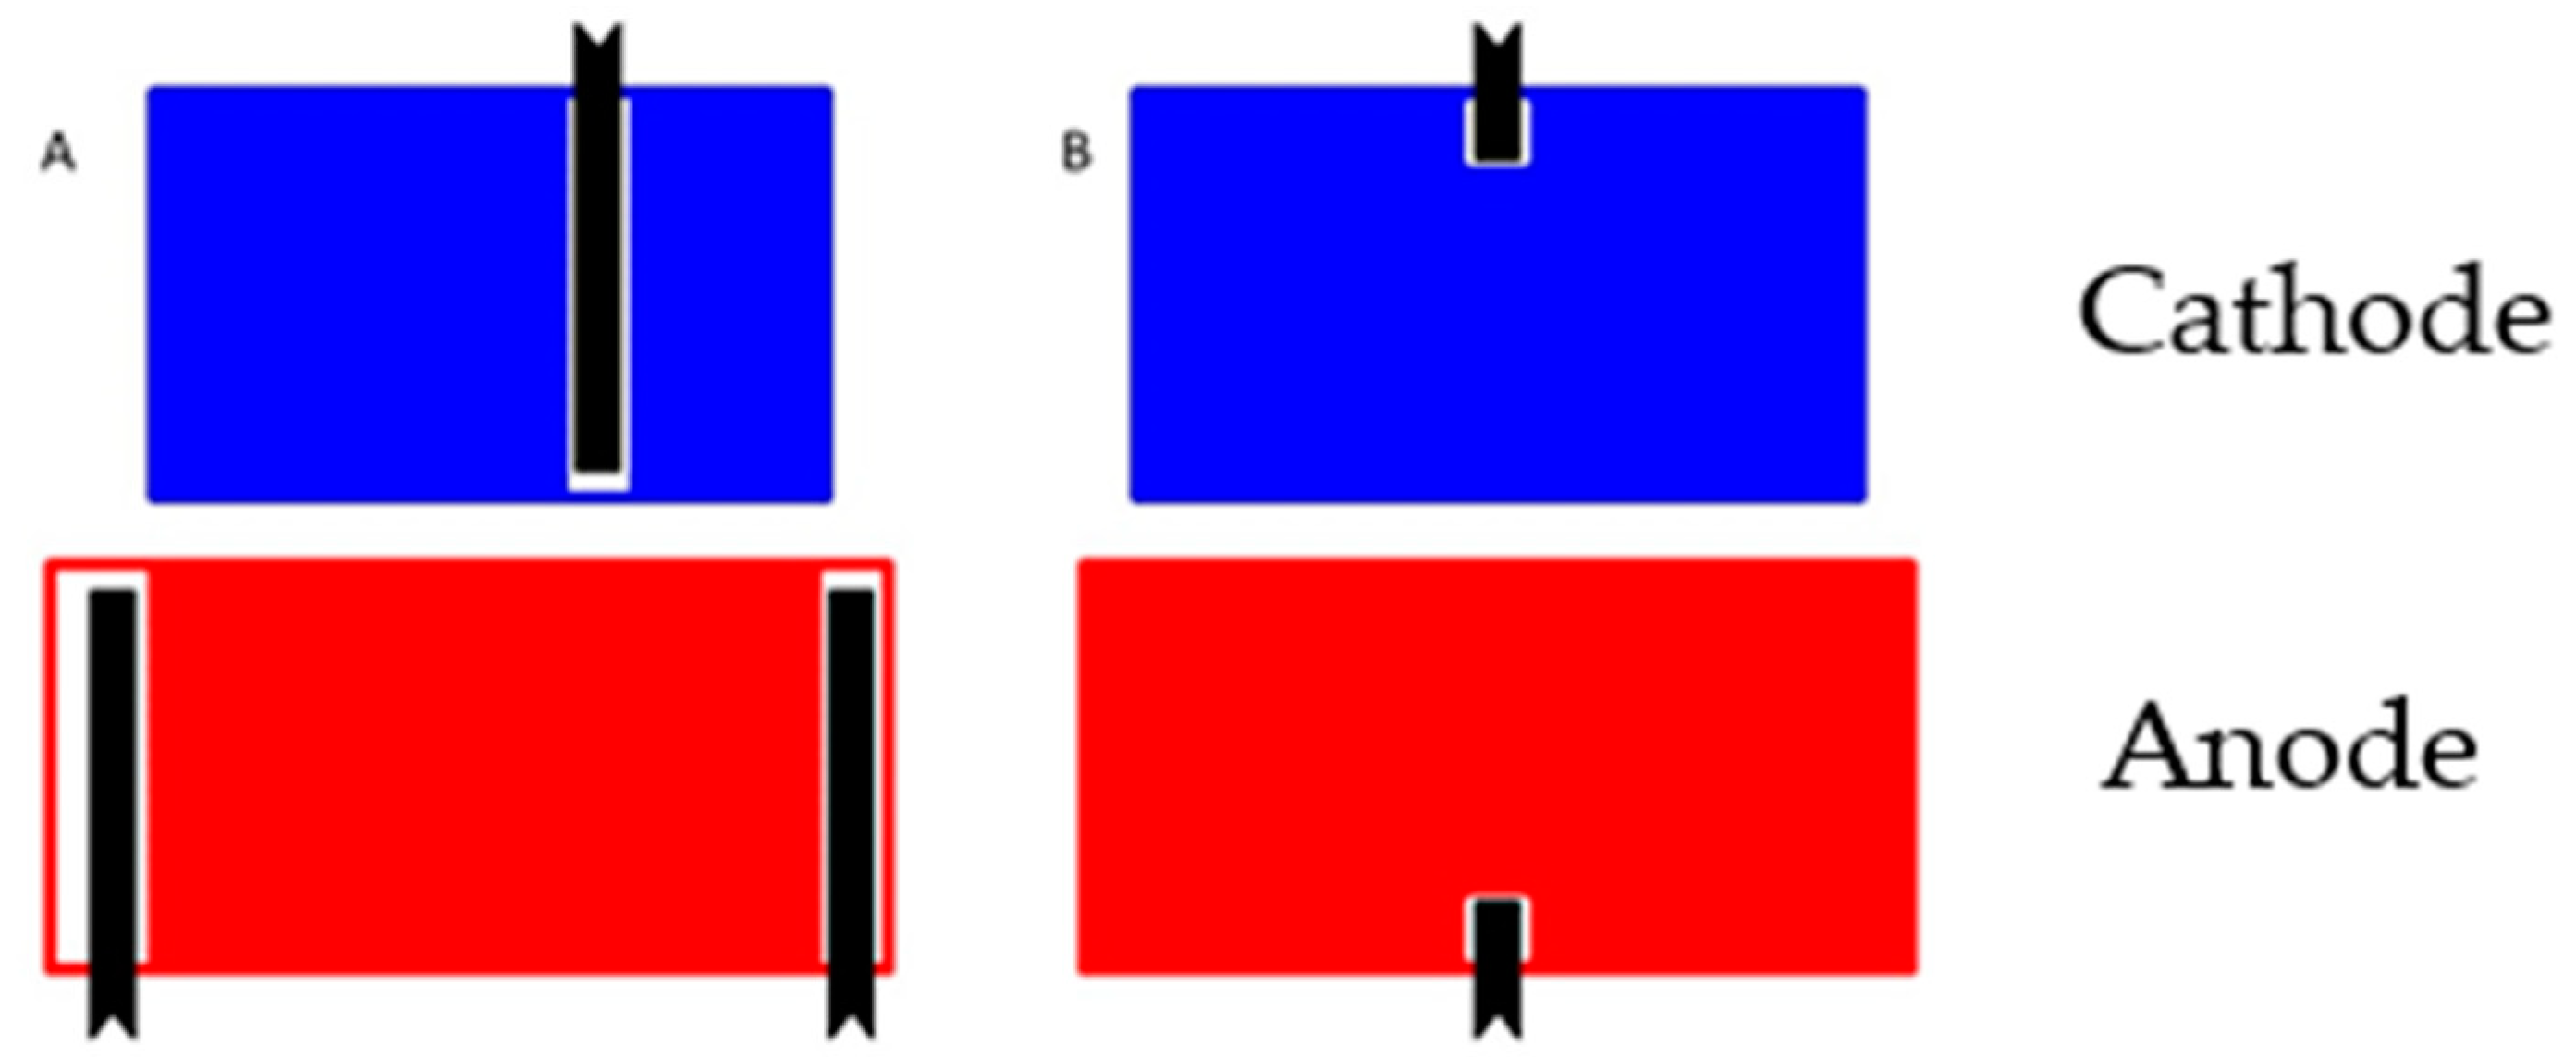
- Tag Configuration. It was expected that high power cells would use more tags, but eight out of nine cells used the same three tag configuration. The exception was the high power A123 M1A cell, which had just two symmetrically located tags.
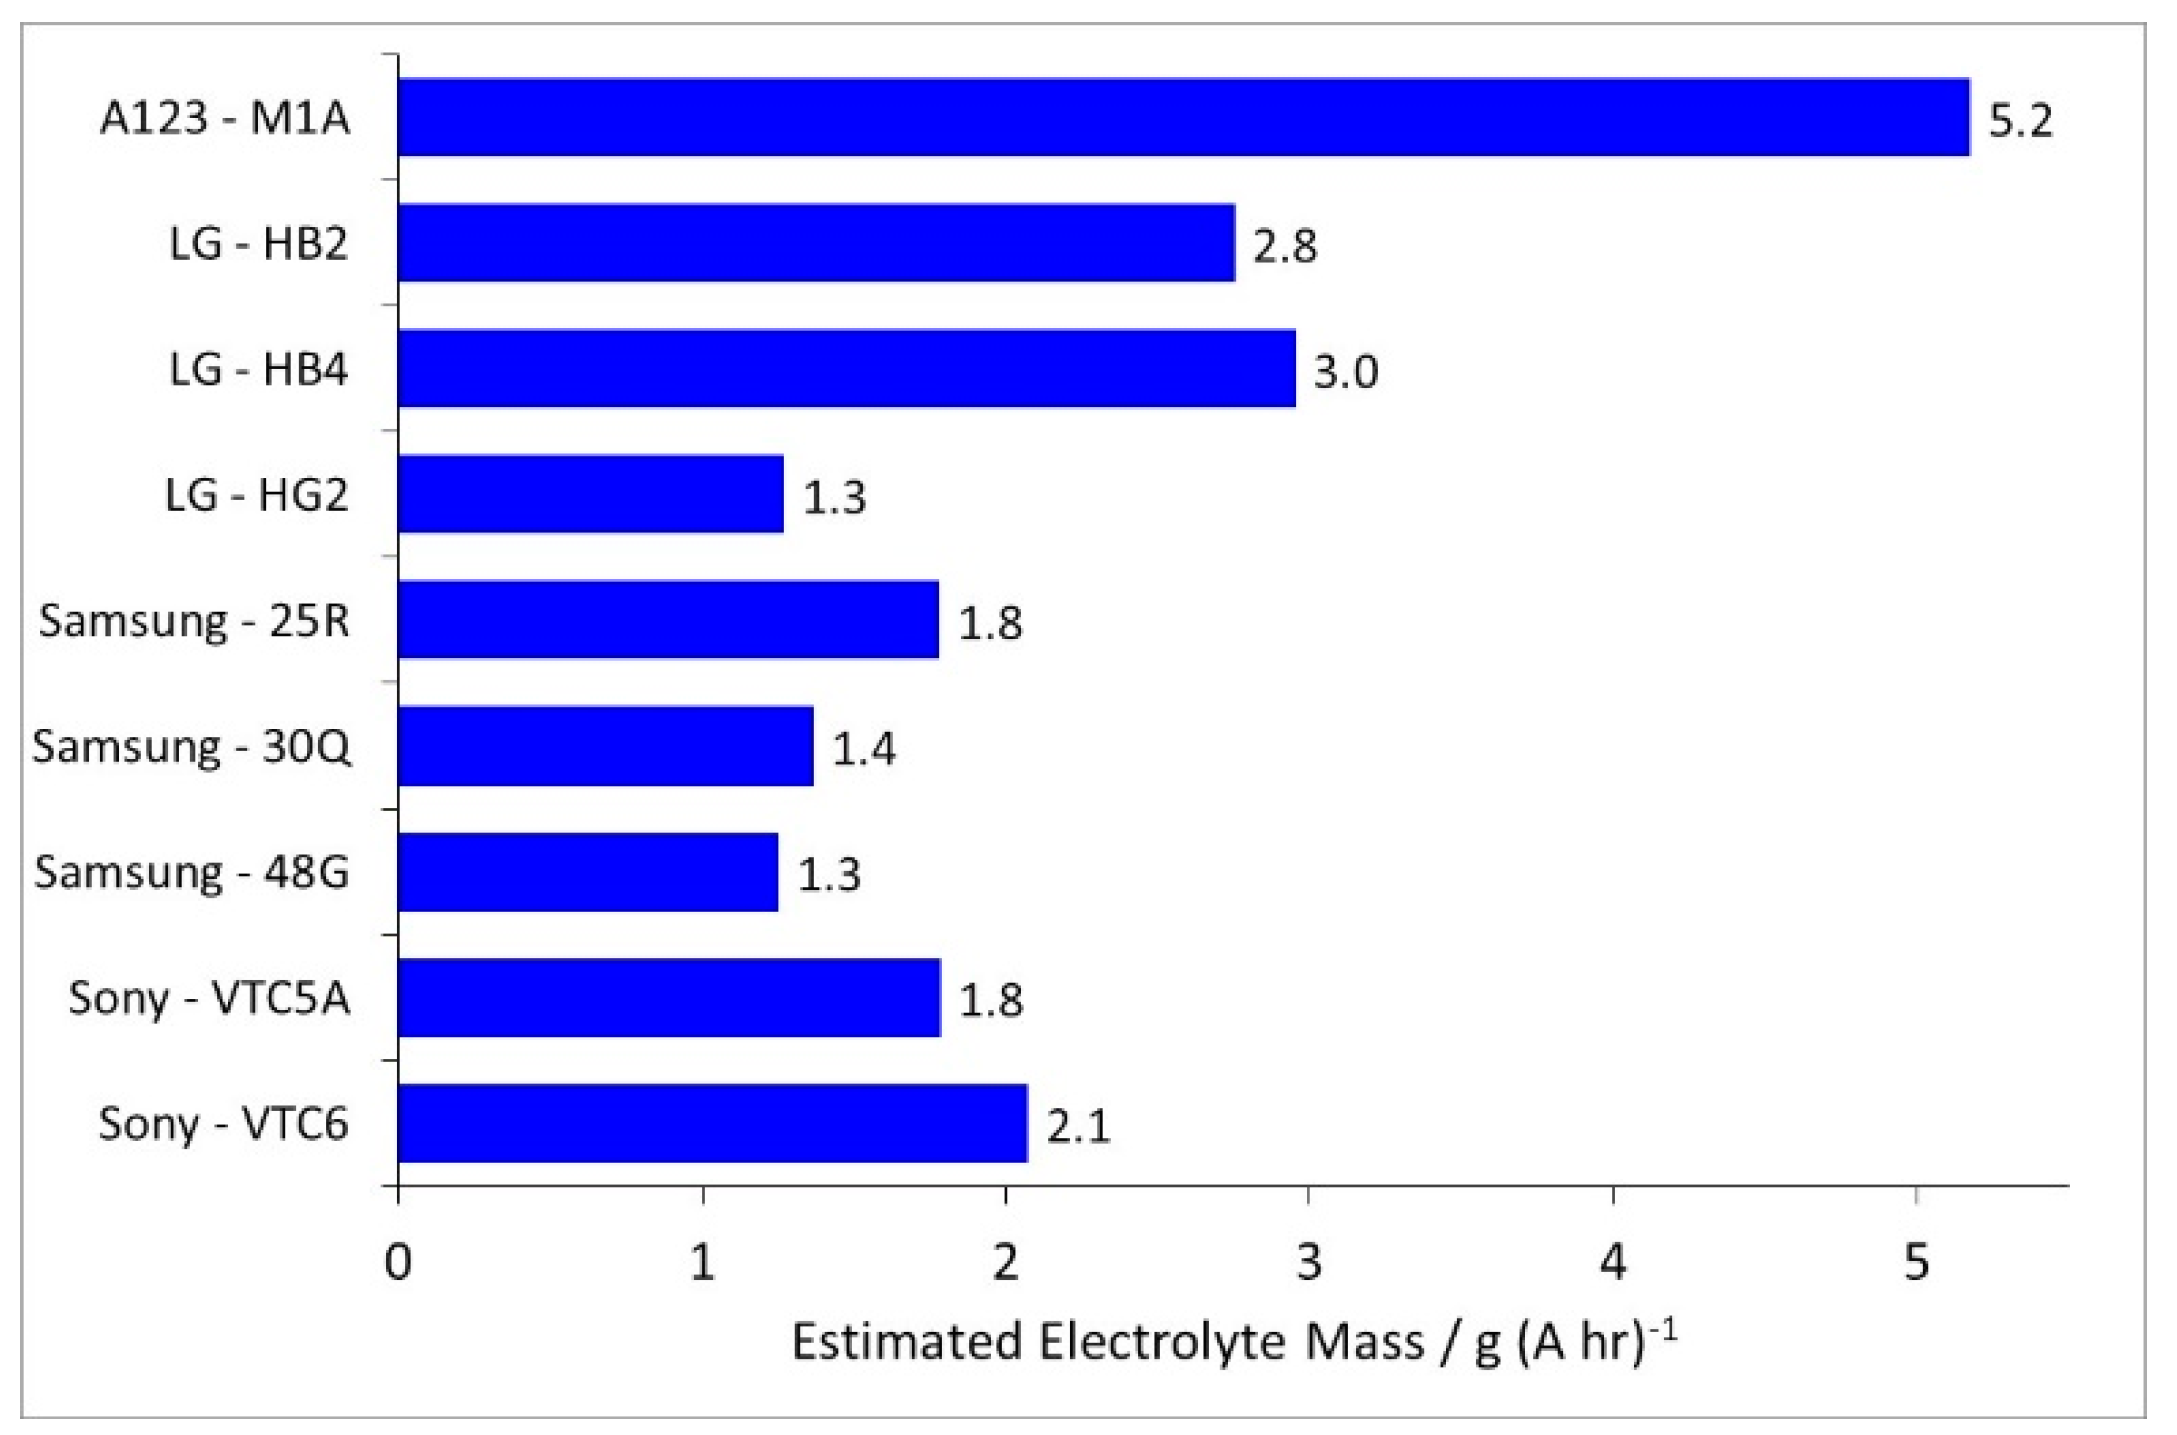
- Separators. Thinner separators benefit both energy density and power density. Manufacturers have been reducing the thickness of their separators, while still maintaining safety. The separators selected seem to be the best available at the time the cell was designed.
- Current Collectors. The thicknesses did not follow any design trend, but were also related to the availability of components at the point of design. However, the high power Sony VTC5A cell had thicker current collectors and tags than the high energy Sony VTC6 cell, despite being designed in the same year.
4. Materials and Methods
Supplementary Materials
Author Contributions
Funding
Conflicts of Interest
References
- Chu, A.; Braatz, P. Comparison of commercial super-capacitors and high power lithium ion batteries for power assist applications in hybrid electric vehicles I. Initial characterization. J. Power Sources 2002, 112, 236–246. [Google Scholar] [CrossRef]
- Burke, A.; Miller, M. The power capability of ultra-capacitors and lithium batteries for electric and hybrid vehicle applications. J. Power Sources 2011, 196, 514–522. [Google Scholar] [CrossRef]
- Quinn, J.B.; Waldmann, T.; Richter, K.; Kasper, M.; Wohlfahrt-Mehrens, M. Energy density of cylindrical lithium in cells: A comparison of commercial 18650 to 21700 cells. J. Electrochem. Soc. 2018, 165, 3284–3291. [Google Scholar] [CrossRef]
- Gallagher, K.G.; Nelson, P.A.; Dees, D.W. Simplified calculation of the area specific impedance for battery design. J. Power Sources 2011, 196, 2289–2297. [Google Scholar] [CrossRef]
- Zheng, H.; Li, J.; Song, X.; Liu, G.; Battaglia, V.S. A comprehensive understanding of electrode thickness effects on the electrochemical performance of lithium ion battery cathodes. Electrochim. Acta 2012, 71, 258–265. [Google Scholar] [CrossRef]
- Datasheet. High Power Lithium Ion APR18650M1A. 2009. Available online: https://www.batteryspace.com/prod-specs/6612.pdf (accessed on 25 September 2019).
- Datasheet. Technical Information of LG18650HB2 (1.5 Ah). 2011. Available online: https://telit.co.rs/PDFDokumenti/Li-Ion/LG18650HB2.pdf (accessed on 25 September 2019).
- Datasheet. Product Specification of ICR18650HB4 (1.5 Ahr). 2011. Available online: http://queenbattery.com.cn/our-products/187-lg-hb2-inr18650hb2-186501500mah-10a-37v-li-ion-battery-cell.html (accessed on 25 September 2019).
- Datasheet. Technical Information of LG18650HG2 (3.0 Ah). 2014. Available online: http://enerpower.de/wp/wp-content/uploads/2016/03/Specification_LGC_18650HG2.pdf (accessed on 25 September 2019).
- Datasheet. Introduction of INR18650-25R. 2013. Available online: https://www.powerstream.com/p/INR18650-25R-datasheet.pdf (accessed on 25 September 2019).
- Datasheet. Introduction of INR18650-30Q. 2014. Available online: http://enerpower.de/wp/wp-content/uploads/2016/03/Technical_Information_INR18650-30Q.pdf (accessed on 25 September 2019).
- Datasheet. Tentative Product Specification for INR21700-48G. 2015. Available online: https://www.imrbatteries.com/content/samsung_48G.pdf (accessed on 25 September 2019).
- Datasheet. Technical Information for US18650VTC5A. 2015. Available online: http://enerpower.de/wp/wp-content/uploads/2016/04/Specification-US18650VTC5A.pdf (accessed on 25 September 2019).
- Datasheet. Technical Information for US18650VTC6. 2015. Available online: http://enerpower.de/wp/wp-content/uploads/2016/10/Specification-US18650VTC6.pdf (accessed on 25 September 2019).
- Petzl, M.; Danzer, M.A. Non-destructive detection, characterisation and quantification of lithium plating in commercial lithium ion cells. J. Power Sources 2014, 254, 80–87. [Google Scholar] [CrossRef]
- Khakhalev, A.D. Collector Plate for Energy Storage Device and Methods of Manufacturing. U.S. Patent 9,805,877, 31 October 2017. [Google Scholar]
- Chiang, Y.-M.; Chu, A.C.; Jang, Y.-I.; Meethong, N.; Kao, Y.-H.; Riley, G.N.; Pullen, A.E.; Thomas-Alyea, K.E. Multi-Functional Mixed Metal Olivines for Lithium Ion Batteries. U.S. Patent 9,509,019, 29 November 2016. [Google Scholar]
- Landesfeind, J.; Hattendorff, J.; Ehrl, A.; Wall, W.A.; Gasteiger, H.A. Tortuosity determination of battery electrodes and separators by impedance spectroscopy. J. Electrochem. Soc. 2016, 163, A1373–A1387. [Google Scholar] [CrossRef]
- Lee, S.-M.; Jeong, G.-J.; Kim, S.-S.; Nitta, W. Negative Active Materials for a Rechargeable Lithium Battery, a Method of Preparing the Same, and a Rechargeable Lithium Battery Comprising the Same. U.S. Patent 9,012,082, 21 April 2015. [Google Scholar]
- Kim, K.W.; Park, H.; Lee, J.G.; Kim, J.; Kim, Y.-U.; Ryu, J.H.; Kim, J.J.; Oh, S.M. Capacity variation of carbon coated silicon monoxide negative electrode for lithium ion batteries. Electrochim. Acta 2013, 103, 226–230. [Google Scholar] [CrossRef]
- Song, Y.-M.; Hong, M.-Z.; Kim, J.-H.; Park, D.-H.; Kim, M.-H.; Moon, J.-H.; Park, H.-E.; Kim, K.-H.; Kim, D.-J.; Choi, J.-J.; et al. Composite Cathode Active Material, Lithium Battery Including the Same, and Method of Preparing the Same. U.S. Patent 9,991,511, 5 June 2018. [Google Scholar]
- Kim, Y.; Kim, H.S.; Martin, S.W. Synthesis and electrochemical characteristics of Al2O3 coated NCM cathode materials for lithium ion batteries. Electrochim. Acta 2006, 52, 1316–1322. [Google Scholar] [CrossRef]
- Yang, C.-M.; Masahiro, K.; Kim, S.-H. Positive Active Materials and Positive Electrode for Rechargeable Lithium Battery, and Rechargeable Lithium Battery Including the Positive Electrode. U.S. Patent 8,703,339, 22 April 2014. [Google Scholar]


| Component | Energy Density | Power Density |
|---|---|---|
| Electrodes | High coat weights | Low coat weights |
| Low coating porosity | High coating porosity | |
| Medium + large particle sizes | Small + medium particle sizes | |
| Low conductive carbon content | High conductive carbon content | |
| Minimum possible binder content | ||
| Current collectors | Thinner | Thicker |
| Coated to improve adhesion | Coated to reduce resistance | |
| Separator | Thin | Thin |
| Electrolyte | High conductivity | High conductivity |
| Connection tags | Thin/narrow tags | Thick/wide tags |
| Single tag on each electrode | Multiple tags |
| Manufacturer | Model | Size | Discharge Capacity/A hr | Discharge Energy/W hr |
|---|---|---|---|---|
| A123 | M1A | 18650 | 1.011 | 3.28 |
| LG | HB2 | 18650 | 1.526 | 5.65 |
| LG | HB4 | 18650 | 1.535 | 5.71 |
| LG | HG2 | 18650 | 3.021 | 11.01 |
| Samsung | 25R | 18650 | 2.569 | 9.46 |
| Samsung | 30Q | 18650 | 3.089 | 11.23 |
| Samsung | 48G | 21700 | 4.838 | 17.76 |
| Sony | VTC5A | 18650 | 2.560 | 9.36 |
| Sony | VTC6 | 18650 | 3.163 | 11.52 |
| Manufacturer | Model | Weight/g | Volume/cm3 | Cathode/cm2 | Energy Density | Power Density | ||
|---|---|---|---|---|---|---|---|---|
| /W hr kg−1 | /W hr L−1 | /kW kg−1 | /kW L−1 | |||||
| A123 | M1A | 39.8 | 17.0 | 794 | 83 | 193 | 2.5 | 5.7 |
| LG | HB2 | 43.1 | 16.8 | 848 | 131 | 336 | 2.6 | 6.6 |
| LG | HB4 | 43.1 | 16.7 | 778 | 132 | 342 | 2.6 | 6.7 |
| LG | HG2 | 44.8 | 17.0 | 929 | 246 | 647 | 1.6 | 4.3 |
| Samsung | 25R | 43.8 | 17.0 | 1036 | 216 | 556 | 1.7 | 4.3 |
| Samsung | 30Q | 45.8 | 17.1 | 1032 | 245 | 657 | 1.2 | 3.2 |
| Samsung | 48G | 67.4 | 24.8 | 989 | 263 | 717 | 0.5 | 1.4 |
| Sony | VTC5A | 47.9 | 16.9 | 1024 | 196 | 552 | 2.3 | 6.5 |
| Sony | VTC6 | 46.9 | 17.3 | 952 | 246 | 665 | 1.6 | 4.2 |
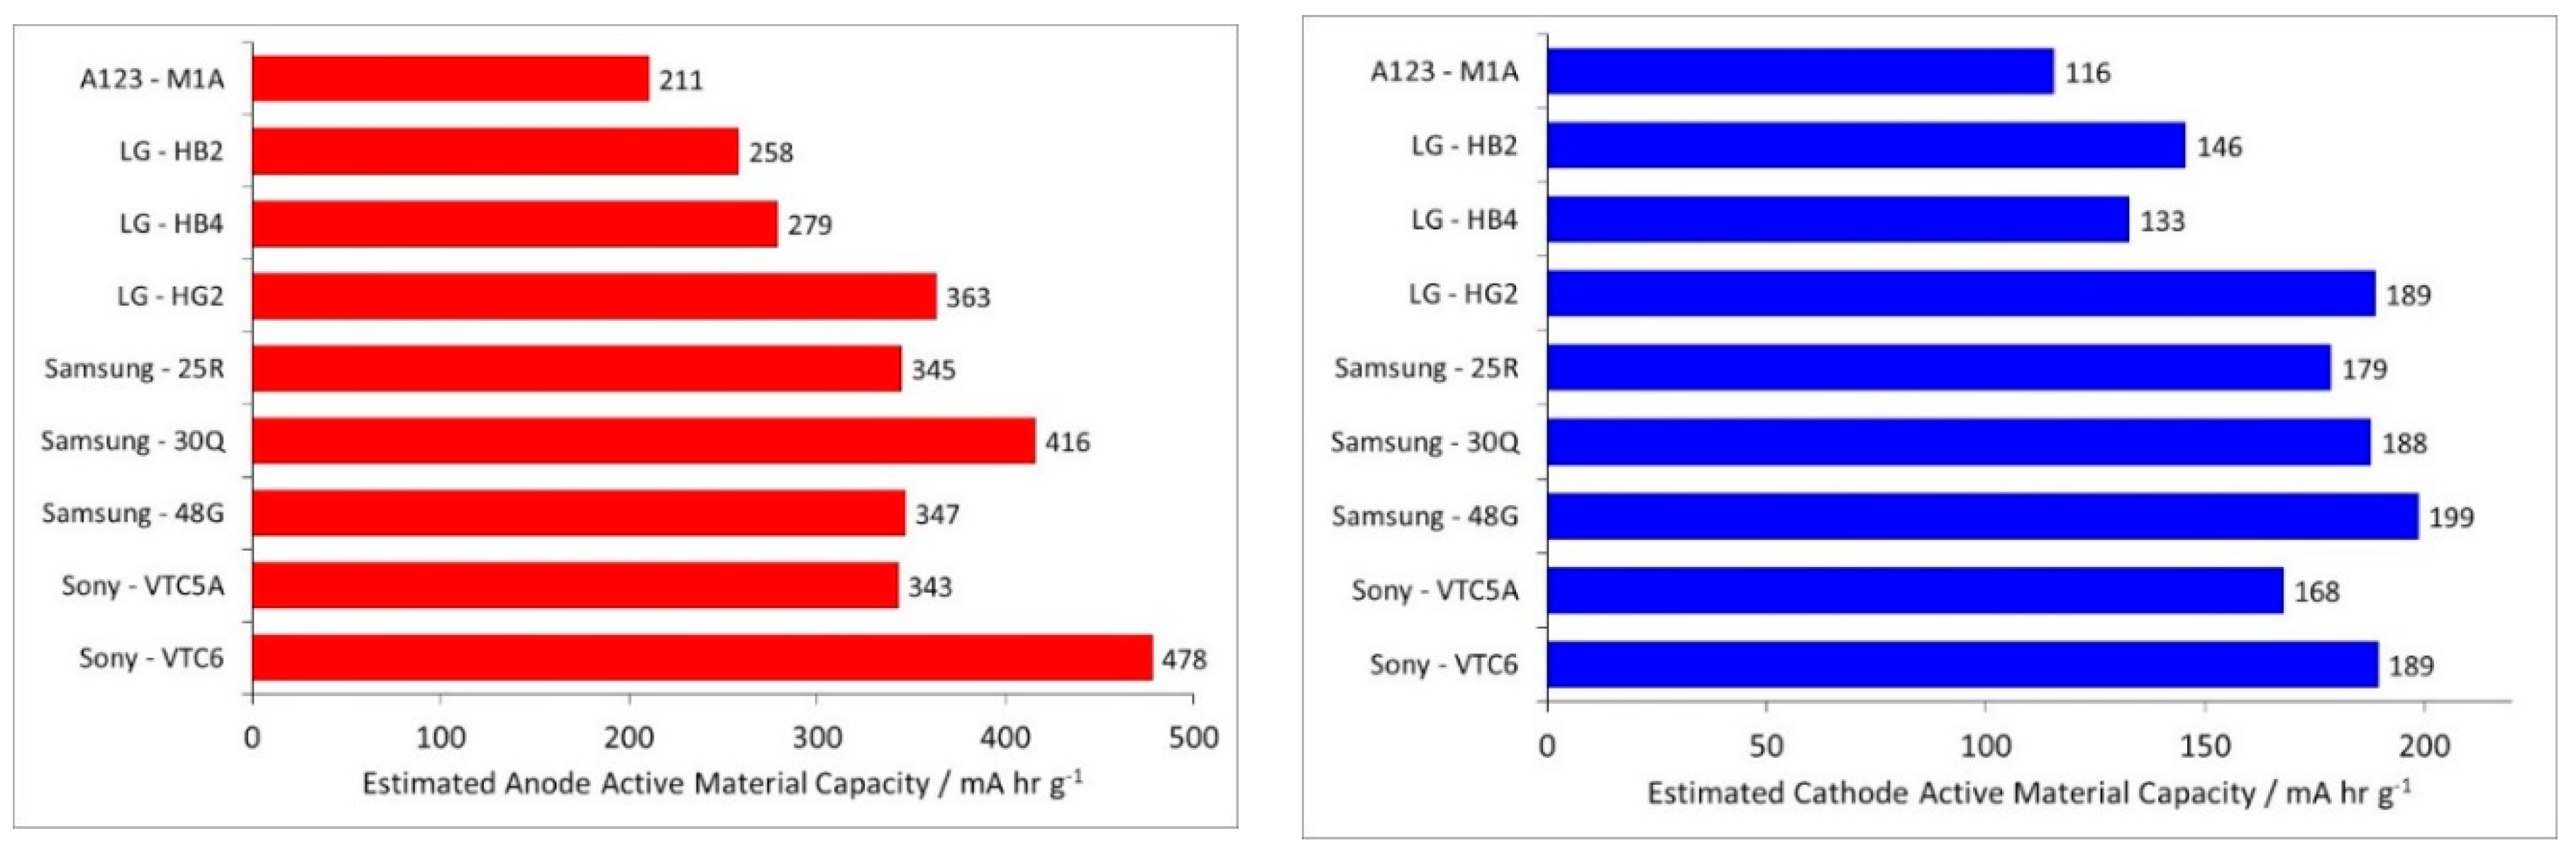
| Manufacturer | Model | Anode | Cathode |
|---|---|---|---|
| A123 | M1A | Graphite | LiFePO4 |
| LG | HB2 | Graphite | NMC-532 |
| LG | HB4 | Graphite | NMC-111 |
| LG | HG2 | Graphite + Si | NMC-811 |
| Samsung | 25R | Graphite + Si | NCA & NMC-622 |
| Samsung | 30Q | Graphite + Si | NCA |
| Samsung | 48G | Graphite + Si | NCA |
| Sony | VTC5A | Graphite + Si | NCA |
| Sony | VTC6 | Graphite + Si | NCA |
© 2019 by the authors. Licensee MDPI, Basel, Switzerland. This article is an open access article distributed under the terms and conditions of the Creative Commons Attribution (CC BY) license (http://creativecommons.org/licenses/by/4.0/).
Share and Cite
Lain, M.J.; Brandon, J.; Kendrick, E. Design Strategies for High Power vs. High Energy Lithium Ion Cells. Batteries 2019, 5, 64. https://doi.org/10.3390/batteries5040064
Lain MJ, Brandon J, Kendrick E. Design Strategies for High Power vs. High Energy Lithium Ion Cells. Batteries. 2019; 5(4):64. https://doi.org/10.3390/batteries5040064
Chicago/Turabian StyleLain, Michael J., James Brandon, and Emma Kendrick. 2019. "Design Strategies for High Power vs. High Energy Lithium Ion Cells" Batteries 5, no. 4: 64. https://doi.org/10.3390/batteries5040064
APA StyleLain, M. J., Brandon, J., & Kendrick, E. (2019). Design Strategies for High Power vs. High Energy Lithium Ion Cells. Batteries, 5(4), 64. https://doi.org/10.3390/batteries5040064