1. Introduction
The rapid growth of renewable energy systems and the progressive electrification of transportation have intensified the need for efficient and sustainable energy storage solutions [
1]. In this context, hybrid energy storage systems (HESS), combining second-life batteries (SLBs) and supercapacitors (SCs), have emerged as a promising alternative for balancing both energy and power requirements [
2]. While SLBs provide high energy density at reduced cost, their performance is often limited by aging and degradation. In contrast, SCs offer high power density, fast dynamic response, and long life cycles, making them particularly suitable for handling power transients to reduce stress on batteries [
3,
4,
5]. As a result, integrating SCs within HESS architectures improves system efficiency, reliability, and lifetime, especially in applications with highly fluctuating power profiles.
Accurate characterization and continuous monitoring of these energy storage components are essential for ensuring proper system operation. In particular, SCs exhibit strongly frequency-dependent behavior due to internal resistive, capacitive, and diffusion-related phenomena. Those characteristics evolve with aging and operating conditions, making their dynamic characterization necessary for performance evaluation, control design, and health monitoring [
6].
Several techniques have been traditionally used for SC characterization. Equivalent series resistance (ESR) measurements provide a simple and fast estimation of internal resistance; however, it is limited to single-frequency characterization [
7,
8]. Constant current charge–discharge tests offer a more comprehensive evaluation of the device response, but it is inherently slow and unsuitable for real-time applications [
9,
10]. Cyclic voltammetry enables electrochemical analysis under controlled conditions, yet its implementation is typically restricted to laboratory environments [
11,
12].
In contrast, impedance spectroscopy (IS) has been widely recognized as one of the most powerful techniques for characterizing energy storage devices, since it provides frequency-domain information over a wide range, capturing resistive, capacitive, and diffusion-related effects [
13,
14]. A comparative summary of these techniques is presented in
Table 1, which shows that conventional techniques present a trade-off between implementation simplicity and the level of information provided. In this context, the term in situ refers to the capability of performing the diagnostic directly at the point of operation, without disconnecting the device from the system or interrupting its normal operation. While simpler methods are easier to implement, they fail to capture the frequency-dependent behavior of SCs and are typically limited in their in situ applicability. In contrast, IS provides a comprehensive characterization, but its practical deployment is limited.
In most cases, IS is implemented using frequency response analyzers (FRAs), which require specialized instrumentation and controlled laboratory conditions [
15]. This restricts its applicability for in situ and real-time diagnostics in practical energy systems. Consequently, alternative approaches are required to preserve the advantages of IS while enabling its integration into real operating environments. Some alternatives have been proposed based on time-domain measurements, where voltage and current signals obtained under non-sinusoidal excitations are transformed into the frequency domain using Fourier analysis [
16]. Although these methods can reproduce impedance spectra with acceptable accuracy, they still rely on controlled experimental setups and are not well suited for embedded or real-time applications.
To interpret IS results, SCs are commonly described using equivalent circuit models (ECMs), which reproduce their dynamic behavior across different time and frequency scales [
14]. Several models have been widely adopted, including ESR [
17,
18], ladder (multi-RC) [
19,
20], Zubieta [
21,
22], transmission line model (TLM) [
6,
23], and Warburg-based representations. A comparison of these modeling approaches is presented in
Table 2. The models are evaluated according to their type, complexity, suitability for IS, and usability. Here, complexity refers to the number of parameters and states involved in model formulation and identification; IS suitability indicates the ability of the model to reproduce the frequency-dependent impedance behavior of SCs; and usability reflects the complexity of parameter extraction, numerical implementation, and integration into diagnostic or control-oriented applications. The comparison shows that high-fidelity models are generally required to accurately represent the frequency-dependent behavior of SCs. Among them, Warburg-based models such as the WE-RLC representation provide a suitable balance between modeling accuracy and usability, as they capture diffusion-related effects relevant to IS while avoiding the higher parameter burden and implementation complexity associated with fully distributed models such as the TLM [
14,
24].
In practical systems, power electronic converters act as the interface between energy storage devices and the rest of the system [
25,
26]. Recent works have explored the use of converters for diagnostic purposes, enabling the injection of perturbations and the measurement of the system response within the same platform for different energy conversion and storage systems [
27,
28,
29,
30,
31]. In those approaches, the converter is commonly used as an excitation interface, where perturbations are introduced through variables such as the duty cycle, current or voltage references, while the impedance is estimated from the measured voltage and current responses. Among the few contributions involving SCs and converter-based IS, the work in [
32] proposed an IS add-on system for EV dc fast-charging stations based on an SC module and a bidirectional flying-capacitor multilevel dc–dc converter. In that work, the SC-converter system is mainly conceived as an auxiliary excitation unit for battery impedance measurements, while the study focuses on the co-design and volume optimization of the SC module and the converter. Accordingly, the emphasis of that contribution is not the impedance characterization of the SC itself, but the compact integration of an IS excitation platform for EV charging infrastructure.
Based on the previous state-of-the-art discussion, existing SC diagnostic approaches exhibit complementary advantages and limitations. FRA-based IS provides accurate frequency-domain characterization, but it depends on dedicated laboratory instrumentation and is not well suited for direct integration into power electronics systems. Time-domain and simplified diagnostic methods are easier to implement, but they provide limited information about the frequency-dependent behavior of SCs. On the other hand, converter-based approaches have shown the potential of power electronics interfaces for diagnostic purposes; however, their use has mainly been oriented to other energy storage or conversion systems, or to auxiliary excitation platforms rather than a direct impedance characterization of the SC itself.
Motivated by these limitations in the current state of the art, a converter-based IS measurement methodology is proposed, focusing on the high-fidelity and online acquisition of the supercapacitor’s impedance spectrum without requiring an external FRA equipment. Although parameter identification and state-of-health (SOH) diagnostics are crucial for practical energy management, their accuracy is strictly dependent on the quality of the measured spectrum. Consequently, rather than proposing a new diagnostic or SOH estimation algorithm, this work focuses exclusively on addressing the fundamental physical and control challenges of utilizing the existing DC–DC converter as a precise, embedded excitation and measurement instrument for IS. In doing so, a reliable, high-quality data foundation is established, which is intended to facilitate and feed any subsequent parameter-fitting or health-monitoring algorithm. Specifically, the novel methodological features of this embedded tool are summarized as follows:
Analytical formulation for the duty-cycle amplitude: A frequency-dependent analytical expression is derived from the averaged small-signal model of the converter-SC system. This formulation calculates the required duty-cycle perturbation amplitude to impose a targeted, constant-amplitude current excitation at each frequency step, avoiding the typical trial-and-error approach found in conventional open-loop injections.
Current-amplitude regulation without a closed loop: By utilizing the proposed analytical inverse dynamics, the SC current amplitude is precisely regulated throughout the entire frequency sweep without a closed loop. This eliminates the need for complex, high-bandwidth closed-loop current controllers, which are mathematically demanding, prone to instability at high frequencies, and highly consuming of microcontroller resources.
Strict physical constraint and headroom mapping: A systematic framework is proposed to map the physical limitations of the converter (duty-cycle saturation boundaries and current headroom). This allows the pre-determination of the maximum safe current perturbation amplitude for a given frequency range, ensuring that small-signal conditions are strictly preserved, also preventing any waveform clipping at the frequency limits.
Software-based excitation integration: The proposed excitation strategy is designed as a lightweight, software-only implementation for standard digital controllers. By executing only the analytical amplitude calculation and the PWM modulation on the digital signal processor (DSP), the converter is transformed into an active excitation instrument without requiring dedicated signal generators or physical add-ons, minimizing the computational overhead on the primary controller.
To clearly differentiate this proposed embedded tool from existing converter-based impedance spectroscopy approaches in the literature,
Table 3 compares their key design features. Although converter-based IS has been widely investigated for batteries and fuel cells, its application targeting SCs as the primary device-under-test remains virtually unexplored. In the literature, where supercapacitors are integrated into converter-based diagnostic systems, they are utilized strictly as auxiliary energy buffers or active filtering elements within the excitation hardware to test batteries, rather than being the actual subject of the impedance characterization. Consequently, this work addresses this gap by focusing exclusively on the supercapacitor as the target storage device, successfully resolving the control, small-signal, and physical saturation challenges inherent to its highly dynamic behavior.
The effectiveness of the proposed methodology is validated through both simulation and experimental tests. In the simulation phase, the converter-based IS procedure is implemented in the professional power electronics simulator PSIM, which considers a synchronous Buck converter connected to a commercial SC. To evaluate the method’s capability to capture complex electrochemical dynamics, the SC is represented by an equivalent RLC circuit and two fractional-order Warburg-based elemtents. The impedance spectrum obtained through the proposed online method is compared against a reference AC Sweep performed by PSIM, validating the excitation and extraction algorithms under controlled conditions. Finally, the methodology is experimentally verified using a real SC connected to a bidirectional Buck converter controlled by a digital signal processor (DSP). The duty-cycle excitation is dynamically computed using the proposed analytical expression, and the resulting impedance spectrum is benchmarked against high-precision measurements obtained with a commercial FRA.
The remainder of this paper is organized as follows.
Section 2 presents the operational considerations to perform impedance spectroscopy using power converters.
Section 3 presents the converter-SC modeling framework and the proposed IS methodology.
Section 4 describes the simulation implementation and analyzes the corresponding validation results.
Section 5 presents the experimental setup, the measurement procedure, and the comparison with the FRA-based reference. Finally,
Section 6 concludes the paper.
3. Proposed System Modeling for Impedance Spectroscopy
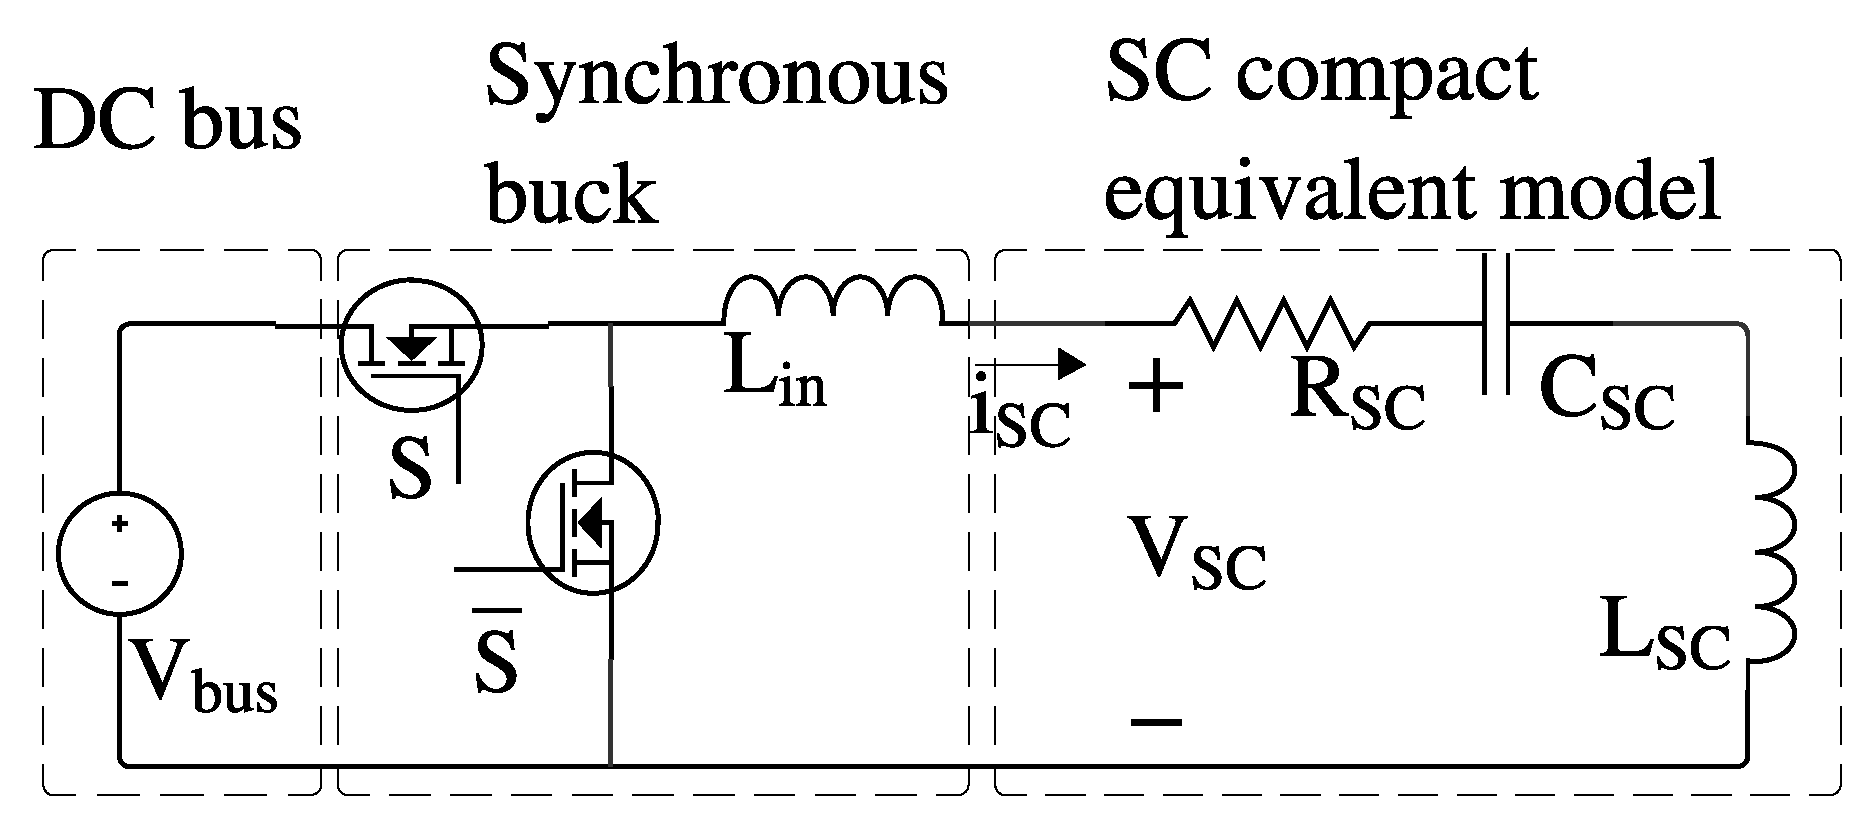
Figure 2 shows the proposed system model used to analyze the IS of an SC using a power converter. It is composed of an SC connected to a DC bus through a bidirectional Buck converter. For modeling purposes, the dominant dynamic behavior of the SC is represented by a compact RLC equivalent circuit. In this model,
represents the ESR, which accounts for the electronic resistance of the conductors, current collectors, contacts, and connections, as well as the ionic resistance of the electrolyte.
represents the effective capacitance associated with the charge-storage mechanism of the electric double layer at the electrode–electrolyte interface, including the frequency-dependent access of ions to the porous carbon structure. Finally,
stands for the lumped parasitic inductance associated with the SC cell and its connection leads, which becomes relevant at high frequencies and explains the inductive behavior observed above the resonance frequency [
36].
Moreover, the bidirection Buck converter is adopted in this paper because it is widely used for energy storage interfacing [
37,
38], and it is formed by two MOSFETs and an inductor
. Finally, the DC bus is represented by a DC voltage source
. This model is selected because in DC microgrids, hybrid microgrids, or hybrid energy storage devices, the DC bus voltage is usually regulated by a different converter with a dedicated controller [
39,
40].
To analyze the interaction between the converter and the SC, an averaged and ideal model of the Buck converter is considered, neglecting switching and conduction losses. This assumption allows focusing on the dominant dynamics governing the current injection mechanism required for generating the sinusidal disturbances.
Using a small-signal representation, the duty cycle is defined as the control input used to inject perturbations into the system. The converter-SC dynamics are described by (
4)–(
6), where
and
are SC current and voltage, respectively,
d is the duty cycle, and
is the voltage of
.
The SC terminal voltage is formed by the sum of its resistive, capacitive, and inductive contributions, as shown in (
7).
Then, substituting (
7) into (
4), and reorganizing the terms, leads to expression (
8).
Transforming (
5) and (
8) into the Laplace domain results in:
where the capital letters represent the Laplace version of the variables. From these expressions, the transfer function between the SC current and the duty cycle is obtained:
The steady-state response of the system for sinusoidal disturbances is obtained by evaluating (
11) at
, which results in (
12), where
is the disturbance angular frequency.
Then, the magnitude of (
12) is calculated as follows:
From (
13), it is calculated the amplitude of the sinusoidal disturbance in the duty cycle required to obtain a desired amplitude in the sinusoidal disturbance of the SC current for a particular frequency:
Equation (
14) allows adjusting the duty-cycle perturbation amplitude to impose a consistent current amplitude across the frequency range. However, to prevent duty-cycle saturation, clipping, or harmonic distortion, the current perturbation amplitude
must be strictly limited by the maximum available duty-cycle excursion. This practical boundary condition is analyzed through three consecutive design criteria.
First, the steady-state operating point determines the available headroom for symmetrical perturbations. Letting
be the nominal DC duty cycle, the maximum allowable symmetrical duty-cycle excursion
that avoids saturation is calculated as:
Second, for any given excitation frequency
, the maximum current perturbation amplitude is restricted by this duty-cycle excursion. To ensure that the instantaneous duty cycle remains within the linear region
, the resulting duty-cycle amplitude must satisfy the boundary condition
:
Third, according to (
14), the duty-cycle amplitude increases with
; therefore, the worst-case scenario occurs at the maximum excitation frequency of the sweep,
. By evaluating (
16) at
, the maximum permissible current perturbation amplitude
(strictly limited by the maximum duty-cycle excursion) is defined as:
By calculating (
17) before starting the frequency sweep, and selecting a target current perturbation
, the system mathematically guarantees that the excitation current is kept within the limits imposed by the maximum duty-cycle excursion, thus preventing clipping at all operating points.
Once the current excitation is defined, the SC impedance is obtained from the voltage and current signals measured at its terminals. The instantaneous signals can be expressed as the sum of their DC (
and
) and small-signal AC components (
and
) as shown in (
18) and (
19). The AC components are defined in (
20) and (
21), respectively, where
and
correspond to the amplitudes of the current and voltage perturbations, and
is the phase shift.
The AC components of the measured SC voltage and current at a given frequency are obtained by applying the Fast Fourier Transform (FFT) to a few periods of the sinusoidal disturbing signal removing the DC component. The results from this step are the SC voltage and current phasors of the AC components
and
. Then, the impedance for a given frequency is calculated as shown in (
22).
Finally, the complete impedance spectrum is obtained by calculating the impedance at each excitation frequency of the sweep. Nevertheless, when IS is implemented through a power converter, the measurable frequency range is constrained by both converter-related and data-acquisition limitations. At high frequencies, the excitation frequency must remain well below the switching frequency and the effective control bandwidth of the converter, so that the averaged model remains valid and the converter can reproduce the sinusoidal current perturbation with acceptable distortion [
27,
32]. In addition, PWM resolution, inductor dynamics, current-sensor bandwidth, voltage-sensor bandwidth, and the sampling frequency of the acquisition system limit the maximum frequency at which the voltage and current phasors can be reliably extracted.
At low frequencies, the main limitation is related to the acquisition time and the amount of data required for each frequency point. Since the FFT-based impedance estimation requires recording an integer number of periods after the transient response has decayed, the measurement time increases as the excitation frequency decreases. For a sampling frequency
and
recorded periods, the number of samples is proportional to
; therefore, reducing the excitation frequency by one decade increases the required data length by one decade. This is especially relevant for SCs, since very low-frequency measurements are associated with leakage current, self-discharge, and charge redistribution phenomena [
36], but their characterization significantly increases the experimental burden.
To address this topic and ensure maximum accuracy, the proposed methodology implements a sequential, single-sine frequency sweep, where each excitation frequency is injected and processed individually before proceeding to the next. Because the target frequency is known a priori, the data acquisition system dynamically synchronizes the sampling window to record an exact integer number of periods (
) once the initial transient response has completely decayed. In signal processing, capturing an exact integer number of periods of a single known frequency mathematically eliminates spectral leakage [
41].
This synchronized approach renders non-rectangular windowing techniques unnecessary, avoiding potential amplitude or phase distortions and preserving the absolute integrity of the extracted phasors. While optimization strategies such as segmented FFT, adaptive sweeps, or multi-sine excitation are widely recognized for reducing the total testing time, the single-sine method is strictly maintained in this study to prioritize mathematical precision and establish a reliable experimental baseline.
Additional practical constraints are imposed by the small-signal condition and the operating limits of the converter. The duty-cycle perturbation computed from (
14) must remain within the available duty-cycle range and must not drive the converter or the SC beyond their voltage, current, or thermal limits. Therefore, the frequency range used in the experimental validation is selected as a compromise between covering the relevant SC dynamic behavior and ensuring that the converter, sensors, and acquisition system can generate and measure the perturbation with sufficient accuracy.
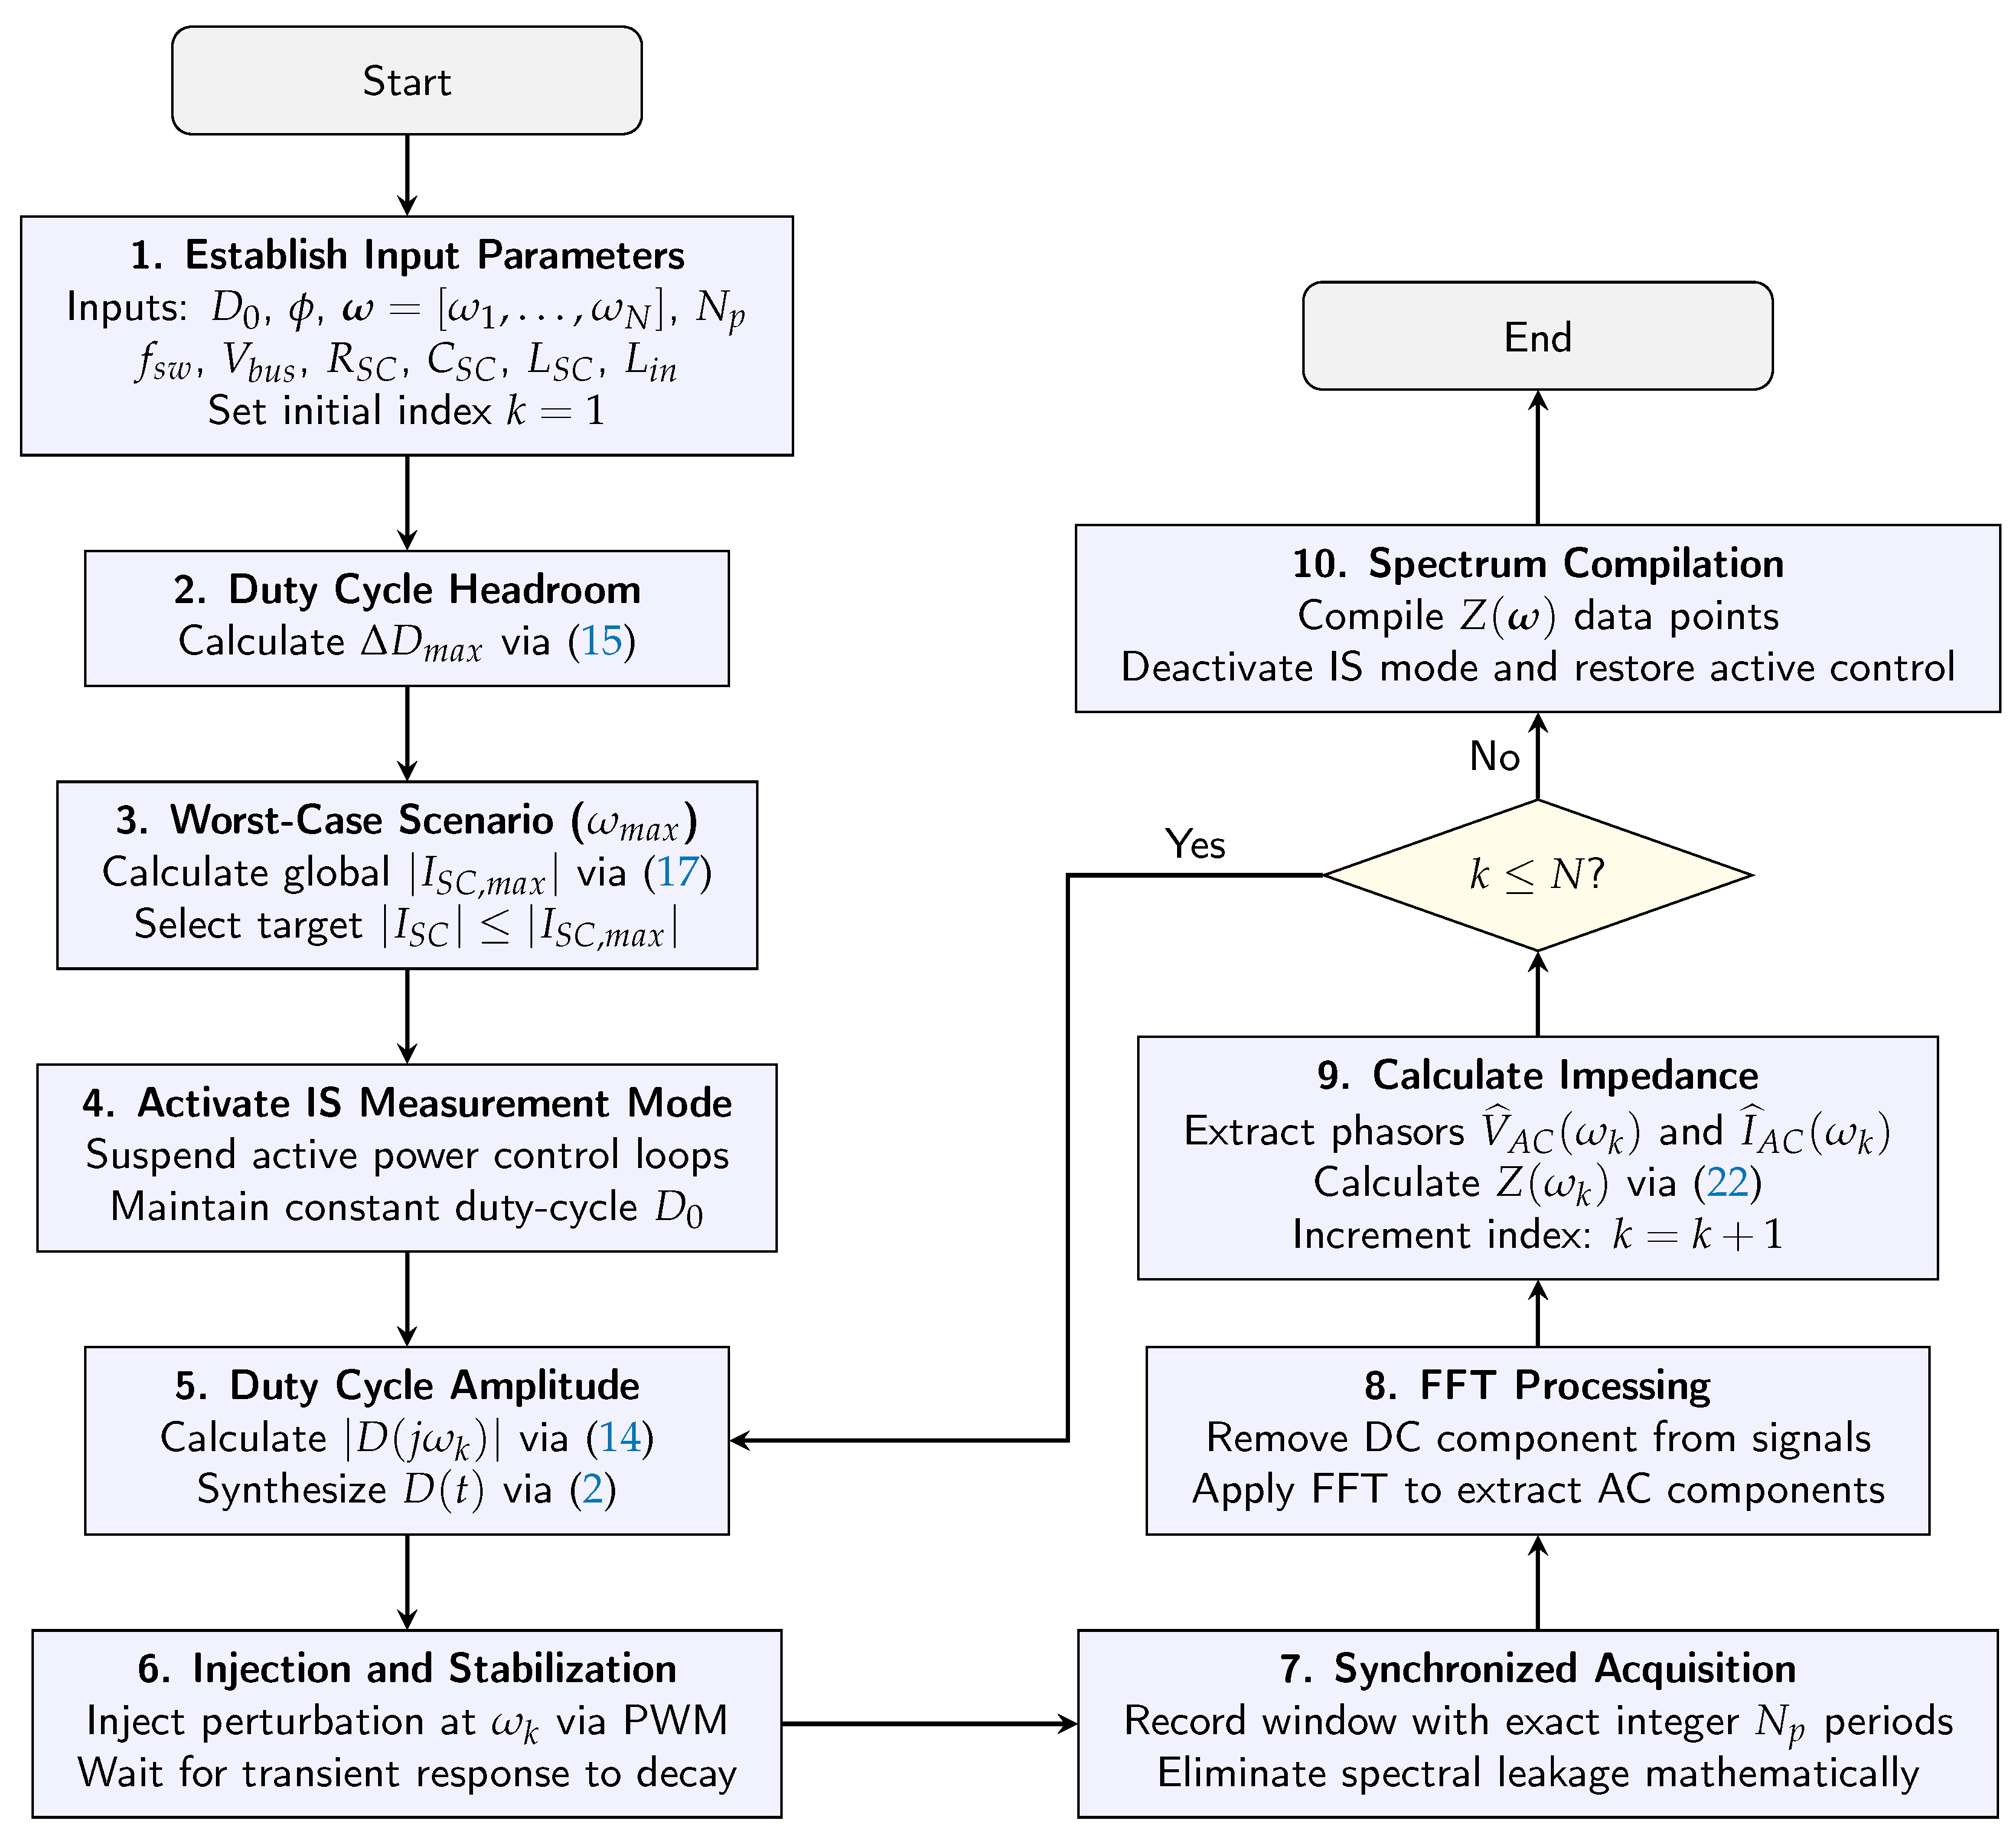
To provide a comprehensive overview of the entire execution routine, the step-by-step operational sequence of the proposed converter-based impedance spectroscopy methodology (integrating the pre-calculation of global limits, the excitation constraints, and the synchronized single-sine acquisition loop) is summarized in the flowchart shown in
Figure 3.
4. Simulation Results
To validate the proposed methodology, the system is implemented in PSIM following the converter-based IS framework previously described in
Section 3. However, to provide a realistic simulation test, the SC is modeled using the Warburg-based equivalent circuit reported in [
42], which extends the classical RLC representation to account for diffusion-related phenomena. That frequency accurate model is adopted in this section due to its capacity for reproducing the SC impedance behavior for a wide range of frequencies, and because it can be easily implemented in any circuital simulator like PSIM. In this way, it is validated that the theoretical equations obtained in the previous section, using the simplified SC model, are valid for a real SC.
The complete SC model includes
,
, and
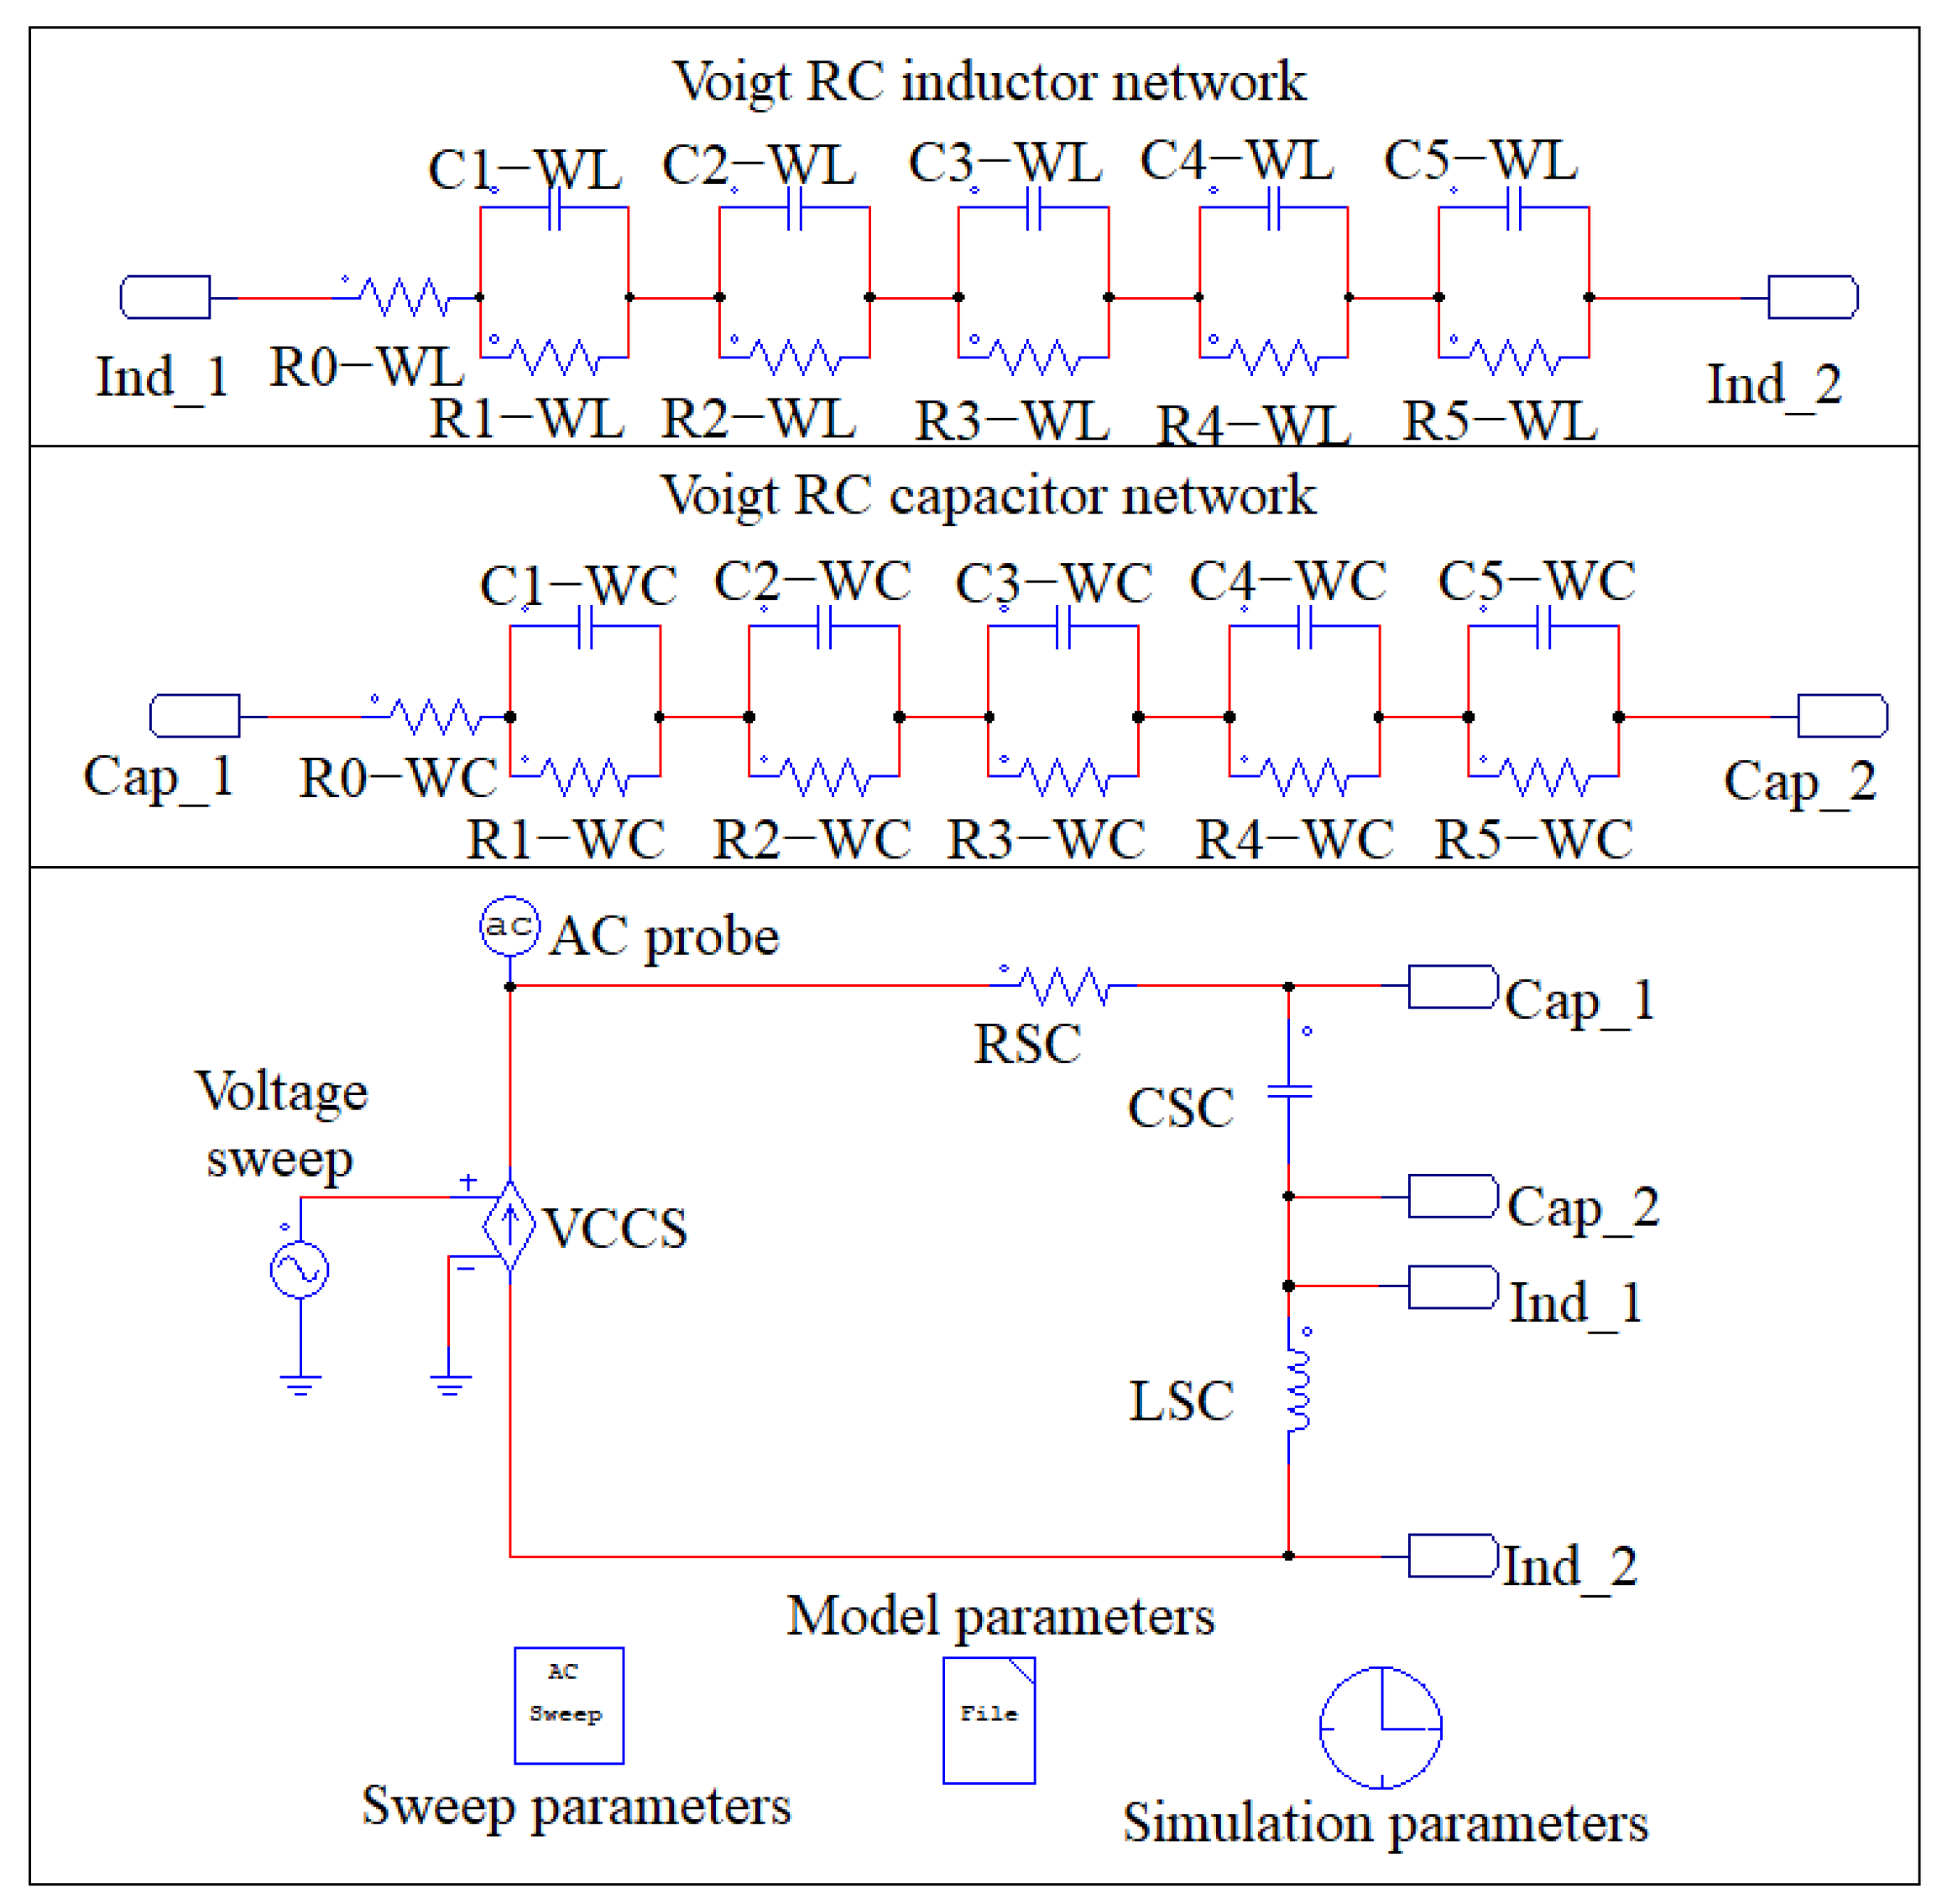
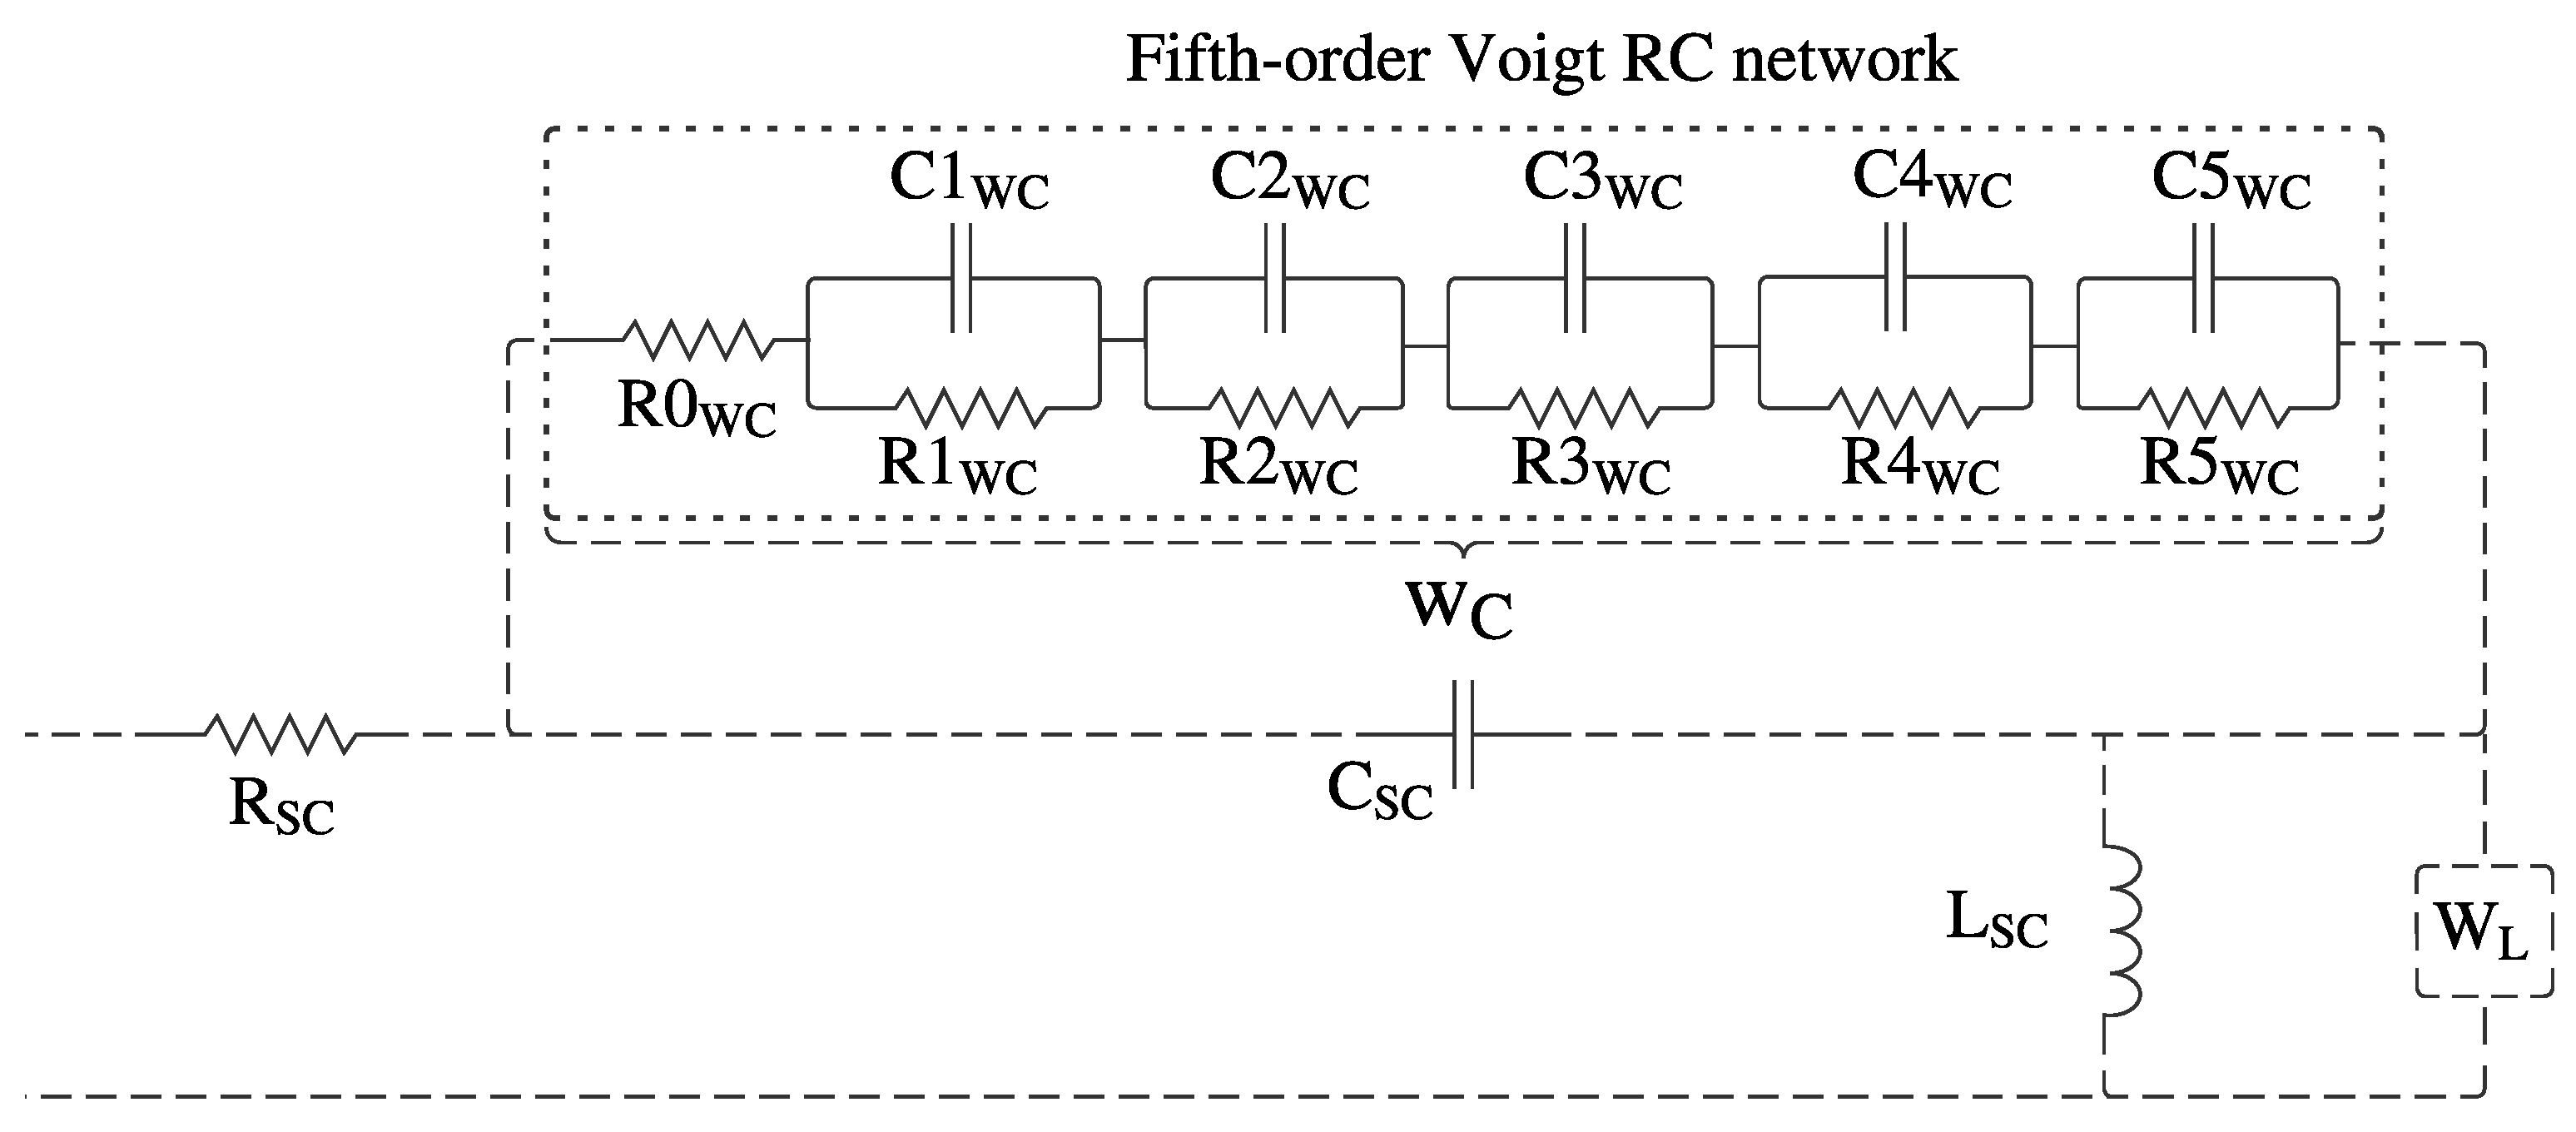
, complemented by two Warburg elements (
and
) to model the diffusion behaviors, which are approximated using fifth-order Voigt RC networks. Those networks are illustrated in
Figure 4, where
is connected in parallel with
and
is connected in parallel with
. This circuital approximation allows the model to reproduce the frequency-dependent impedance response associated with ion transport and charge redistribution in the porous electrode structure, while preserving compatibility with time-domain circuit simulation. The detailed formulation and parameterization of this model are presented in [
42].
The SC adopted for the simulations and experiments is the BMOD0058 module from Maxwell Technologies [
43]. The corresponding equivalent circuit parameters, taken from the model reported in [
42], are listed in
Table 4. The complete SC model contains 25 parameters: three parameters associated with the compact RLC representation, namely
,
, and
; eleven parameters associated with the
network, composed of
for
and
for
; and eleven parameters associated with the
network, composed of
for
and
for
. These two networks are used to reproduce the frequency-dependent behavior of the SC while maintaining a circuital representation suitable for time-domain simulation in a power electronics application.
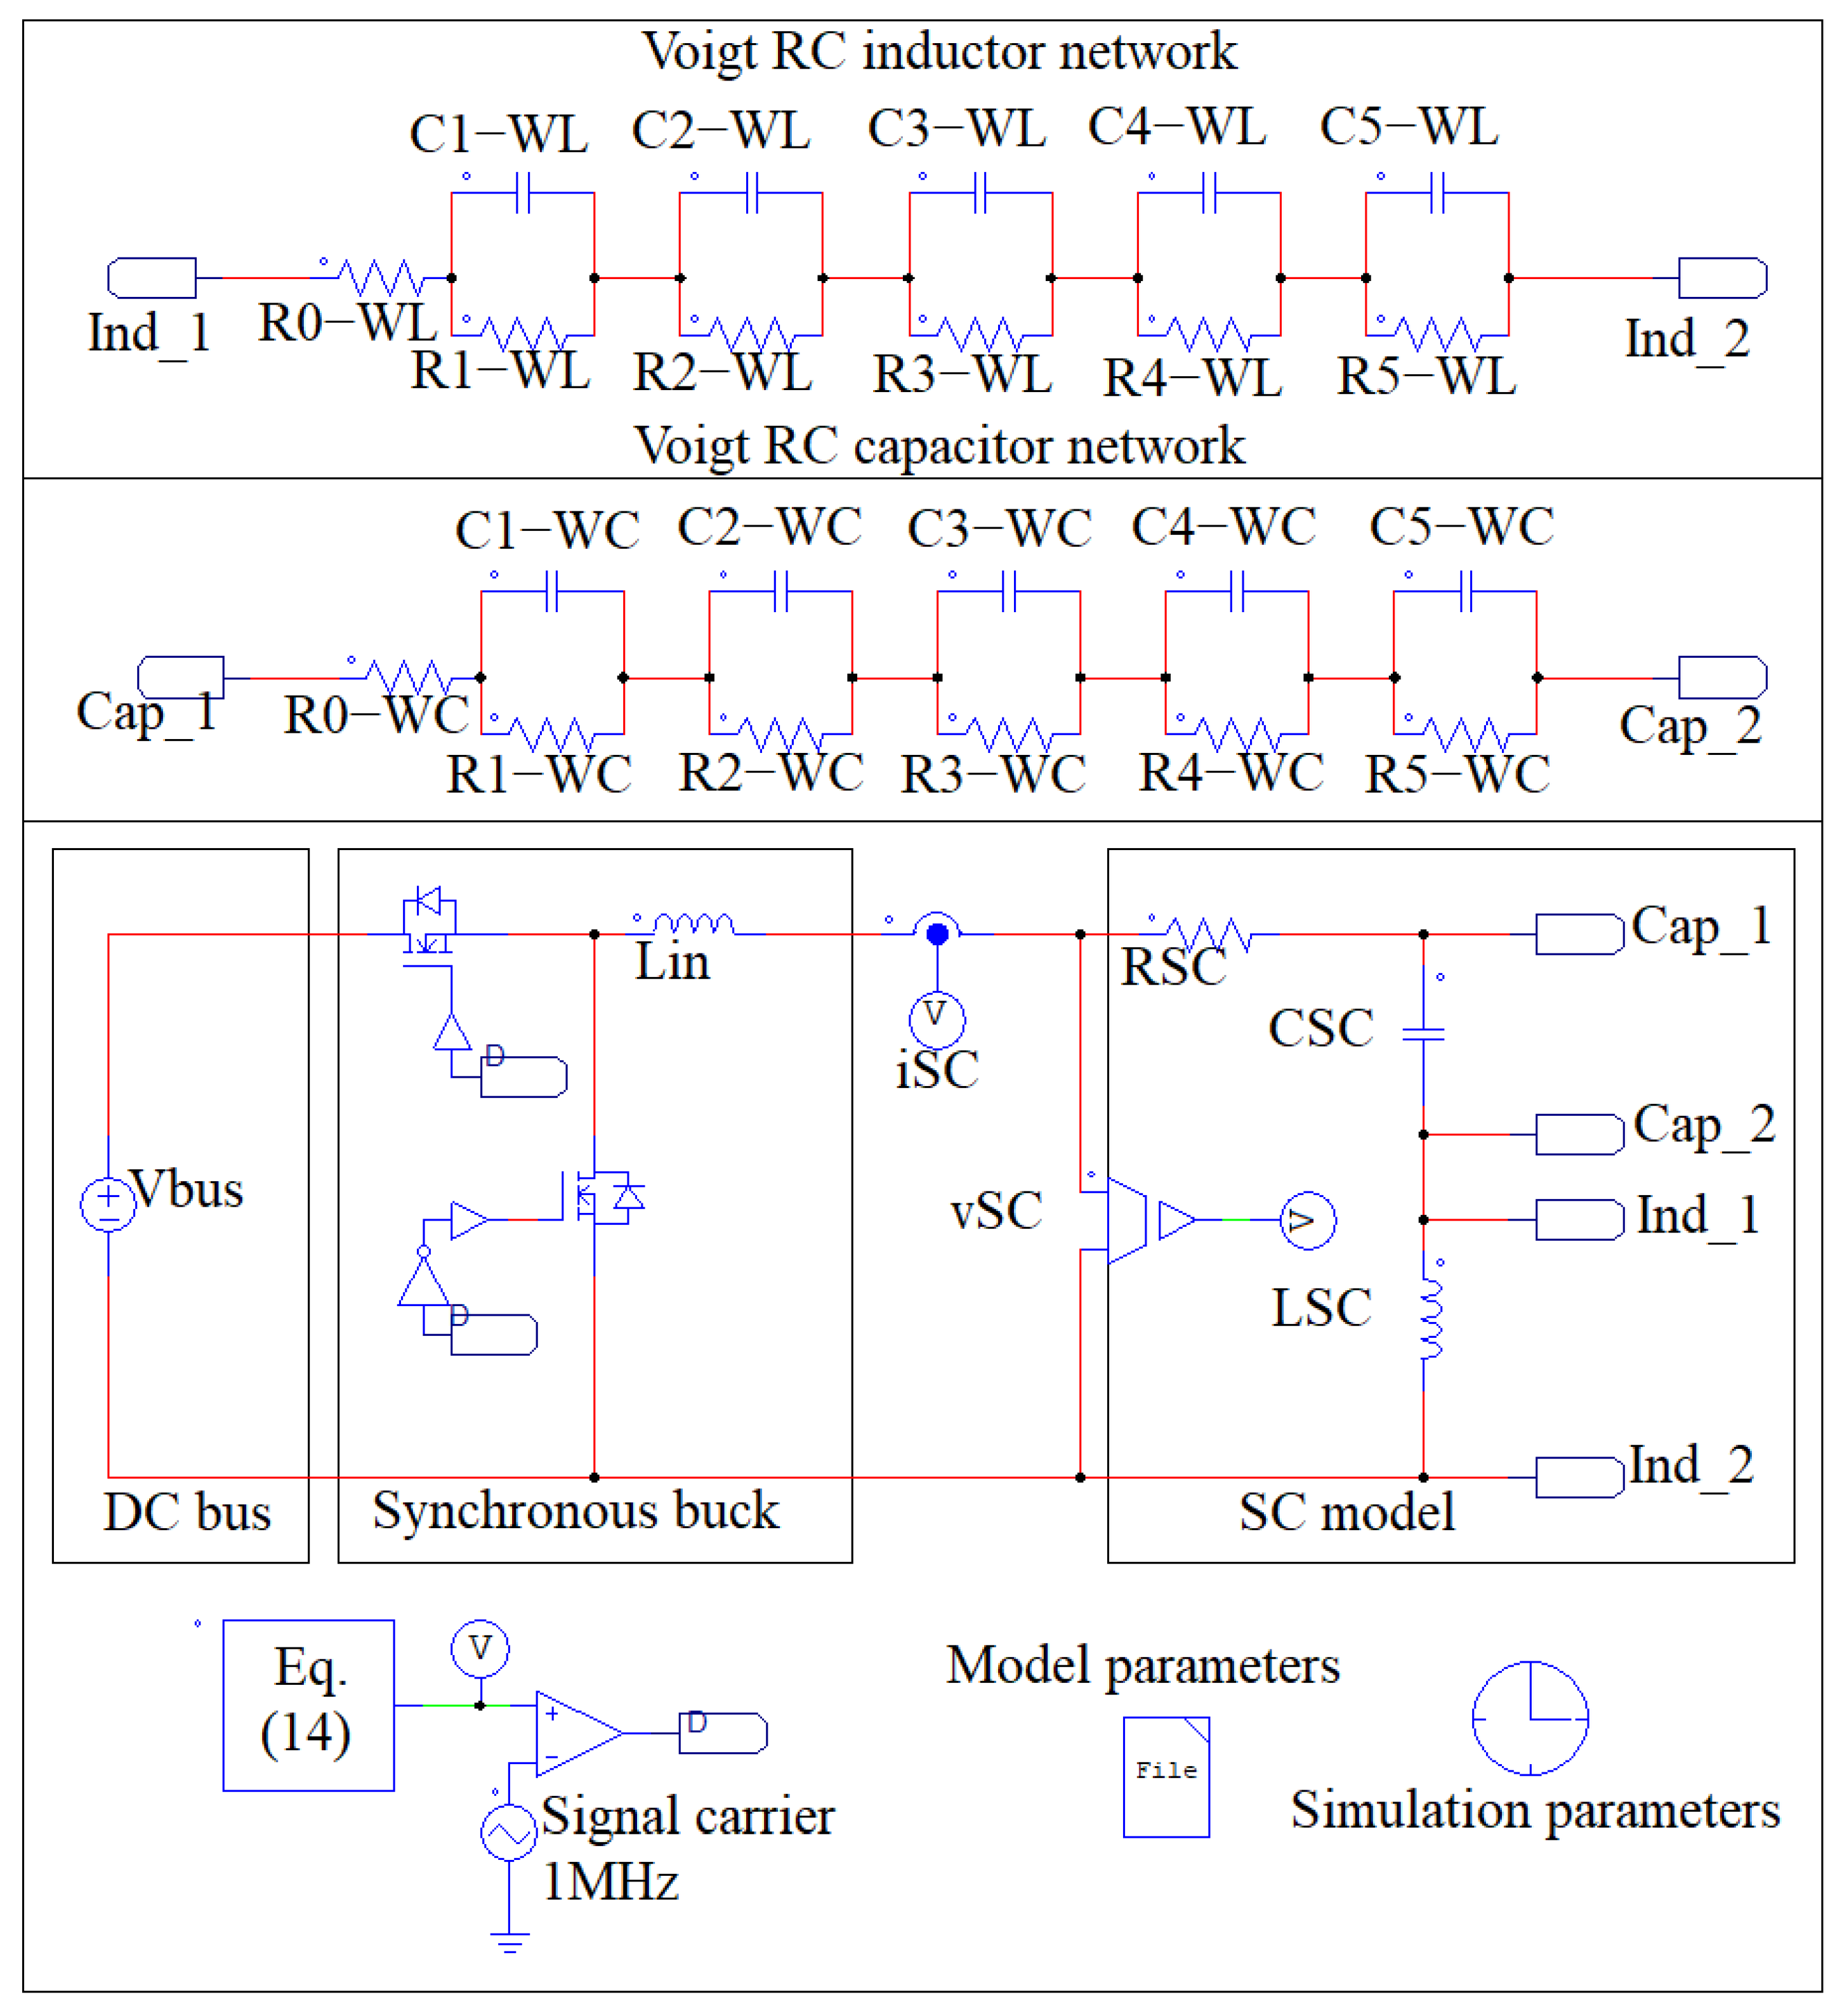
The simulated scheme, shown in
Figure 5, also includes a DC voltage source modeling the bus, a synchronous Buck converter, the current and voltage sensors, and a PWM with the control Equation (
14). The DC bus voltage is set to
, and the bidirectional Buck converter is implemented using two ideal MOSFETs and an input inductor of
. The use of ideal switches allows the simulation to focus on the proposed IS methodology and on the dynamic interaction between the converter and the SC model, without introducing additional effects associated with semiconductor losses or parasitic capacitances. The PWM stage is implemented by comparing the duty-cycle control signal with a high-frequency triangular carrier at
, which defines the converter switching frequency. This value of the switching frequency provides a sufficient separation with respect to the maximum excitation frequency considered in the simulation, enabling the generation of sinusoidal current disturbances up to
for the characterization of the high-frequency behavior of the SC.
The duty-cycle signal is generated through a C-block that implements the expression defined in Equation (
14), which simulates the discrete operation of the microcontroller used in the experiments. The C-code considers a target sinusoidal current disturbance with fixed amplitude,
, around the nominal operating point
. Before applying the perturbation, the converter is kept at this operating point for
to ensure that the system has reached steady state.
The implemented frequency sweep ranges from to and consists of 61 frequency points: from to . At each frequency, the duty-cycle perturbation is applied during ten complete periods before updating the excitation frequency. Therefore, the duration assigned to each frequency is , where is the current frequency of the sweep.
The frequency update is performed only after an integer number of periods has been completed. This avoids changing the excitation frequency in the middle of a sinusoidal cycle, preventing artificial discontinuities in the duty-cycle perturbation when the sweep moves from one frequency point to the next. In addition, the phase is accumulated continuously according to
, where
is the simulation time step. Thus, the duty cycle is generated according to Equation (
2), where the amplitude
is computed from Equation (
14) to impose the desired current disturbance amplitude at each frequency. This sweep configuration also ensures that an integer number of cycles is available for the subsequent spectral processing, reducing leakage effects in the FFT-based impedance estimation. The selected frequency range focuses on the medium- and high-frequency behavior of the SC, including resistive and inductive dynamics, while avoiding the large simulation time and data volume associated with very low-frequency points. Finally,
Table 4 reports a summary of the electrical parameters adopted in the simulated verification.
The time-domain behavior of the system is first evaluated to verify the operating conditions required for IS. Since the SC equivalent circuit contains several capacitive states and the converter includes an inductor, the simulation is initialized from a previously computed steady-state operating point rather than from zero initial conditions. To this end, the converter-SC system is first simulated until the transient response associated with the charging process has decayed. Then, the voltages of the capacitive elements of the SC model and the current of the converter inductor are extracted and used as initial conditions for the large-signal simulation.
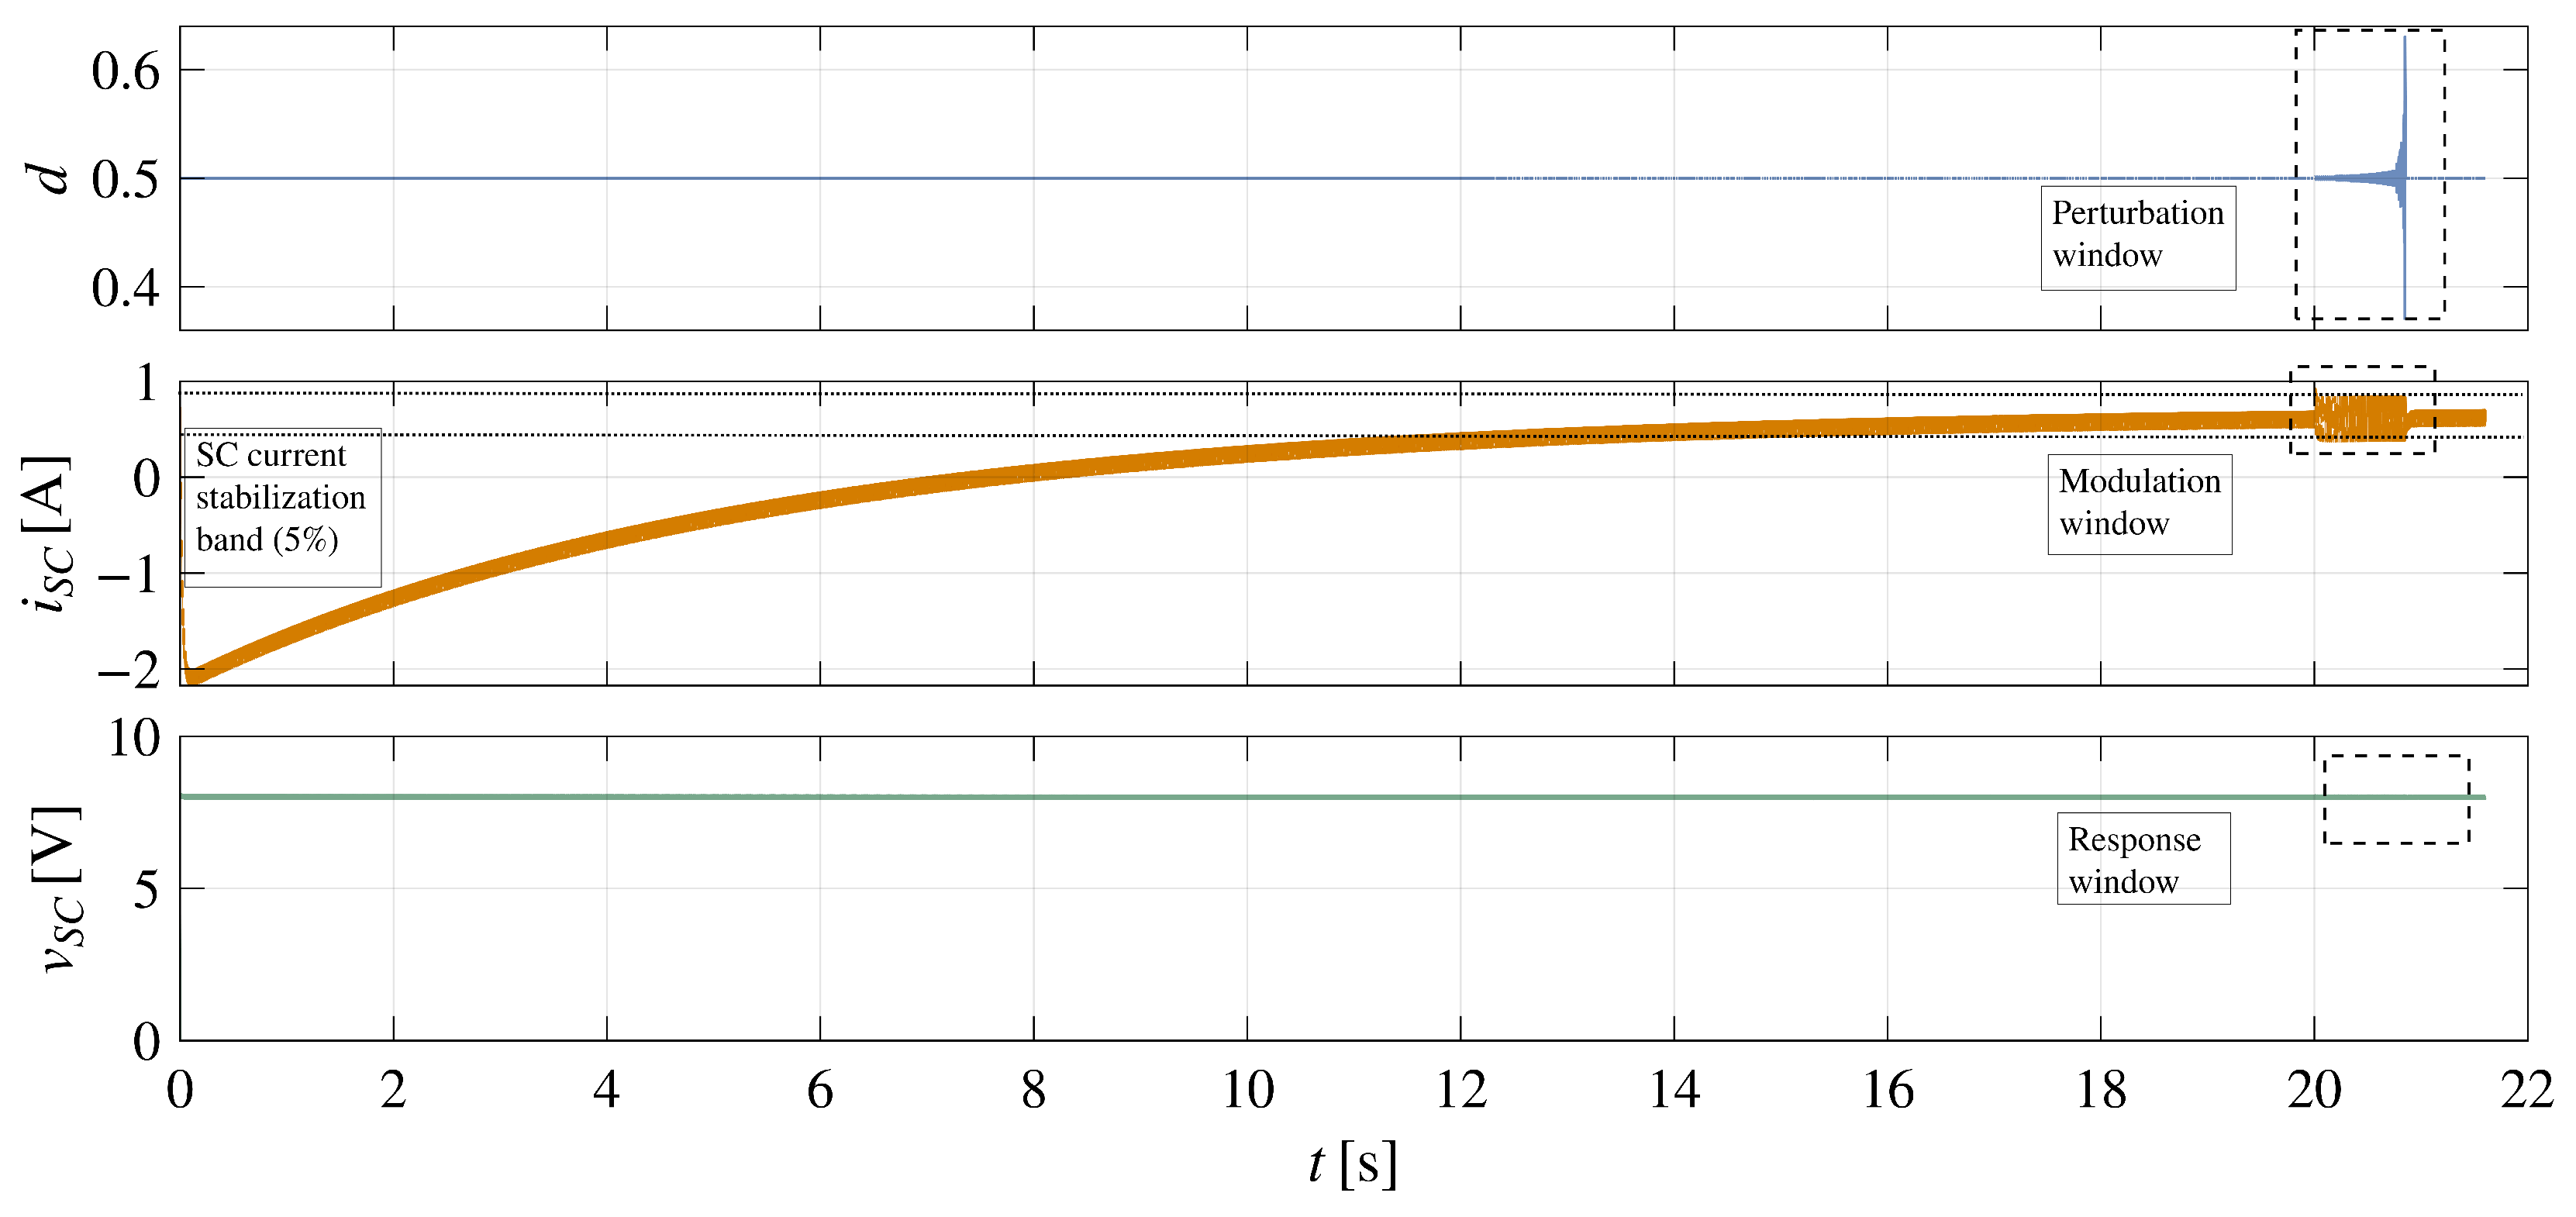
The large-signal simulation, shown in
Figure 6, reports the response from 0 to
, including the duty cycle
D, the SC current
, and the SC voltage
. Because the simulation starts from the precomputed steady-state conditions,
remains close to its operating value from the beginning of the simulation. However, a short transient is still observed in
due to the dynamic interaction between the converter inductor and the SC equivalent circuit. In this case, the SC current does not start from zero because the initial inductor current corresponds to the previously established operating point.
The system is considered to have reached steady state when the main variables remain within a tolerance band around their final values. In particular, the band around the final value of is used as a reference to verify that the SC voltage has stabilized before applying the sinusoidal duty-cycle perturbation. Once this condition is satisfied, the system is assumed to be operating under quasi-steady conditions, which is required to perform IS around a well-defined operating point.
Once the steady state is reached, the C-block starts introducing the sinusoidal duty-cycle disturbances at the selected frequencies. For each frequency, the corresponding responses of
and
are measured and then used to calculate the SC impedance.
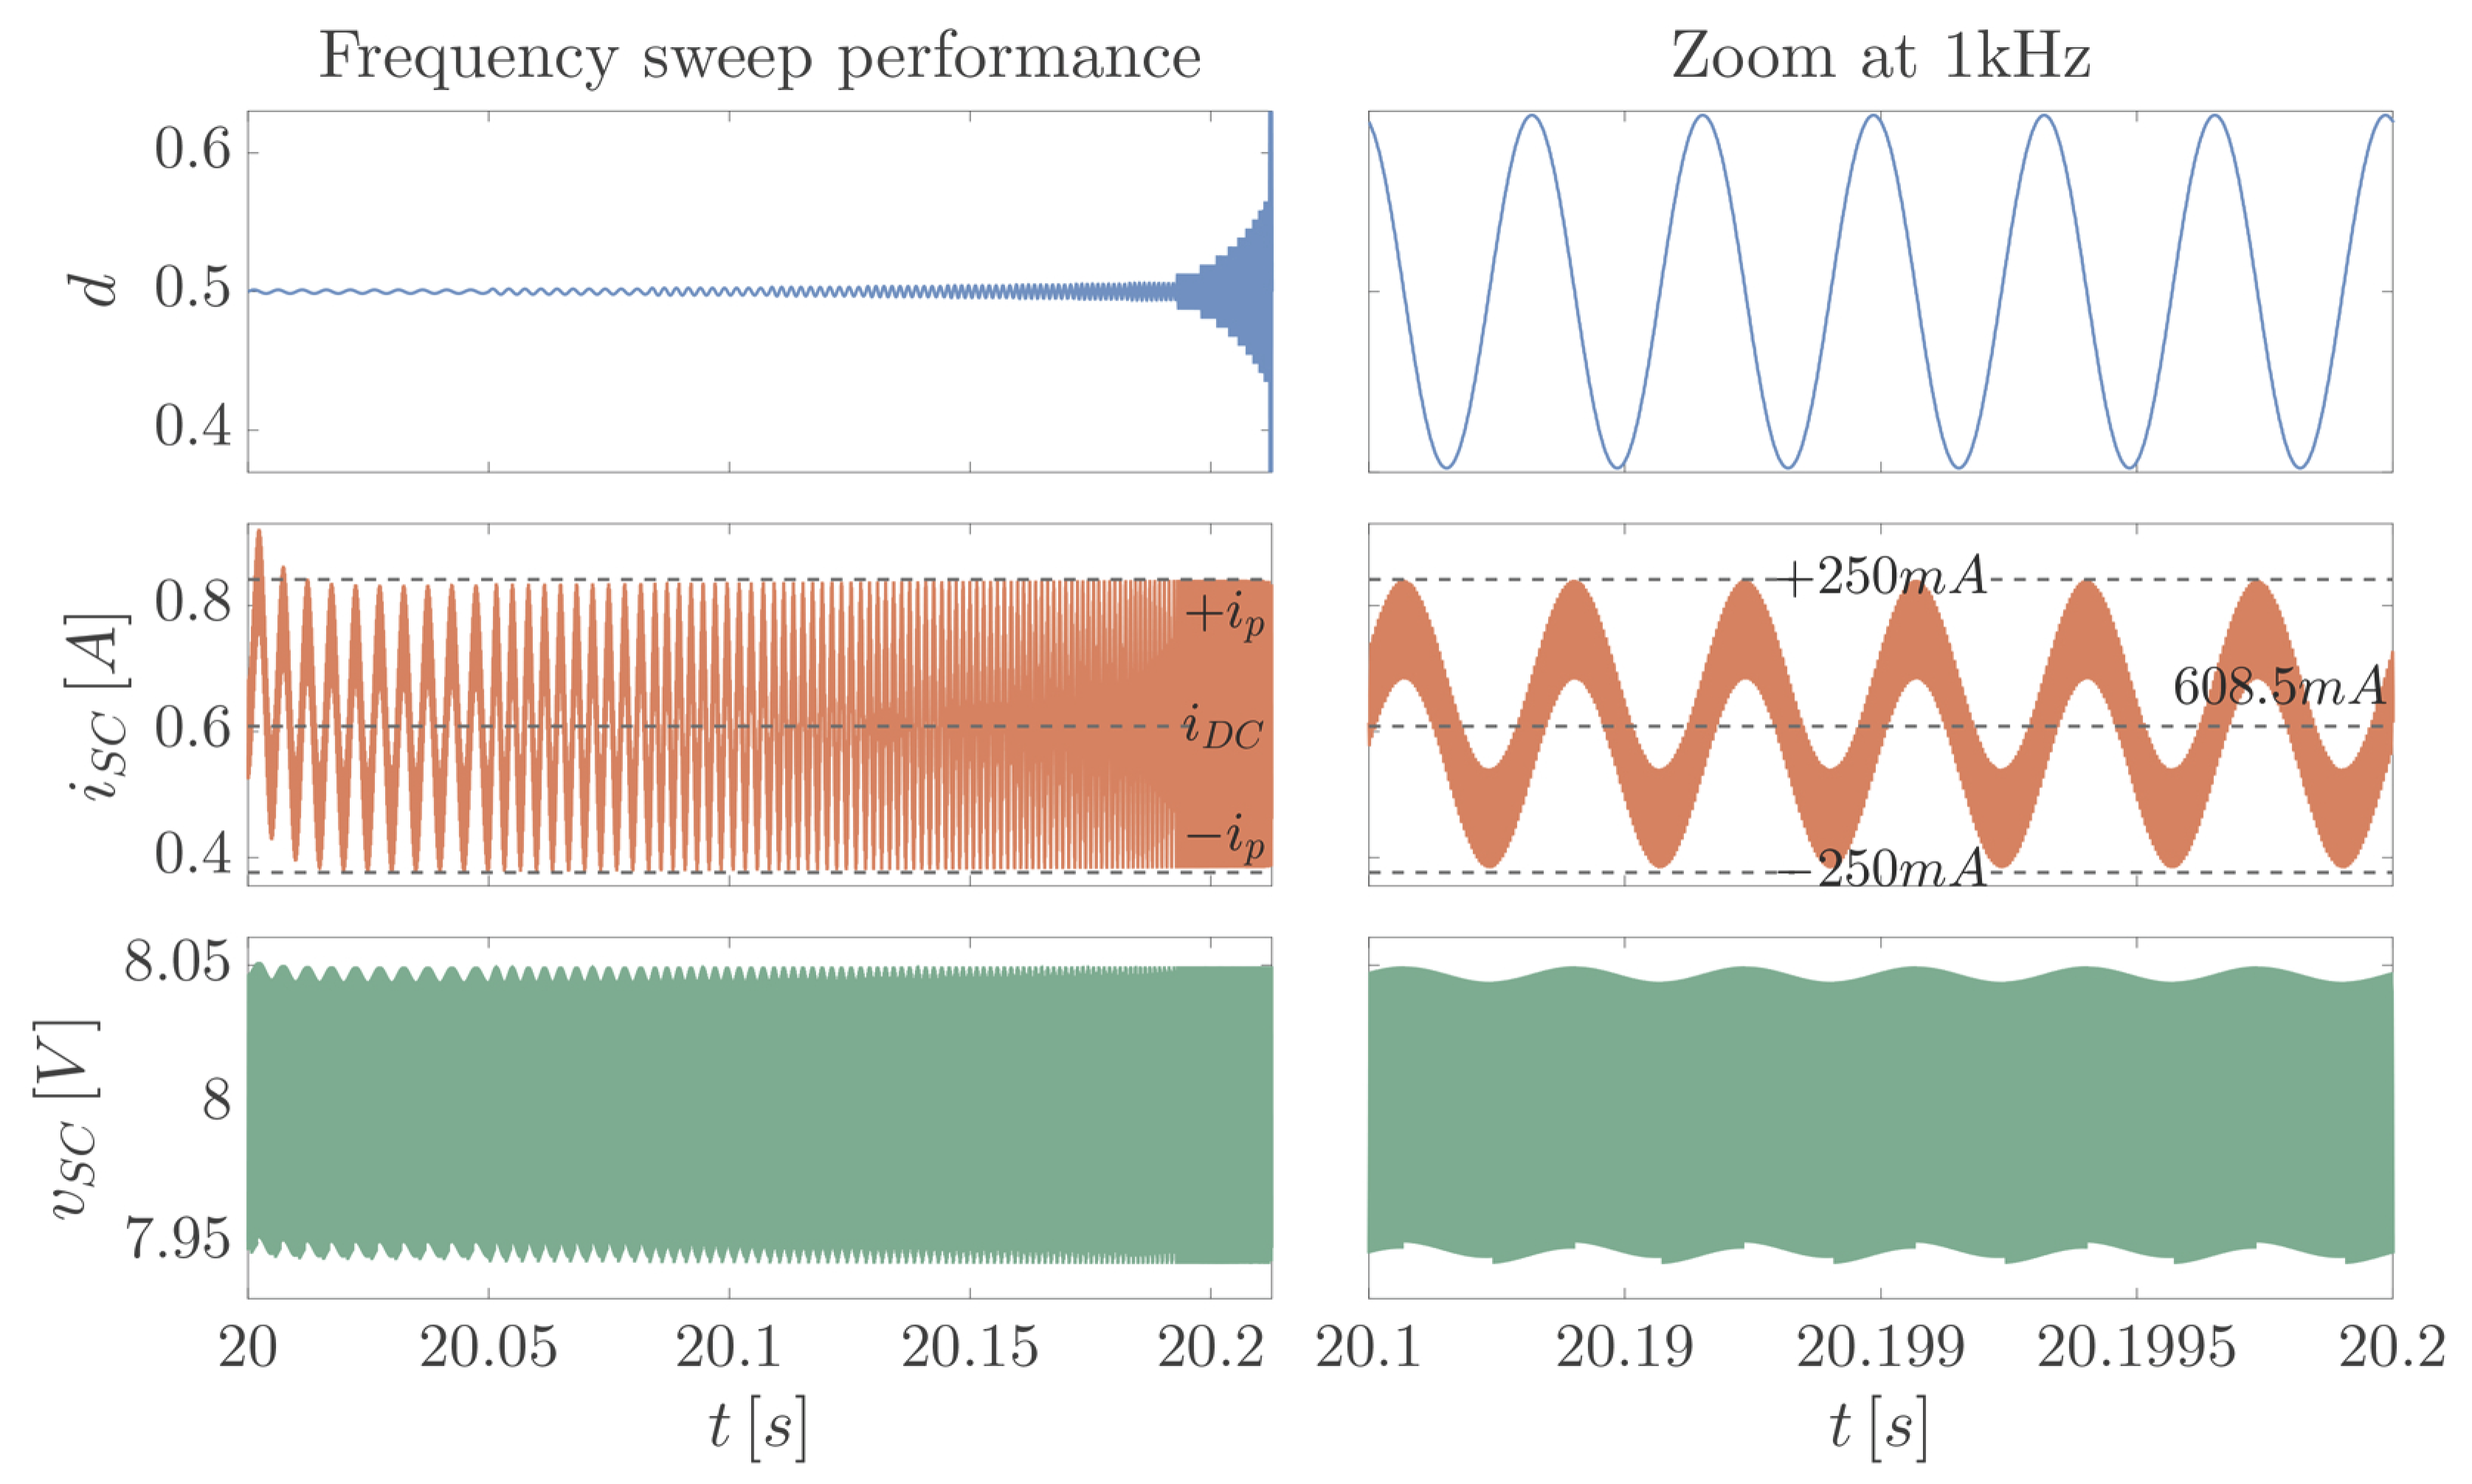
Figure 7 shows a zoomed view of the duty cycle
d, the SC current
, and the SC voltage
during the frequency sweep in the left plot, while the right plot shows the same variables for a disturbance at a single frequency.
The results show that both
d and
oscillate symmetrically around their mean values, confirming that the perturbation is applied under small-signal conditions around the selected operating point. Furthermore, the waveforms confirm that the constraint Equations (
15)–(
17) are strictly satisfied. As observed, the duty cycle
d remains well within the linear region defined by the maximum headroom
, demonstrating that no saturation conditions are violated. This is because the selected current amplitude of
is safely bounded by the worst-case limit
defined in (
17) for the maximum excitation frequency of
. Consequently, if the sweep were to proceed to the next typical frequency step at
, the required duty-cycle amplitude would rise to approximately
, theoretically forcing the duty cycle to swing from
to
. This would severely saturate the PWM modulator, clipping the waveforms and completely invalidating the linear small-signal assumptions. This constant peak amplitude over the evaluated frequencies also verifies that the duty-cycle perturbation is properly adjusted by Equation (
14). Therefore, the proposed expression compensates for the frequency-dependent dynamics between the duty cycle and the SC current, allowing the current disturbance amplitude to remain controlled throughout the frequency sweep.
Regarding , the waveform also presents a sinusoidal ripple around its DC operating value. Unlike the current disturbance, the voltage ripple is not directly imposed by the converter; instead, it corresponds to the voltage response of the SC to the injected sinusoidal current. Consequently, its amplitude and phase depend on the SC impedance at each excitation frequency. This behavior is precisely the basis for the impedance calculation, since the complex impedance is obtained from the ratio between the voltage and current phasors extracted from the measured and signals.
A reference IS is obtained by using the AC Sweep tool available in PSIM to validate the IS obtained with the Buck converter. The setup, shown in
Figure 8, uses the same SC model presented in
Figure 5 but, in this case, the SC is excited through a voltage-controlled current source (VCCS), which is driven by an AC voltage source to perform the frequency sweep. The excitation is applied over a frequency range from
to
, allowing a wideband characterization of the SC model under controlled conditions. The resulting current is measured using the AC probe, while the voltage perturbation is inherently defined by the excitation source, enabling the computation of the SC impedance.
This arrangement isolates the intrinsic behavior of the SC model and allows generating a reference impedance spectrum under ideal conditions. The obtained spectrum is then used as a benchmark for evaluating the accuracy of the proposed converter-based IS procedure.
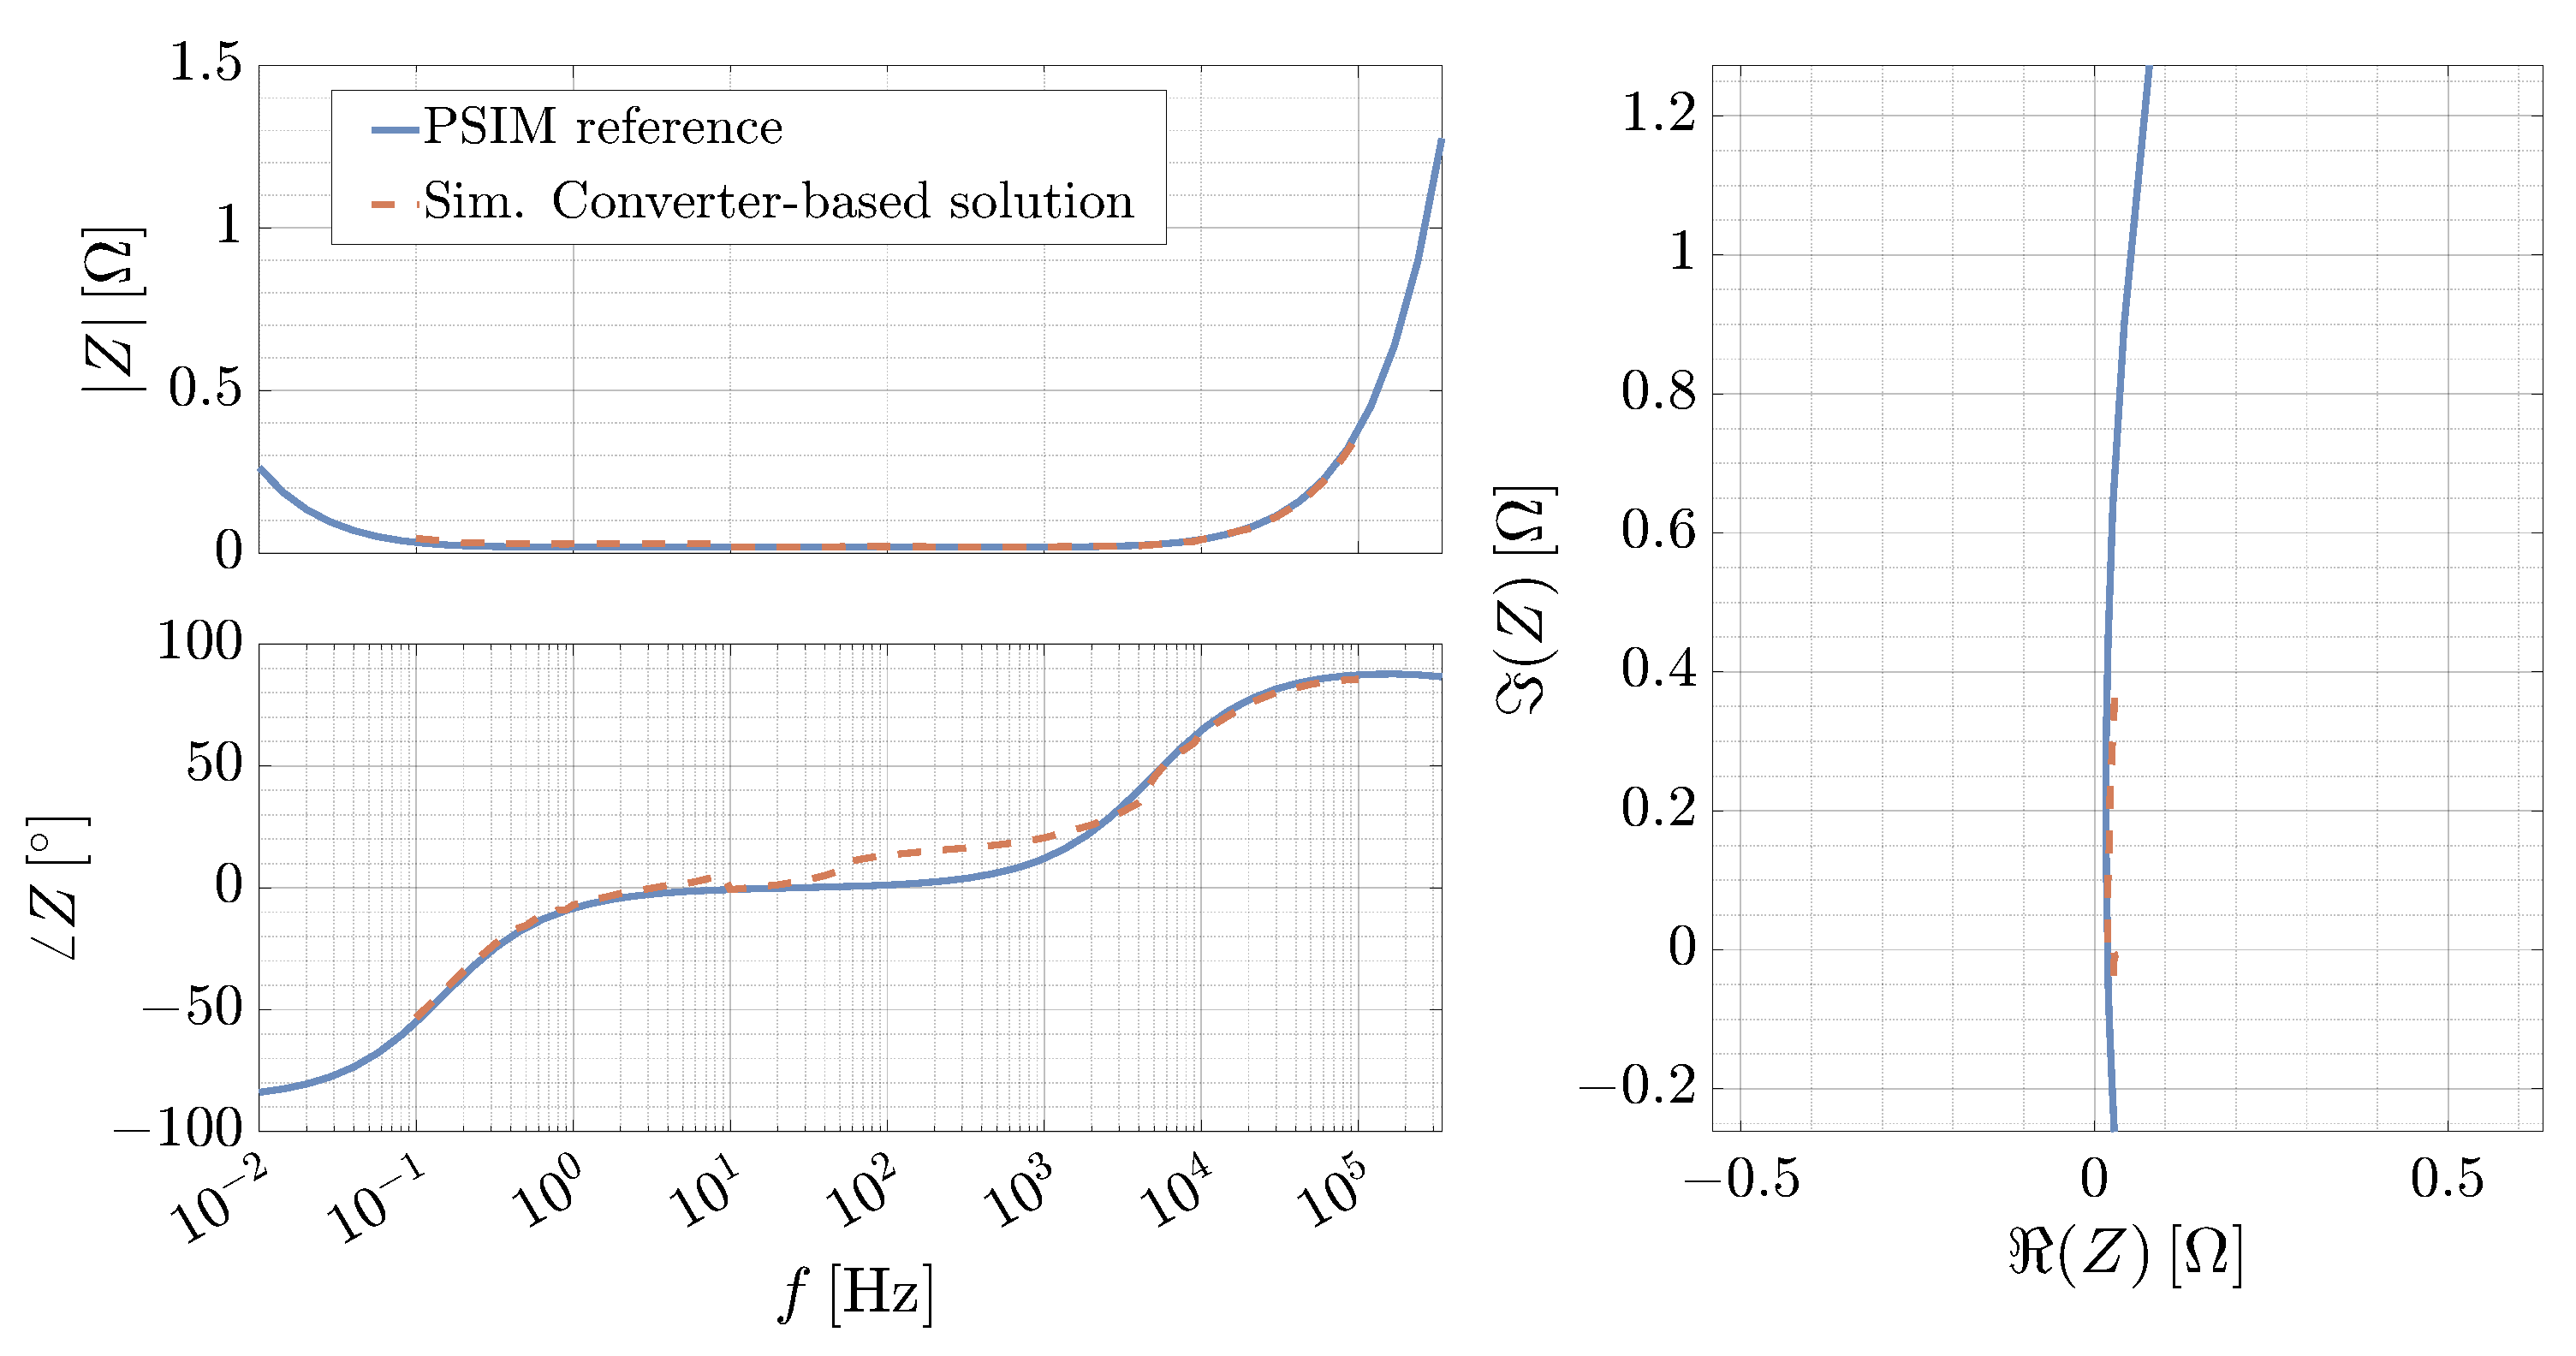
The IS obtained with the proposed approach is compared against this reference one by using Bode and Nyquist-polar plots, as shown at the left and right of
Figure 9, respectively. The results show that the proposed method reproduces the main characteristics of the SC impedance. The capacitive behavior dominates at low frequencies (under 1 Hz); while in mid frequencies, the SC operates as a resistor (between 1 Hz and 400 Hz). For frequencies over 400 Hz, the inductive behavior dominates the dynamic response.
Although small deviations are observed, particularly in the phase response, these are mainly associated with the switching ripple. The Nyquist-polar plot confirms that the proposed method captures the characteristic trajectory of the SC impedance with relatively small deviations. Since the phase data crosses zero degrees, the denominator of the classical relative error calculation causes severe numerical instability; thus, a negligible absolute deviation results in an artificially large relative error. To overcome this singularity while preserving local sensitivity across the full spectrum, the Range-Absolute Error (RAE) and Range-Average Absolute Error (RAAE) [
44] are used to quantify the errors. The RAE and RAAE calculations are defined in (
23) and (
24), where
and
represent the reference and the estimated values, respectively.
The proposed method achieves a RAAE of
in magnitude and
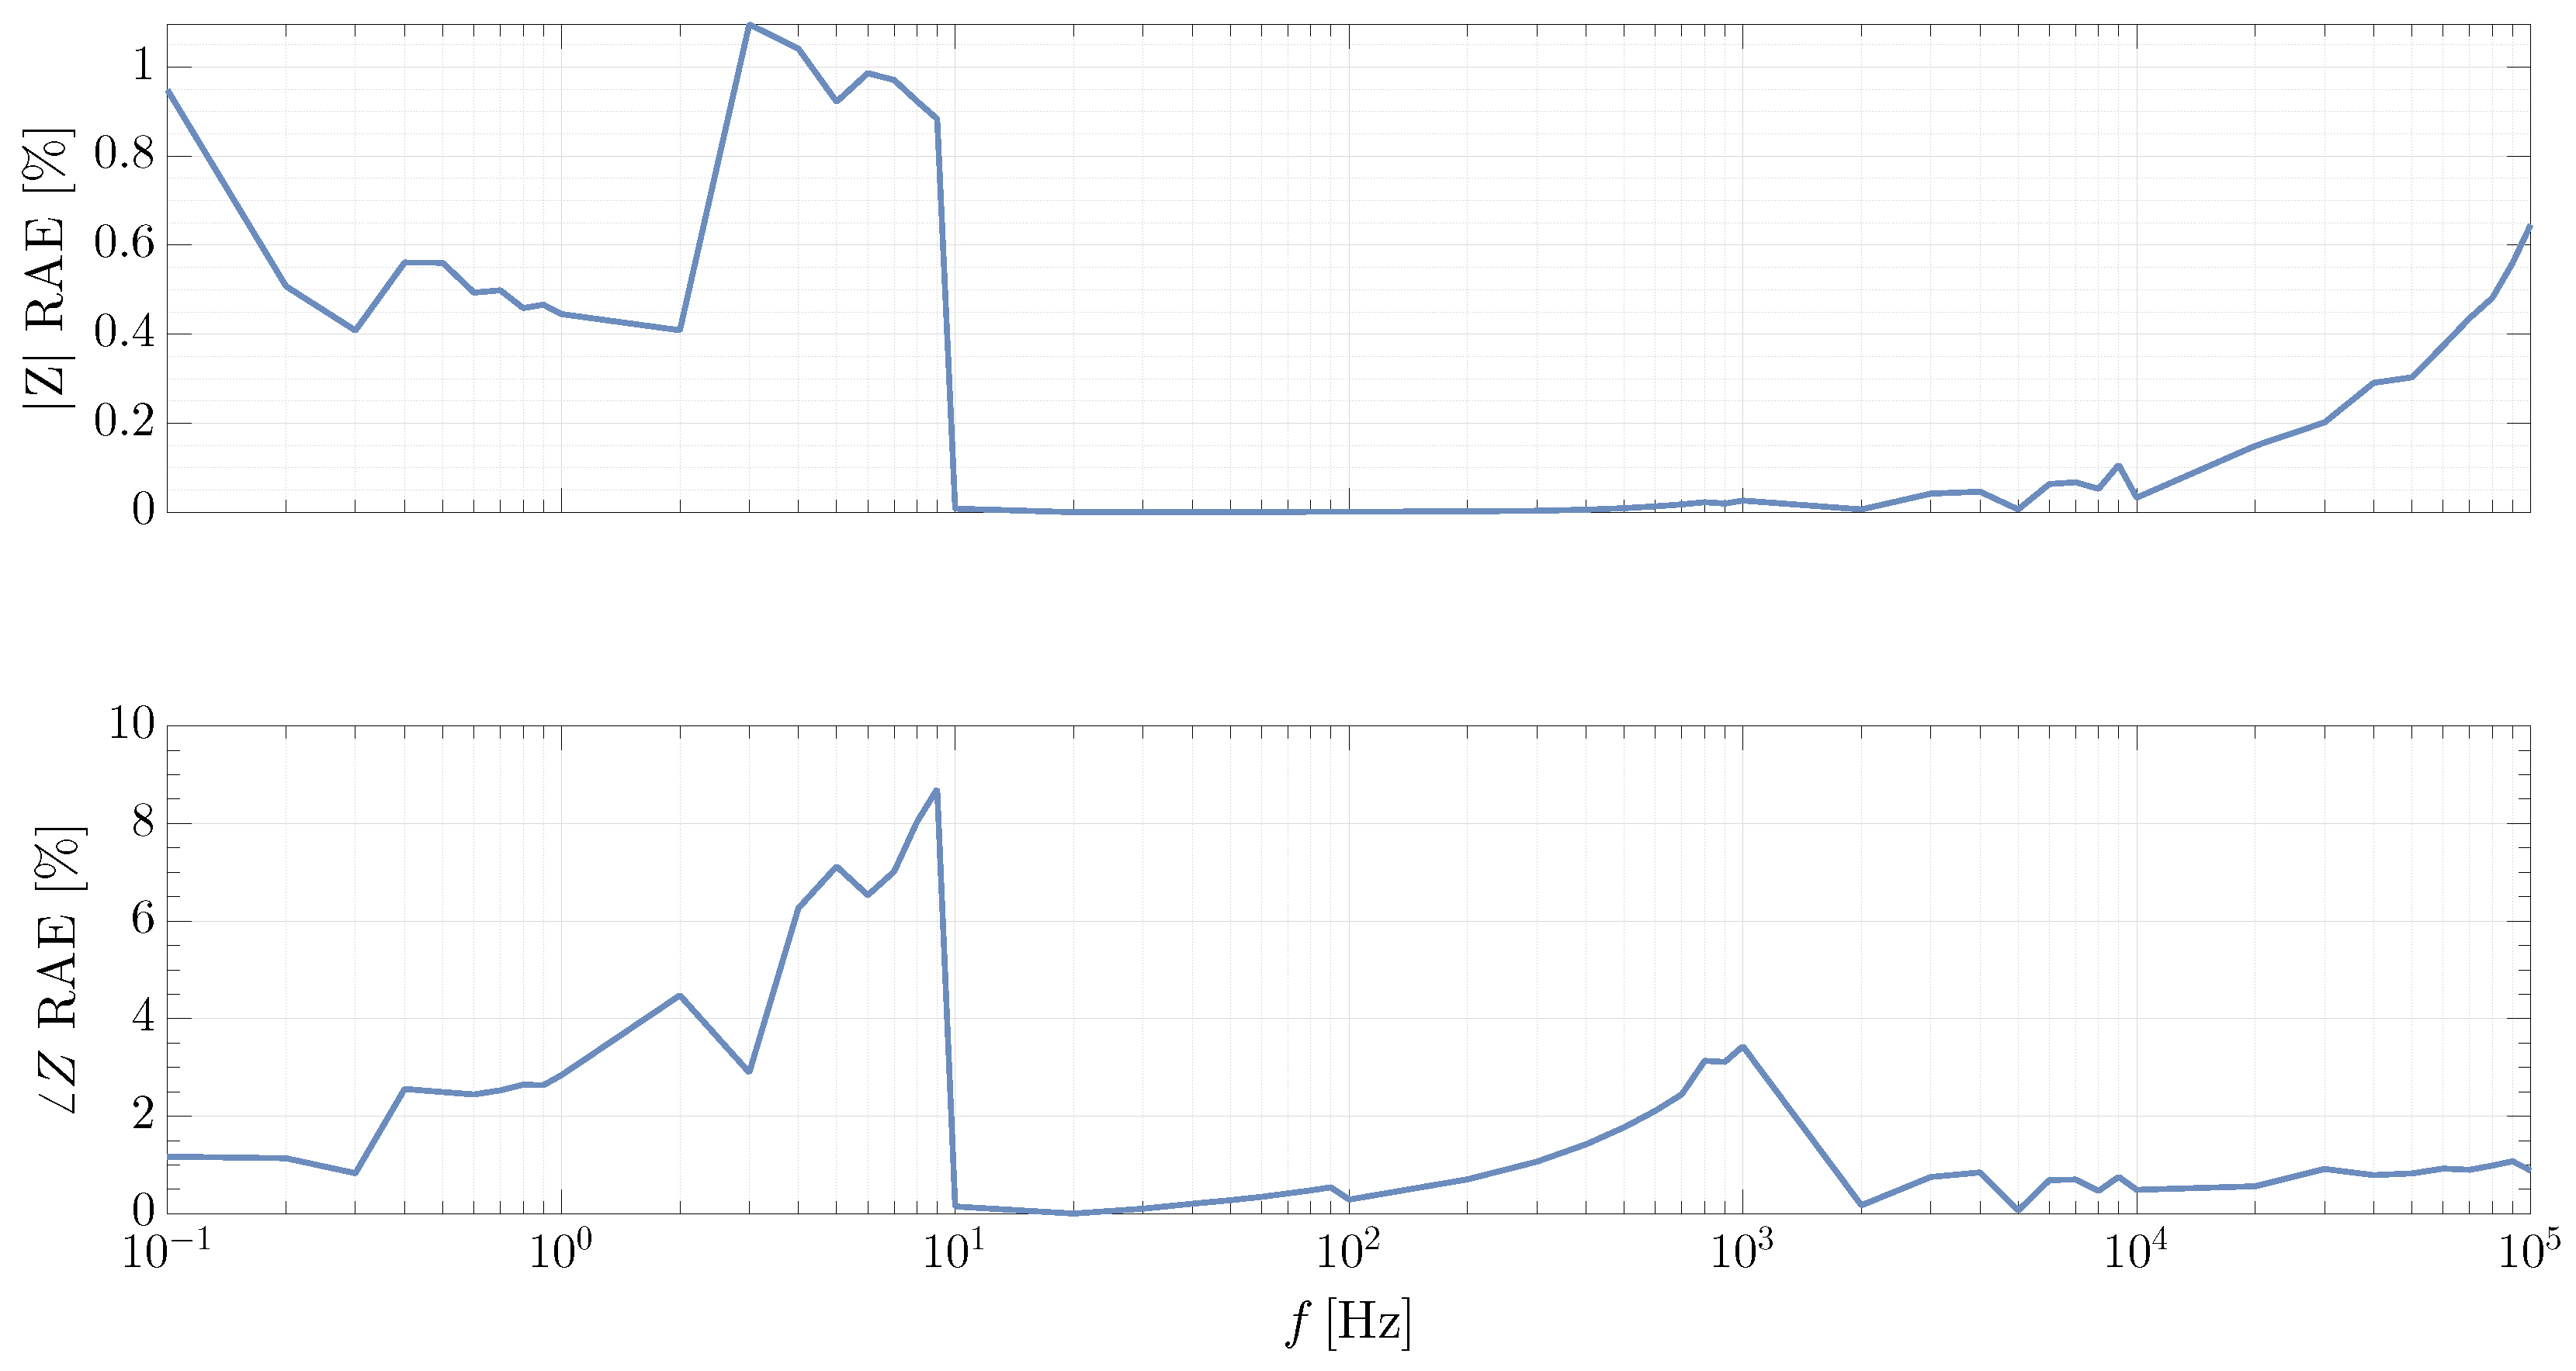
in phase, indicating strong agreement with the reference impedance. However, the error is not uniformly distributed across the frequency range. Therefore,
Figure 10 presents the error calculated at each frequency point for the impedance magnitude and phase, where the maximum error in magnitude is
at
, while the maximum phase error is
at
. As shown in
Figure 9, the largest phase errors occur in the frequency range where the SC exhibits predominantly resistive behavior and the phase tends to
, a condition that is difficult to reproduce accurately with the power converter due to the switching noise introduced by the converter, even in a simulation environment.
In general, the errors between the IS obtained with the proposed approach and the reference IS are localized in the phase at the frequencies where the resistive behavior dominates. Nevertheless, the overall error stays low across the analyzed spectrum, as it is observed in the RAE for the magnitude and phase. These results confirm that the converter-based approach enables an accurate IS estimation, but even in simulation environments, the errors are not equal to . Those results define the best-case scenario for the experimental results.
Sensitivity Analysis and Measurement Error Breakdown
A series of controlled sensitivity simulations were performed to rigorously evaluate the individual impacts of experimental uncertainties and address the requirements for targeted optimization. These analyses isolate and quantifies the decoupled contributions of probe drift, oscilloscope noise, and switching ripple on the estimated impedance spectrum accuracy, avoiding broad qualitative assumptions. To ensure empirical relevance, the magnitudes of the injected disturbances were strictly parameterized based on baseline laboratory measurements collected from the experimental setup.
First, probe drift is typically characterized as a low-frequency or stationary DC offset that primarily degrades the current measurement channel. To evaluate its influence within the proposed framework, a 50 mA DC offset (a value derived from the experimental observation of the current probes under thermal steady state) was intentionally superimposed onto the simulated current measurement (iSC in
Figure 5). Because the impedance calculation relies on the Fast Fourier Transform (FFT) evaluated strictly at the specific excitation frequencies, this DC component is entirely confined to the 0 Hz spectral bin. Consequently, the probe drift does not alter the fundamental frequency components of interest, resulting in a negligible contribution to the dynamic impedance estimation error.
Second, oscilloscope instrument noise manifests as broadband white noise distributed uniformly across the entire frequency spectrum, defining the measurement noise floor. This phenomenon was replicated by injecting independent Additive White Gaussian Noise (AWGN) sources into the simulated voltage and current measurement channels (vSC and iSC in
Figure 5), using magnitudes of 20 mV and 20 mA, respectively, to match the noise profiles characterized in the laboratory. Because the total noise power is spread across the entire spectrum, the noise energy contained within any single discrete frequency bin is small. Consequently, when the FFT is evaluated strictly at the punctual excitation frequency, the spectral extraction inherently acts as a highly selective band-pass filter. This mechanism successfully isolates the signal of interest from the broadband noise floor, ensuring that oscilloscope noise has a minimal impact.
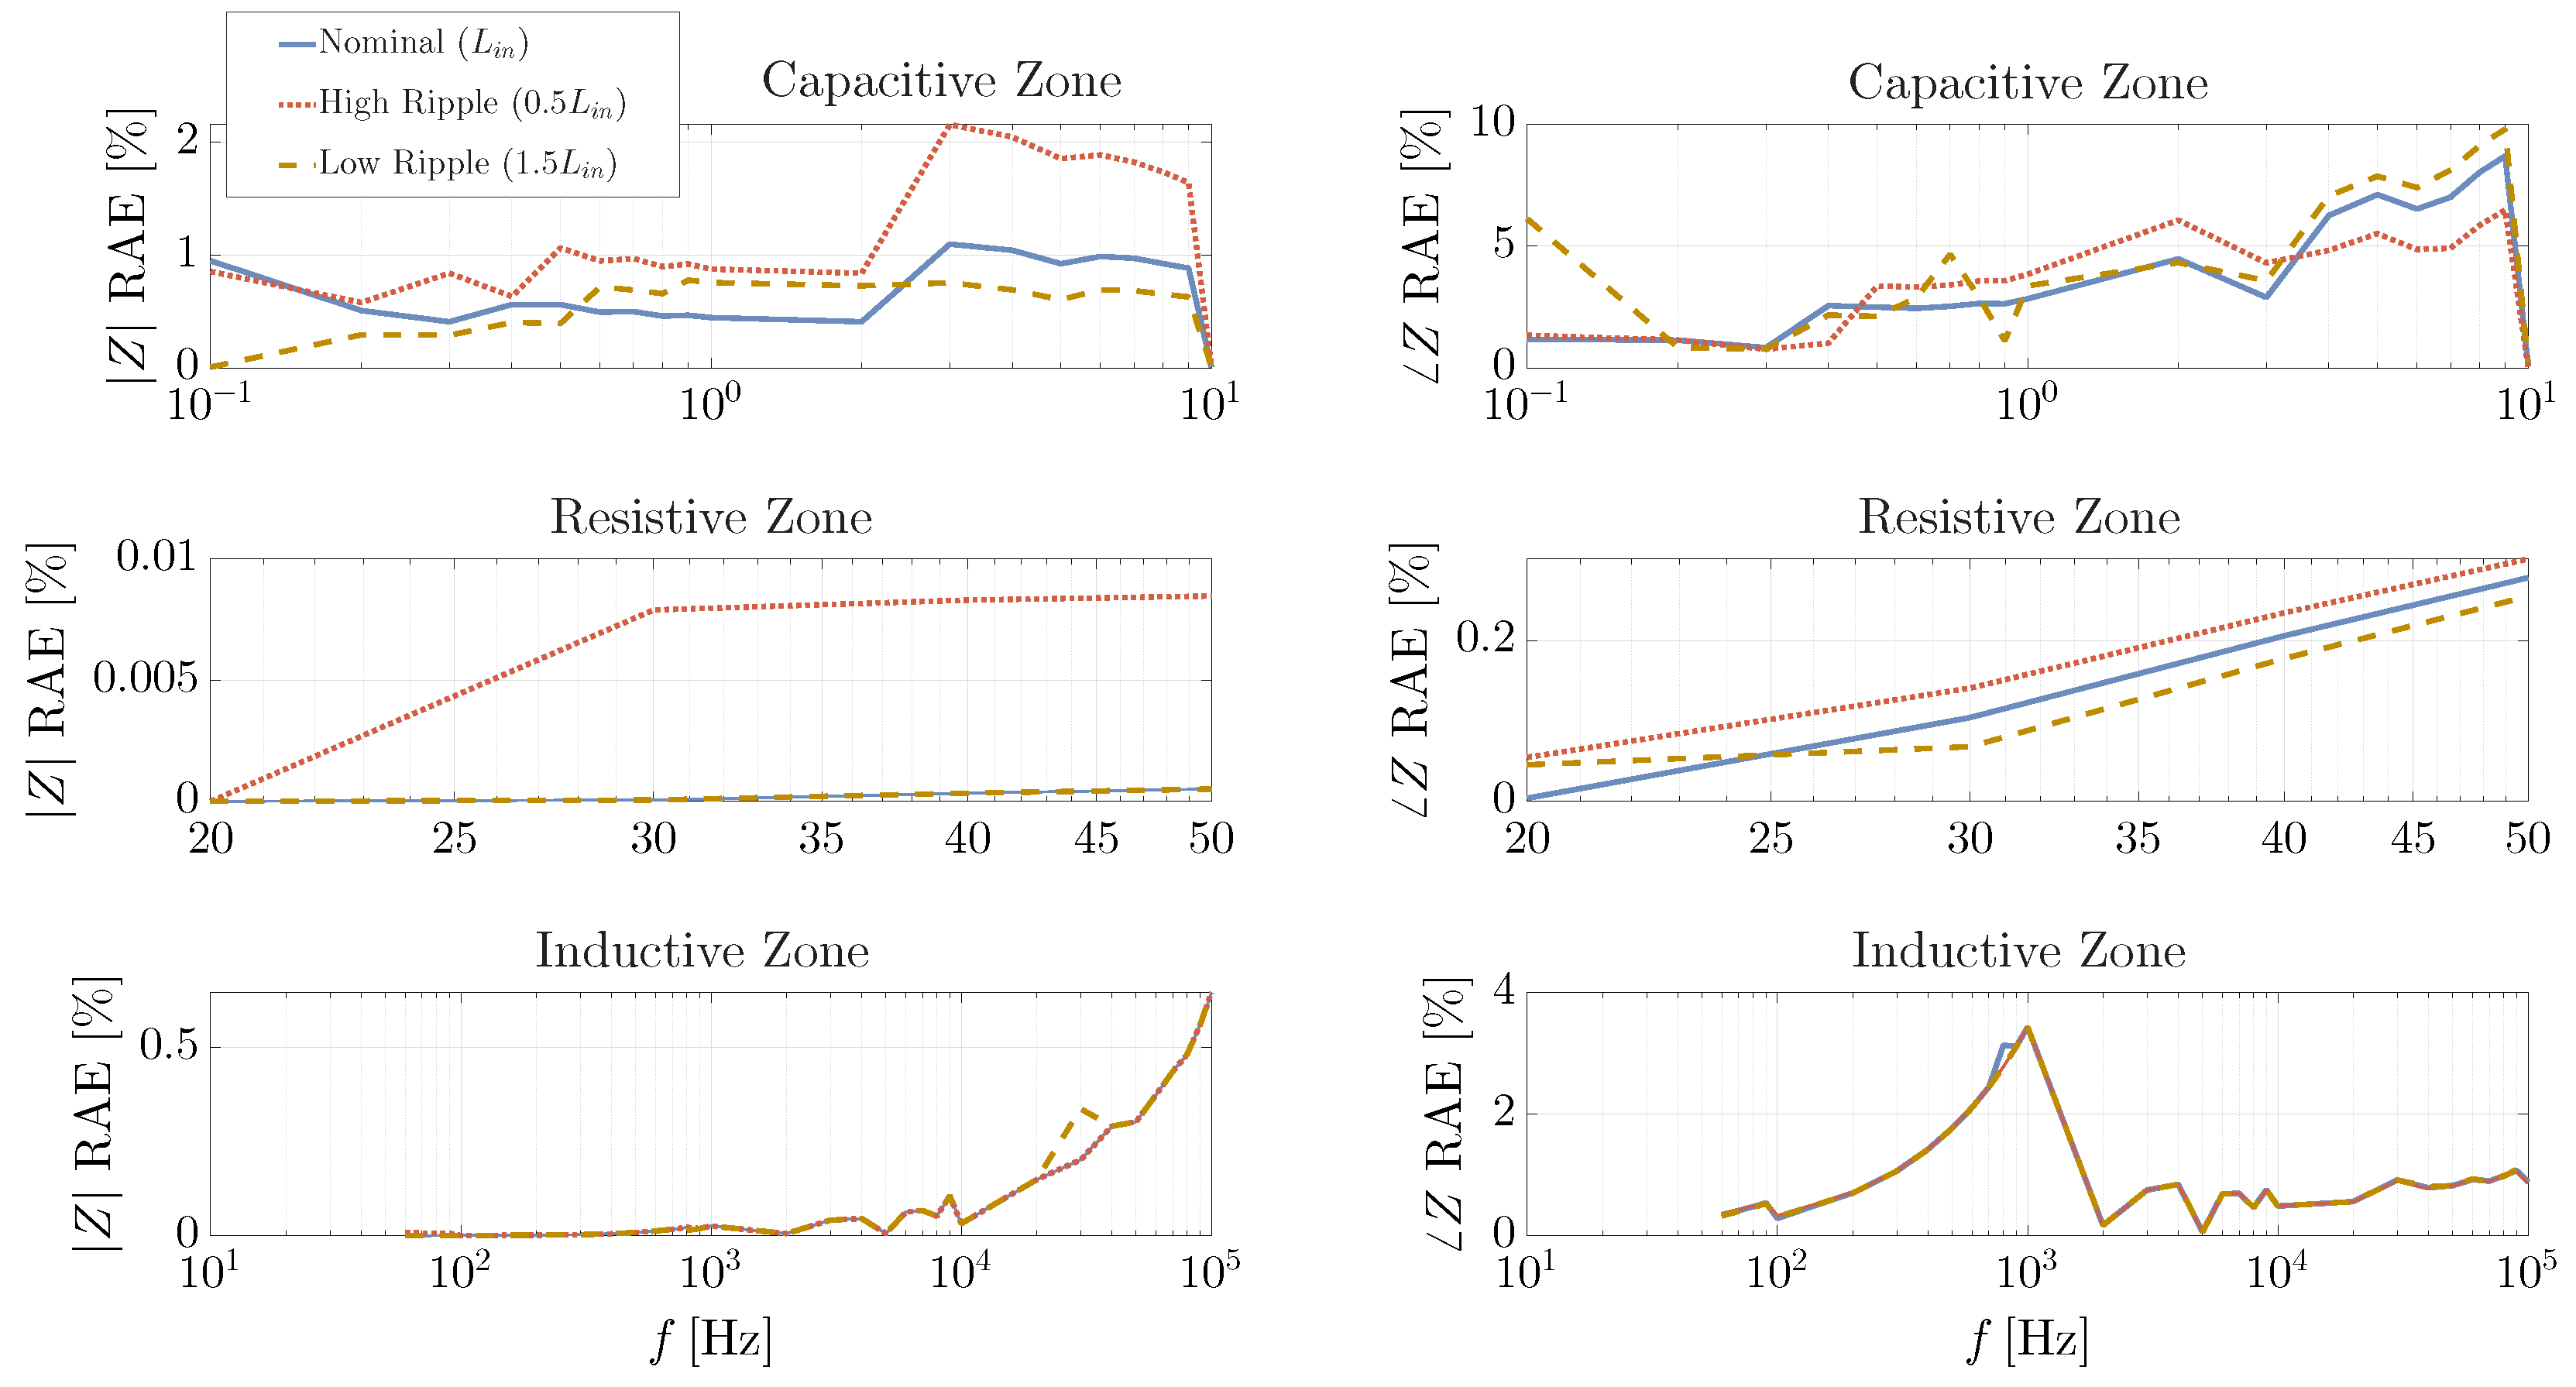
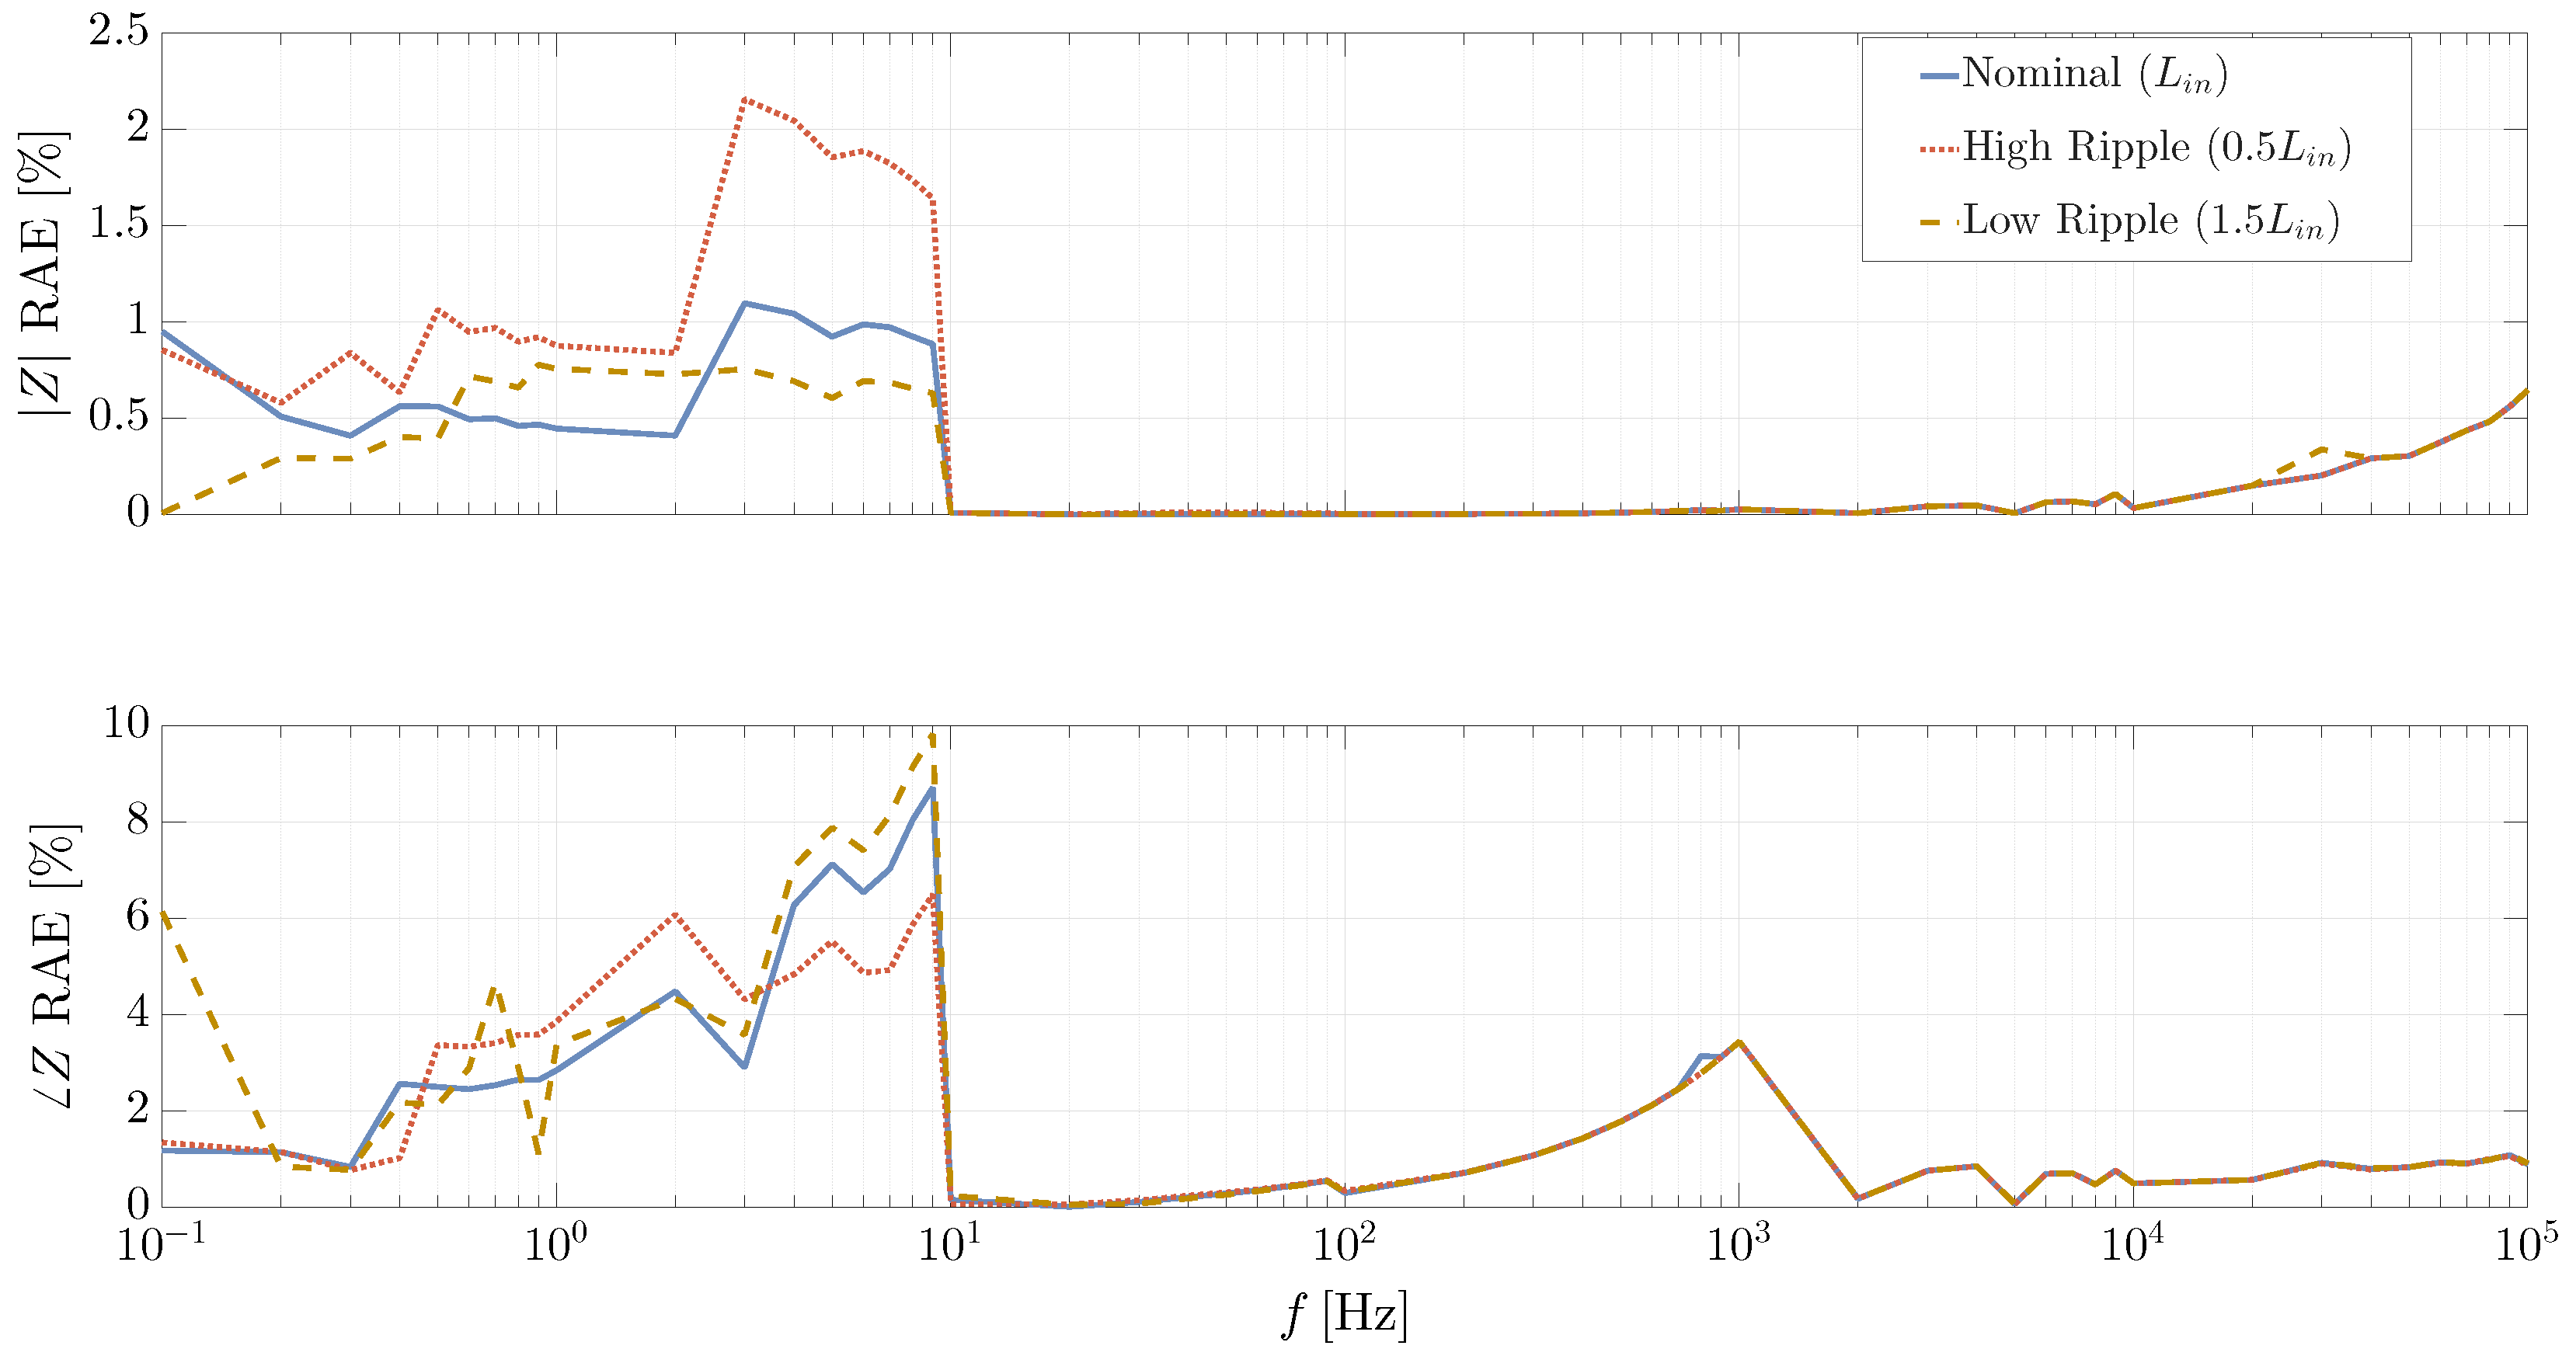
Third, the switching ripple constitutes the dominant source of deterministic noise in this converter-based IS framework. To thoroughly quantify its contribution to the estimation accuracy, a sensitivity analysis was conducted by varying the converter input inductance, which directly scales the high-frequency switching ripple amplitude. Under the nominal baseline condition (
), the system achieves an overall Range-Average Absolute Error (RAAE) of 0.301% in magnitude and 1.949% in phase across the full frequency sweep. To test the sensitivity of this predominant noise source, the system was evaluated under two non-nominal conditions: a reduced inductance scenario (
) to induce a higher switching ripple, and an increased inductance scenario (
) to attenuate it. The global impact of these variations across the continuous frequency spectrum is illustrated in
Figure 11.
To provide a more precise analysis of the switching ripple effect in specific electrochemical dynamics, the estimation error was separated into three operational zones defined by the impedance phase angle: the capacitive zone (phase angles from
to
), the resistive zone (phase angles from
to
), and the inductive zone (phase angles from
to
). This zone-based error breakdown is depicted in
Figure 12, revealing highly localized sensitivities to the ripple amplitude.
In the capacitive zone, the magnitude error exhibits the highest sensitivity to switching ripple variations. When the inductance is reduced (), the amplified ripple severely distorts the low-frequency voltage response, causing the capacitive magnitude RAAE to degrade from 0.662% (nominal) up to 1.187%. Instead, attenuating the ripple with a larger inductor () successfully minimizes this distortion, reducing the capacitive magnitude RAAE to 0.548%. Interestingly, the phase RAAE within this capacitive region shows an inverse trend, where the nominal condition yields 3.815%, shifting to 3.594% under high ripple and 4.449% under low ripple effects, which indicates a complex interaction between the ripple harmonics and the phase extraction at very low frequencies.
In the resistive zone (where the phase angle approaches zero), the magnitude RAAE remains remarkably near 0% for both nominal and low-ripple cases, rising marginally to only 0.006% under the high-ripple scenario. However, the phase RAAE in this purely resistive region is highly vulnerable to switching residuals, degrading from 0.148% (nominal) to 0.183% when the inductance drops to (high switching ripple), and improving to 0.137% when the inductance is increased to (low switching ripple). This behavior validates that reducing the high-frequency ripple is crucial to prevent phase jitter during zero-crossing detection when the system behaves like a pure resistor. Finally, the inductive zone demonstrates structural robustness against switching noise, maintaining a virtually constant magnitude RAAE around 0.125% (0.125% for nominal and , and 0.129% for ) and a stable phase RAAE around 1.06% across all inductance values.
5. Experimental Results
An experimental setup is implemented to evaluate the performance of the proposed converter-based IS measurement under real operating conditions. The main components and operating conditions of the setup are summarized in
Table 5. The setup uses the same SC module considered in the simulation study, namely the BMOD0058 module from Maxwell Technologies [
43]. The SC is connected to a
DC bus through a bidirectional Buck converter built with a
SPM-HB module from Taraz Technologies [
45] and two series-connected inductors, resulting in
.
The converter duty cycle is generated using a F28379D LaunchPad XL from Texas Instruments [
46], where Equation (
14) is implemented to produce sinusoidal perturbations at different frequencies. The SC voltage and current are measured using an OWON SDS1102 oscilloscope [
47], together with a PP-90 voltage probe [
48] and an RT-ZC20 Rogowski current probe [
49]. A BK Precision 1673 dual-output DC power supply [
50] is used to establish the DC bus voltage, to pre-charge the SC, and to supply the auxiliary circuitry required by the Taraz power module.
Before each IS measurement, a pre-conditioning procedure is performed to ensure repeatable initial conditions. First, the SC is connected to a resistor for to discharge the module. Then, the SC is charged to the selected operating voltage by connecting it in series with a resistor and one channel of the BK Precision 1673 DC power supply configured at . This condition is maintained for to allow the SC voltage to settle around the desired operating point. After this pre-conditioning stage, the SC is disconnected from the charging resistor and connected either to the converter-based setup or to the FRA-based reference setup to perform the IS measurements. This procedure ensures that the SC starts each measurement from approximately the same voltage condition, improving the repeatability of the experimental data (impedance spectra).
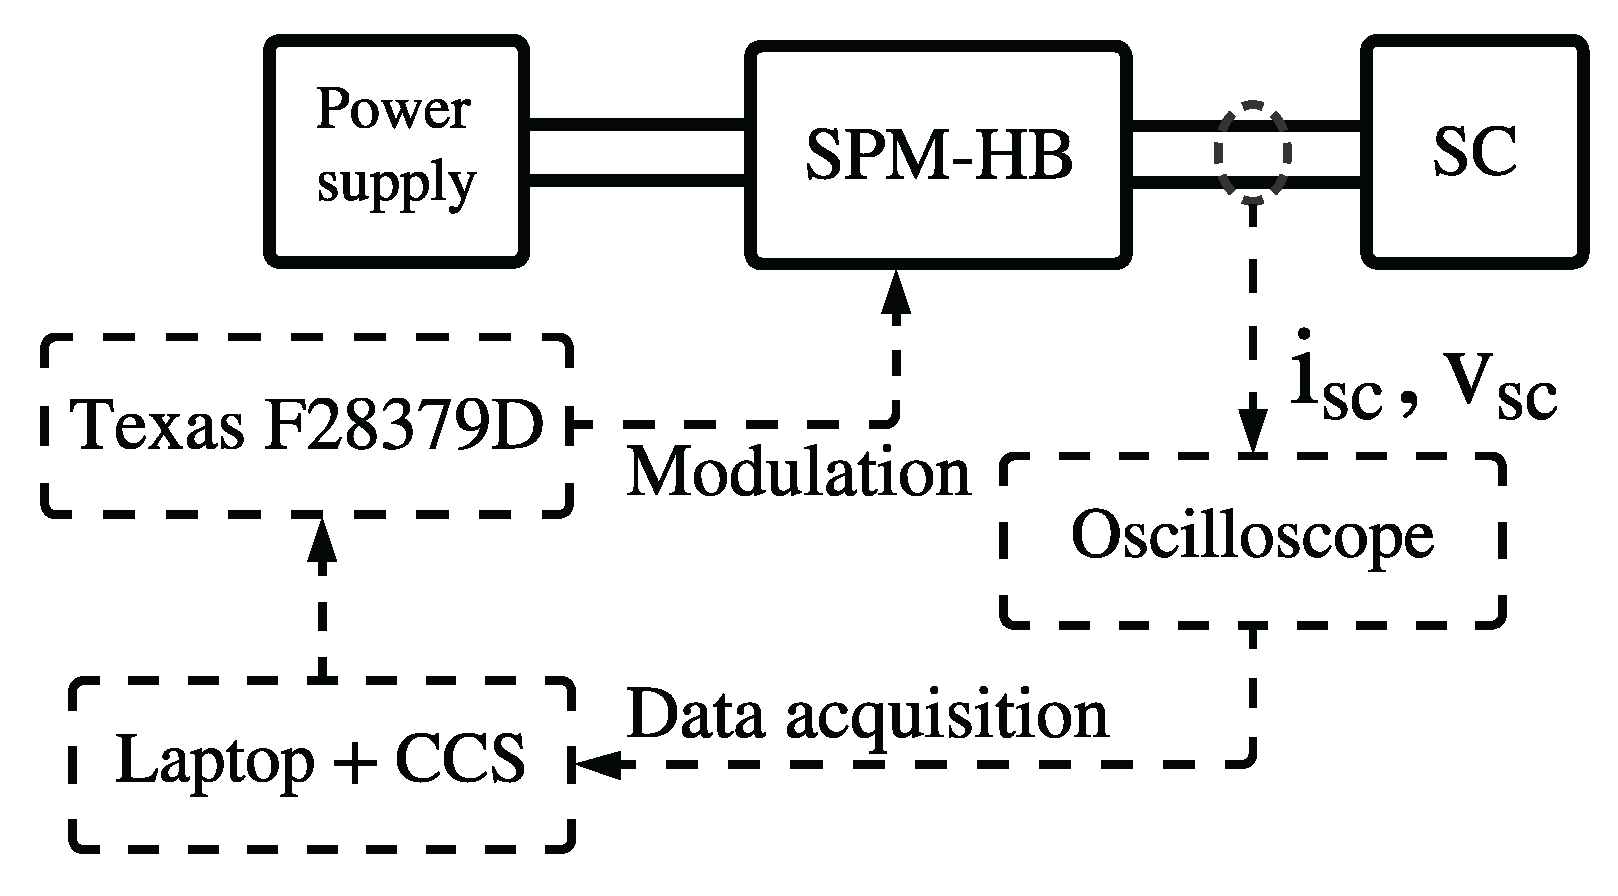
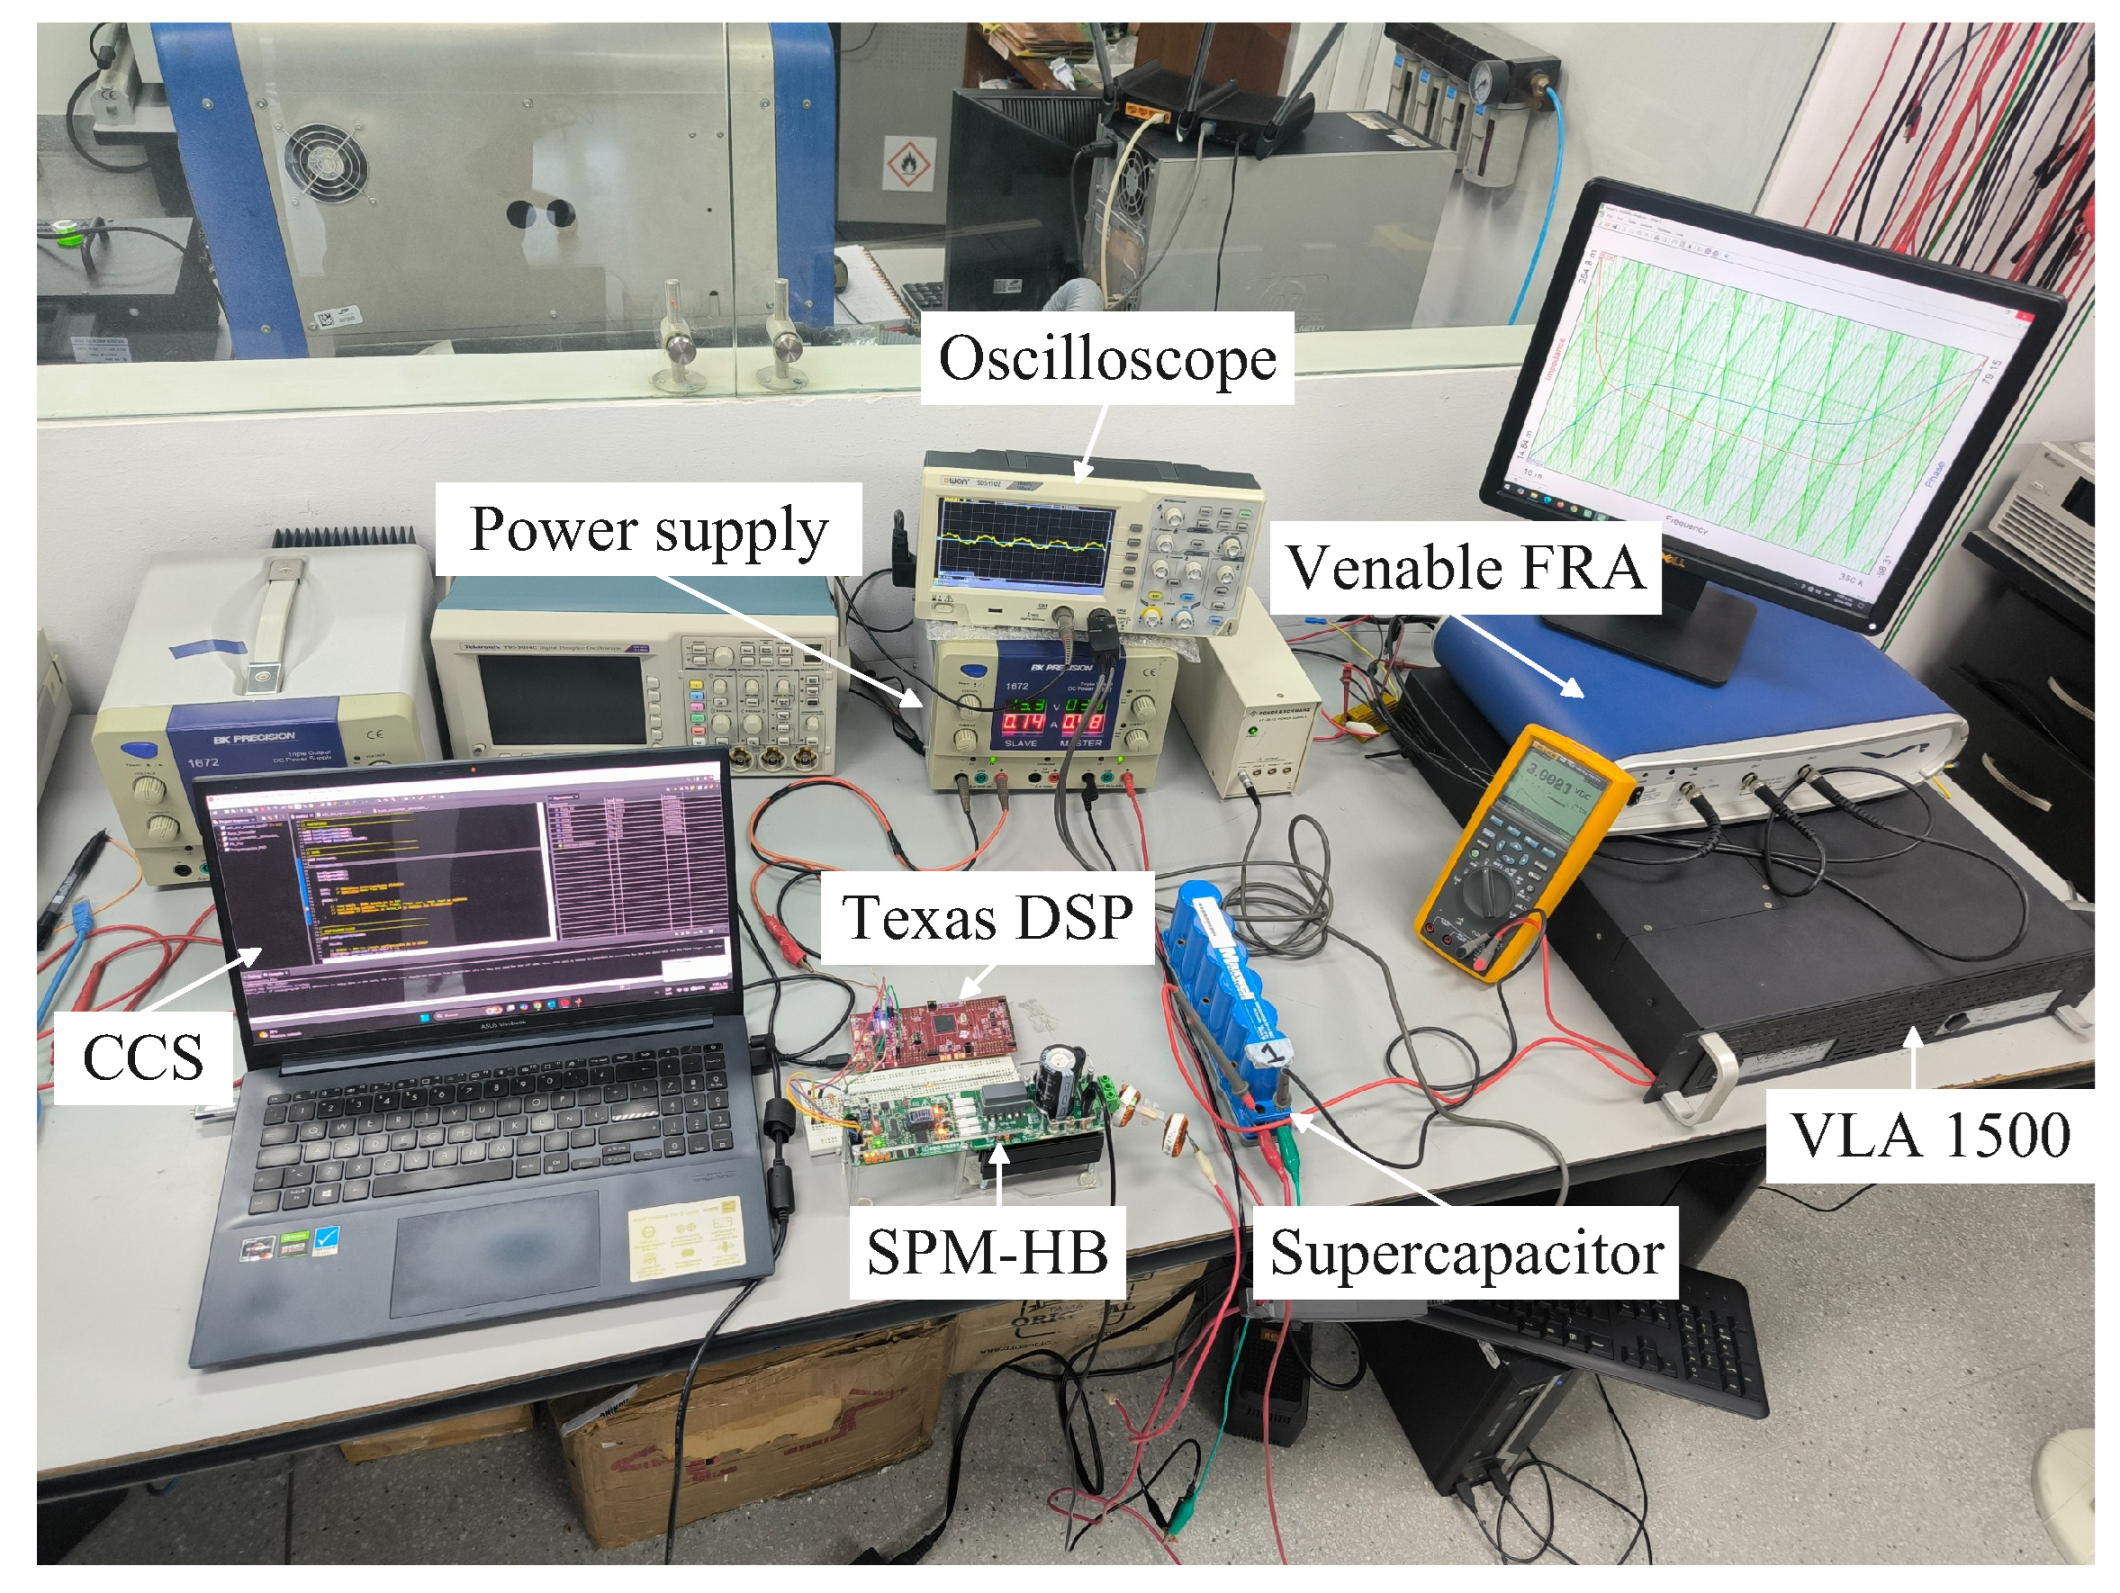
Figure 13 presents a conceptual diagram of the experimental setup used for the converter-based IS measurements. This diagram complements the physical implementation shown in
Figure 14, clarifying the electrical connections among the SC, the bidirectional Buck converter, the DC power supply, the digital controller, the laptop running Code Composer Studio (CCS), and the voltage and current measurement instruments. For the converter-based implementation, another channel of the BK Precision 1673 supply is used to establish the
DC bus, while the auxiliary outputs are used to energize the additional circuitry required by the Taraz power module.
For validation purposes, a reference impedance measurement is obtained using a commercial Venable 6320 FRA [
51].
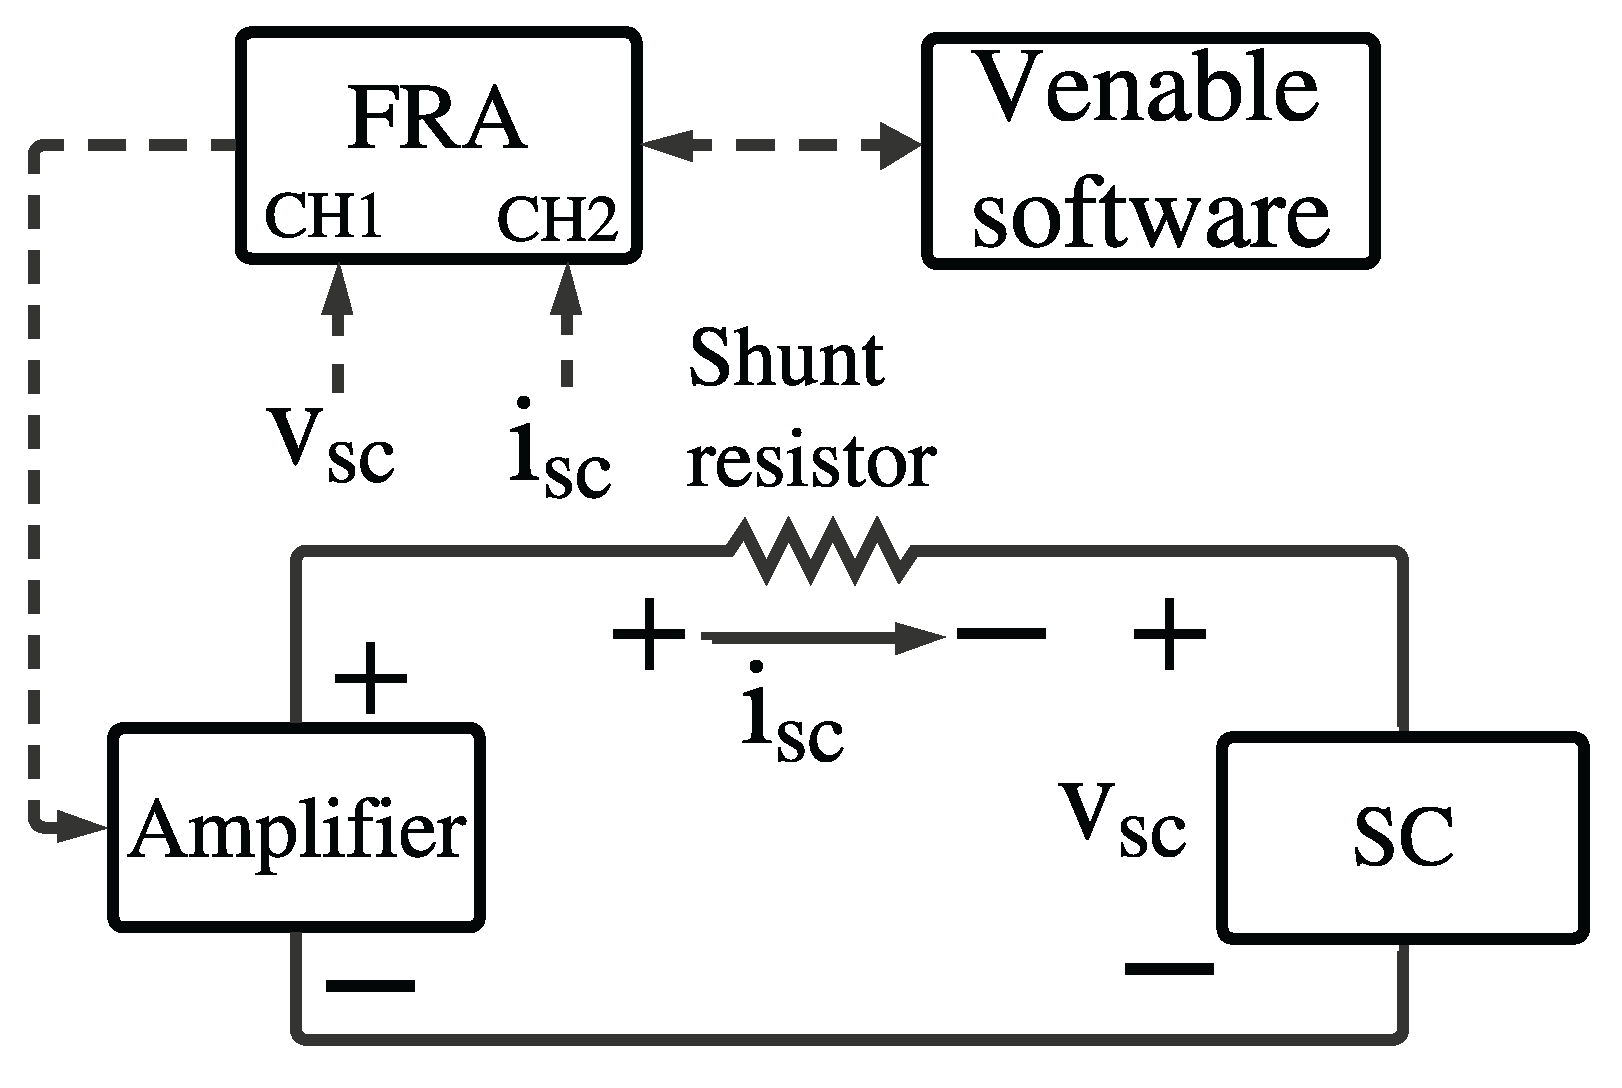
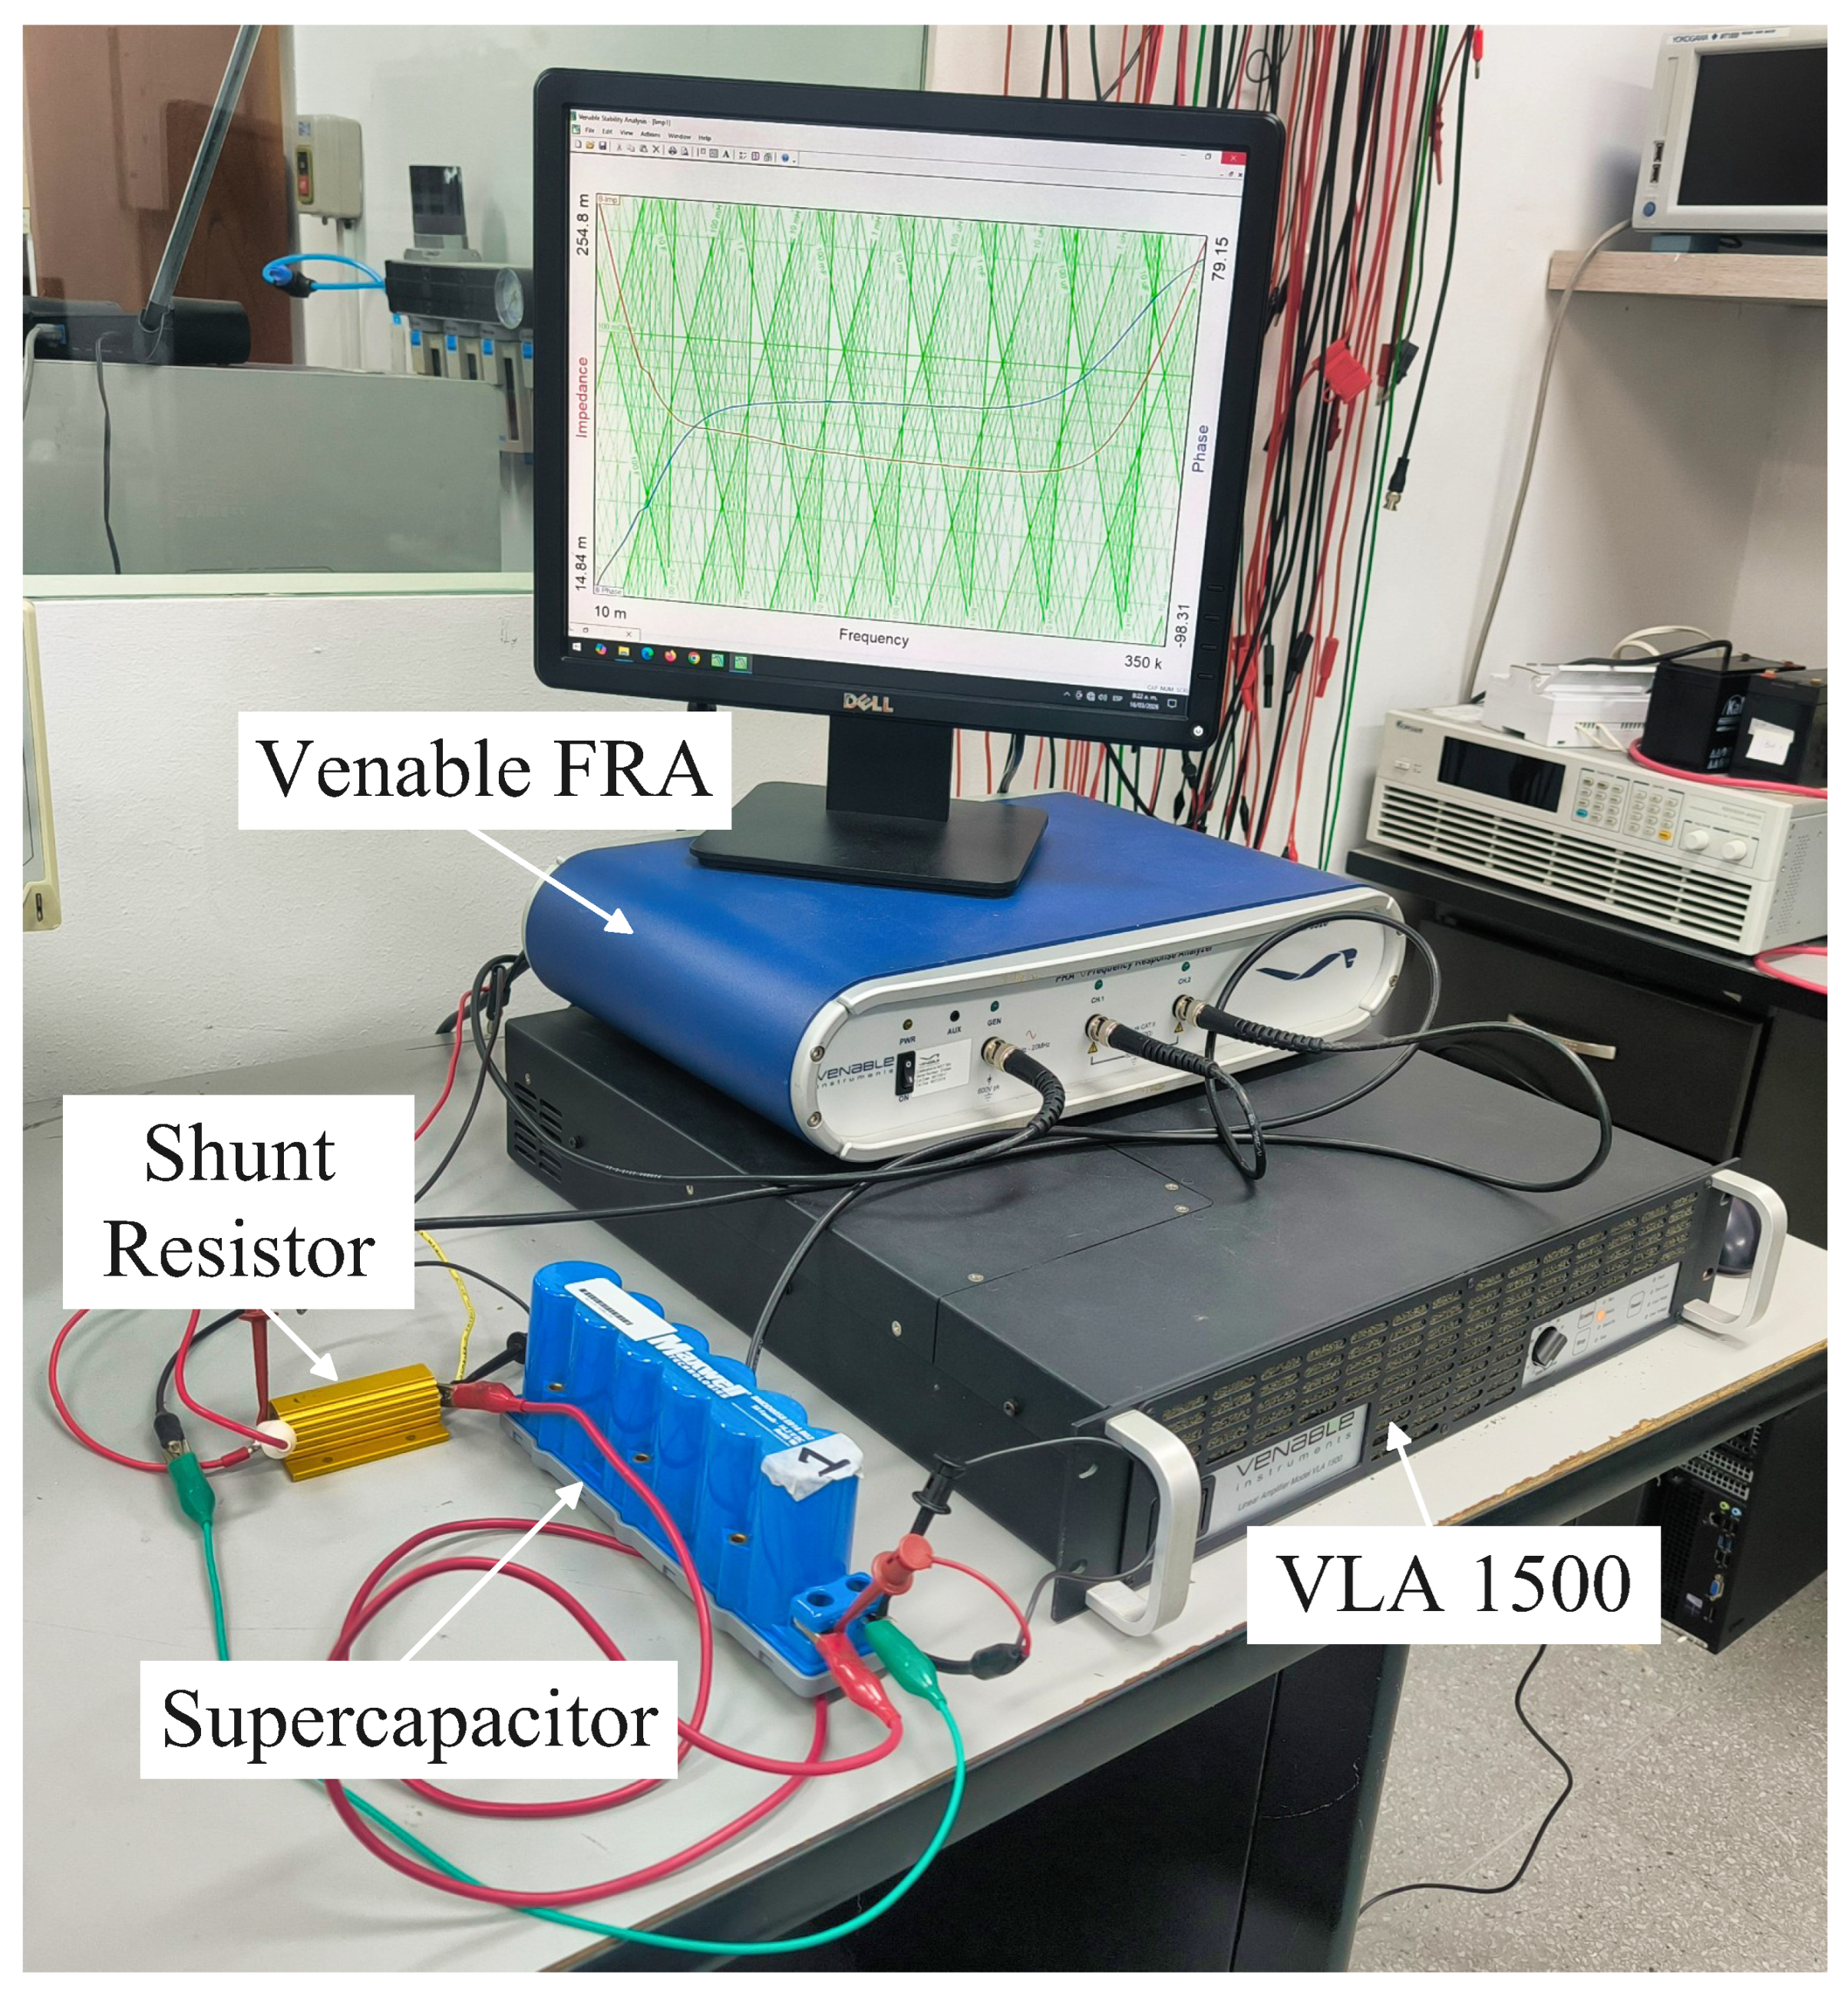
Figure 15 presents the conceptual connection diagram of the FRA-based setup, illustrating the interconnection among the FRA, the VLA 1500 power amplifier, the SC, and the voltage and current measurement probes. The VLA 1500 is used to amplify the low-power excitation signal generated by the FRA, enabling the injection of the required sinusoidal perturbation into the SC under power-electronic operating conditions. The corresponding physical implementation is shown in
Figure 16. This setup enables sinusoidal excitation of the SC using commercial FRA-based instrumentation, while the same voltage and current probes of the converter-based setup are used to ensure measurement consistency.
The frequency range used in each setup is defined according to the practical limitations of the corresponding excitation hardware. For the converter-based implementation, the IS measurement is performed from to . The upper frequency is limited by the converter switching frequency, , and by the need to keep the injected sinusoidal perturbation sufficiently below the switching frequency to ensure adequate current generation and measurement. The lower frequency is selected as a trade-off between capturing the relevant low-frequency behavior within the experimental bandwidth of the converter-based setup and avoiding excessive acquisition times and data volume. For the FRA-based reference measurement, the frequency range is extended from to . The upper limit corresponds to the maximum operating range of the FRA and power amplifier, while the lower limit allows the reference measurement to capture slower SC dynamics that require longer excitation periods.
An additional experimental aspect must be considered since, given the low impedance of the SC across the analyzed frequency range, the impedance introduced by the measurement cables is no longer negligible. Under these conditions, the parasitic contributions from connectors and cables can significantly distort the experimental signature of the device, especially at higher frequencies where cable inductance becomes comparable to the milliohm-range impedance of the SC itself. To compensate for those effects, the measurement paths of the FRA-based reference setup were independently characterized through calibration routines prior to the final tests. This allowed the specific parasitic impedance of the FRA cables to be isolated and subsequently subtracted from the raw measurement data. By removing this effect, the resulting spectrum accurately reflects the true impedance signature of the supercapacitor, ensuring a reliable baseline for validation.
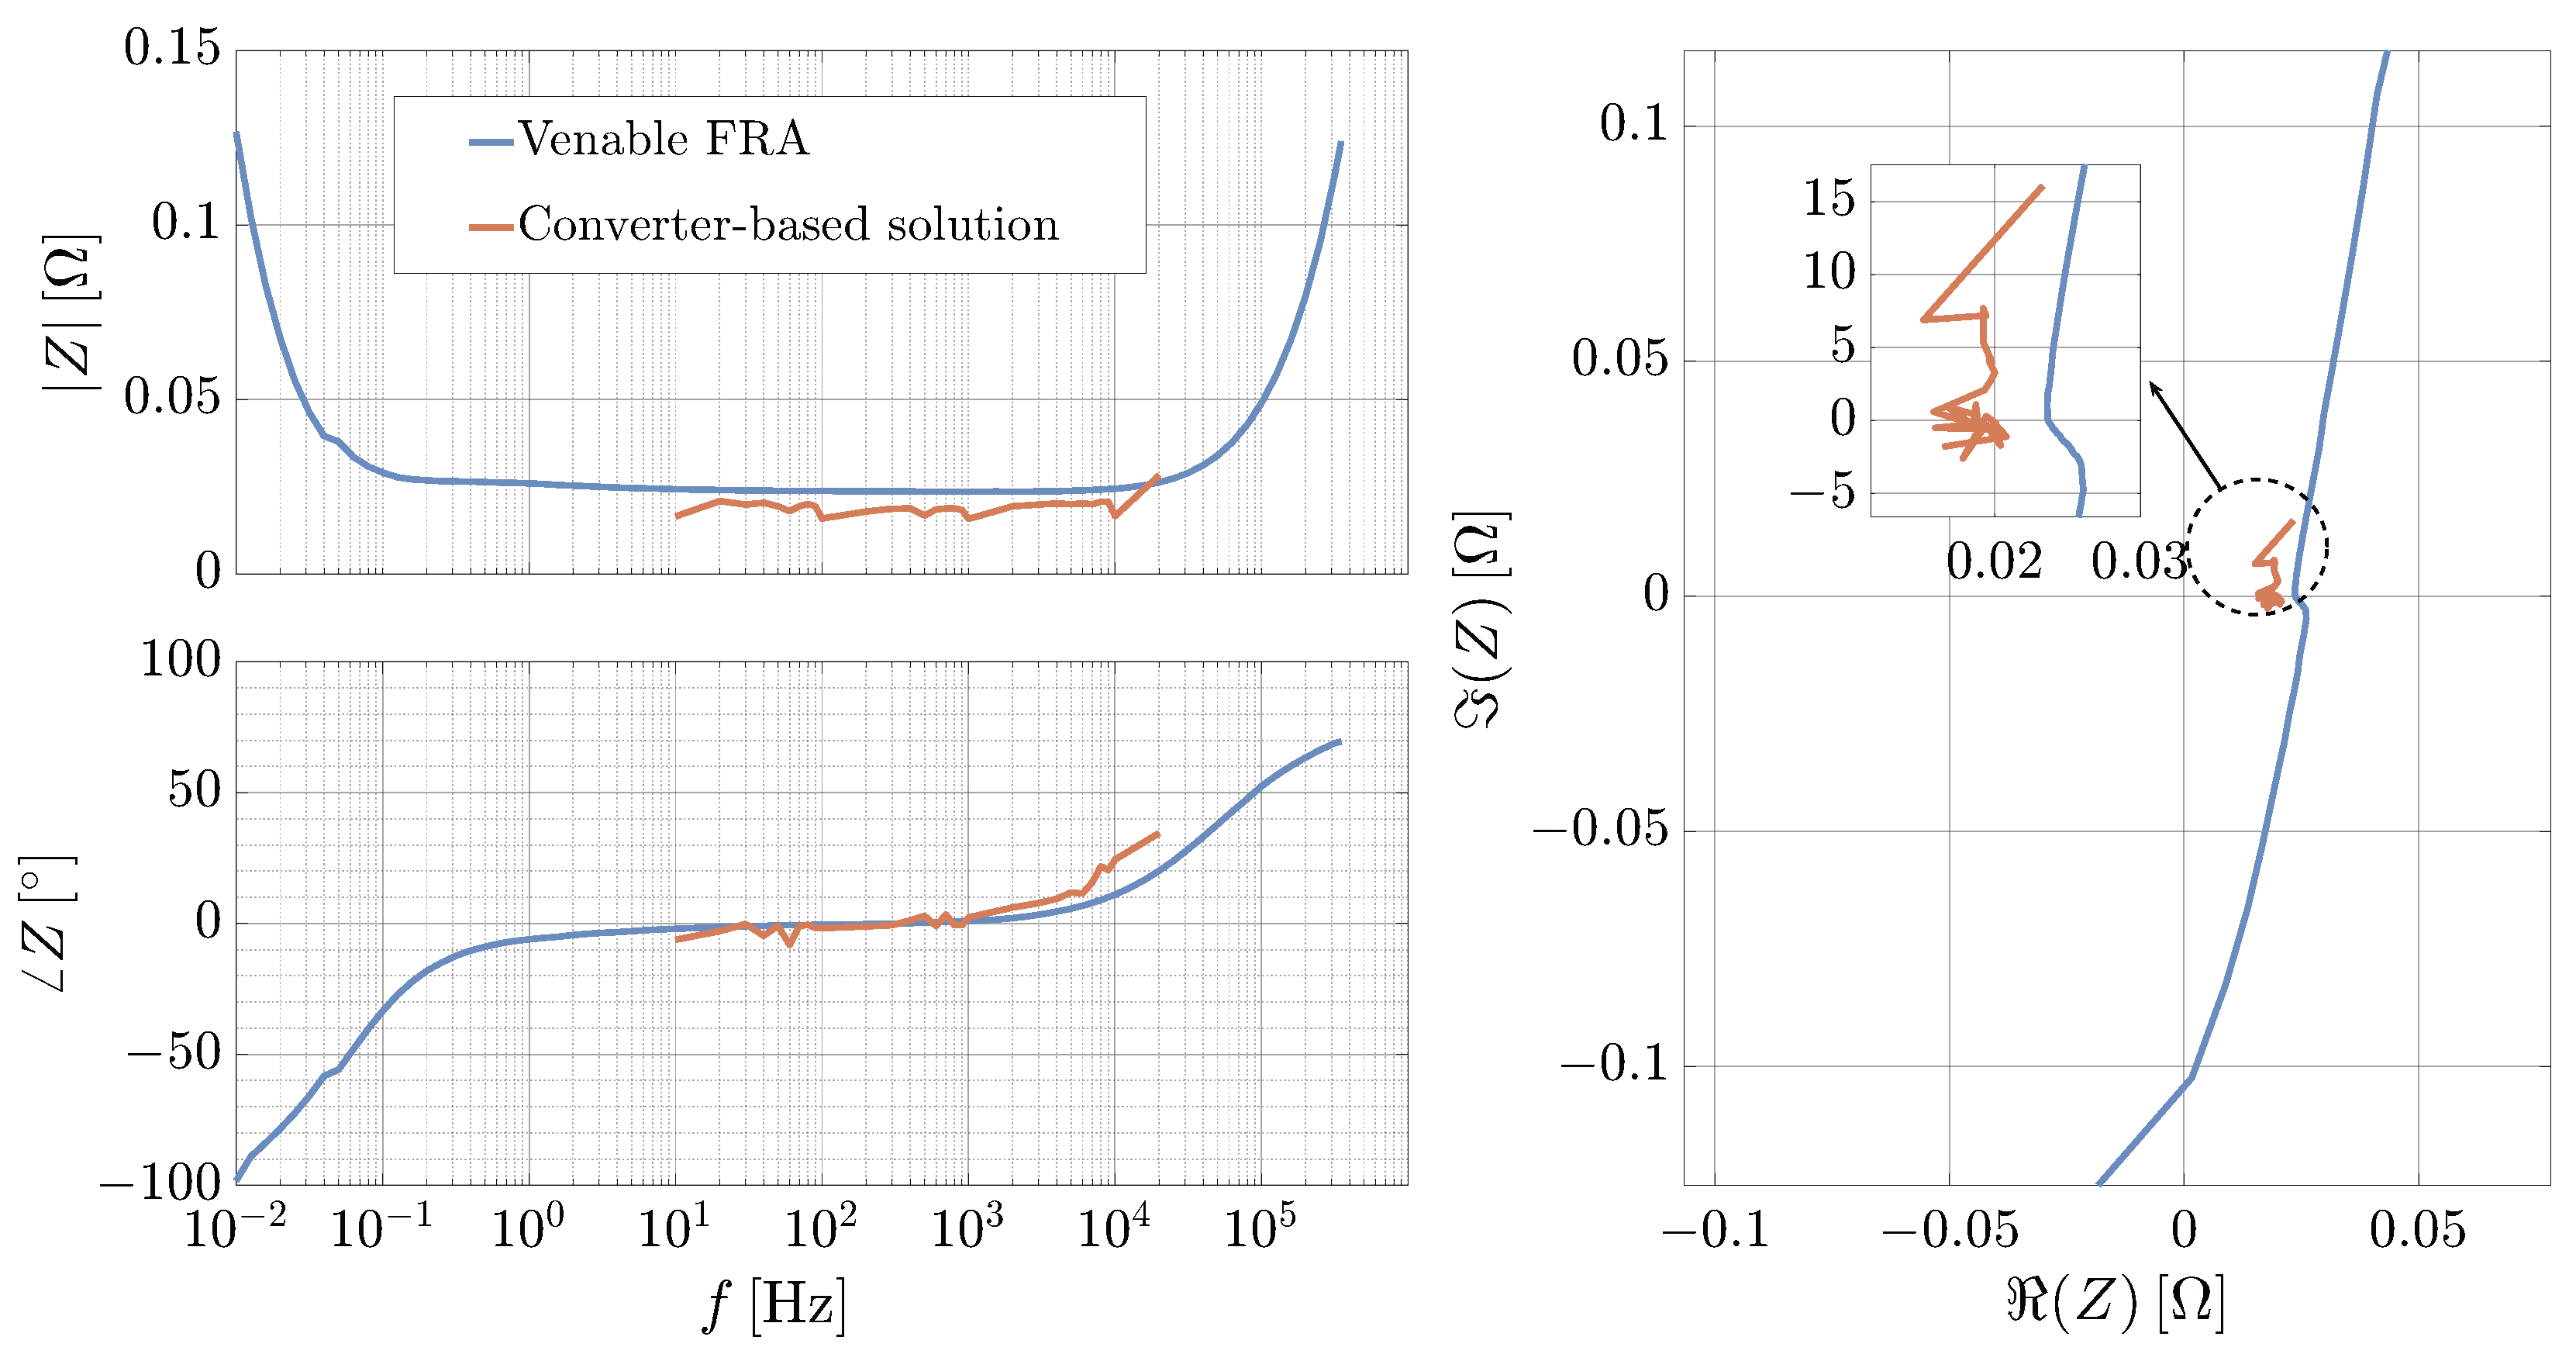
From the experimental Bode diagram reported at the left of
Figure 17, the magnitude response obtained with the proposed system follows the overall trend of the reference measurement across the analyzed frequency range. Although deviations are still observed, the proposed method accurately captures the frequency-dependent behavior of the SC after compensating for the parasitic contribution of the measurement paths. The phase response agrees with the FRA measurements, preserving the dominant dynamic characteristics despite localized discrepancies. The Nyquist representation (right side of
Figure 17) confirms that the proposed approach reproduces the characteristic trajectory of the SC impedance, including both capacitive and inductive regions, with deviations consistent with those observed in the Bode plots.
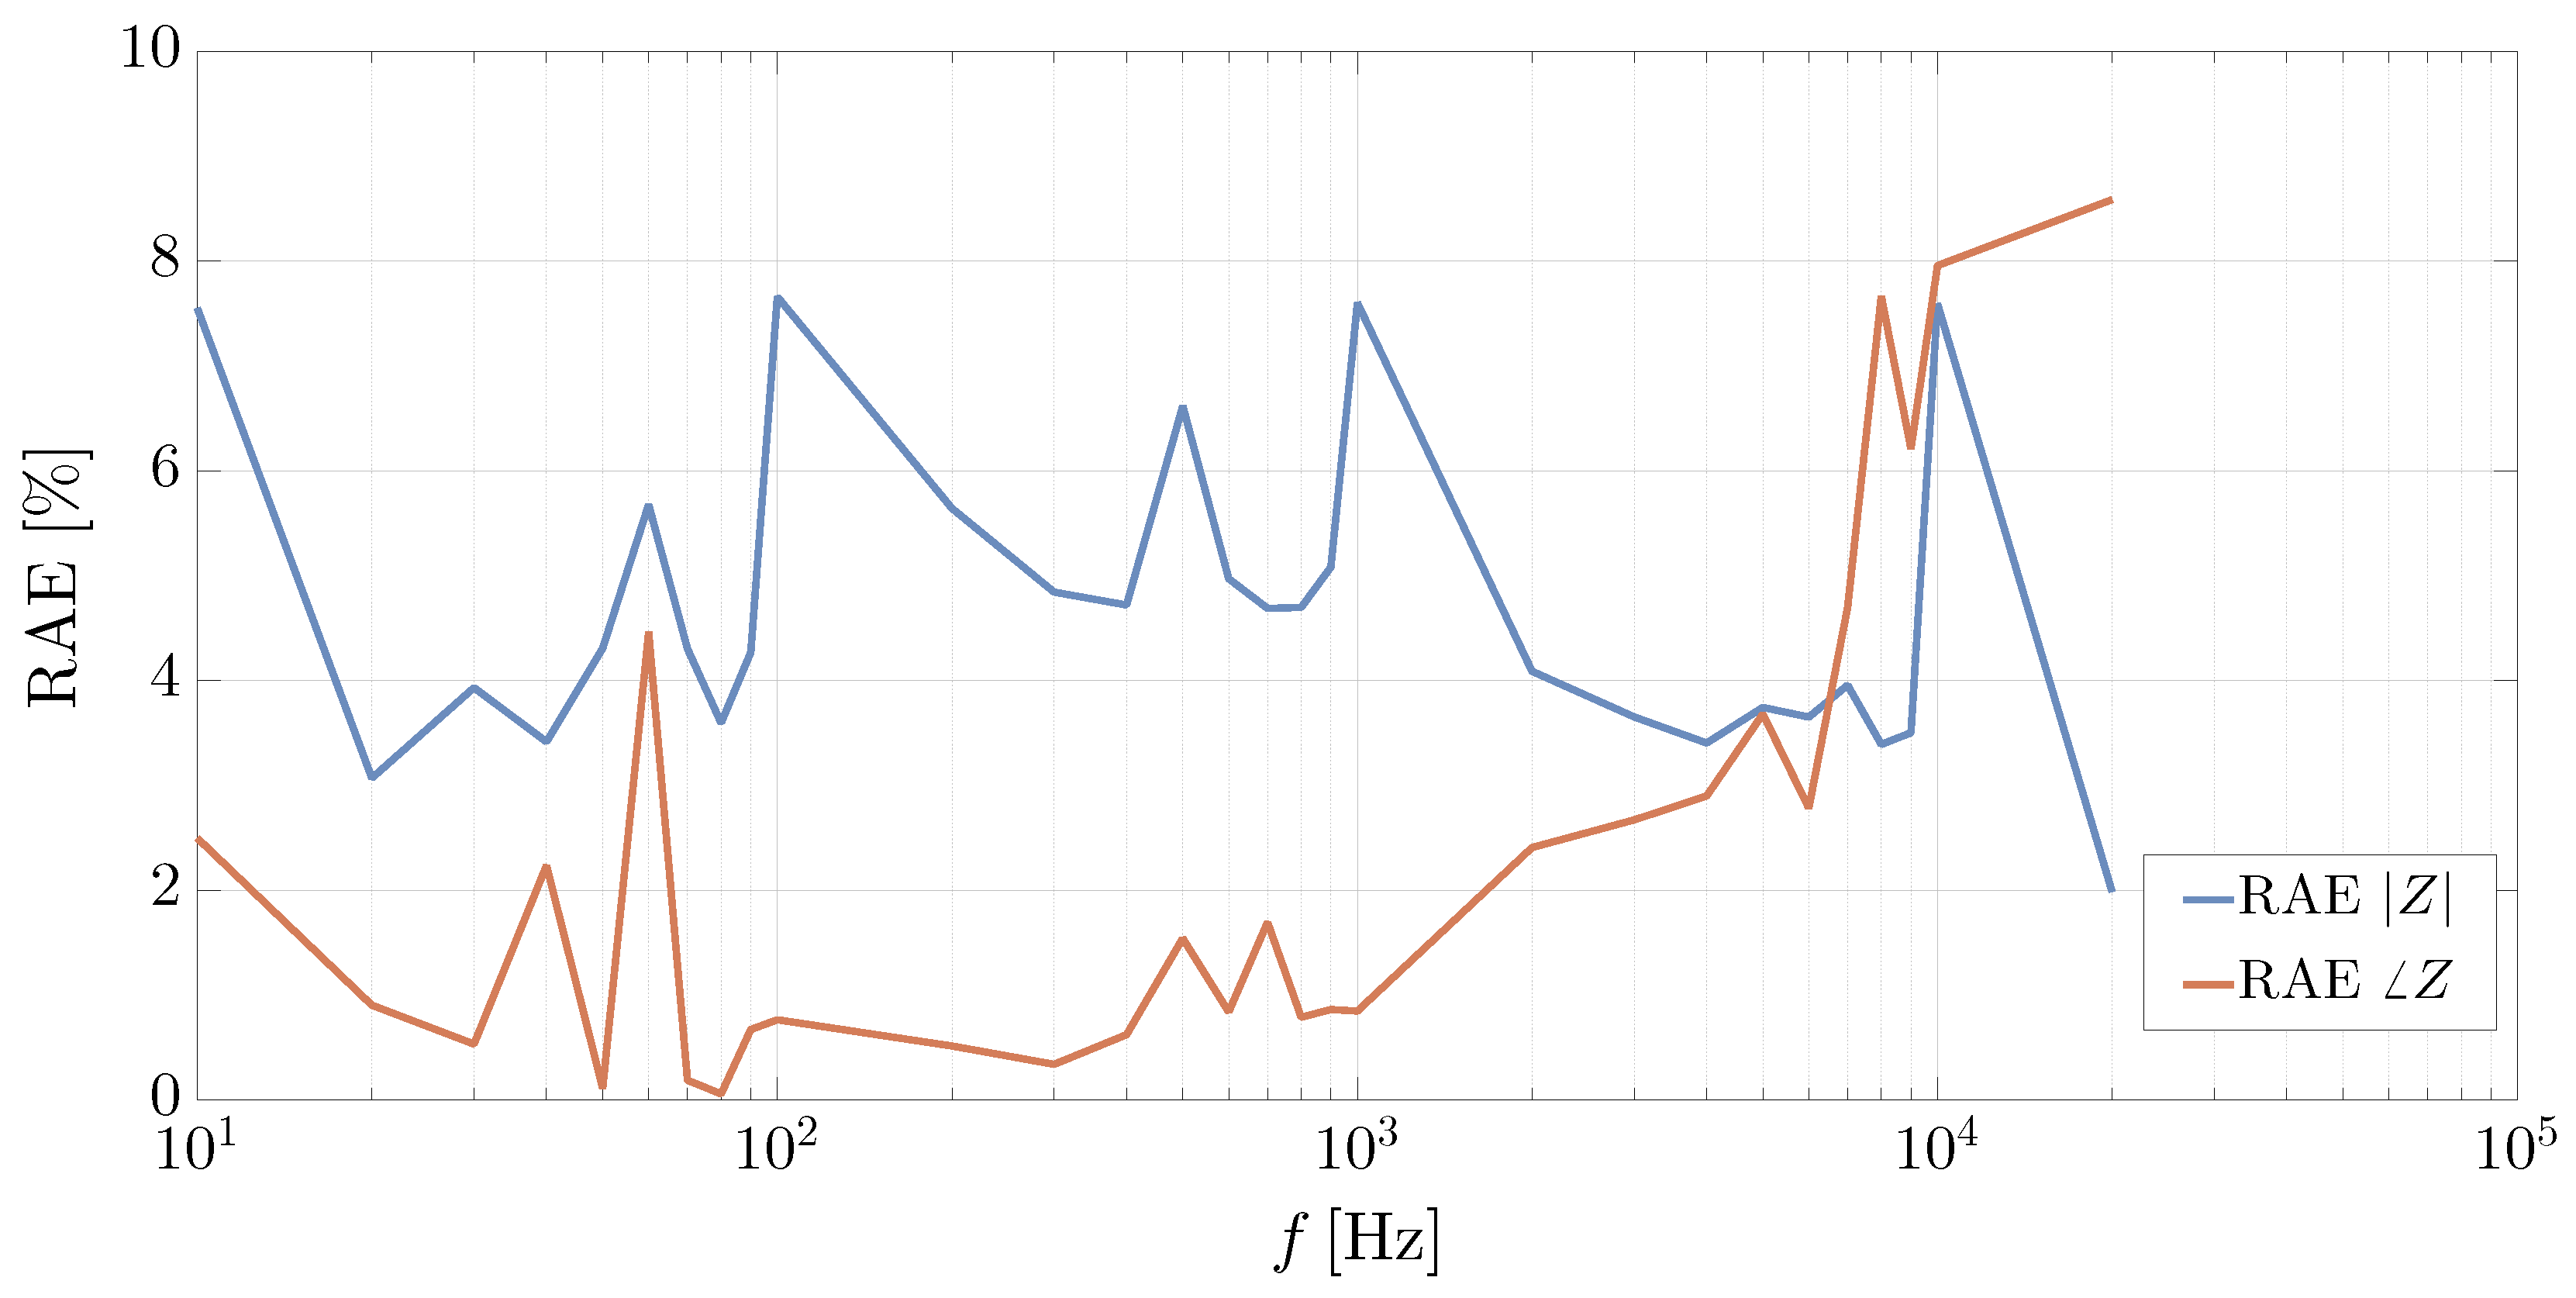
To quantify the experiments agreement, the same RAE and RAAE metrics used in the simulation analysis are calculated for the experimental data. The error distribution is shown in
Figure 18, where both magnitude and phase deviations are presented. The proposed method achieves a RAAE of
for magnitude and
for phase. The maximum normalized magnitude error is
at
, while the maximum phase error reaches
at
. These deviations are mainly concentrated at higher frequencies, where the measurement becomes more sensitive to non-idealities.
The remaining magnitude discrepancies are primarily attributed to limitations in the measurement stage and the effect of the switching frequency. Despite these effects, the phase response remains highly consistent, indicating that the dynamic behavior of the SC is correctly captured.
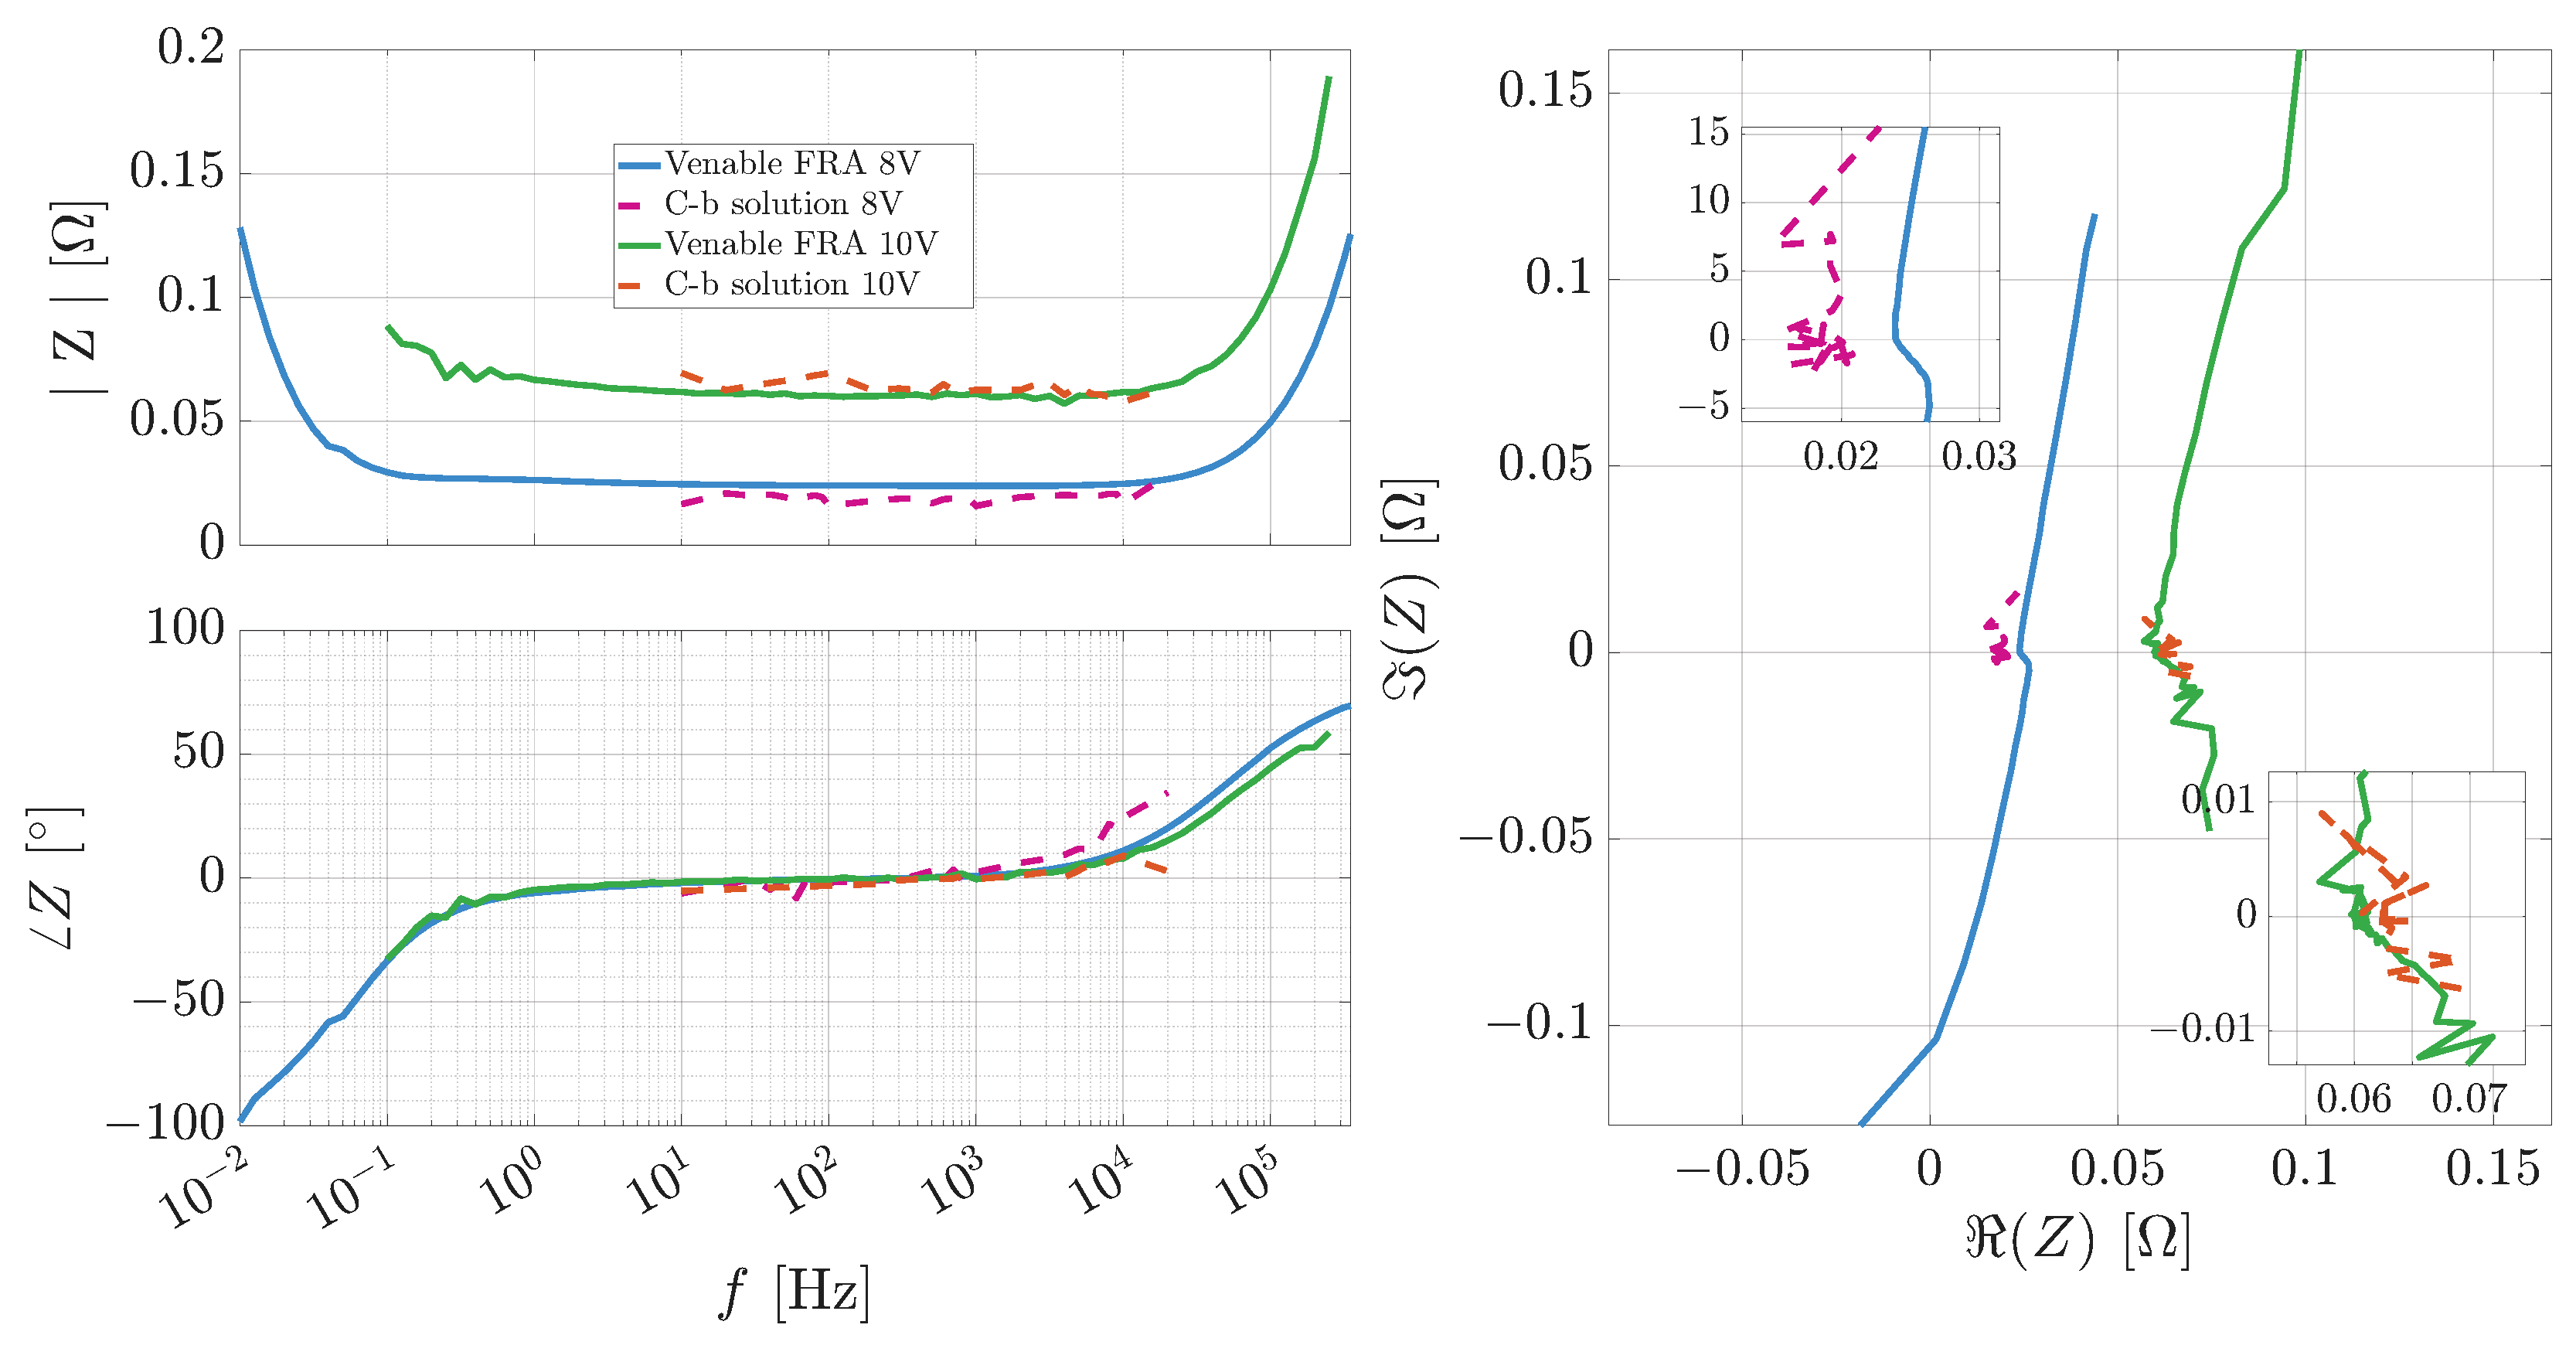
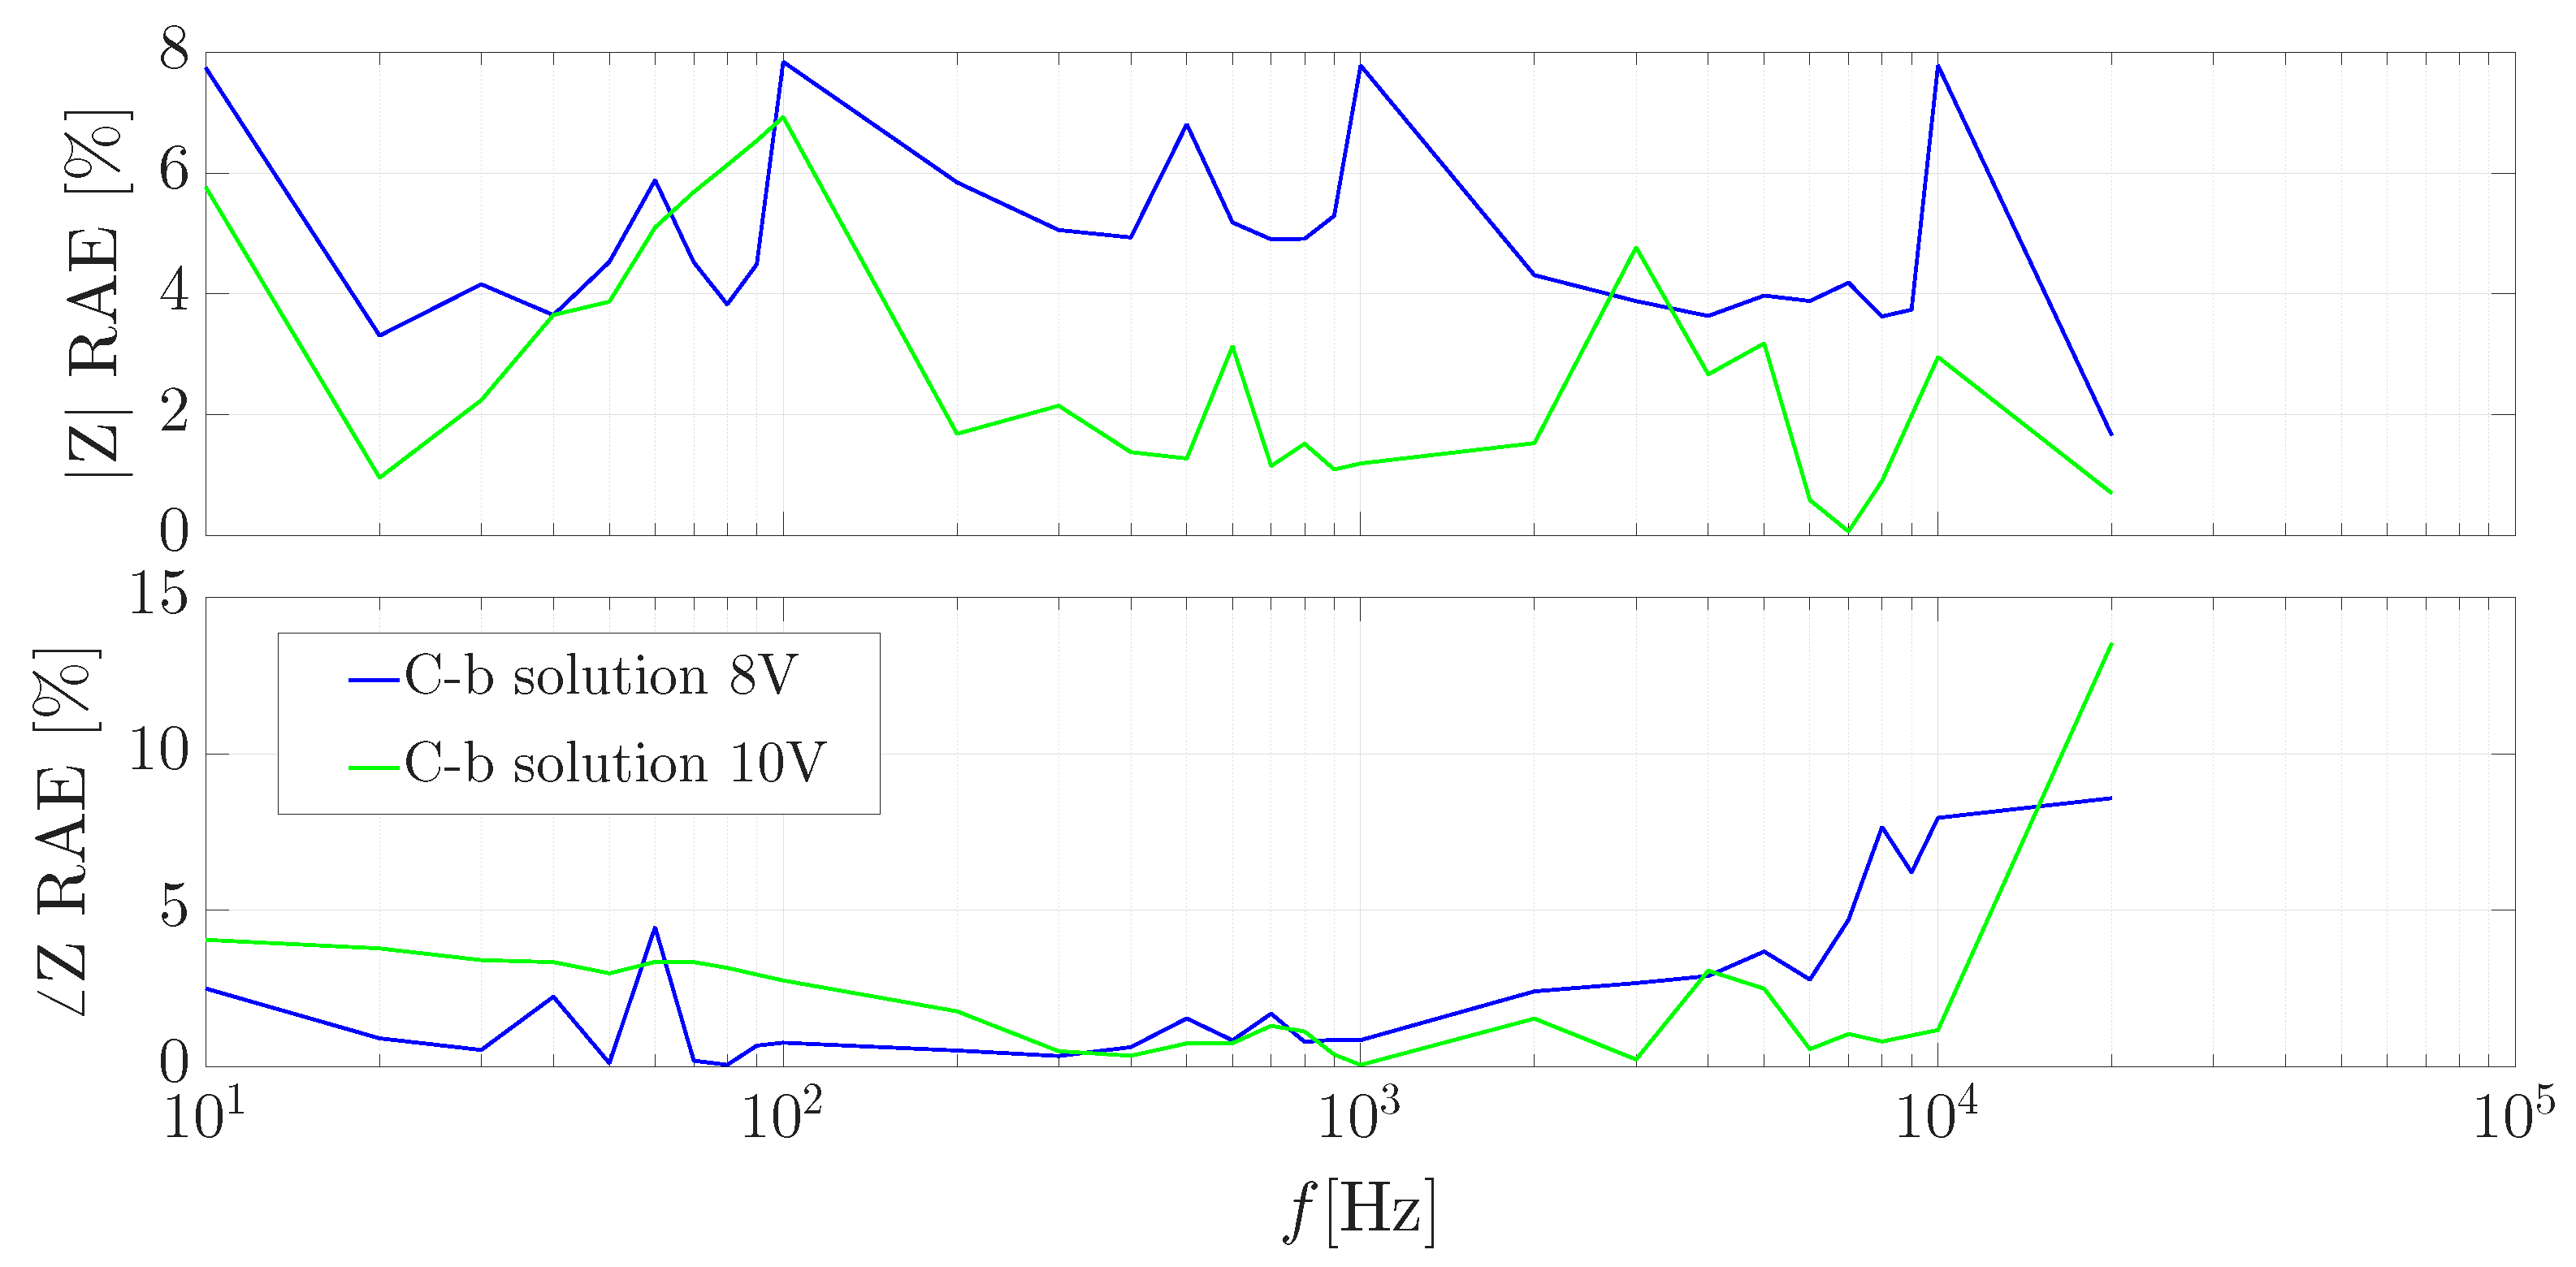
While the primary experimental validation presented in this section focuses on the baseline
operating condition, the performance of the proposed converter-based IS technique was further evaluated at a higher bias voltage of
. This extended evaluation confirms the system’s robustness across different operating points and shows the impact of voltage variations in the impedance measurement accuracy. Detailed comparative Bode, Nyquist, and frequency-dependent error profiles for both
and
conditions are provided in
Appendix A.
From a practical perspective, the proposed methodology provides a significant reduction in implementation cost. The converter-based setup, based on standard power electronics hardware and laboratory instrumentation, has an estimated cost of approximately $2000 USD, whereas commercial FRA-based systems can reach up to $60,000 USD. This represents a cost reduction factor of approximately 30 times. Although this reduction is associated with an increase in magnitude error, the results show that the overall impedance behavior is preserved. Moreover, the dominant source of error is related to measurement limitations rather than the proposed methodology itself. Therefore, improvements in signal acquisition and calibration, and increments in switching frequency, are expected to further reduce the discrepancy with high-end FRA systems.
Those results demonstrate that the proposed converter-based approach provides a viable alternative for impedance spectroscopy, enabling accurate impedance estimation while offering reduced cost and the possibility of in situ implementation in practical energy systems.
6. Conclusions
This paper presented a converter-based methodology for performing IS of SCs using a power electronics interface. The proposed approach derives an analytical formulation that relates the duty-cycle perturbation with the excitation frequency and the desired current disturbance amplitude, enabling frequency-dependent excitation signals to be generated directly through the converter. The methodology was validated using circuital simulations that include a Warburg-based SC model; moreover, experiments were also carried out using a bidirectional Buck converter, and the obtained results were contrasted against a commercial FRA reference.
The simulation results demonstrated that the proposed formulation maintains a constant current disturbance amplitude throughout the frequency sweep and accurately reproduces the capacitive, resistive, and inductive regions of the SC impedance. The obtained spectra reported a strong agreement with the reference AC Sweep analysis, achieving a RAAE of 0.30% in magnitude and 1.94% in phase.
The experimental results confirmed the feasibility of the proposed methodology under real operating conditions. After compensating for parasitic impedances introduced by the measurement paths, the proposed method achieved a RAAE of 4.88% in magnitude and 2.41% in phase with respect to the measurements obtained with a commercial FRA equipment. The remaining discrepancies were mainly associated with limitations of the measurement stage, particularly the switching noise.
From a practical perspective, the proposed methodology significantly reduces the cost of impedance characterization. The converter-based implementation requires approximately 2000 USD in hardware and instrumentation, whereas commercial FRA-based systems can cost up to 60,000 USD. Therefore, the proposed approach achieves an approximate cost reduction factor of 30 times, while preserving the essential impedance characteristics of the SC. These results demonstrate that converter-based IS is a viable and cost-effective alternative to conventional FRA measurements, opening the possibility of integrating impedance characterization and diagnostic functions directly into power electronics energy storage systems.
Future work will focus on integrating the acquisition and signal-processing stages into the DSP to enable fully embedded real-time IS and online condition monitoring of SC-based energy storage systems. Additionally, upgrading the acquisition hardware with dedicated high-resolution DAQ modules will allow extending the experimental validation into the sub-10 Hz low-frequency region to fully capture slow capacitive and diffusion dynamics. Moreover, increasing the switching frequency of the power converter will enable covering a significantly wider overall frequency range for the IS analysis.
Finally, other further developments concern the testing under multiple temperature and aging conditions, which require specialized equipment like high-precision thermal chambers and heavy-duty cycling instruments to safely execute and control those long-term environmental tests.




 ,
,