1. Introduction
Battery energy storage systems (BESSs) have become an essential component of modern power systems owing to their capability to support renewable energy integration, peak shaving, frequency regulation, and grid stability enhancement. With the rapid deployment of large-scale stationary energy storage, battery safety and battery management system (BMS) reliability have received increasing attention. Recent studies have emphasized that large-scale BESSs involve multi-layer safety risks from the cell, module, rack, and station levels, and that effective monitoring, early warning, and fault localization are essential for preventing the escalation of local abnormalities into system-level failures [
1,
2,
3,
4]. Therefore, developing efficient and interpretable online monitoring methods is of practical importance for the safe operation of energy storage stations.
Cell inconsistency is one of the key factors affecting the performance, available capacity, lifetime, and safety margin of energy storage battery systems. In large-scale battery strings, manufacturing variation, non-uniform thermal distribution, unequal aging, current distribution differences, and balancing effects can gradually amplify cell-to-cell deviations during operation [
5]. From a degradation-mechanism perspective, electrochemical–mechanical coupling, active-particle cracking, passivating-layer growth, and solid electrolyte interphase (SEI) evolution can further accelerate capacity loss, resistance increase, and local failure in lithium-ion batteries [
6,
7]. As inconsistency increases, the system capacity may be constrained by the weakest cell, and abnormal voltage deviation may further increase the risk of overcharge, overdischarge, local heating, and accelerated degradation. Existing studies have investigated battery consistency evaluation using statistical indicators, Mahalanobis–Taguchi systems, incremental capacity curves, and other feature transformation methods, showing that operational data can provide useful information for evaluating cell inconsistency under practical operating conditions [
8,
9].
To detect abnormal cells and fault-related behaviors, various data-driven and model-based diagnostic methods have been developed in recent years. For energy storage systems, local outlier factor (LOF)-based methods have been applied to detect faulty cells using voltage and temperature features [
10]. For electric vehicle battery systems, vehicle–cloud collaborative diagnosis frameworks have been proposed to combine onboard feature extraction with cloud-side fault classification [
11]. Cloud-based low-density charging-voltage-curve methods have also been developed for lithium-ion battery multi-fault diagnosis, showing the feasibility of using incomplete operational charging segments for frequent monitoring [
12]. In addition, sequence-sampling data augmentation has been introduced for early-life battery quality classification, indicating the potential of data-efficient learning under limited labeled samples [
13]. Recent reviews further indicate that data-driven methods are becoming increasingly important for battery fault diagnosis because they can exploit large-scale operational data without requiring complete electrochemical modeling [
14,
15,
16]. Meanwhile, diagnostic studies based on differential voltage analysis, incremental capacity analysis, impedance spectra, thermal runaway prediction, and safety-state evaluation have shown the potential of extracting degradation- and fault-related features from practical battery data [
17,
18,
19,
20].
Alongside purely data-driven methods, physics-informed and hybrid learning approaches have also attracted increasing attention in battery diagnosis. Physics-informed neural networks and model-informed neural networks incorporate degradation laws or equivalent-circuit knowledge into data-driven learning, thereby improving the physical consistency and interpretability of battery health estimation and voltage-fault diagnosis [
21,
22]. However, practical cloud-monitoring data may still contain sparse, batch-updated, and asynchronous cell-level observations. The present study focuses on this data-organization challenge by constructing consistency analysis inputs according to the actual update events of cell-voltage measurements.
Internal short circuit (ISC) is one of the most safety-critical battery faults because it can cause abnormal voltage deviation, local heat generation, accelerated self-discharge, and even thermal runaway under severe conditions. Recent studies have summarized the origins, detection methods, and experimental reproduction approaches of ISC faults [
23]. Thermal runaway modeling studies have further considered variable-density effects caused by gas and particle mass loss, emphasizing the complex multiphase characteristics of battery failure evolution under abuse conditions [
24]. Machine-learning-based methods, transformation-matrix-based methods, partial-voltage-curve methods, relaxation-voltage-based methods, and dynamic-feature-based approaches have also been developed for ISC identification and quantitative diagnosis [
25,
26,
27,
28,
29,
30,
31,
32,
33,
34,
35]. These studies demonstrate that fault-related cell deviations can be captured from voltage response features. However, accurate localization remains challenging when the battery module itself already has non-negligible background inconsistency or when the fault signal is mixed with operating-condition-induced voltage dispersion.
Although the above studies have advanced battery consistency evaluation and fault diagnosis, most existing methods assume that different variables are available on a synchronized time basis, or they rely on fixed-step sampling, interpolation, or sliding windows for feature construction. This assumption does not fully match the data structure of cloud-monitoring systems in many energy storage stations. In practical cloud data, string-level variables such as total voltage, current, and SOC may be recorded at relatively high frequency, whereas cell-level voltages and temperatures are often updated periodically in batches. Under this heterogeneous sampling mechanism, fixed-step analysis repeatedly calculates unchanged cell-level information, interpolation-based synchronization may introduce artificial voltage variations, and sliding-window methods are sensitive to manually selected window lengths. Therefore, a consistency analysis strategy that follows the actual update mechanism of cell-level variables is needed for asynchronous cloud-monitoring data.
To address this issue, this paper proposes a tick-driven multi-scale consistency analysis and unsupervised anomaly-localization framework for asynchronously sampled energy storage battery data. The methodological contribution of the framework does not lie in proposing new voltage-dispersion metrics, a new principal component analysis (PCA) algorithm, or a new Isolation Forest algorithm. Instead, it lies in constructing an analysis representation that follows the actual heterogeneous data-generation mechanism of battery cloud-monitoring systems. Specifically, the actual batch-update instants of cell voltages are treated as valid observation events. For each event, the available cell-voltage vector represents the instantaneous cell-level consistency state, whereas the high-frequency string-level variables accumulated over the preceding tick interval describe the operating context associated with that state. In this way, the proposed framework does not force asynchronously updated cell-voltage data onto a uniform time grid and does not create artificial cell-voltage trajectories through interpolation. Voltage-dispersion metrics are then calculated at the cell-voltage update events to characterize inter-cell consistency. PCA [
36] and Isolation Forest [
37] are employed as established downstream tools for low-dimensional feature representation and unsupervised tick-level abnormality scoring, respectively. Furthermore, the framework separates temporal abnormality assessment from spatial abnormal-cell localization. The tick-level anomaly score indicates whether the consistency state at a cell-voltage update event deviates from the normal operating pattern, whereas cell-wise relative voltage residuals are used to attribute the event-level abnormality to the cells with the strongest response. Therefore, the proposed method provides a global-to-local analytical path for consistency monitoring and abnormal-cell localization under asynchronous sampling.
The main contributions of this study are summarized as follows:
- (1)
A sampling-mechanism-aware event representation is established for asynchronously sampled energy storage battery data. The actual batch-update instants of cell voltages are treated as valid analysis events, thereby avoiding repeated evaluation of unchanged cell-voltage records under conventional fixed-step analysis.
- (2)
An interval-to-event cross-level feature construction strategy is developed. High-frequency string-level operating variables are aggregated within each adjacent tick interval and coupled with the cell-level voltage-consistency state observed at the subsequent event, enabling operating-context-aware consistency analysis without interpolation of cell-voltage trajectories.
- (3)
A hierarchical global-to-local anomaly-localization mechanism is constructed. Tick-level abnormality is first assessed using the multivariate consistency representation, and cell-wise relative voltage residuals are subsequently used to attribute abnormal events to individual high-response cells.
- (4)
The proposed framework is evaluated using both two-day real-world energy storage station data and a controlled 20 Ah 16-series module experiment, demonstrating its applicability to asynchronous cloud-data analysis and known abnormal-cell localization.
2. Data Source and Overview
2.1. Real-World Cloud-Monitoring Data from an Energy Storage Station
The real-world operational data used in this study were collected from the cloud-monitoring system of a large-scale battery energy storage station. The dataset covers a two-day operating period and records multi-level electrical, thermal, and state-related variables during practical system operation. Each energy storage string consists of 240 cells connected in series and is equipped with 80 temperature sensors, enabling the monitoring system to characterize both string-level operating behavior and cell-level consistency states. The recorded variables mainly include total string voltage, total current, state of charge (SOC), charge/discharge energy, individual cell voltages, and temperature measurements.
A notable characteristic of the collected cloud-monitoring data is the heterogeneous and asynchronous sampling mechanism. String-level variables, such as total voltage, total current, and SOC, are recorded continuously at a nominal sampling rate of 1 Hz, which reflects the dynamic power variation and transient operating response of the energy storage system. In contrast, cell-level variables are updated periodically in batches rather than being sampled synchronously with the string-level signals. Specifically, the update interval of individual cell voltages is approximately 900 s, and the median update interval of temperature measurements is also close to 900 s. As a result, the cell-level trajectories in the raw records exhibit long flat segments and step-like batch updates.
This mixed high- and low-frequency sampling pattern is typical of cloud-based monitoring data from energy storage stations. High-frequency string-level variables provide continuous information on system-level operating dynamics, whereas low-frequency cell-level variables reflect inter-cell-voltage dispersion and thermal distribution characteristics. However, the significant mismatch in sampling frequency makes it difficult for conventional fixed-step or sliding-window methods to simultaneously preserve data integrity and maintain computational efficiency. Therefore, an analysis framework that can adapt to asynchronous sampling is required for reliable consistency evaluation under realistic energy storage operating conditions.
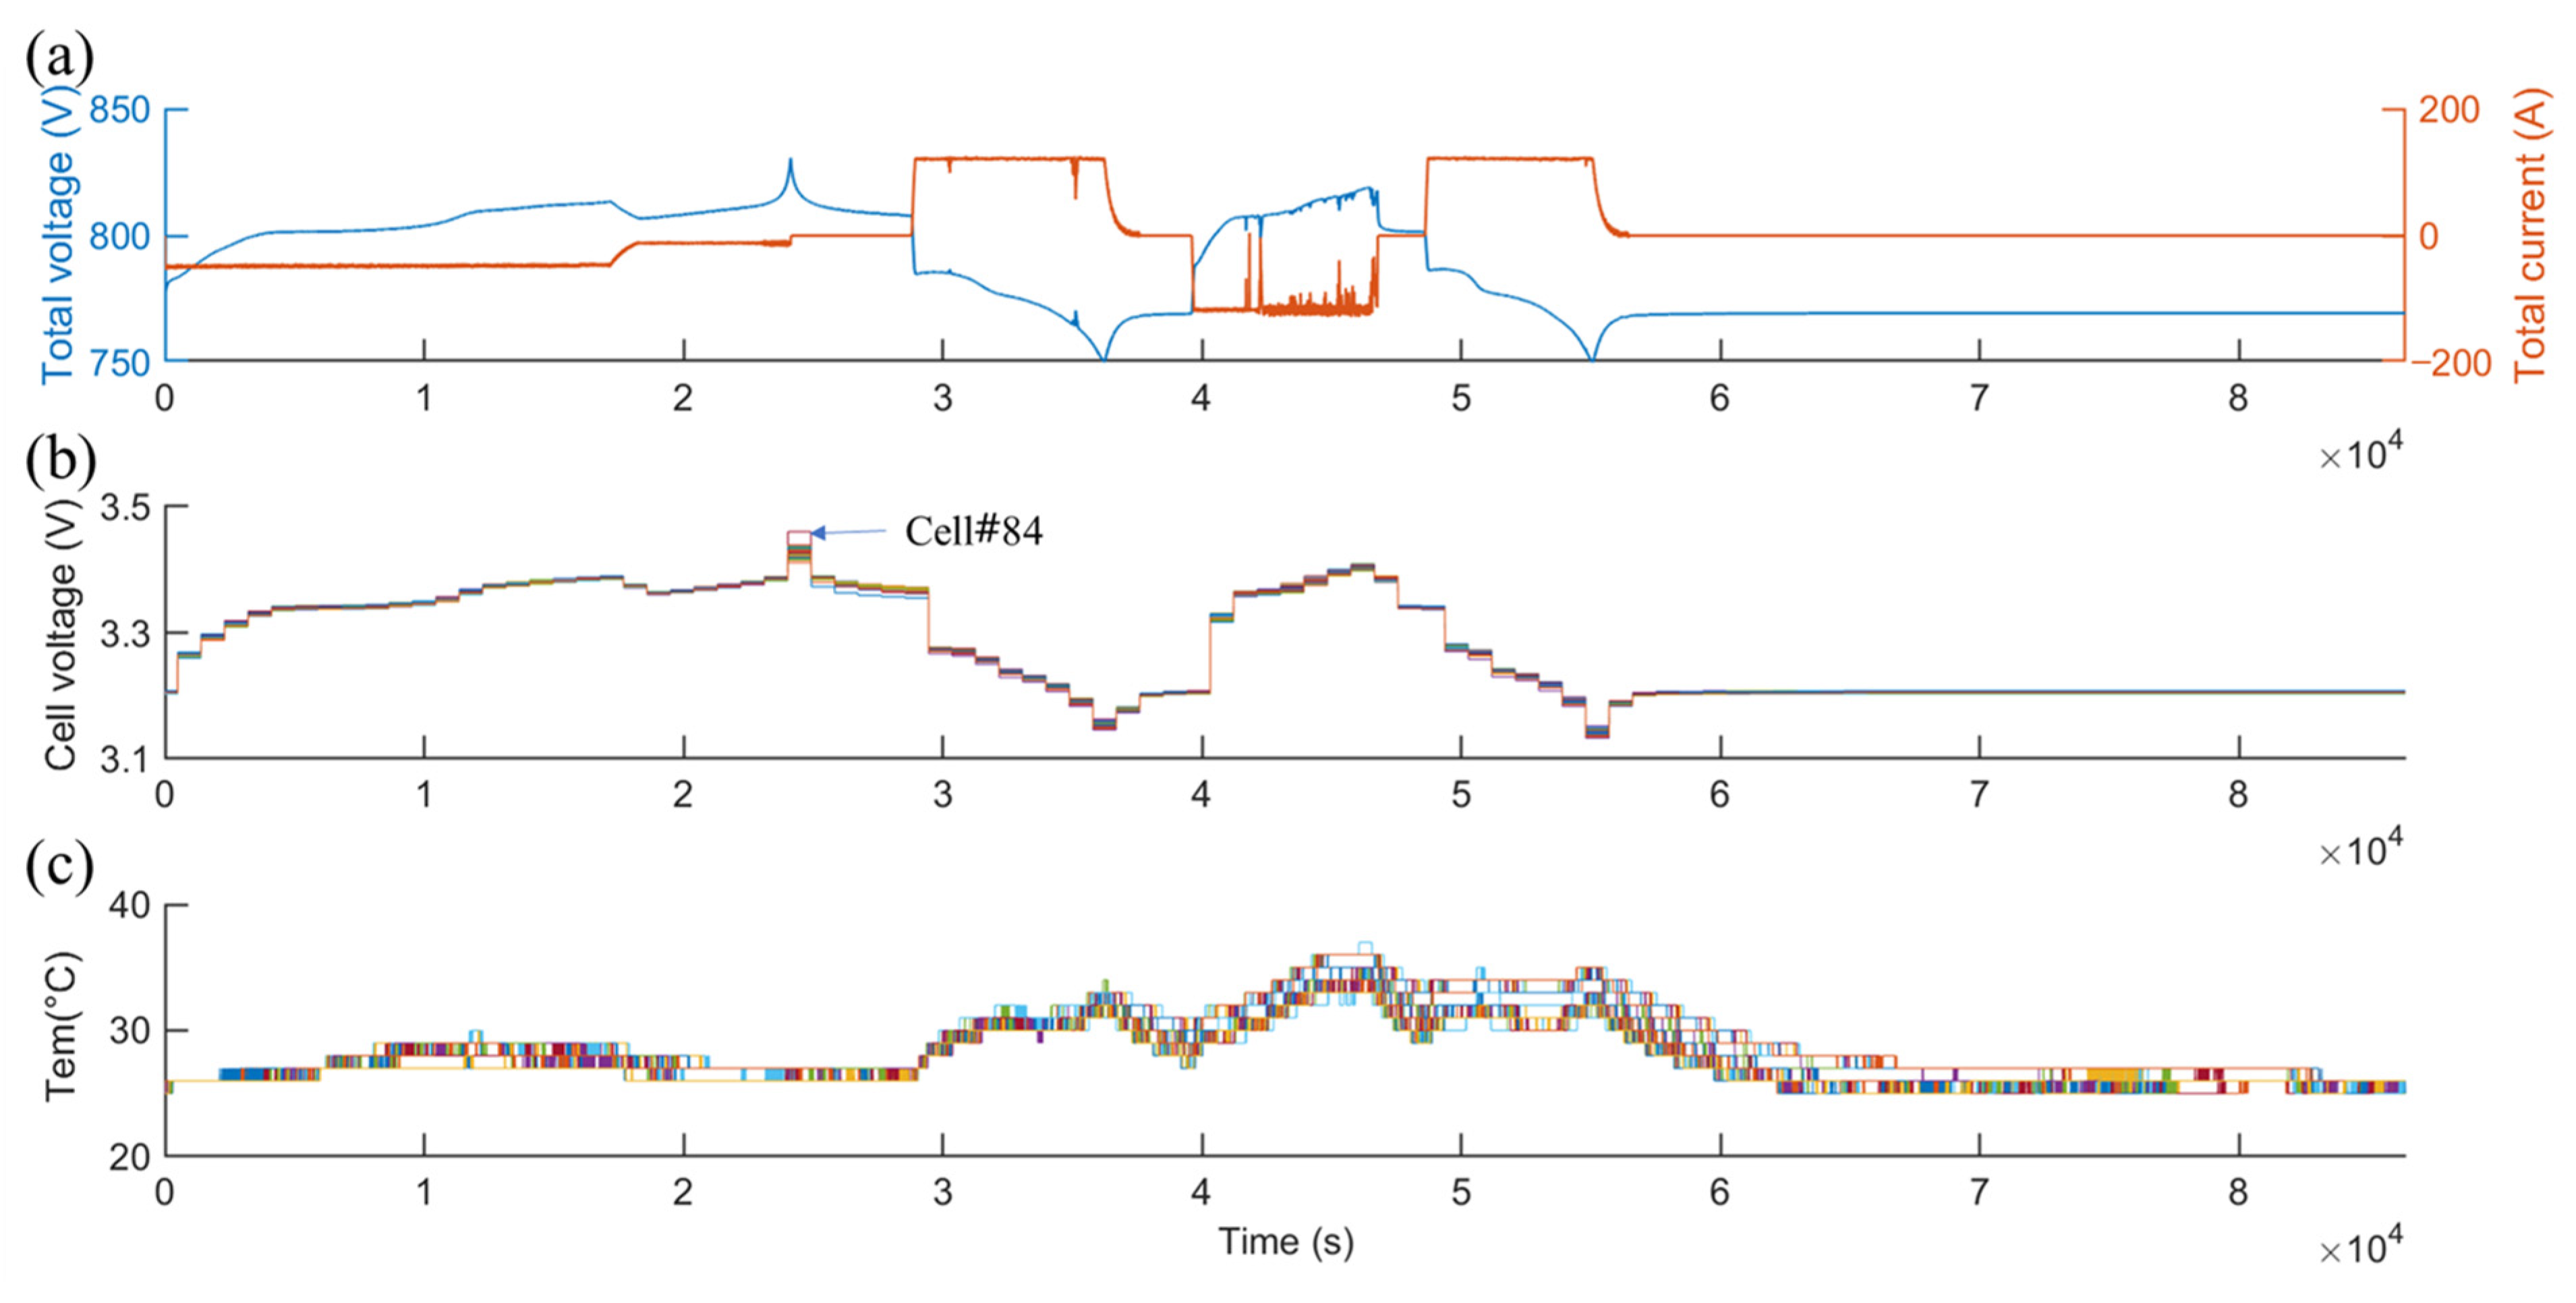
To further illustrate the temporal characteristics of the dataset, representative trajectories of monitored variables are shown in
Figure 1. Different colors are used only to distinguish individual voltage and temperature trajectories. The selected example contains both string-level signals, including total voltage and total current, and cell-level signals, including 240 individual cell voltages and 80 temperature measurements. As shown in
Figure 1a, the string-level variables fluctuate continuously, which is consistent with the 1 Hz sampling mechanism. In contrast, the cell-voltage and temperature trajectories in
Figure 1b,c exhibit long flat segments and abrupt batch-wise updates. The cell-voltage update interval is approximately 905 s, while the median temperature update interval is approximately 900 s. This pronounced sampling-frequency discrepancy provides a realistic basis for the tick-driven consistency analysis introduced in the following section.
2.2. Controlled Internal-Short-Circuit Experiment on a 16-Series Module
To further validate the abnormal-cell localization capability of the proposed method, a controlled internal-short-circuit experiment on a 20 Ah 16-series battery module is introduced as a supplementary validation dataset. Different from the real-world station data, this experimental dataset was obtained under controlled laboratory conditions and provides a known fault-cell reference. In the experiment, an internal short circuit was emulated by connecting a parallel resistor to cell #13. Therefore, cell #13 is regarded as the known abnormal cell in the subsequent validation.
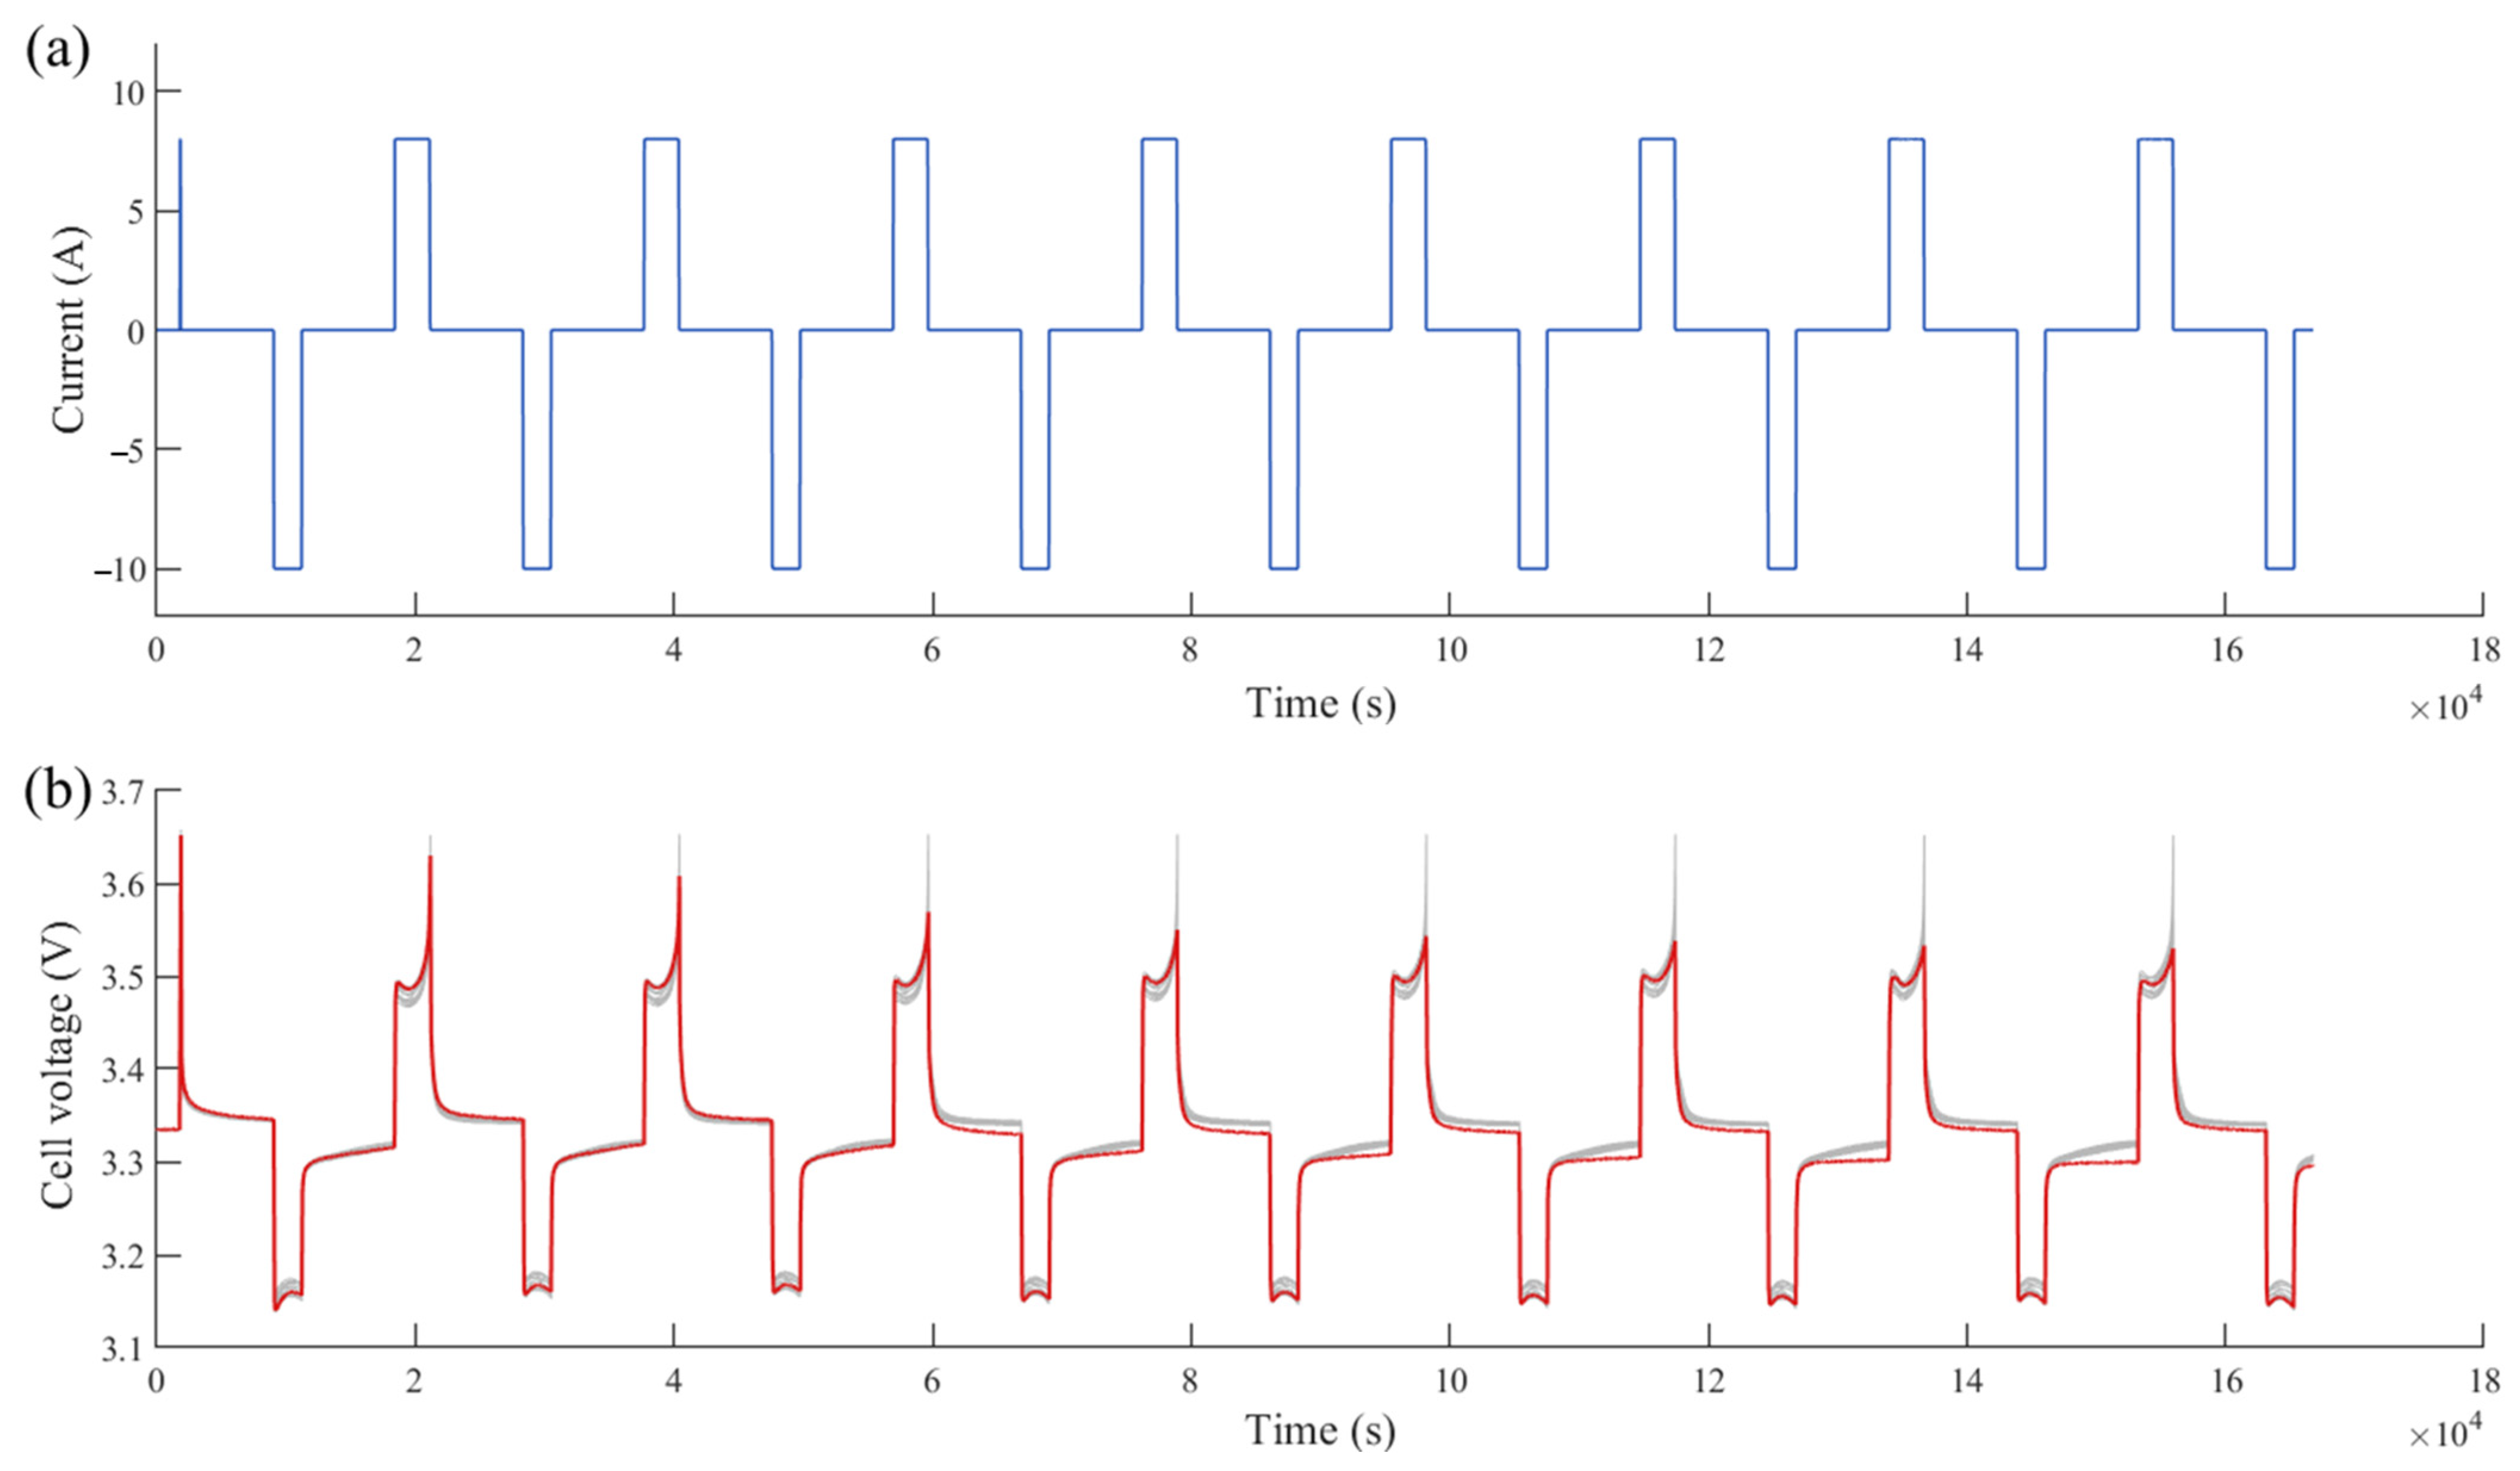
Figure 2 shows the current profile and cell-voltage trajectories of the controlled module experiment. As shown in
Figure 2a, the module underwent repeated current pulse conditions, where the current alternated between positive and negative pulse stages with intermittent zero-current intervals.
Figure 2b presents the voltage trajectories of the 16 series-connected cells. The cell voltages exhibit similar cyclic evolution patterns, while cell #13, highlighted in red, shows a distinguishable response compared with the other cells during the repeated pulse process. This is consistent with the experimental setting in which cell #13 was connected with a parallel resistor to emulate an internal short circuit.
The experimental dataset contains 16 individual cell-voltage trajectories, the module current profile, and their corresponding time axes. The module voltage is obtained by summing the 16 cell voltages, and the relative SOC variation is estimated by Coulomb counting using the nominal capacity of 20 Ah. The absolute SOC value is not required in this study, because only the SOC variation between adjacent analysis ticks is used as an interval operating-condition feature.
It should be emphasized that the module experimental data were originally recorded with high temporal resolution and do not naturally exhibit the same asynchronous sampling pattern as the cloud-monitoring data from the energy storage station. To construct a validation scenario consistent with the real-world cloud data, the cell-voltage signals are batch-resampled using a 900 s update interval, while the current signal is retained at its high temporal resolution. In this way, the experimental dataset simulates the typical cloud-monitoring pattern of high-frequency string-level variables and low-frequency cell-level updates.
The two datasets serve complementary roles in the present validation. The real-world station dataset is used to demonstrate the applicability of the proposed framework under practical asynchronous cloud-monitoring conditions and to analyze consistency events during actual operation; it is not used as a dataset with independently confirmed internal-short-circuit faults. The controlled module dataset provides a known abnormal-cell reference for evaluating abnormal-cell localization under an artificial resistor-emulated electrical leakage condition. Their configurations, sampling characteristics, and validation roles are summarized in
Table 1.
3. Multi-Scale Consistency Analysis and Unsupervised Detection Under Asynchronous Sampling
3.1. Overall Framework
Cloud-monitoring data of energy storage systems exhibit evident asynchronous sampling: string-level variables are sampled at 1 Hz, while cell voltages and temperatures are updated in batches at a lower frequency. Conventional dynamic consistency analysis methods based on uniform time intervals are not directly applicable; they may introduce redundant information and weaken timeliness. To this end, this paper proposes a tick-driven consistency analysis method, using the actual update instants of cell voltages as the time index. Within each tick interval, string-level high-frequency features are extracted to achieve an efficient, realistic, and interpretable evaluation of cell consistency in energy storage systems.
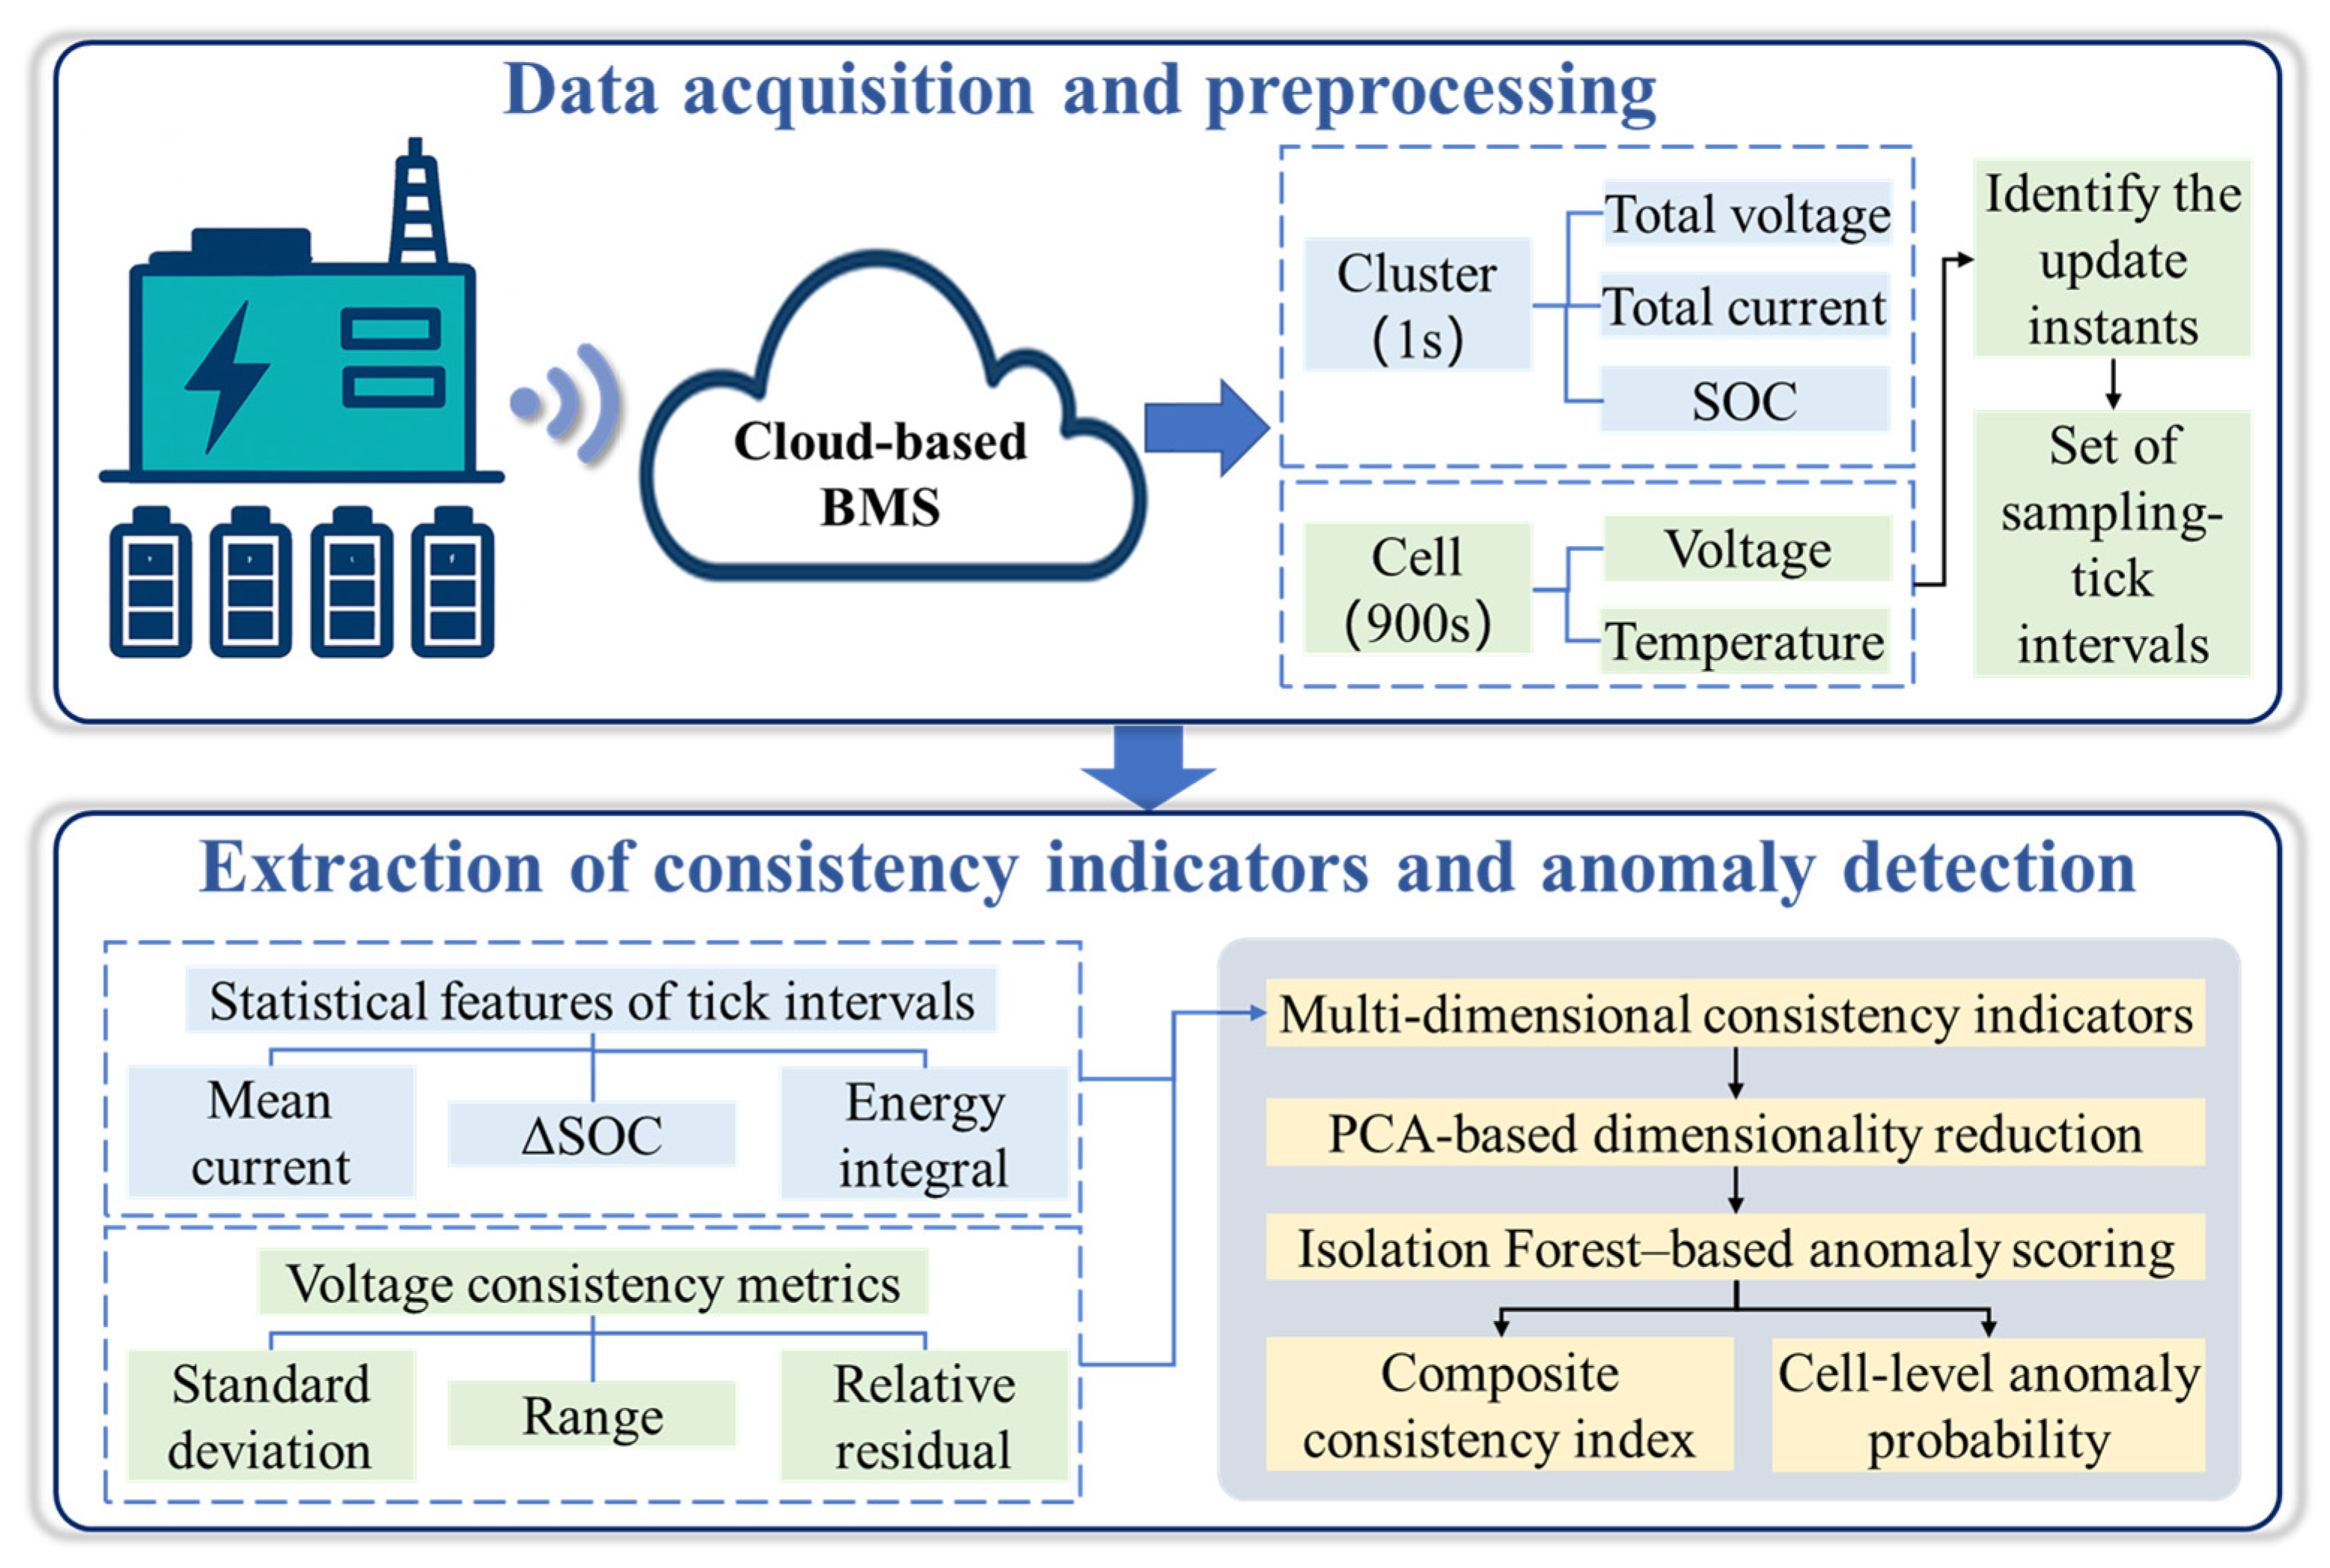
As illustrated in
Figure 3, the proposed procedure consists of four stages. First, cell-voltage update instants are identified from the raw monitoring records to construct the tick sequence. Second, the high-frequency string-level signals within each tick interval are converted into interval operating-condition features. Third, voltage-dispersion metrics are calculated from the cell-voltage vector at each tick to characterize the overall consistency state of the battery string, while relative voltage residuals are calculated to quantify cell-specific deviations. Finally, the interval operating-condition features and voltage-dispersion metrics are processed by PCA and Isolation Forest to obtain an anomaly score for each tick. The anomaly score is then combined with the relative voltage residuals of individual cells to identify the cells with the strongest abnormal response during each anomalous consistency event.
Through this procedure, the high-frequency operating information and low-frequency cell-level measurements are analyzed according to their original update characteristics. The resulting tick-level anomaly score describes the abnormality of the overall consistency state, whereas the cell-wise residuals characterize the relative deviation of each individual cell. Accordingly, cell-level consistency assessment and abnormal-cell localization are performed at the available cell-voltage update events.
3.2. Data Preprocessing and Tick Identification
Raw cloud-monitoring data are first preprocessed. All variables are re-sorted by timestamp and unified onto a second-level time axis to ensure alignment. Local missing points are repaired by forward filling or linear interpolation, while long missing segments are removed. On this basis, the actual update instants of cell voltages—namely, “ticks”—are identified. Since cell voltages remain constant for most of the time, a tick is detected when the voltage value changes; that change instant is defined as a tick. For the
-th cell, the tick set is defined as:
where
is the voltage of the
-th cell at time
. By merging the tick sets of all cells, the global tick sequence is obtained:
Two adjacent ticks define a tick interval. Within each interval, cell voltages remain unchanged, while string-level variables (current, SOC, energy, etc.) are recorded continuously at 1 Hz. Therefore, each tick interval serves as the analysis unit for subsequent interval-feature aggregation.
3.3. Interval Operating-Condition Feature Aggregation
Within each tick interval, high-frequency string-level data reflect the operating state of the system in that time span. To reduce redundancy while preserving physical meaning, this study transforms high-frequency signals into interval statistics, including average current, SOC change, and energy integral:
where
is the string current, and
is the string total voltage. After aggregation, each tick corresponds to a string-level operating-condition vector, reflecting the average operating state in that interval and providing physical context for subsequent consistency analysis. By incorporating these features, voltage fluctuations due to load/operating-condition variations can be distinguished from genuine anomalies induced by consistency degradation.
3.4. Consistency Metric Construction
At each tick instant, the updated voltages of all cells form a voltage vector
. The dispersion of the inter-cell-voltage distribution characterizes system consistency. Three metrics are constructed:
where
is the mean voltage of all cells at tick
tk. The standard deviation
describes overall dispersion; the range
is sensitive to local outliers; and the relative residual
tracks cell-wise deviation. The resulting indicator sequences characterize the consistency evolution of the system across ticks.
3.5. Anomaly Detection and Comprehensive Evaluation
To further identify potential abnormal cells and degraded-consistency trends, a PCA + Isolation Forest unsupervised scheme is adopted to comprehensively evaluate multi-dimensional consistency indicators. First, an indicator matrix is constructed for all tick samples:
After standardization, PCA is applied to remove correlations among indicators and extract the major variation directions. For the datasets considered in this study, the first two principal components jointly explain more than 95% of the total variance and are therefore retained to construct the reduced feature vector
. Then, the reduced samples are used as input to an Isolation Forest model to compute the anomaly score of each tick:
A larger score indicates a more abnormal state at that tick. To quantify anomaly intensity at the cell level, the tick anomaly score is combined with the cell-wise relative residual to define the cell-level anomaly probability:
Because the cell-level anomaly score combines the normalized tick-level anomaly score with the normalized relative voltage residual, a high score requires both a pronounced system-level consistency abnormality and a strong cell-specific voltage deviation. In this study, a threshold of 0.80 is adopted to identify high-response cells. Since both components are normalized within the range of 0 to 1, this threshold provides a conservative criterion that highlights cells exhibiting simultaneously high global abnormality and high relative voltage deviation.
Finally, integrating voltage-consistency metrics and anomaly scores, a normalized comprehensive consistency index is defined:
where
denotes the weighting coefficient, satisfying
. In this study, the weights were set as (
,
and
). The voltage standard deviation and voltage range were assigned equal primary weights because they directly describe the overall dispersion and extreme deviation of cell voltages, respectively. The Isolation Forest anomaly score was assigned a lower weight because it provides complementary multivariate abnormality information based on the voltage-consistency indicators and interval operating-condition features. This setting retains the primary contribution of directly measured voltage-consistency characteristics while incorporating the data-driven anomaly information into the comprehensive evaluation. The comprehensive consistency index
is used to evaluate the overall consistency state of the battery string at each tick, where values closer to 1 indicate better consistency. A decrease in
indicates the joint deterioration of voltage consistency and multivariate anomaly status. The index is used together with its constituent voltage-dispersion indicators and the tick-level anomaly score to identify consistency-deterioration events. For cell-level localization, the tick-level abnormality is further combined with the relative voltage residuals of individual cells to identify the cells with the strongest abnormal response.
All data preprocessing and visualization were performed using MATLAB R2023a, while PCA and Isolation Forest analyses were implemented using Python 3.13.
In summary, the proposed tick-driven method organizes high-frequency string-level signals and periodically updated cell-level measurements according to their respective sampling characteristics. The operating information accumulated within each tick interval is combined with the voltage-consistency state observed at the subsequent cell-voltage update event. This construction enables tick-level consistency assessment while retaining cell-wise relative voltage residuals for subsequent abnormal-cell localization.
4. Results and Discussion
To evaluate the proposed tick-driven consistency analysis method, two complementary datasets are used. The real-world energy storage station dataset is first analyzed to demonstrate the applicability of the method under practical asynchronous cloud-monitoring conditions. Then, the controlled 20 Ah 16-series module experiment is used to further validate the abnormal-cell localization capability under a known internal-short-circuit setting. The results are discussed from four aspects: tick extraction and sampling-mechanism-aware input construction, consistency evolution in real-world station data, abnormal-cell localization in the controlled experiment, and the overall interpretability of the proposed framework.
4.1. Tick Extraction and Computational Efficiency
The proposed method performs consistency analysis at effective cell-voltage update instants rather than treating every timestamp as an independent cell-level observation. For the real-world energy storage station dataset, 190 effective ticks were extracted from the two-day cloud-monitoring records. This result is consistent with the observed batch-update behavior of the cell-voltage measurements, for which the update interval is approximately 900 s.
For the controlled 20 Ah 16-series module experiment, the cell-voltage signals were batch-resampled using a 900 s update interval to emulate the asynchronous sampling pattern observed in the real-world station data. Under this setting, 185 effective ticks were obtained from 166,797 original voltage samples. Therefore, the proposed framework constructs cell-level analysis samples only when updated cell-voltage information becomes available, corresponding to a reduction of more than 99% in the number of cell-level evaluation instances.
This reduction should be understood as an optimization of the input representation rather than as a direct benchmark of execution time. In practical cloud-monitoring data, cell-voltage updates are approximately periodic but do not necessarily coincide with a predefined fixed time grid. Under a high-frequency fixed-step analysis, unchanged cell-voltage snapshots may be repeatedly treated as new analysis samples before the next update occurs. When a coarse fixed interval is used, the predefined interval boundaries may not be fully aligned with the actual voltage-update events, causing temporal mismatch between the aggregated operating information and the corresponding cell-voltage state. In contrast, interpolation-based synchronization generates intermediate voltage values that are not directly measured by the monitoring system and may affect the calculated voltage-dispersion features. By using actual cell-voltage update events as analysis inputs and aggregating high-frequency string-level information over the corresponding interval between adjacent updates, the proposed method preserves the measured cell-voltage states while retaining their associated operating context.
4.2. Consistency Evolution in the Real-World Energy Storage Station Data
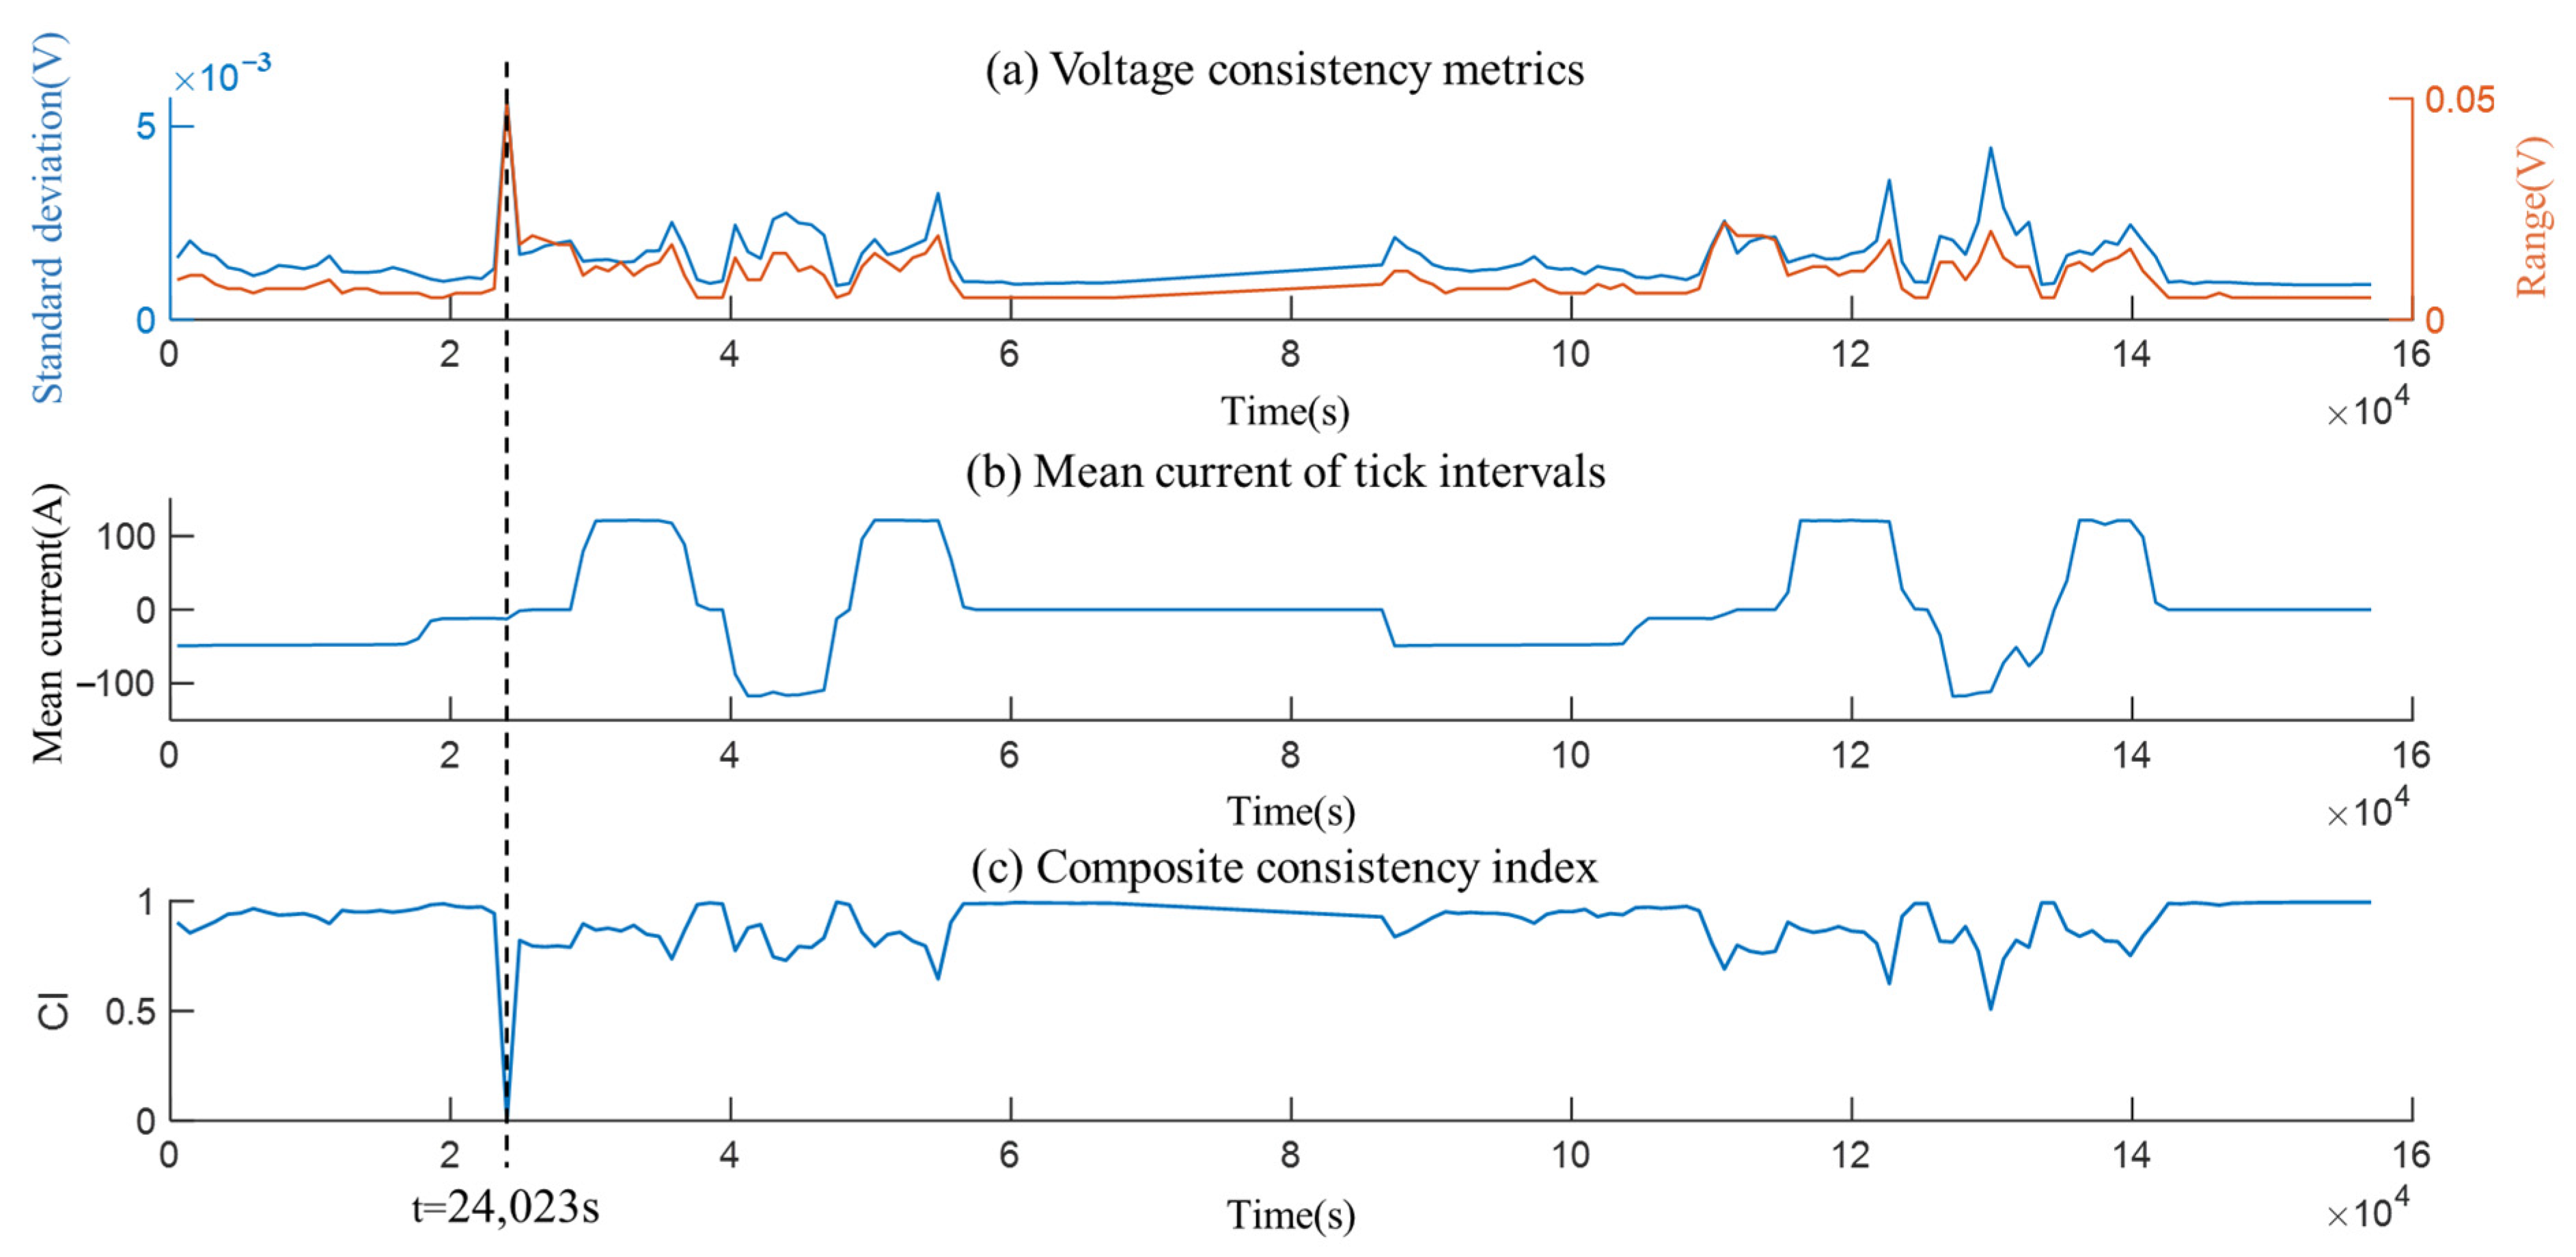
Figure 4 shows the temporal evolution of voltage-consistency indicators, interval-average current, and the comprehensive consistency index in the real-world station dataset.
The maximum voltage range occurs at the 27th tick, corresponding to t = 24,023 s, where ΔU reaches 0.049 V and the voltage standard deviation reaches 0.0057 V. Around this tick, the current changes from −11.72 A to −12.45 A and then decreases to −1.49 A, indicating a transition from stable charging to a low-rate charging stage. During this transition, different cells may exhibit different polarization relaxation rates, leading to a temporary increase in inter-cell-voltage dispersion.
The comprehensive consistency index reaches its minimum at the same tick. After normalization, CI drops to the lower bound at the 27th tick and then recovers to 0.985 at the 42nd tick, corresponding to t = 37,598 s. This synchronous response between voltage dispersion and CI indicates that the proposed comprehensive index can effectively reflect temporary consistency deterioration caused by operating-condition transitions. More importantly, the subsequent recovery of CI suggests that this event is more likely to be a transient inconsistency response rather than a persistent degradation process.
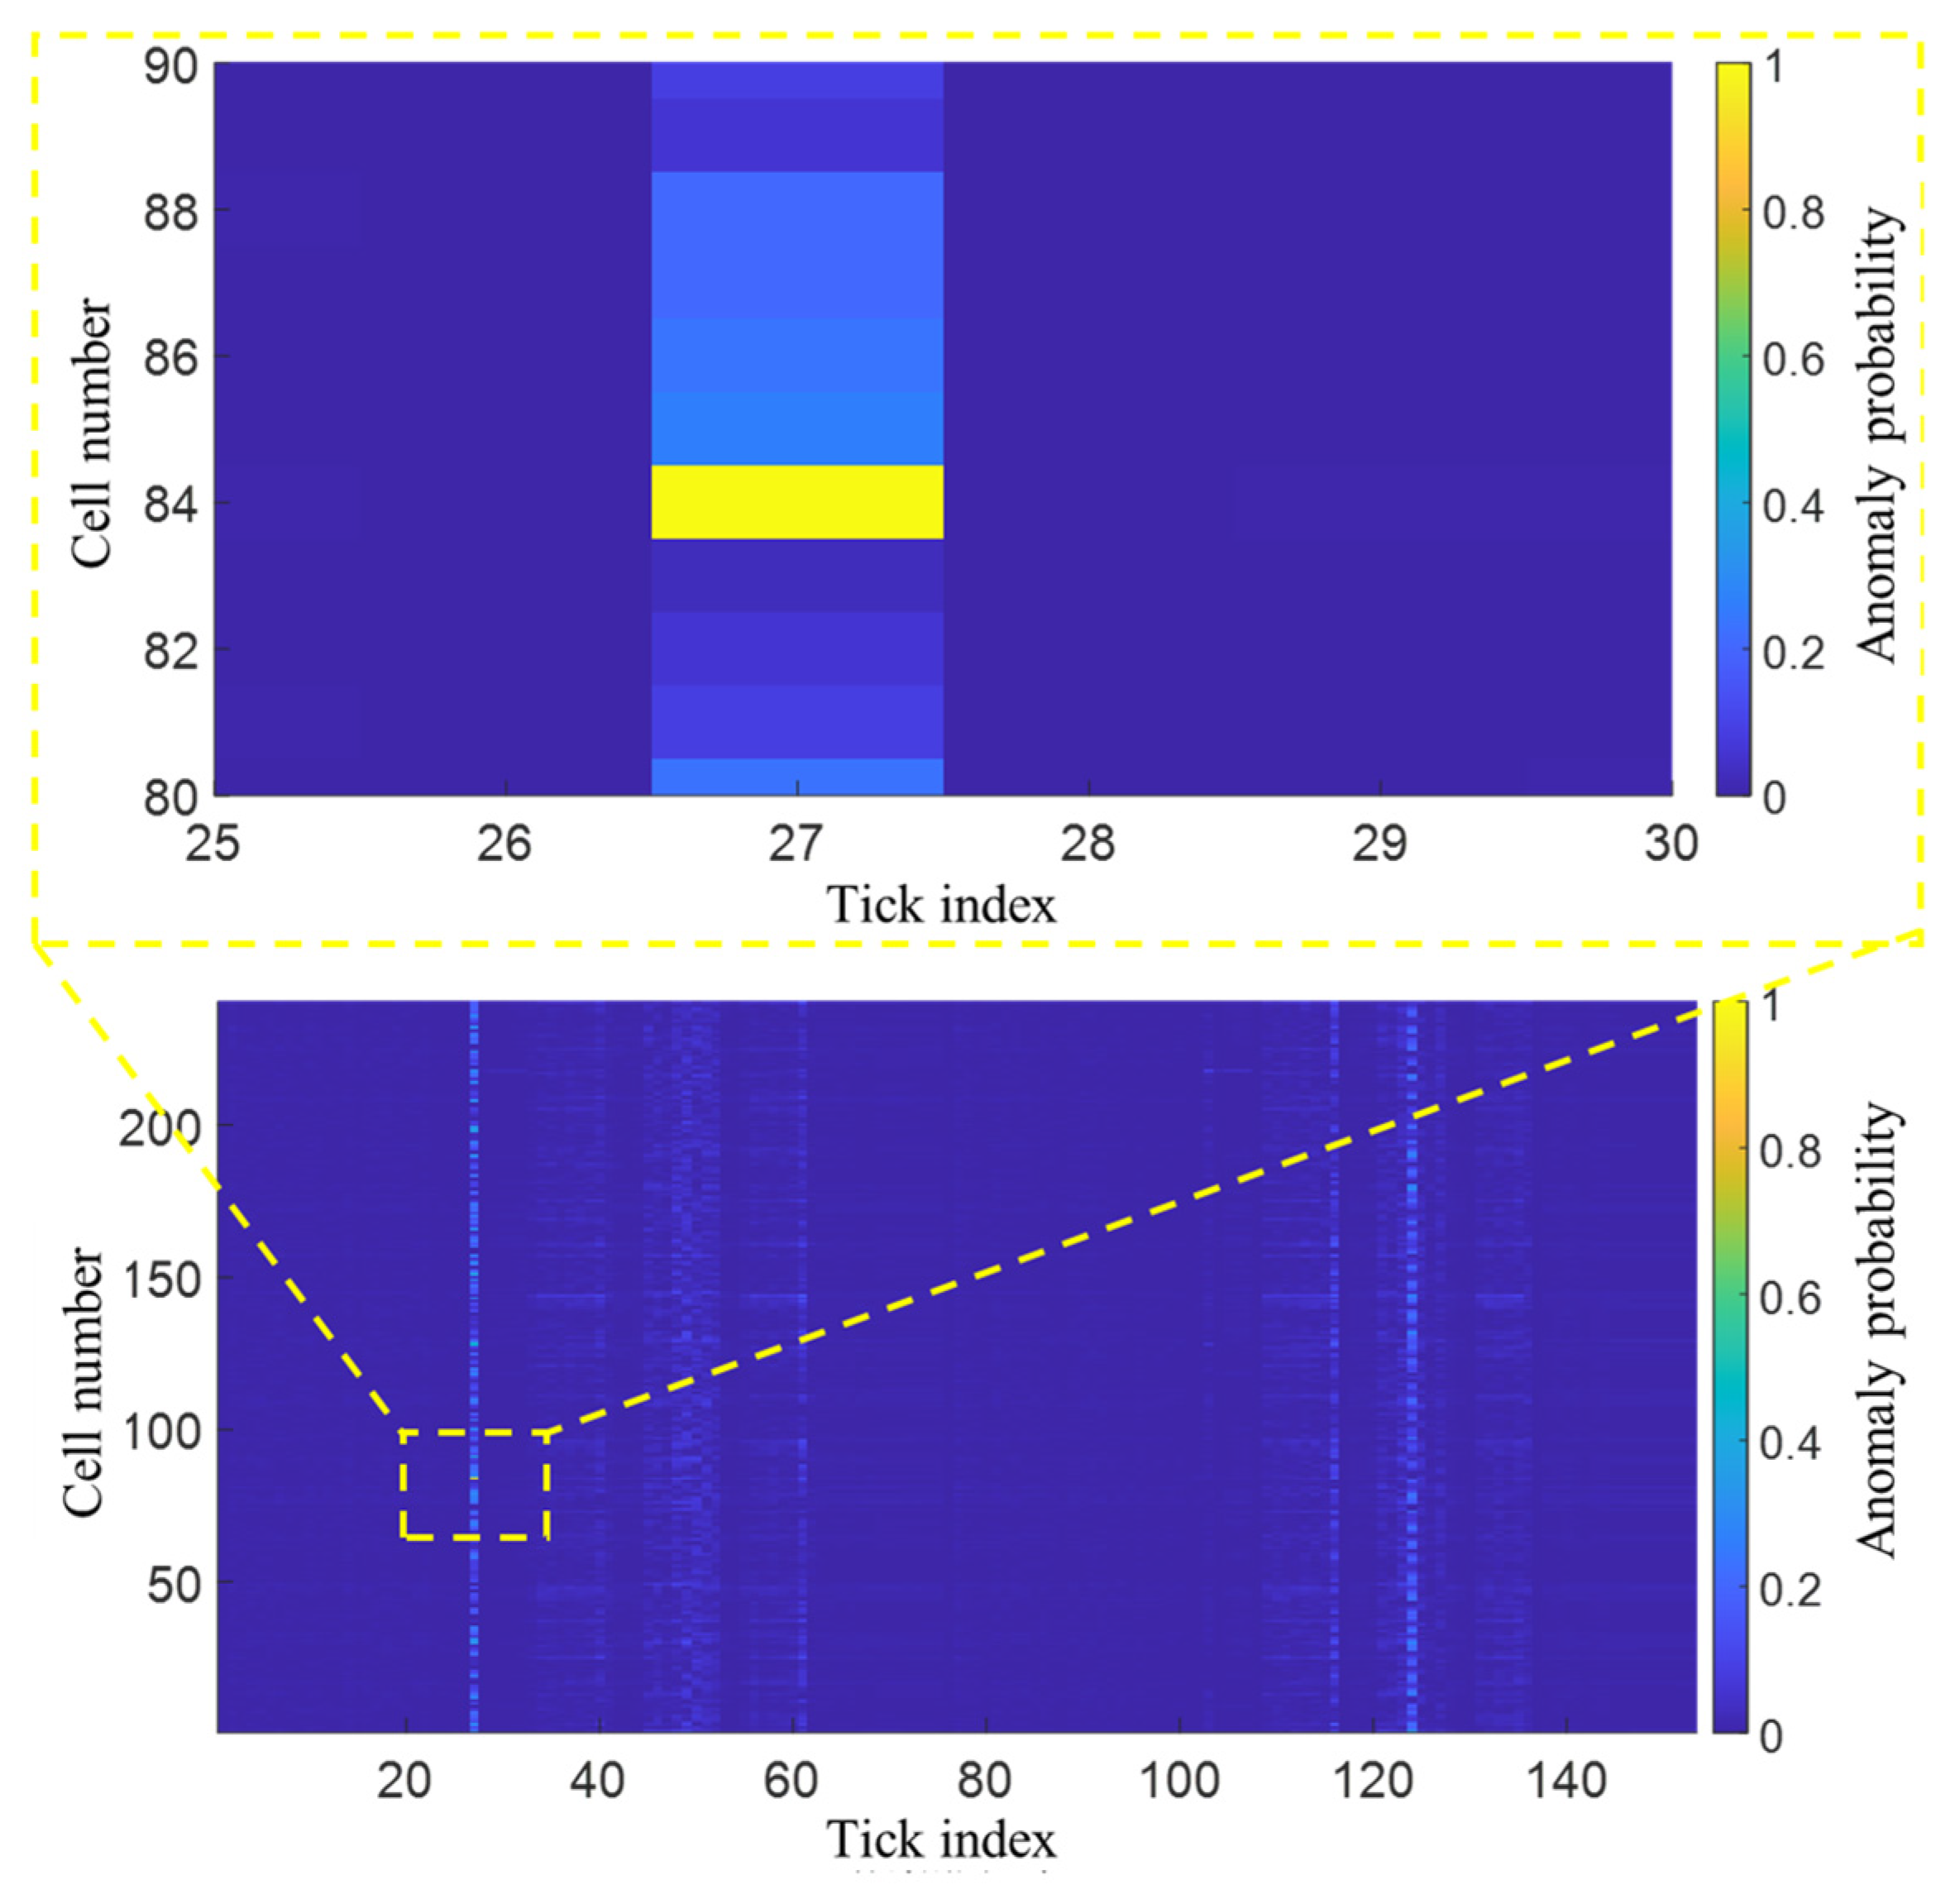
Figure 5 presents the cell-level anomaly probability heat map for the real-world station data. When the anomaly probability threshold is set to 0.80, the high-response region appears only at the 27th tick, and the corresponding high-response cell is identified as cell #84. This result is consistent with the voltage-dispersion peak and current transition observed in
Figure 4. Since the abnormal response occurs only at a single tick and does not persist over subsequent ticks, it is interpreted as a transient abnormal response associated with current disturbance and polarization relaxation differences, rather than a confirmed long-term faulty cell.
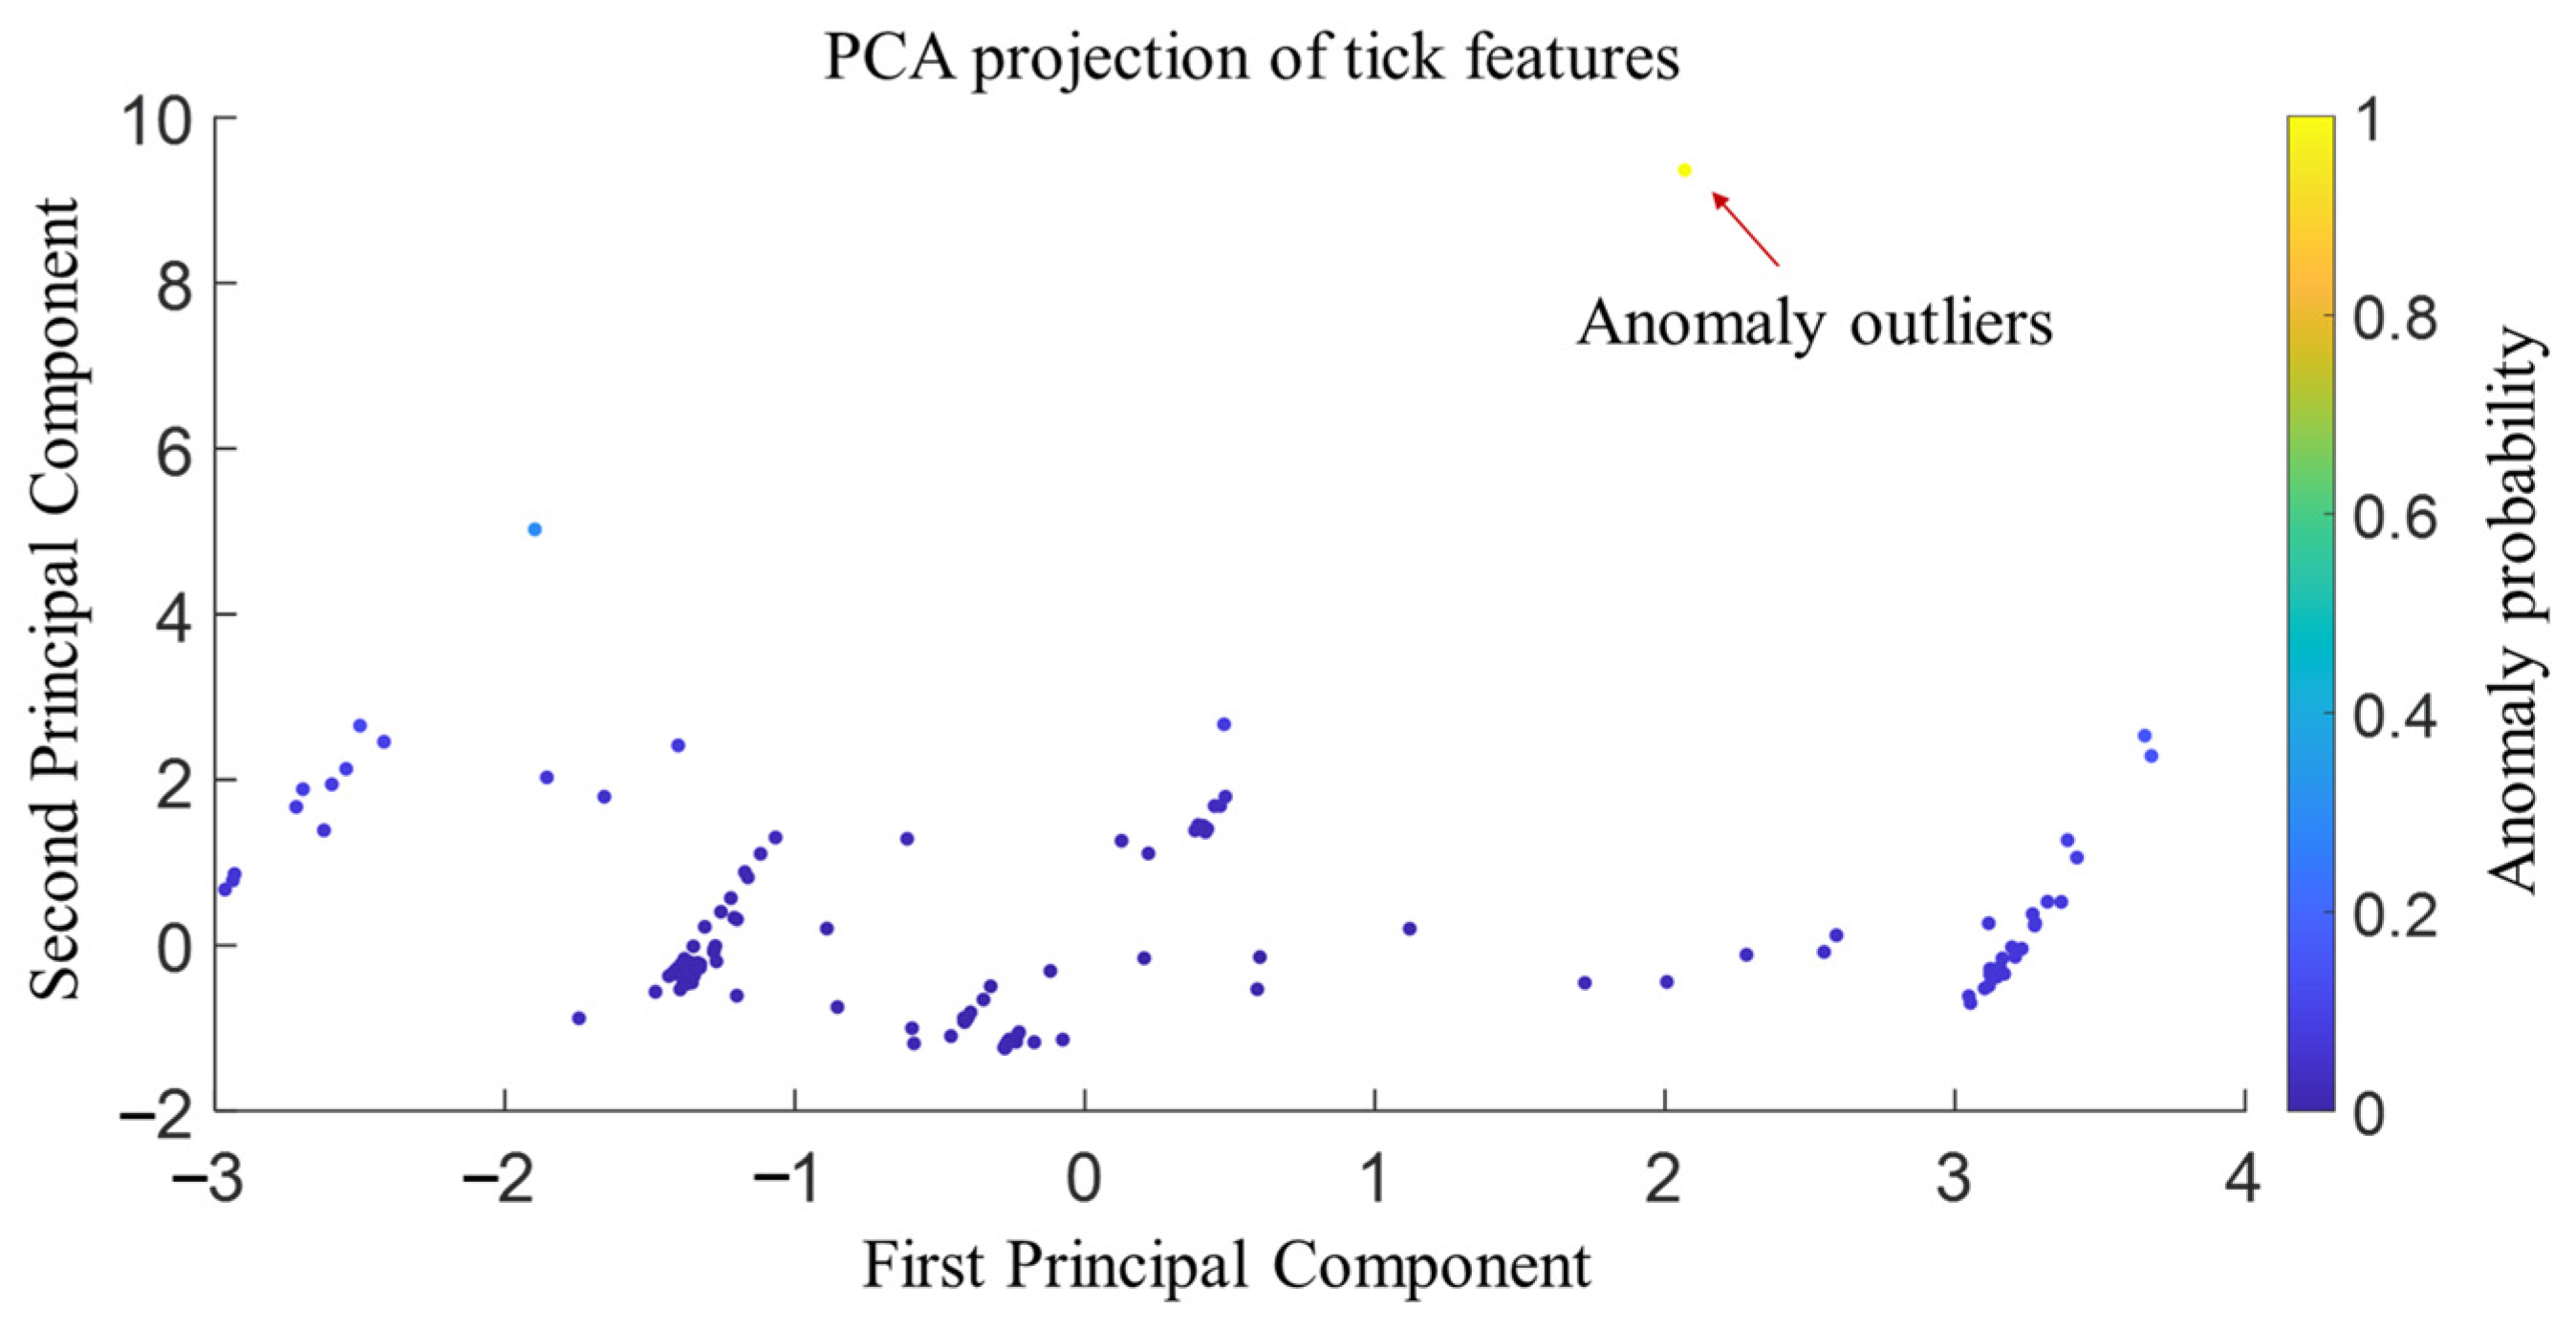
Figure 6 further shows the PCA projection of tick-level features in the real-world station dataset. The high-score tick corresponding to t = 24,023 s deviates from the main sample distribution, which is consistent with the peak voltage dispersion and minimum CI observed in
Figure 4. This agreement among physical indicators, comprehensive consistency index, and unsupervised anomaly score demonstrates that the constructed tick-level features preserve physically meaningful differences under asynchronous sampling.
Overall, the real-world station results demonstrate that the proposed method can capture consistency fluctuations under practical asynchronous cloud-monitoring conditions. The method does not simply identify a static voltage outlier; instead, it links cell-level voltage dispersion with interval-level operating conditions, thereby providing a more interpretable description of temporary consistency variation.
4.3. Validation on the Controlled Internal-Short-Circuit Module Experiment
To further evaluate the abnormal-cell localization capability of the proposed framework, the controlled module experiment described in
Section 2.2 was used as an independent validation case. In this experiment, a parallel resistor was connected across cell #13 to establish a controlled electrical leakage condition with a predefined abnormal-cell location. This condition provides a repeatable reference for examining whether the proposed framework can identify the cell exhibiting the dominant abnormal voltage response.
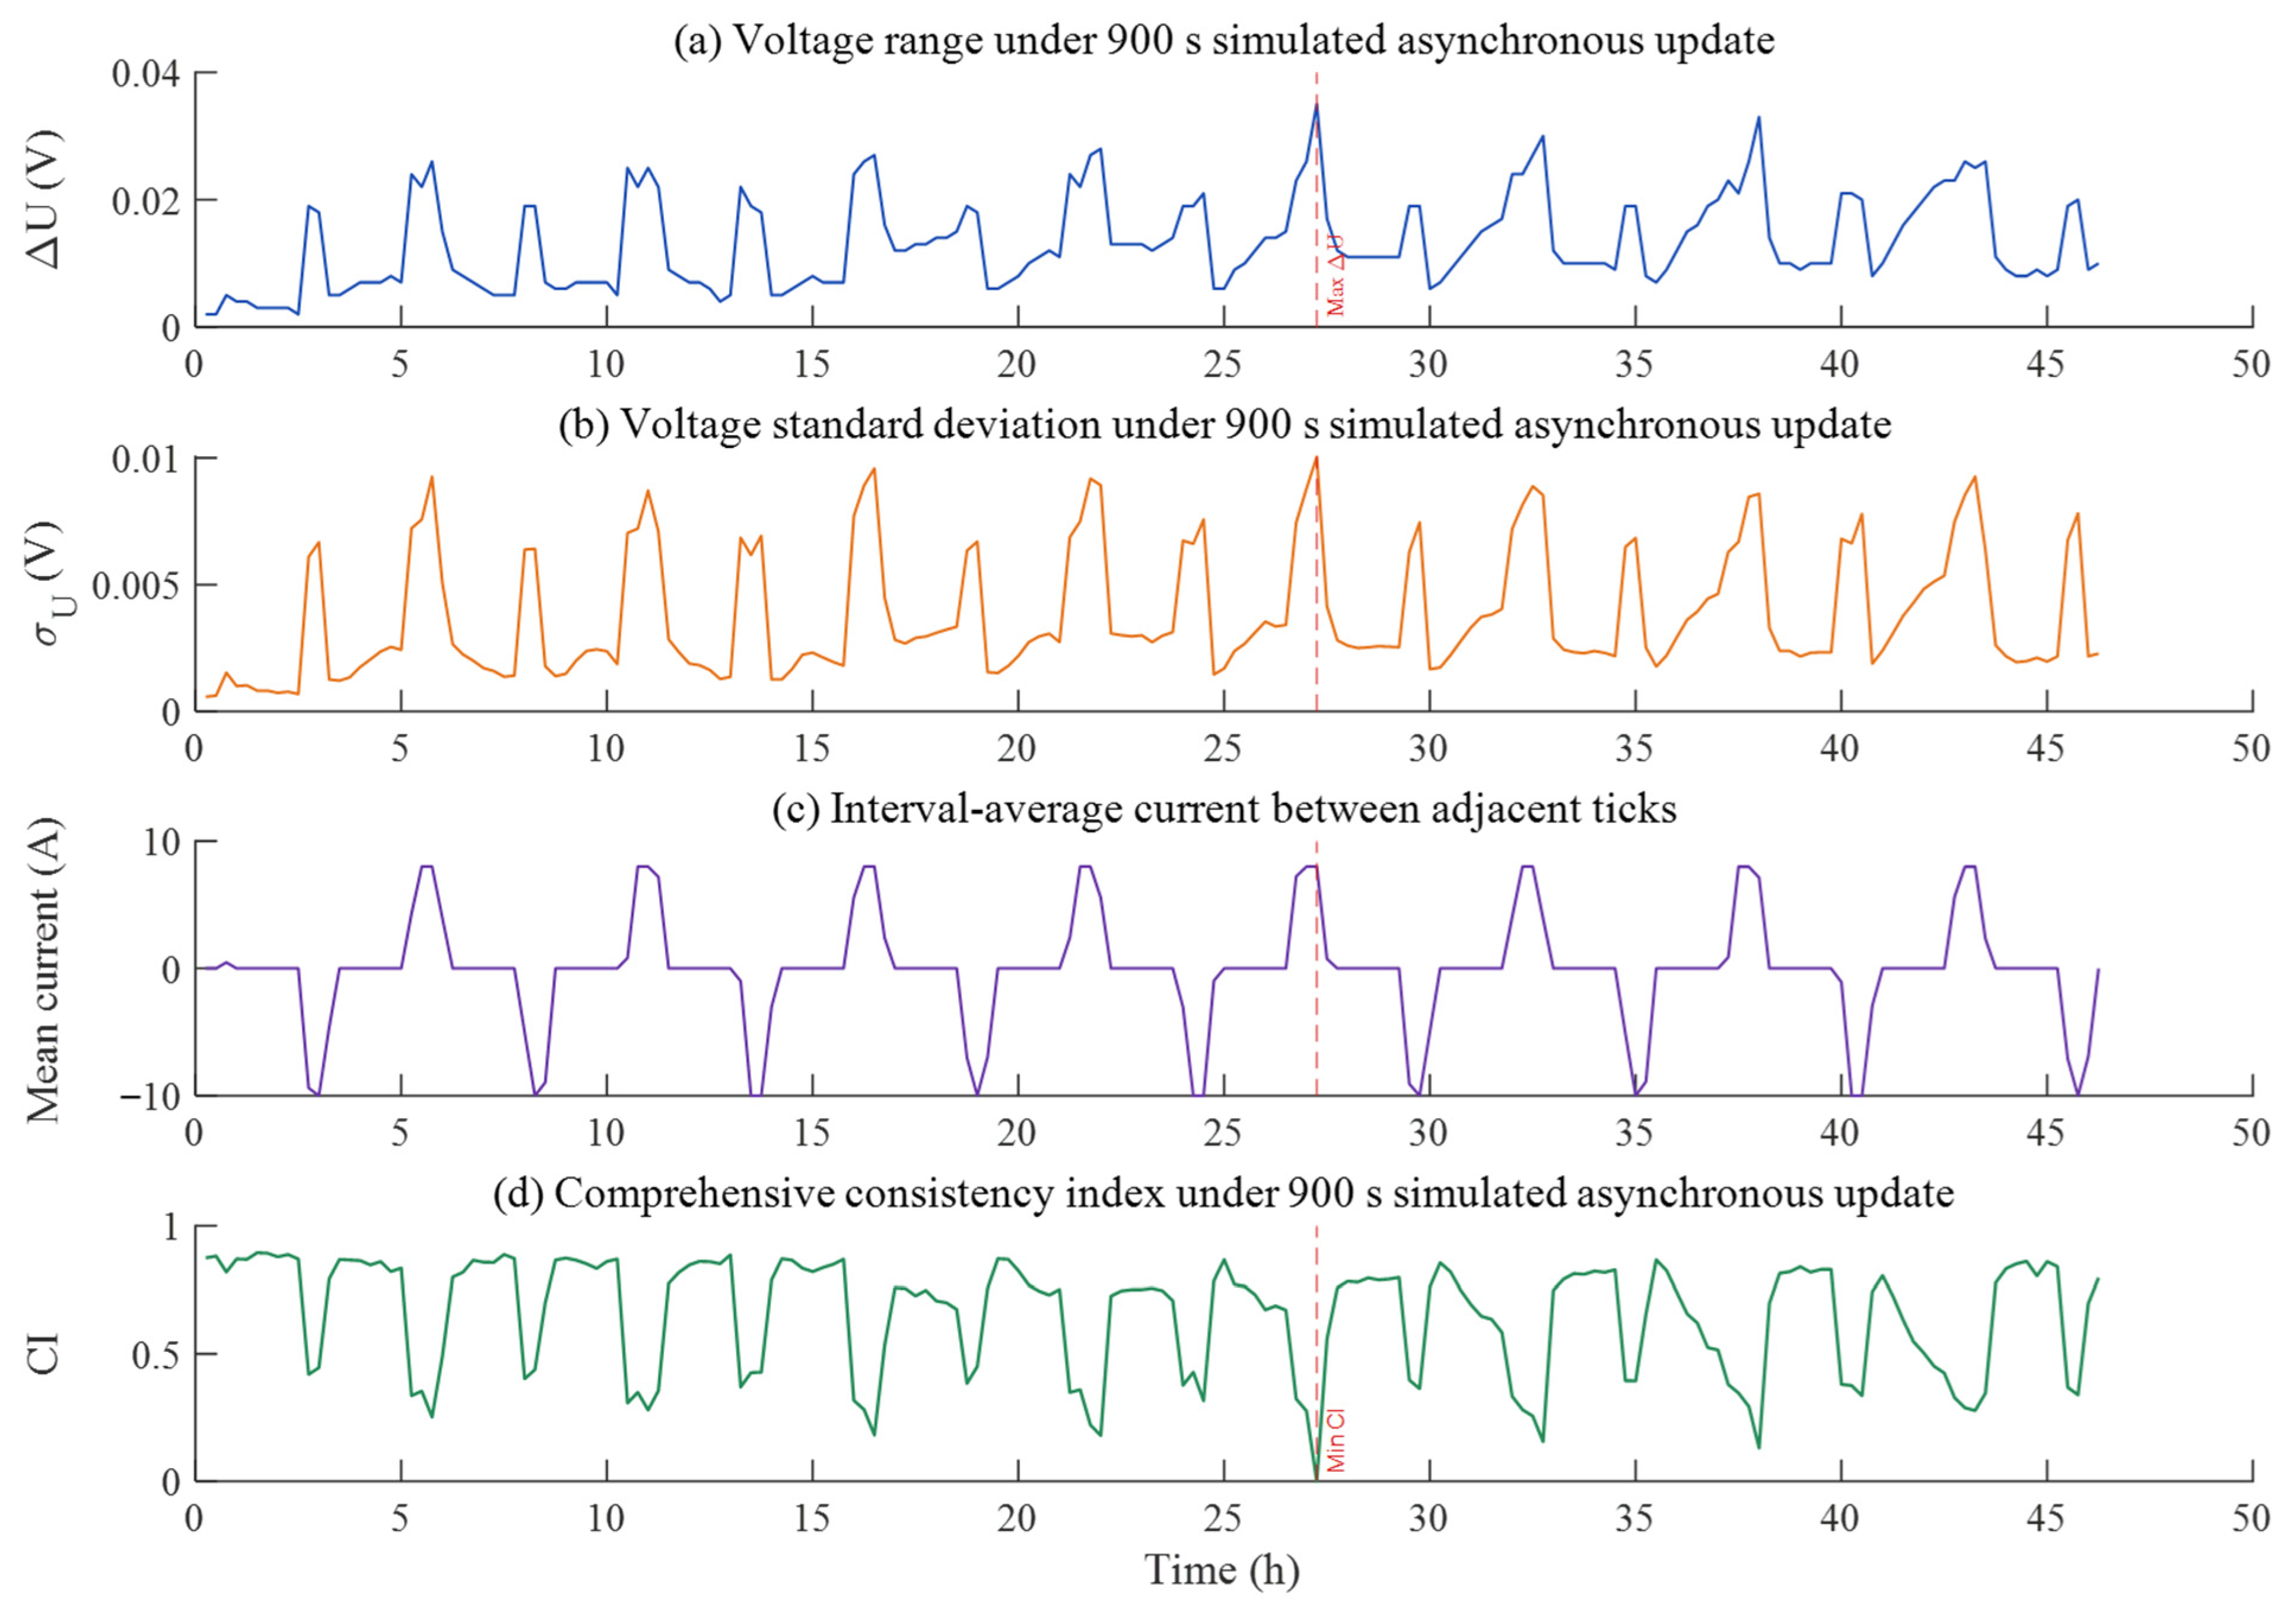
Figure 7 presents the temporal evolution of voltage-consistency indicators, interval-average current, and the comprehensive consistency index under the 900 s simulated asynchronous update interval. The voltage range and voltage standard deviation exhibit periodic fluctuations during repeated pulse-current operation, indicating that the module consistency is affected not only by the known internal-short-circuit cell but also by the inherent inconsistency of the module and the operating-condition-dependent voltage response. The strongest consistency disturbance occurs at tick 109, corresponding to 98,100 s. At this tick, the voltage range reaches 35.00 mV, the voltage standard deviation reaches 10.05 mV, and the comprehensive consistency index decreases to its normalized lower bound of 0. The simultaneous occurrence of the maximum voltage dispersion and the minimum CI indicates that the proposed index can capture the most severe consistency deterioration in the controlled experiment.
It should be noted that the abnormal response at tick 109 should not be attributed solely to the internal short circuit of cell #13. As shown by the interval-average current in
Figure 7, the experiment is conducted under repeated pulse-current conditions, and the voltage dispersion is influenced by current transitions, polarization differences, and the pre-existing inconsistency among cells. Therefore, tick 109 represents the moment at which the combined effects of the known internal-short-circuit cell, module-level inconsistency, and operating-condition-induced voltage dispersion become most pronounced. This interpretation is important because the proposed method is not intended to function as a simple single-threshold detector; rather, it integrates operating-condition information and voltage-dispersion features to characterize consistency deterioration under non-ideal module conditions.
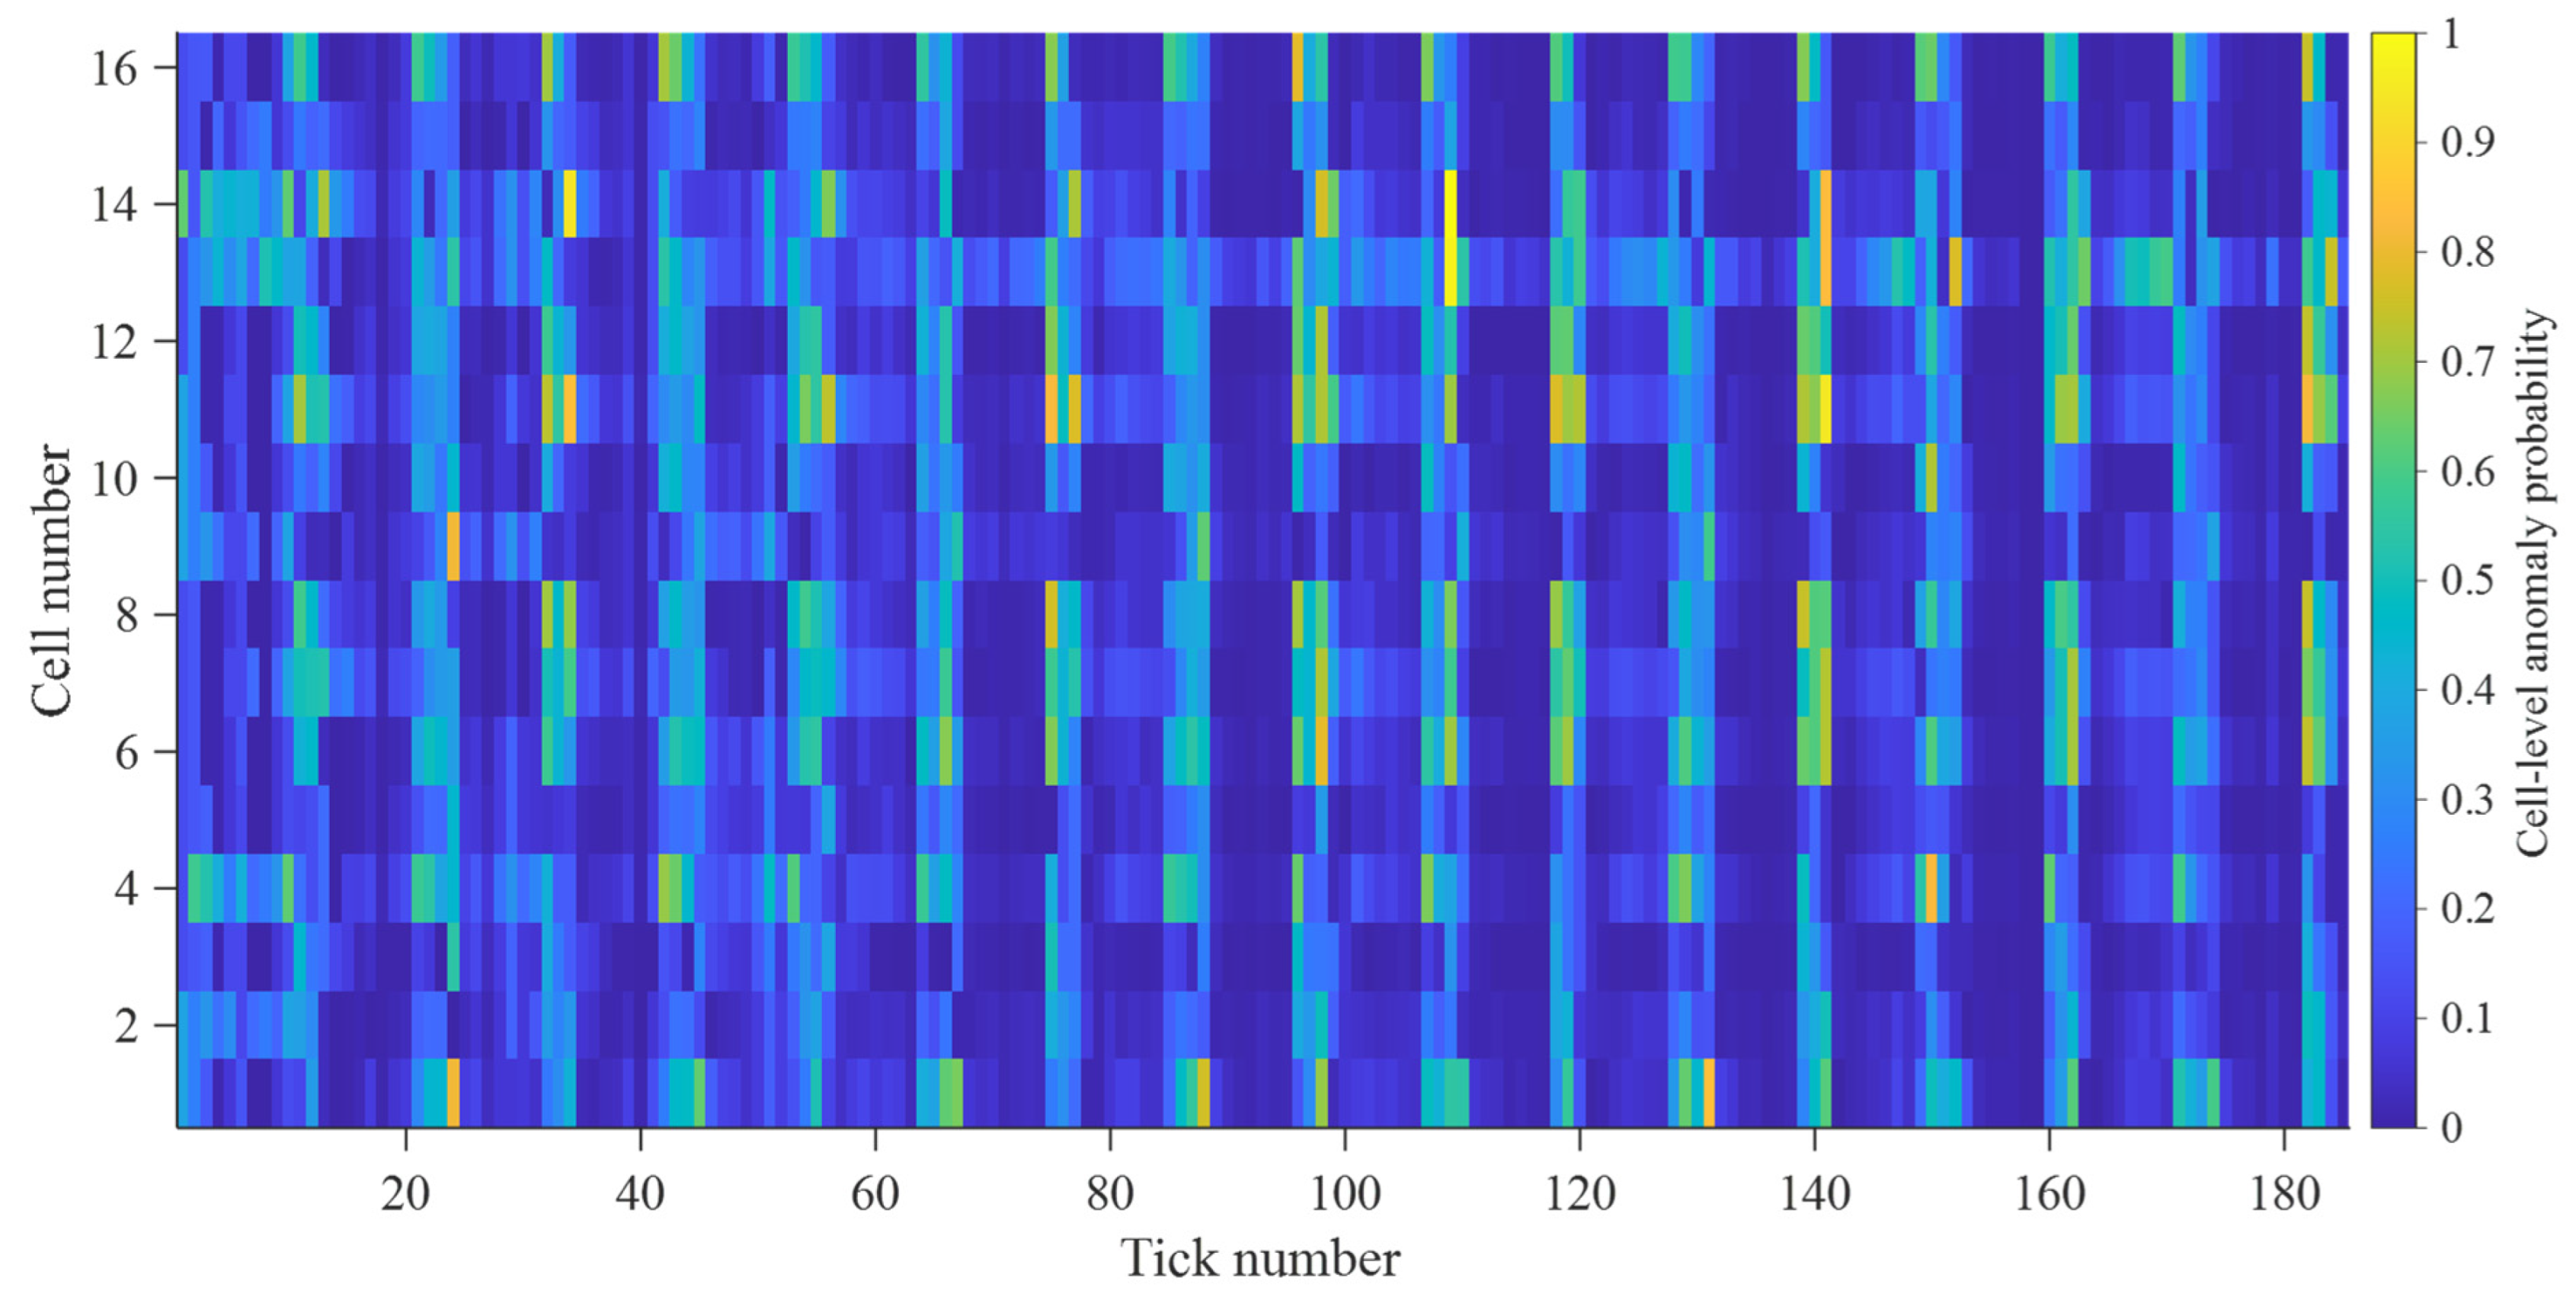
Figure 8 presents the cell-level anomaly probability distribution under the same 900 s simulated asynchronous update interval. The horizontal axis represents the tick sequence, and the vertical axis corresponds to the 16 series-connected cells. The color intensity denotes the cell-level anomaly probability
, which jointly reflects the tick-level anomaly score and the relative voltage deviation of each cell from the cell group. The heat map shows that the anomaly response is not concentrated exclusively on the known fault cell. Several cells also exhibit intermittently elevated anomaly probabilities at different ticks, which further confirms that the module itself has a non-negligible background inconsistency under the repeated pulse operating condition.
A detailed observation of
Figure 8 shows that cell #13 does not exhibit the highest anomaly probability from the initial stage of the experiment. In the early tick sequence, its response is comparable to that of several other cells, and the anomaly map is dominated by vertical high-response bands associated with global tick-level disturbances. As the cycling process proceeds, however, the response of cell #13 becomes more distinguishable and gradually forms a more persistent high-response region along the tick direction. Compared with the short-term high responses of other cells, the anomaly response of cell #13 shows stronger persistence and clearer spatial localization. This evolution is consistent with the experimental setting in which cell #13 was connected with a parallel resistor to emulate an internal short circuit. Therefore, the key evidence provided by
Figure 8 is not that cell #13 is always the only high-score cell, but that it develops a sustained and traceable abnormal-response pattern under a background of module inconsistency.
To quantify the localization result, the average anomaly probability, high-response ratio, and Top-1 occurrence frequency are calculated for each cell. As shown in
Figure 9, cell #13 ranks first in both average anomaly response and Top-1 occurrence frequency, indicating that it contributes most frequently and most strongly to the detected abnormal consistency response. This ranking result further confirms that the proposed method can localize the known internal-short-circuit cell without using fault labels during model construction.
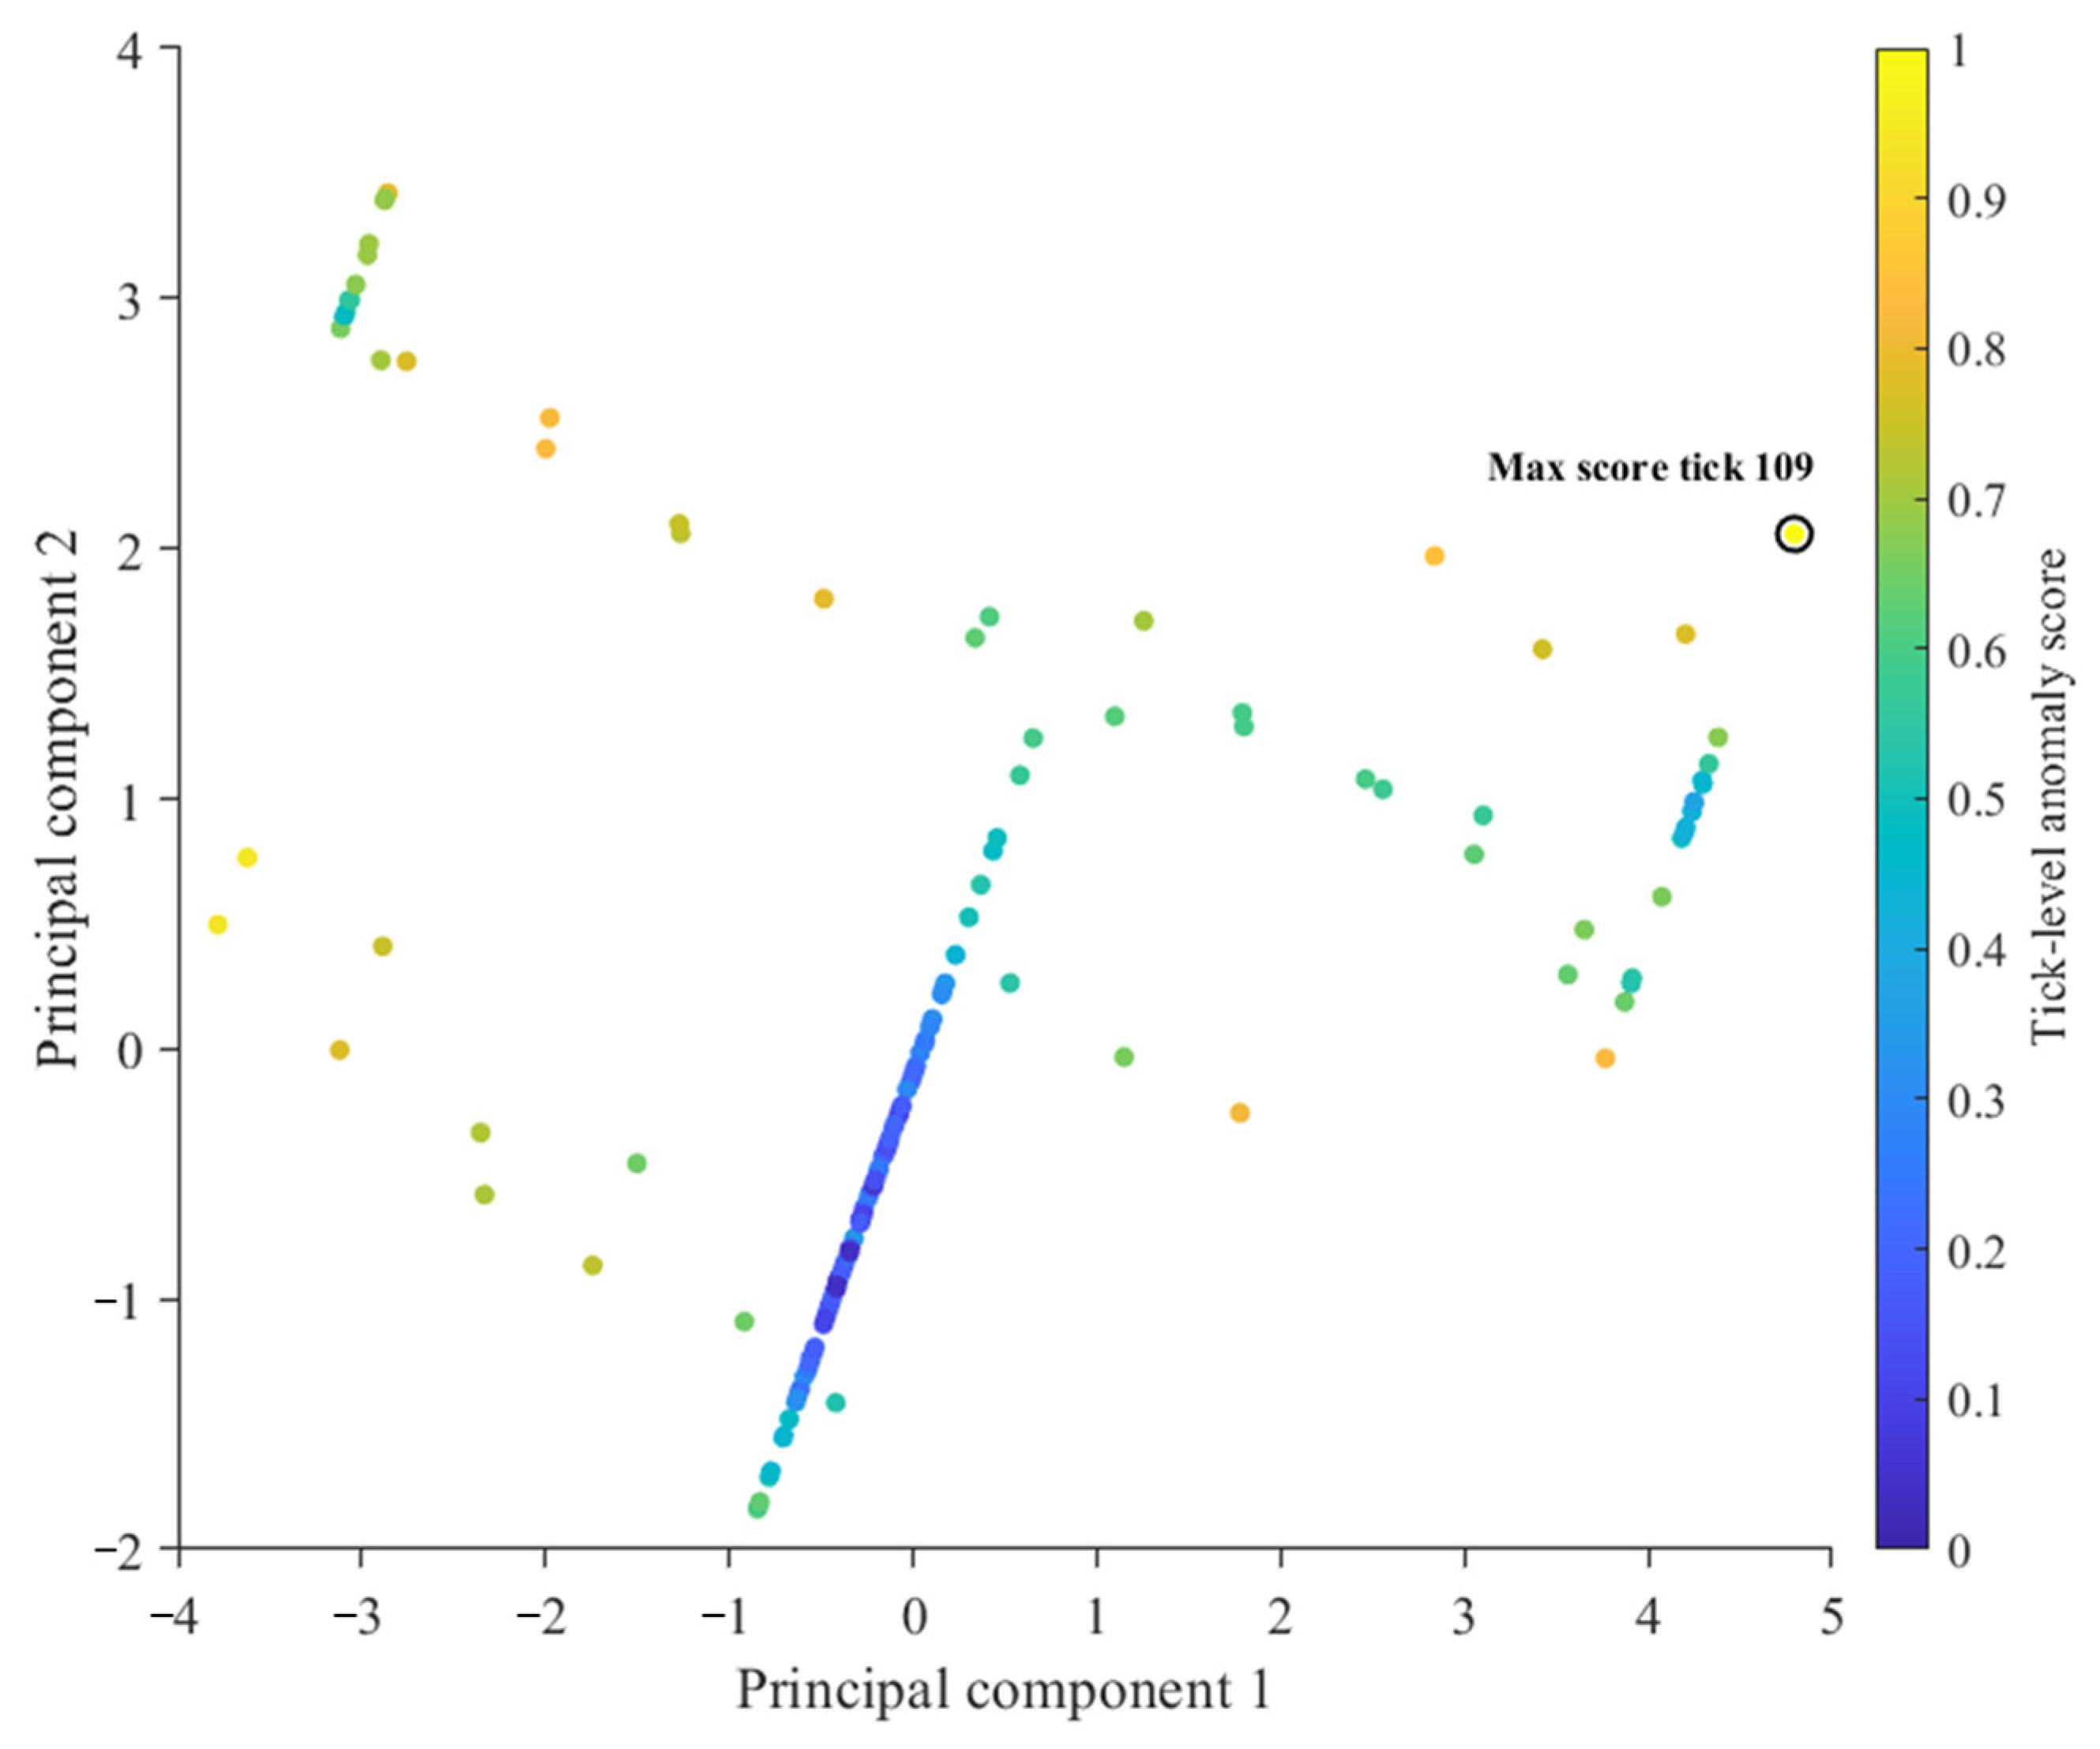
Figure 9 shows the PCA projection of the tick-level feature vectors constructed from voltage-consistency indicators and interval operating-condition features. The first two principal components explain 99.25% of the total variance, indicating that the five-dimensional tick-level feature vector can be effectively represented in a low-dimensional space. The tick samples do not form two completely separated clusters; instead, most samples follow a continuous distribution in the principal-component space, while high-score samples deviate from the main low-score region. This distribution is consistent with the observations in
Figure 7 and
Figure 8: the abnormal response in the controlled experiment is not an isolated single-fault event, but a coupled result of background module inconsistency, operating-condition transitions, and the additional deviation introduced by the internal-short-circuit cell.
The maximum anomaly score in the PCA space occurs at tick 109, which is consistent with the maximum voltage range, maximum voltage standard deviation, and minimum CI shown in
Figure 7. This agreement among the temporal consistency indicators, comprehensive consistency index, and PCA-based anomaly score indicates that tick 109 is not merely a numerical outlier in the reduced feature space, but corresponds to a physically meaningful consistency deterioration event. Meanwhile, the cell-level distribution in
Figure 8 shows that although multiple cells contribute to intermittent high responses, the known internal-short-circuit cell #13 exhibits a more persistent high-response pattern over the tick sequence.
Taken together,
Figure 7,
Figure 8 and
Figure 9 provide complementary evidence at the temporal, spatial, and feature-space levels.
Figure 7 identifies tick 109 as the strongest overall consistency-disturbance moment, where
,
, and
CI reach their extreme values.
Figure 8 further reveals that, under this non-ideal module consistency background, cell #13 gradually develops a sustained abnormal-response pattern that is consistent with the known internal-short-circuit setting.
Figure 9 confirms that the strongest abnormal tick is also distinguishable in the PCA feature space. These results indicate that the proposed tick-driven framework can integrate temporal anomaly assessment with cell-level localization and is therefore more appropriately interpreted as an interpretable abnormal-response localization framework rather than a simple single-cell threshold detector.
5. Conclusions
This study proposed a tick-driven multi-scale consistency analysis and unsupervised anomaly-localization method for asynchronously sampled energy storage battery data. By using cell-voltage update instants as analysis ticks, the method aggregates high-frequency operating variables within adjacent tick intervals and combines voltage-consistency indicators, PCA-based anomaly scoring, and cell-wise residuals to achieve tick-level abnormality assessment and cell-level localization without fault labels. The proposed method was validated using real-world energy storage station data and a controlled internal-short-circuit module experiment. For the station data, 190 effective ticks were extracted from two-day cloud-monitoring records, and a transient consistency fluctuation was identified at 24,023 s during a charging-condition transition, with cell #84 localized as the high-response cell. For the controlled experiment, cell #13 was connected with a parallel resistor to emulate an internal short circuit. After 900 s batch resampling, 185 effective ticks were extracted from 166,797 voltage samples, and cell #13 was identified as a persistent high-response cell, consistent with the known fault setting. Overall, the results indicate that the proposed method can capture short-term consistency fluctuations in real cloud-monitoring data and localize known abnormal cells under controlled fault conditions. By using cell-voltage update instants as analysis ticks, the method follows the physical update mechanism of cell-level variables and reduces repeated analysis of unchanged cell-voltage states, providing a lightweight and interpretable approach for online consistency monitoring of energy storage batteries.
The proposed framework is designed for consistency deviations that remain observable at subsequent cell-voltage update events. Its diagnostic coverage can be further extended using longer-duration, multi-station, and multi-fault datasets. In addition, the tick-driven strategy reduces redundant cell-level analysis instances by aligning analysis inputs with actual voltage-update events, while its runtime in large-scale online deployment will depend on the implementation environment and data volume.
Future work will incorporate longer-term multi-site data and additional health-related variables, such as temperature, internal resistance, and capacity variation, to improve the robustness and online applicability of the proposed method.