1. Introduction
Electrochemical Impedance Spectroscopy (EIS) has been established as an essential tool for the characterization, diagnosis, and modeling of lithium-ion batteries, both at the cell and module or battery pack levels [
1,
2,
3]. From the frequency response of the electrochemical system, it is possible to identify phenomena of different nature, such as ohmic resistance, charge transfer, double-layer formation, or diffusive effects associated with ion transport in the electrodes and the electrolyte [
4,
5]. This technique provides valuable insight into the internal mechanisms of the battery and is particularly useful for tracking the state of health (SOH), evaluating ageing, and detecting early degradation [
6].
In the context of electric mobility and stationary energy storage, accurate electrical characterization of modules and packs is increasingly relevant [
7]. At these integration levels, cell-to-cell non-uniformities and connection configurations significantly affect the impedance response. Reliable characterization of such systems is therefore critical to ensure durability and safety during first-life applications, where an accurate assessment of residual performance and electrochemical ageing is required [
8,
9].
However, sampling a number of measurement points to obtain a complete impedance spectrum, typically ranging from
to
Hz, takes a long time, especially at low frequencies [
10]. In industrial or online diagnostic applications, this limitation hinders the integration of EIS into monitoring or control systems, as low-frequency measurements may take several minutes per point. Consequently, there is growing interest in developing methodologies that reduce the number of measured frequencies without compromising model identifiability or sensitivity to ageing [
11,
12].
In this context, the present work proposes a methodology based on integrated gradients. The Integrated Gradients method, originally developed for deep neural network attribution, computes the contribution of each input feature by integrating gradients along a linear path from a baseline to the actual input, thereby satisfying desirable axiomatic properties [
13], applied here to the analysis of electrochemical impedance models in lithium iron phosphate (LiFePO
4, LFP) battery modules and cells. This methodology enables quantification of the sensitivity of each parameter of the equivalent circuit model on the real and imaginary parts of the impedance in the frequency domain, providing a direct measure of integrated influence. From this analysis, the most informative frequency regions and dominant parameters in each band are identified.
As an extension, an optimal frequency selection procedure is implemented based on the D-optimality criterion [
14,
15], using the Fisher Information Matrix derived from the model gradients to maximize the information content of the selected set [
16,
17]. This approach demonstrates a systematic methodology for identifying the number of sampling test and relevant frequencies while preserving the ability to estimate model parameters with minimal information loss. The focus is on the methodology itself, which can be applied broadly, rather than on the specific frequencies obtained in this study.
Finally, the study is framed within the need to establish standardized and traceable characterization procedures, aligned with the European Battery Passport initiative and international regulatory frameworks [
18], which aim to ensure transparency, durability, and sustainability of batteries throughout their life cycle. Thus, the present work contributes to the development of advanced diagnostic methodologies oriented toward first-life applications, reinforcing metrological traceability and supporting integration into circular economy strategies [
19,
20].
2. Materials and Methods
2.1. Overview of the Data Processing Pipeline
Initially, capacity cycling tests are performed to characterize the behavior of the cells and obtain reference values for later comparison. These cycles are conducted using a charge and discharge current of C/5, corresponding to 0.72 A based on the nominal capacity of the tested cylindrical cells, applying the voltage limits specified by the manufacturer, between 2.5 V and 3.65 V.
The experimental and numerical workflow implemented in this study is based on Simscape Electrical utilities and automatic differentiation through deep learning tools. The raw EIS data are loaded and processed to: (i) fit an equivalent circuit model at the cell level, (ii) replicate the fitted cell parameters in a 16s5p battery pack model to compute the overall pack impedance, (iii) compute automatic gradients of the pack impedance with respect to the cell-level model parameters, (iv) calculate integrated-gradient sensitivity metrics, and (v) select a reduced subset of frequencies using a greedy D-optimality algorithm.
The D-optimal frequency-selection step identifies the measurement points with the highest information content, allowing redundant frequencies to be removed and thereby reducing the EIS measurement time at the battery-pack level. The emphasis of this study is on the methodology for selecting informative frequencies rather than the specific frequency values obtained.
2.2. Cell-Level Parameter Estimation
Fitting is performed using fitEISModel, a MATLAB 2025a routine for parameter estimation of equivalent-circuit models [
21]. The selected equivalent-circuit configuration is employed because it reliably captures the degradation modes of interest, provides a fit to the impedance data, and is widely used in the scientific literature for cells of similar chemistry. This routine requires an initial set of parameter values to initialize the optimization. These initial guesses are obtained using estimateBatteryEISParameters [
22], an internal function that generates physically consistent parameter estimates based on the measurement conditions, in this case, a temperature of 10 °C. In this study, a temperature of 10 °C is used as a representative operating condition within the normal working range of the cells, avoiding extreme low- or high-temperature regimes that could introduce additional kinetic limitations or accelerated degradation effects. Since the focus of this work is methodological, the proposed approach is not temperature-specific and can be readily extended to other operating temperatures.
The optimization is then carried out with the Levenberg–Marquardt solver lsqnonlin [
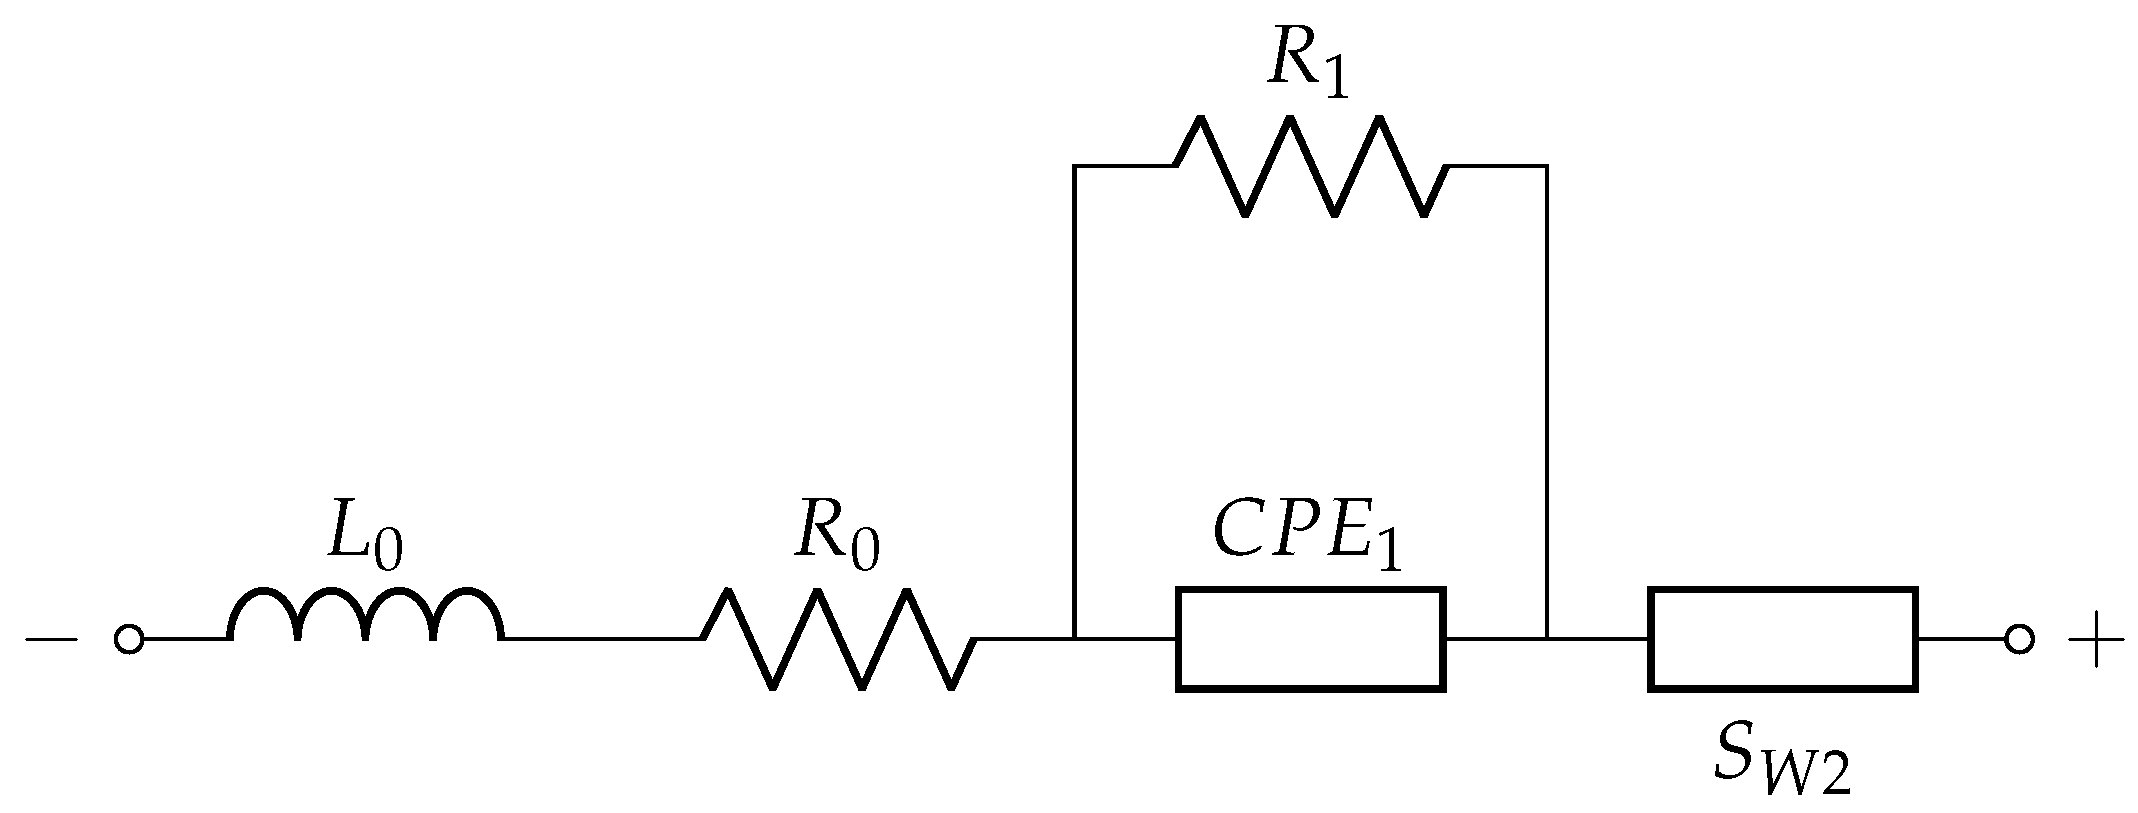
23], a nonlinear least-squares algorithm from the Optimization Toolbox. Strict tolerances are imposed to accurately estimate the six cell-level parameters
, as illustrated in
Figure 1.
Specifically,
represents high-frequency inductive effects associated with cell connections and current collectors,
corresponds to the ohmic resistance of the electrolyte and electrical contacts, the parallel combination of
with the constant phase element parameters
and
models charge-transfer resistance and non-ideal double-layer capacitance at the electrode–electrolyte interface, and
accounts for diffusion-related impedance effects commonly represented by a Warburg-type element [
24].
2.3. Pack Model Construction (16s5p)
Each individual cell impedance is represented by the fitted equivalent circuit model, shown in Equation (
1), which accounts for inductive, ohmic, charge-transfer, and diffusive contributions.
A single string is formed by connecting
cells in series, leading to the total string impedance defined in Equation (
2). Since impedances in series are additive, the string impedance results from the summation of the individual cell impedances.
The complete battery pack is constructed by replicating the fitted single-cell parameter vector into a 16s5p configuration (16 cells in series, 5 parallel strings). The overall pack impedance, expressed in Equation (
3), is computed by combining the series-connected strings in parallel.
where
is the number of parallel strings. This hierarchical formulation enables the scaling of the single-cell impedance model to the pack level while preserving the frequency-dependent behavior of each electrochemical process.
2.4. Automatic Differentiation and Gradient Computation
For each frequency
and for each parameter
p of each cell
c, the workflow computes the gradients of both the real and imaginary parts of the pack impedance with respect to that parameter, i.e.,
where
denotes the
p-th parameter of cell
c. These per-cell, per-parameter gradients are then averaged across all cells and strings to obtain the per-frequency Jacobian entries used to construct the Fisher Information Matrix.
In the dlgradient framework, when the function output is complex, the computed gradients may themselves be complex. According to the documentation [
25], “the variable to differentiate must be real …the gradient is defined in the direction of increase in the real part of the function.” While this gradient contains both real and imaginary components, only the real and imaginary parts of the impedance itself correspond to physically measurable quantities. In other words, the complex component of the gradient that does not align with these observables has no direct physical interpretation. Consequently, to ensure that the computed sensitivities accurately represent the influence of parameter perturbations on measurable quantities, we extract the real component of the gradient corresponding to each impedance component.
2.5. Integrated Gradients Sensitivity
A Monte Carlo-style integrated-gradients approach is applied to estimate the accumulated influence of each parameter on the real and imaginary parts of the impedance across frequencies. For each parameter
of each cell, a nominal value is defined and a perturbation range is specified via user-defined factors, as summarized in
Table 1. The pertubation range were selected based on reported variations in equivalent circuit model (ECM) parameters observed during lithium-ion cell aging and real operating conditions. Experimental studies have shown that parameters such as the ohmic resistance
, charge-transfer resistance
, and constant phase element characteristics
and
can change significantly over cycling, with variations on the order of 10–30% depending on the cell chemistry, state-of-charge range, and usage profile [
26,
27,
28].
interpolation points are then generated between the nominal and perturbed values, randomized within the allowed factor bounds. At each interpolation point, automatic gradients of
and
with respect to
are computed using dlgradient, providing the instantaneous sensitivity of the parameter. These gradients are multiplied by the parameter increment and accumulated across all
points, forming a numerical Riemann sum that approximates the integral of the gradient along the path from nominal to perturbed value as defined in Equation (
4).
where
denotes the integrated influence of parameter
on the impedance at frequency
. Since the function outputs are complex, the gradients returned by dlgradient are also complex; however, we are interested in the influence on the measurable real and imaginary parts of impedance, so only the real components are extracted.
Finally, the accumulated gradients are averaged across all cells and strings to obtain per-frequency Jacobian rows, resulting in a sensitivity map for each parameter and component (real/imaginary), which informs the selection of the most informative frequencies and highlights the parameters dominating each frequency band.
Importantly, although classical sensitivity analysis techniques, such as local normalized sensitivities or variance-based global methods (e.g., Sobol indices), are widely used to quantify parameter influence, they present certain limitations in the context of impedance-based equivalent circuit models. Local sensitivity metrics rely on linearization around a nominal operating point and may therefore fail to adequately capture nonlinear effects across the parameter perturbation ranges considered. Variance-based methods, while more comprehensive, typically require a large number of model evaluations, resulting in high computational cost when applied across multiple frequencies and cell populations [
29].
2.6. D-Optimal Frequency Selection
To identify the most informative frequency points for EIS, a D-optimal selection procedure is applied to the per-frequency Jacobian, constructed by concatenating averaged real and imaginary gradients [
30]. For each candidate frequency
, the Jacobian row vector is defined as in Equation (
5), where
is the vector of effective cell-level model parameters obtained after averaging across all cells and strings [
31].
Given a selected set of frequencies
, the corresponding Jacobian matrix is constructed by stacking the individual Jacobian rows, creating a reduced matrix of gradients of the selected frequencies shown in Equation (
6).
The Fisher Information Matrix (FIM) associated with the selected frequencies is computed with a small regularization term
to avoid numerical ill-conditioning. This value of
was chosen to ensure that the matrix remains well-conditioned while having a negligible effect on the relative determinant values used for frequency selection. Since the influence of
uniform across all candidate frequencies, the ranking of frequencies by informativeness and the selection of the most informative set remain unchanged. Sensitivity tests confirmed that variations in
by several orders of magnitude do not significantly alter the selected frequency set. Maximizing the determinant of the FIM, as defined in Equation (
7), corresponds to the D-optimality criterion, which minimizes the generalized variance of the estimated parameters [
32].
At each iteration, the D-optimal algorithm selects the frequency
that maximizes the determinant of the updated FIM, allowing for a sequential construction of a reduced but highly informative frequency set, as given in Equation (
8).
Recent work on EIS experiment design has shown that reducing the number of frequency points, while optimizing their placement, can preserve the information content required for parameter estimation and significantly reduce measurement time compared to dense frequency sweeps. In particular, Fisher Information Matrix-based approaches have demonstrated that a limited number of well-chosen frequencies can maintain estimation accuracy while lowering experimental complexity [
11]. Similarly, fast acquisition strategies based on measuring only informative frequency segments have been shown to achieve substantial reductions in acquisition time without a marked degradation of spectral information [
33]. Previous studies have also reported that very small frequency sets, in some cases as few as three frequencies, can be sufficient for specific diagnostic tasks [
34]. However, such minimal configurations are typically tailored to narrow objectives and rely on strong assumptions regarding the dominant electrochemical processes. In contrast, the present work targets parameter identification across a broader range of frequencies and model parameters. For this reason, a subset of
K = 10 frequencies is selected as a conservative yet still strongly reduced design, ensuring adequate sensitivity across multiple impedance features while remaining compatible with fast EIS acquisition.
2.7. Model Comparison and Visualization
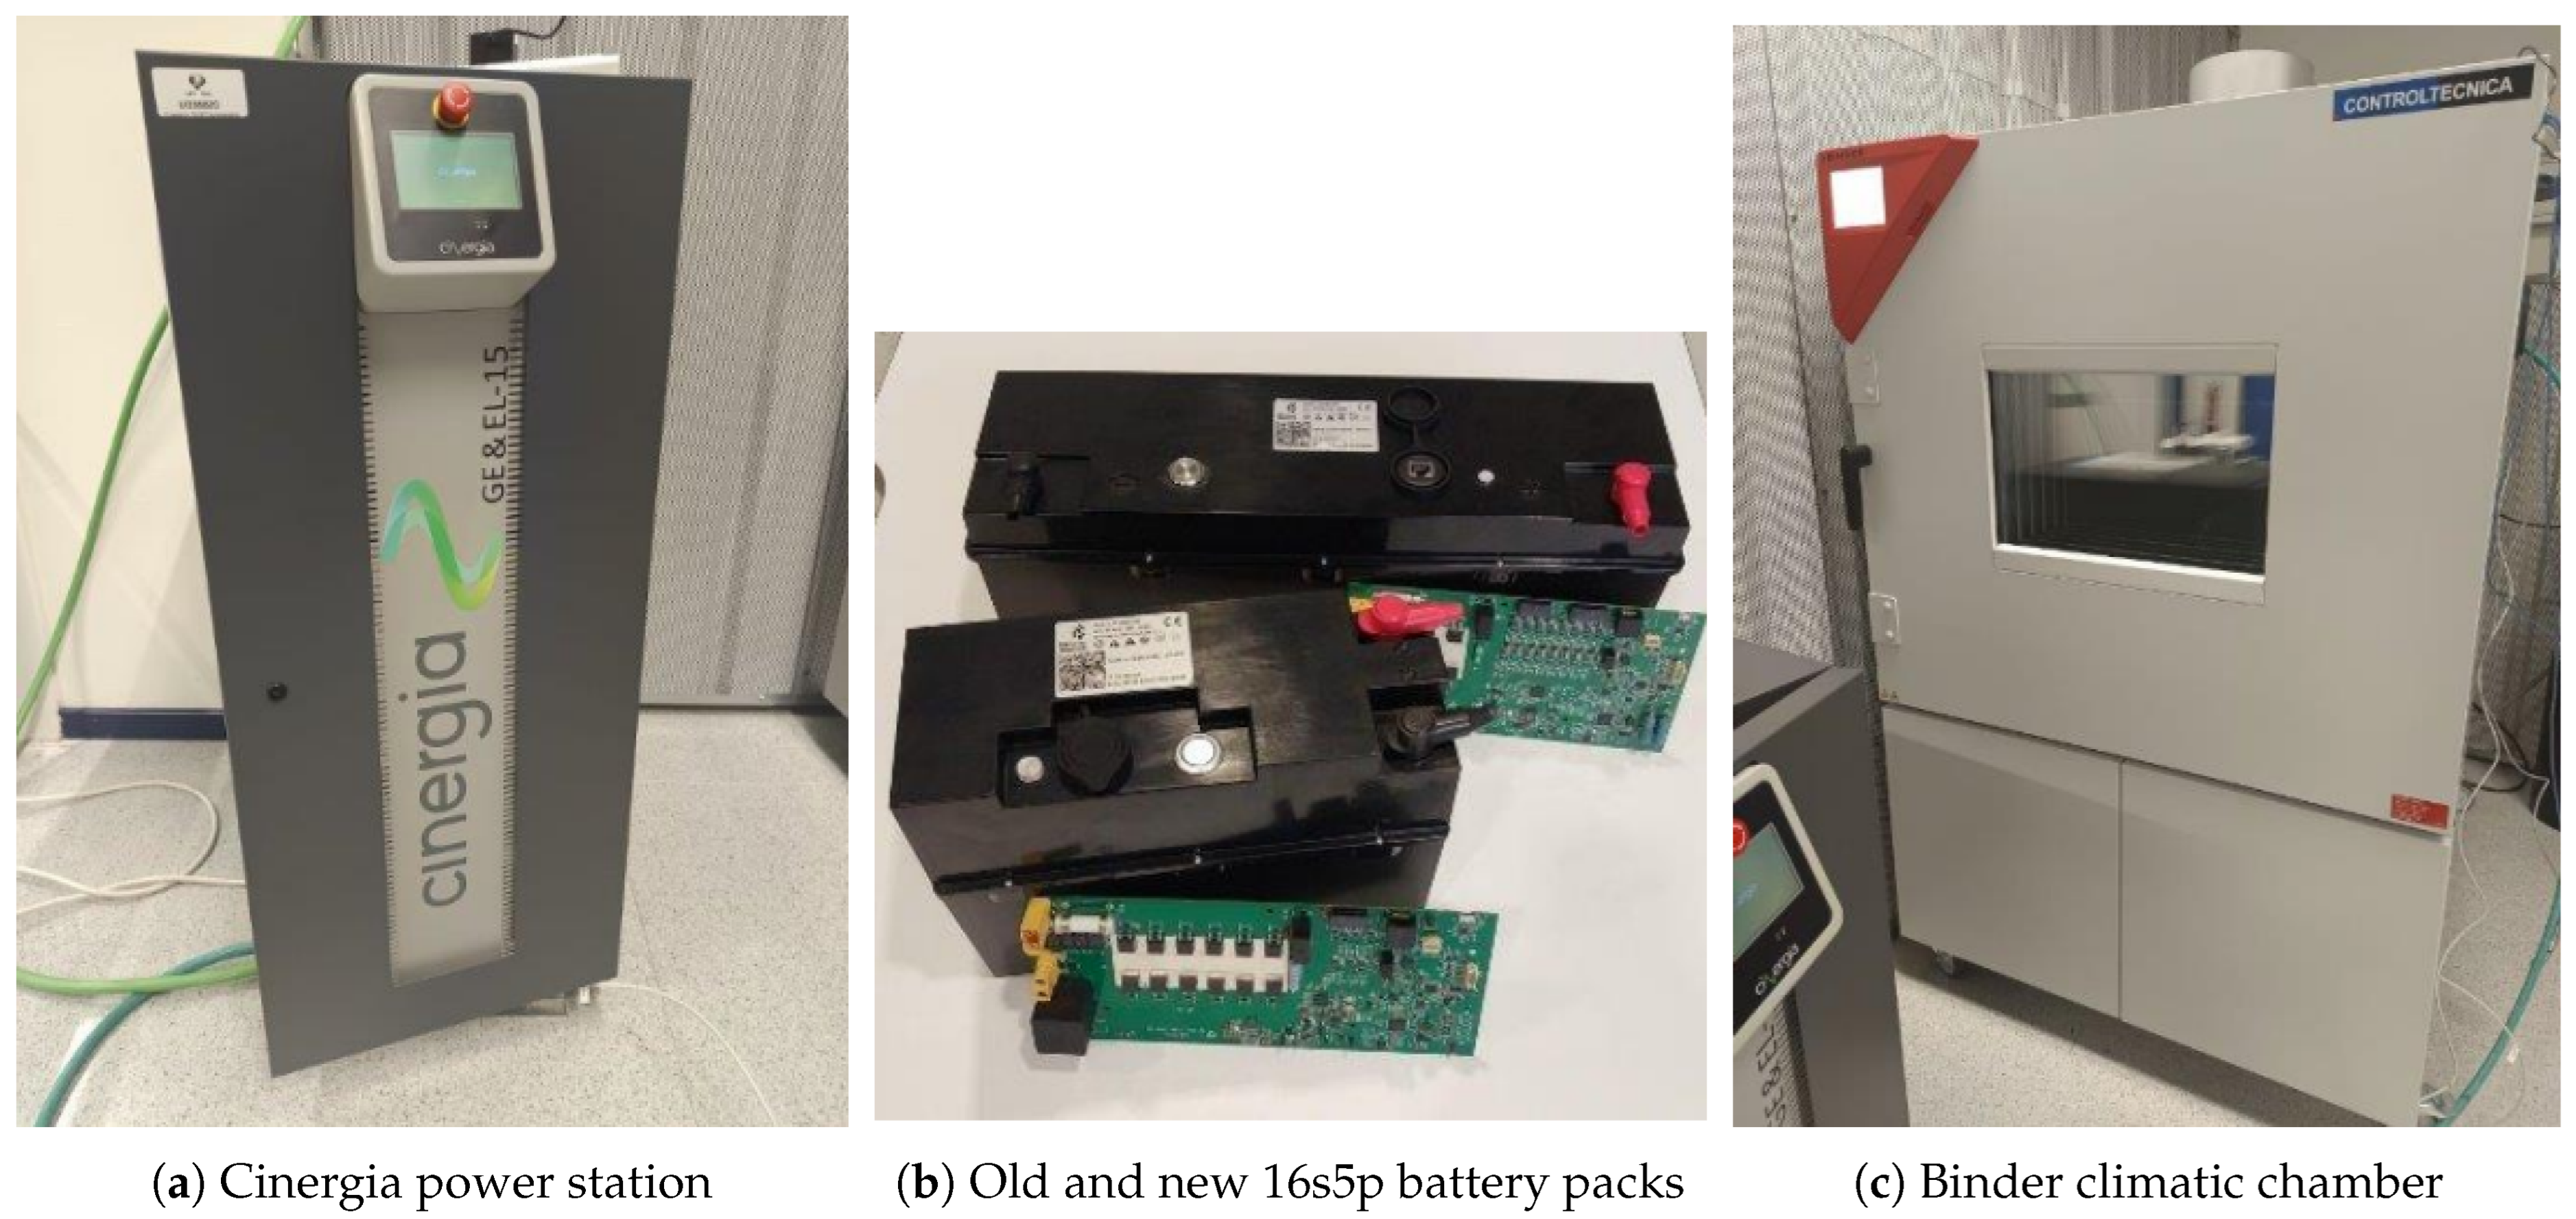
Using the fitted equivalent circuit models, a comprehensive evaluation of impedance behavior and parameter evolution is performed for both new and aged 16s5p LFP battery packs [
35], as shown in
Figure 2b. First, full EIS measurements are conducted on both packs using a Cinergia power station [
36], as shown in
Figure 2a, in a single-channel connection configuration. Temperature is carefully controlled at 10 °C using a Binder climatic chamber [
37], as shown in
Figure 2c, ensuring consistent measurement conditions. From these full-spectrum measurements (30 frequencies), the battery pack parameters are extracted and the percentage changes between new and aged packs are computed as
providing a quantitative assessment of aging-induced variations.
Subsequently, a reduced EIS measurement was conducted using only the 10 D-optimal frequencies, which had been previously identified on the prior analysis of parameter variations. These frequencies were selected to maximize the information content while minimizing the measurement time. The parameters were then extracted from this reduced-frequency dataset, and the frequency-dependent changes were compared with those obtained from the full-spectrum measurements to ensure that no significant information was lost.
3. Results
The fitted equivalent circuit model parameters are presented for the individual cells and for the 16s5p battery pack assembled from these cells. The cell-level parameters are extracted from electrochemical impedance spectroscopy measurements following standard ECM identification procedures [
38,
39].
Table 2 summarizes these values enabling a direct comparison between cell-level and pack-level characteristics under nominal conditions. The estimated parameters exhibit a systematic increase in magnitude when transitioning from the cell level to the 16s5p battery pack, consistent with the series–parallel electrical configuration of the system. In particular, resistive and diffusive parameters such as
,
, and
scale with the number of cells and parallel branches, while the constant-phase exponent
remains unchanged, as expected from its dimensionless nature. This behavior confirms the physical consistency of the parameter scaling and the validity of the adopted modeling approach.
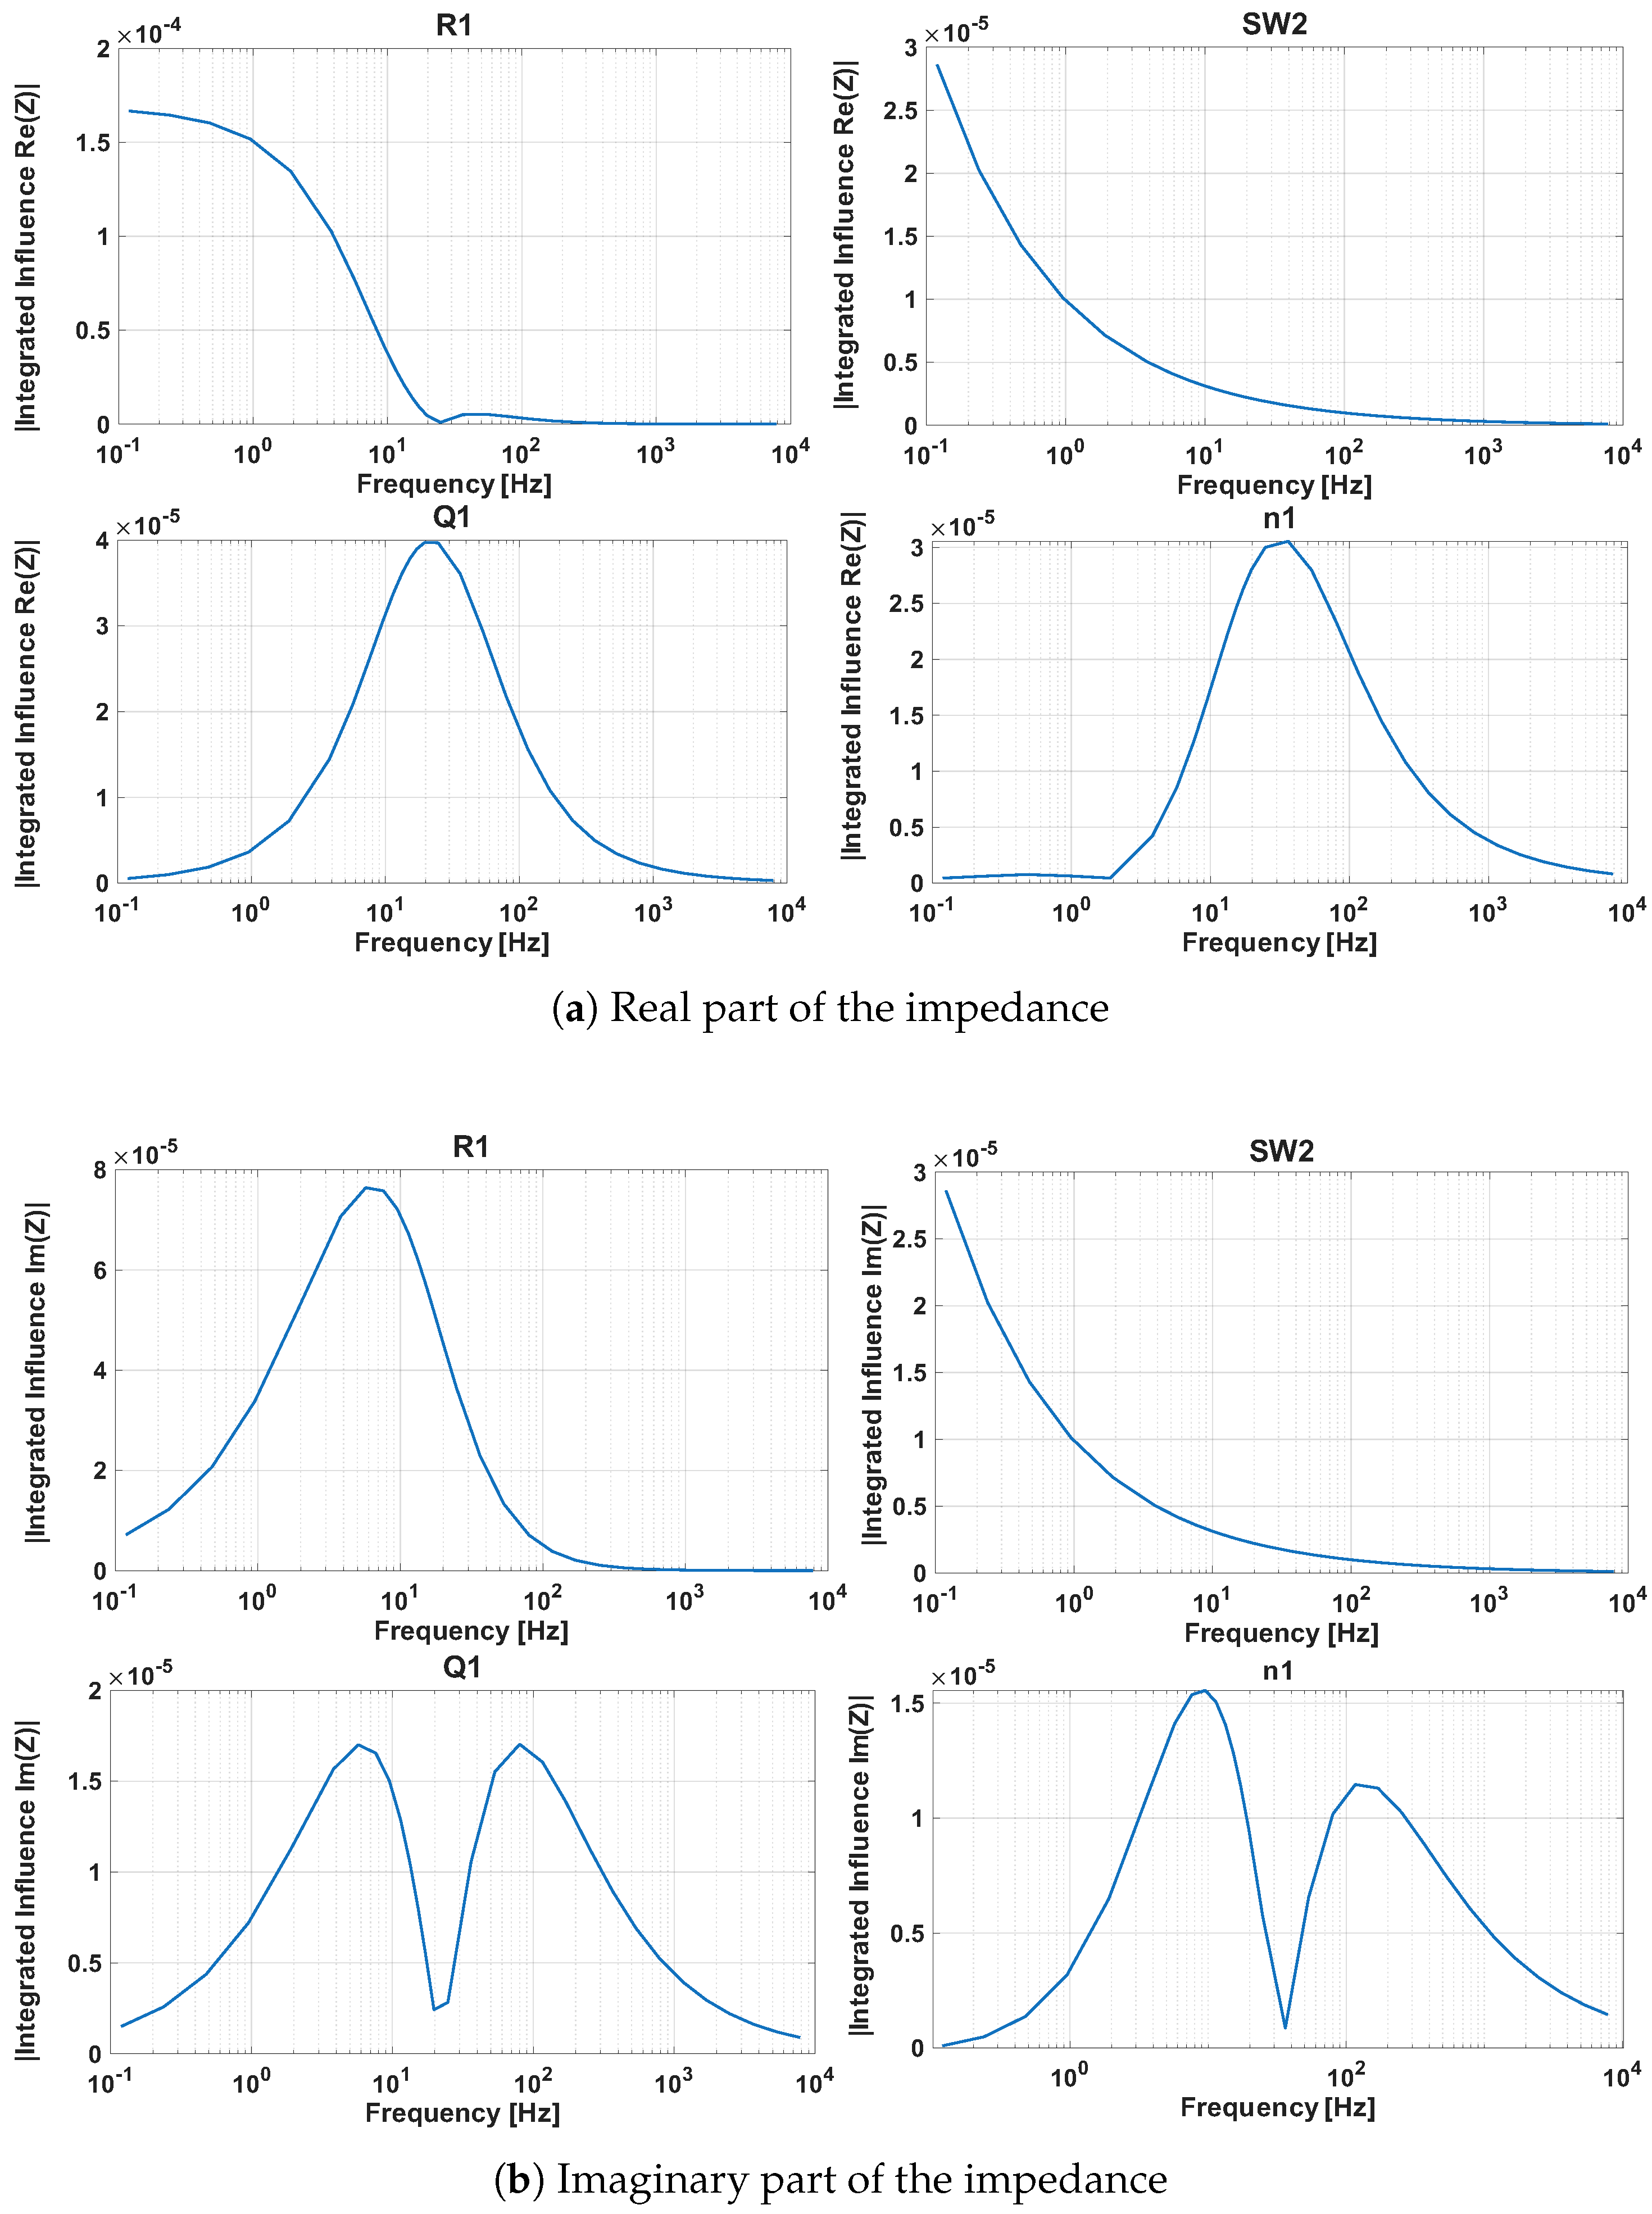
Figure 3a,b show the frequency-dependent integrated influence of each model parameter on the real and imaginary parts of the impedance, respectively. These plots were obtained using the integrated gradients method applied to the equivalent circuit model of the 16s5p battery pack. Each curve corresponds to one of the six fitted parameters: the inductive term
, the ohmic resistance
, the charge-transfer resistance
, the constant-phase element parameters
and
, and the Warburg diffusion element
.
The real component of the impedance is primarily governed by
, which exhibits a constant value of
across the entire frequency range and is the only parameter with a notable impact at high frequencies. The inductive element
shows zero influence on the real part of the EIS over the entire frequency spectrum.
shows no significant effect on the real part of the EIS. In
Figure 3a, at low frequencies,
and
contribute, though their effects overlap, making individual contributions difficult to separate.
and
influence the intermediate frequency range to a lesser extent than
. Overall, the real spectrum is dominated by
across all frequencies and by
at low frequencies.
Figure 3b shows that the imaginary component, related to capacitive and diffusive processes, is unaffected by both the inductive element
and the ohmic resistance
, which present zero influence over the entire frequency range. High-frequency contributions are minimal, keeping the Nyquist spectrum stable along the imaginary axis. From medium frequencies onward,
,
,
, and
simultaneously affect the response, leading to overlapping influences that complicate the separation of individual mechanisms.
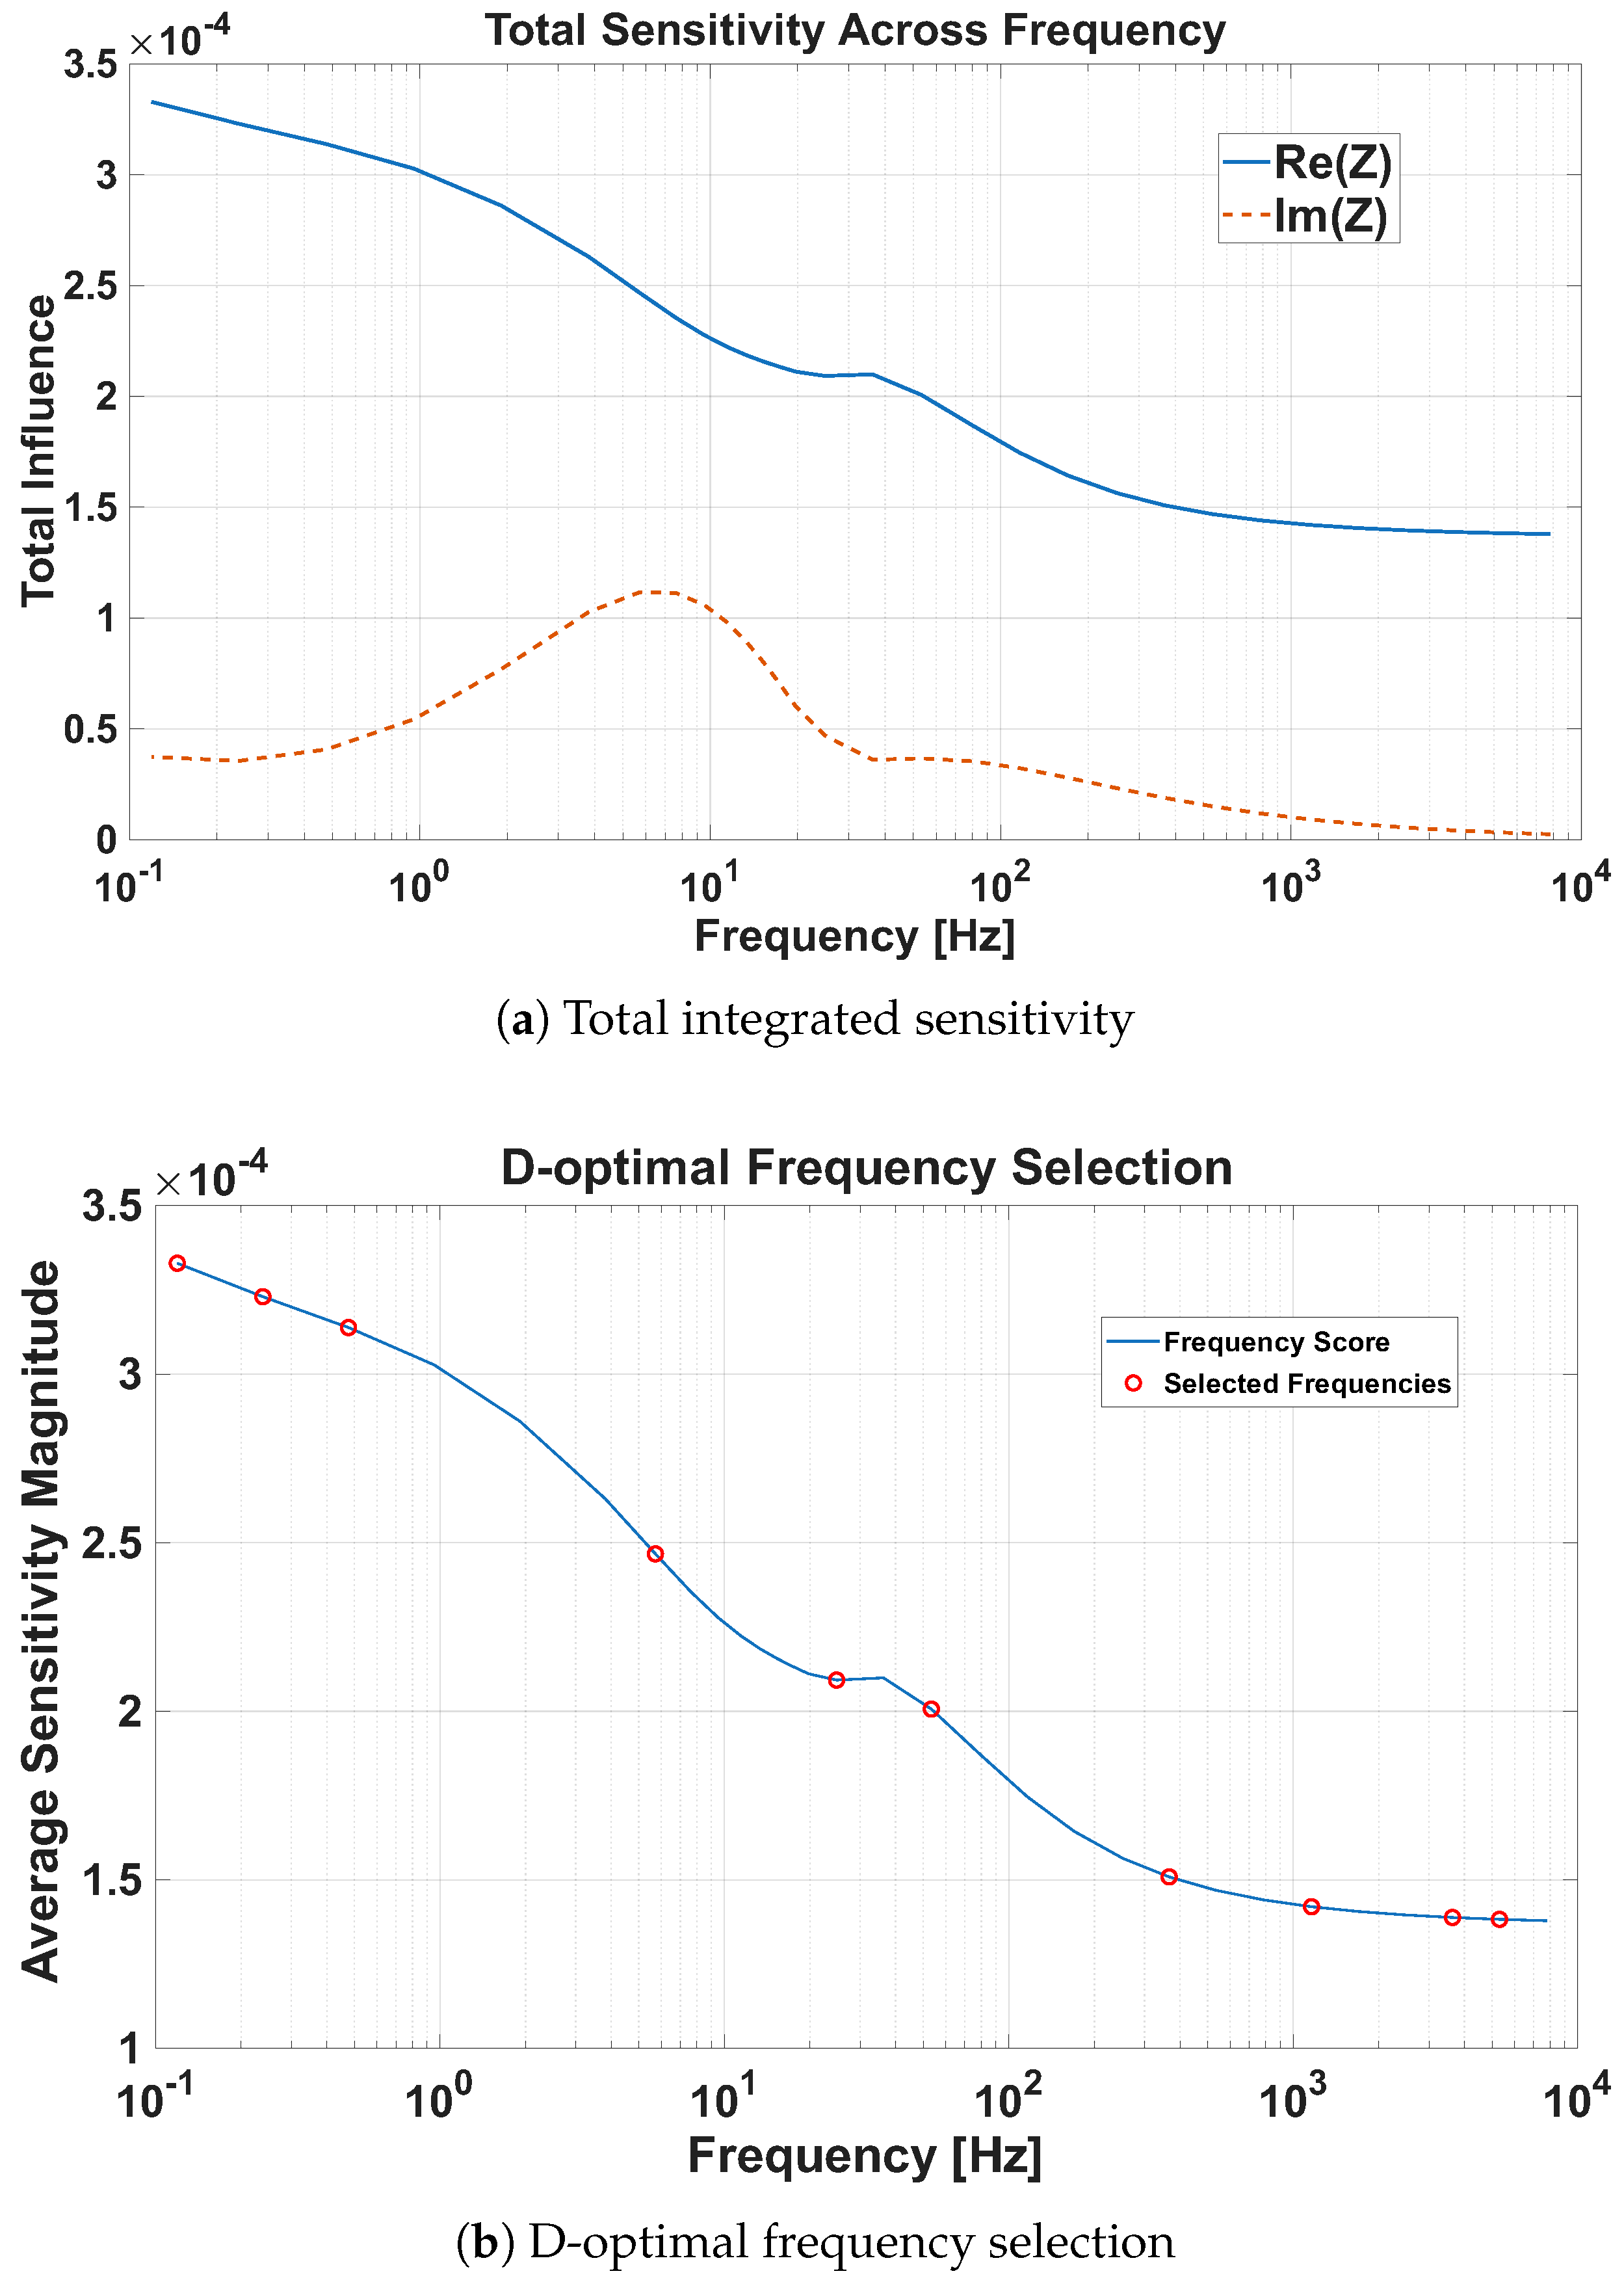
The total parameter sensitivities, shown in
Figure 4a, represent the sum of all parameter influences across the entire frequency range. This analysis provides insight into the frequency regions where changes in the EIS are most informative while minimizing the impact of measurement noise. By comparing the contributions of the real and imaginary components, the imaginary part dominates the overall sensitivity, indicating that variations in this component carry the most information for model calibration. Understanding these regions allows us to identify the frequencies at which the EIS should change to maximize parameter identifiability.
Figure 4b presents the D-optimal frequency selection, where the chosen points maximize the determinant of the Fisher Information Matrix [
40]. Notably, these selected frequencies fall within the regions of highest sensitivity identified in
Figure 4a, particularly where the imaginary component dominates.
Table 3 lists the specific frequencies selected by the D-optimal model.
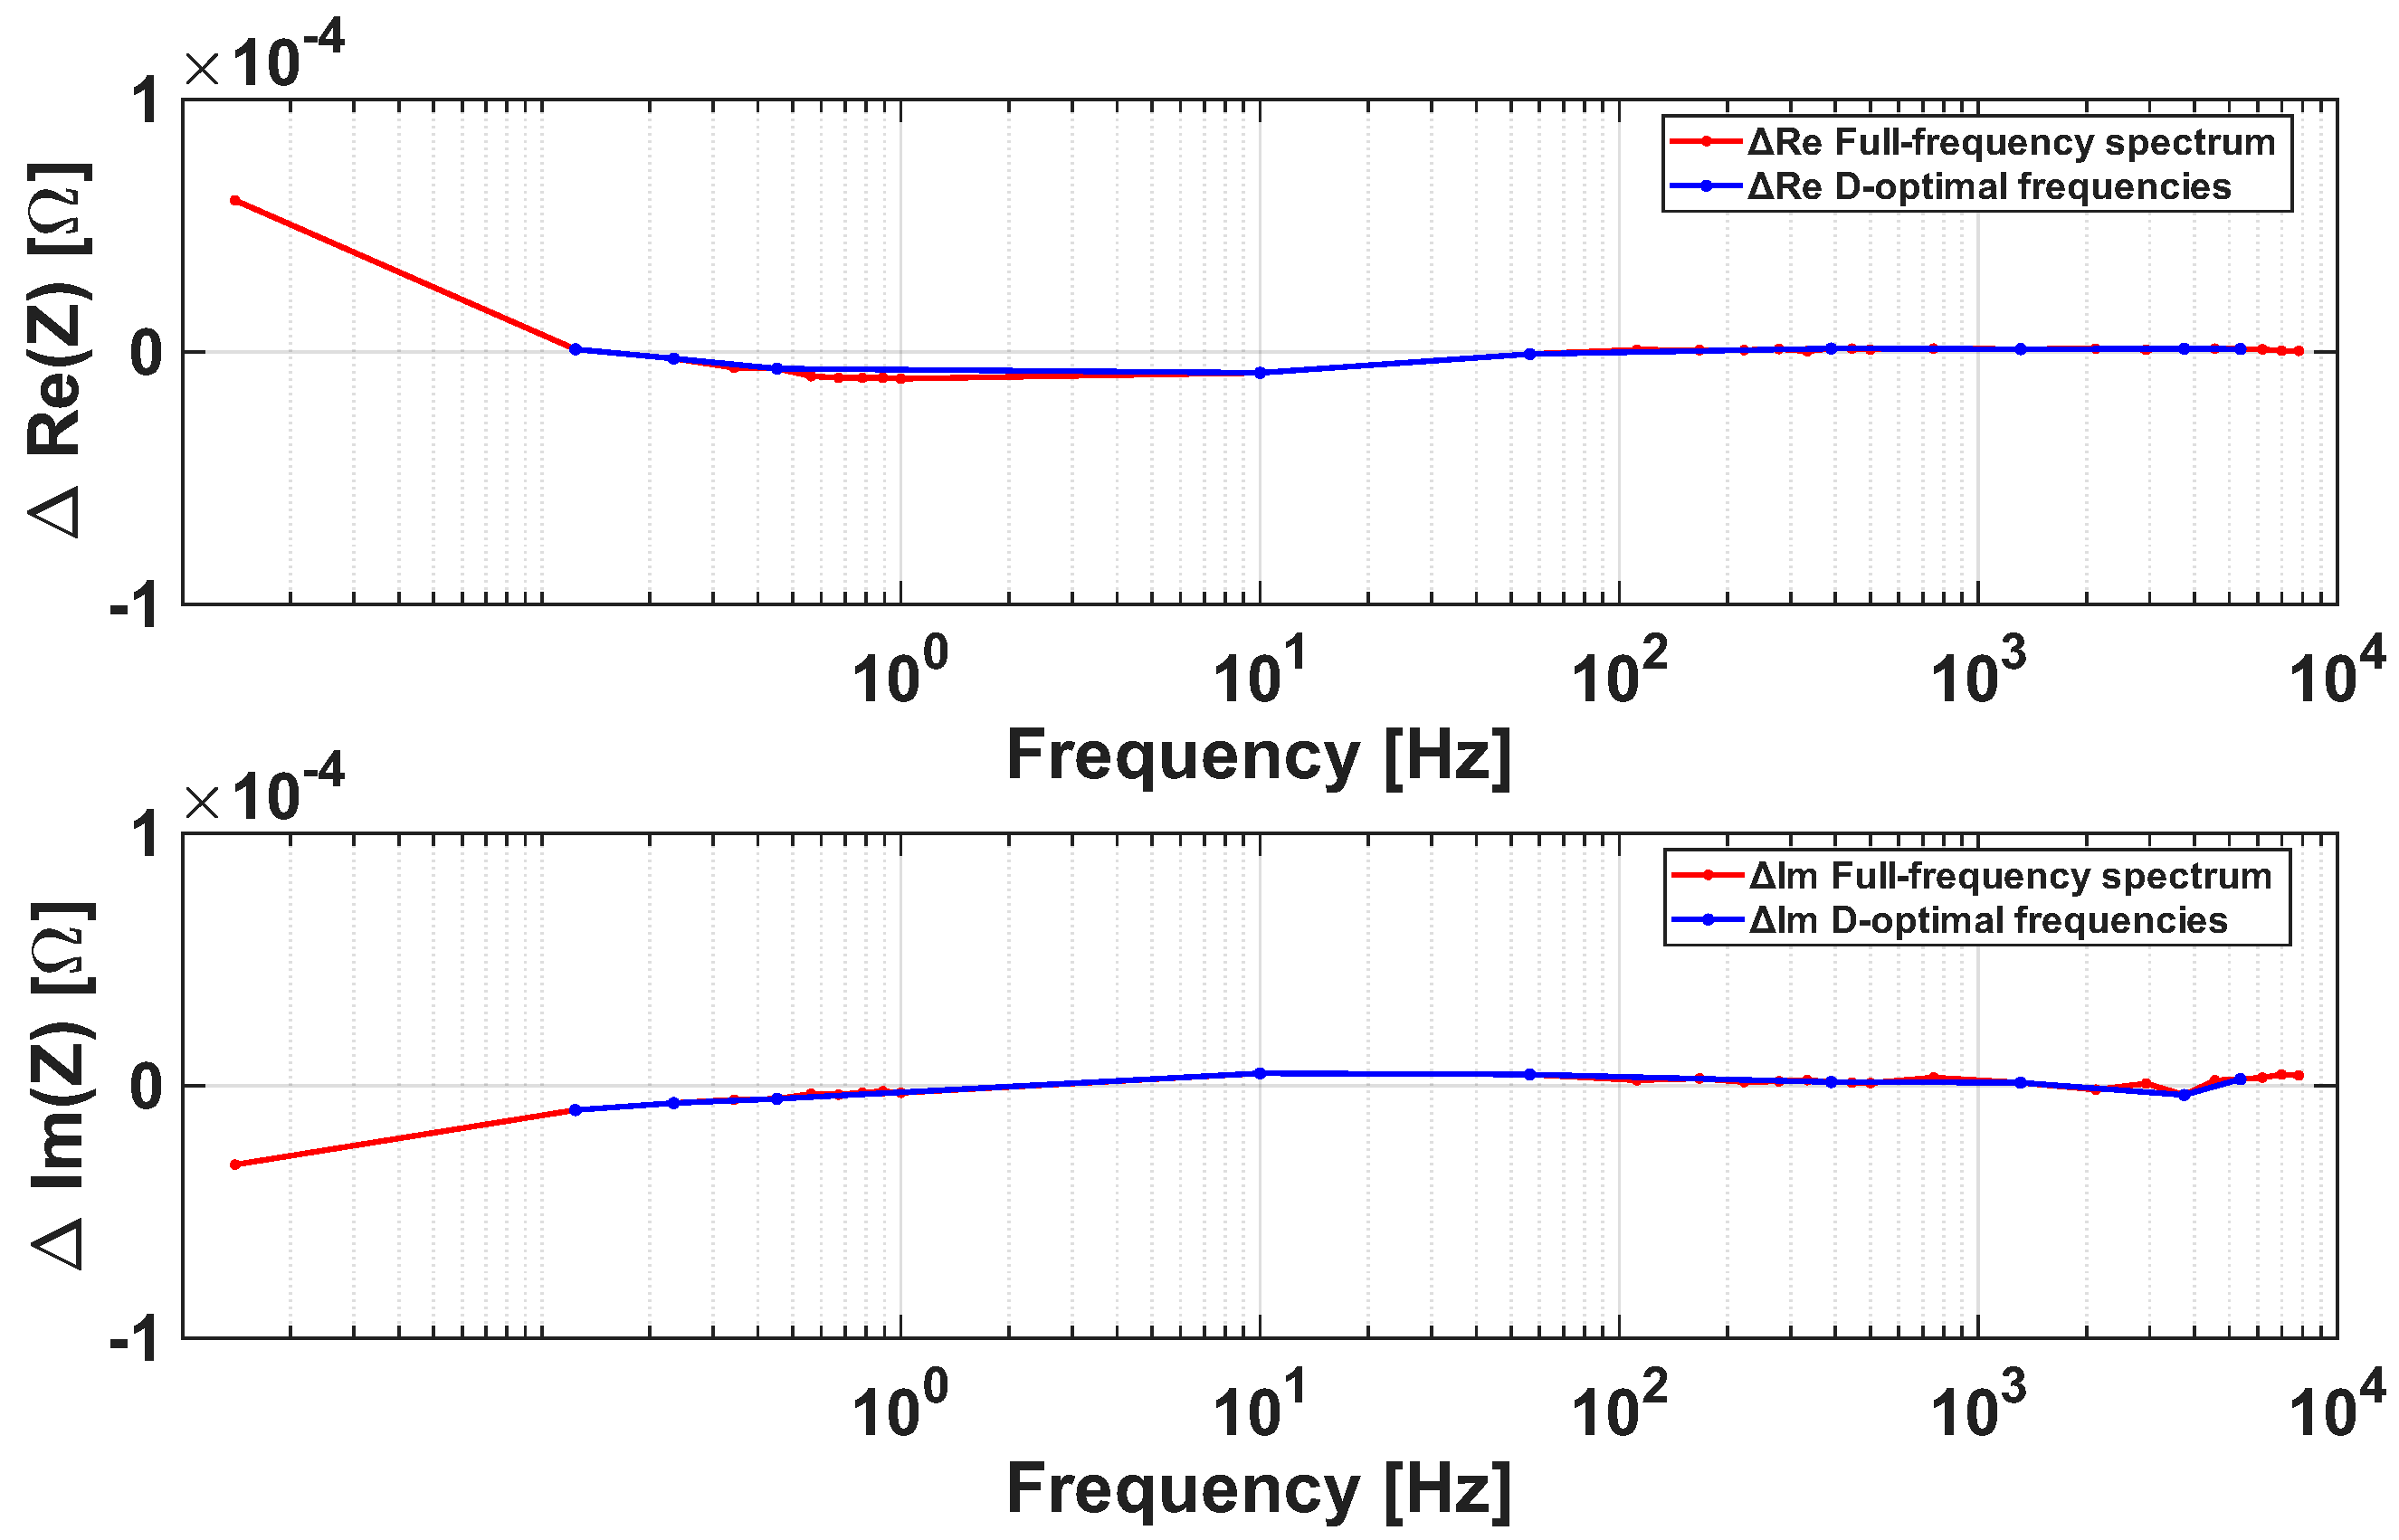
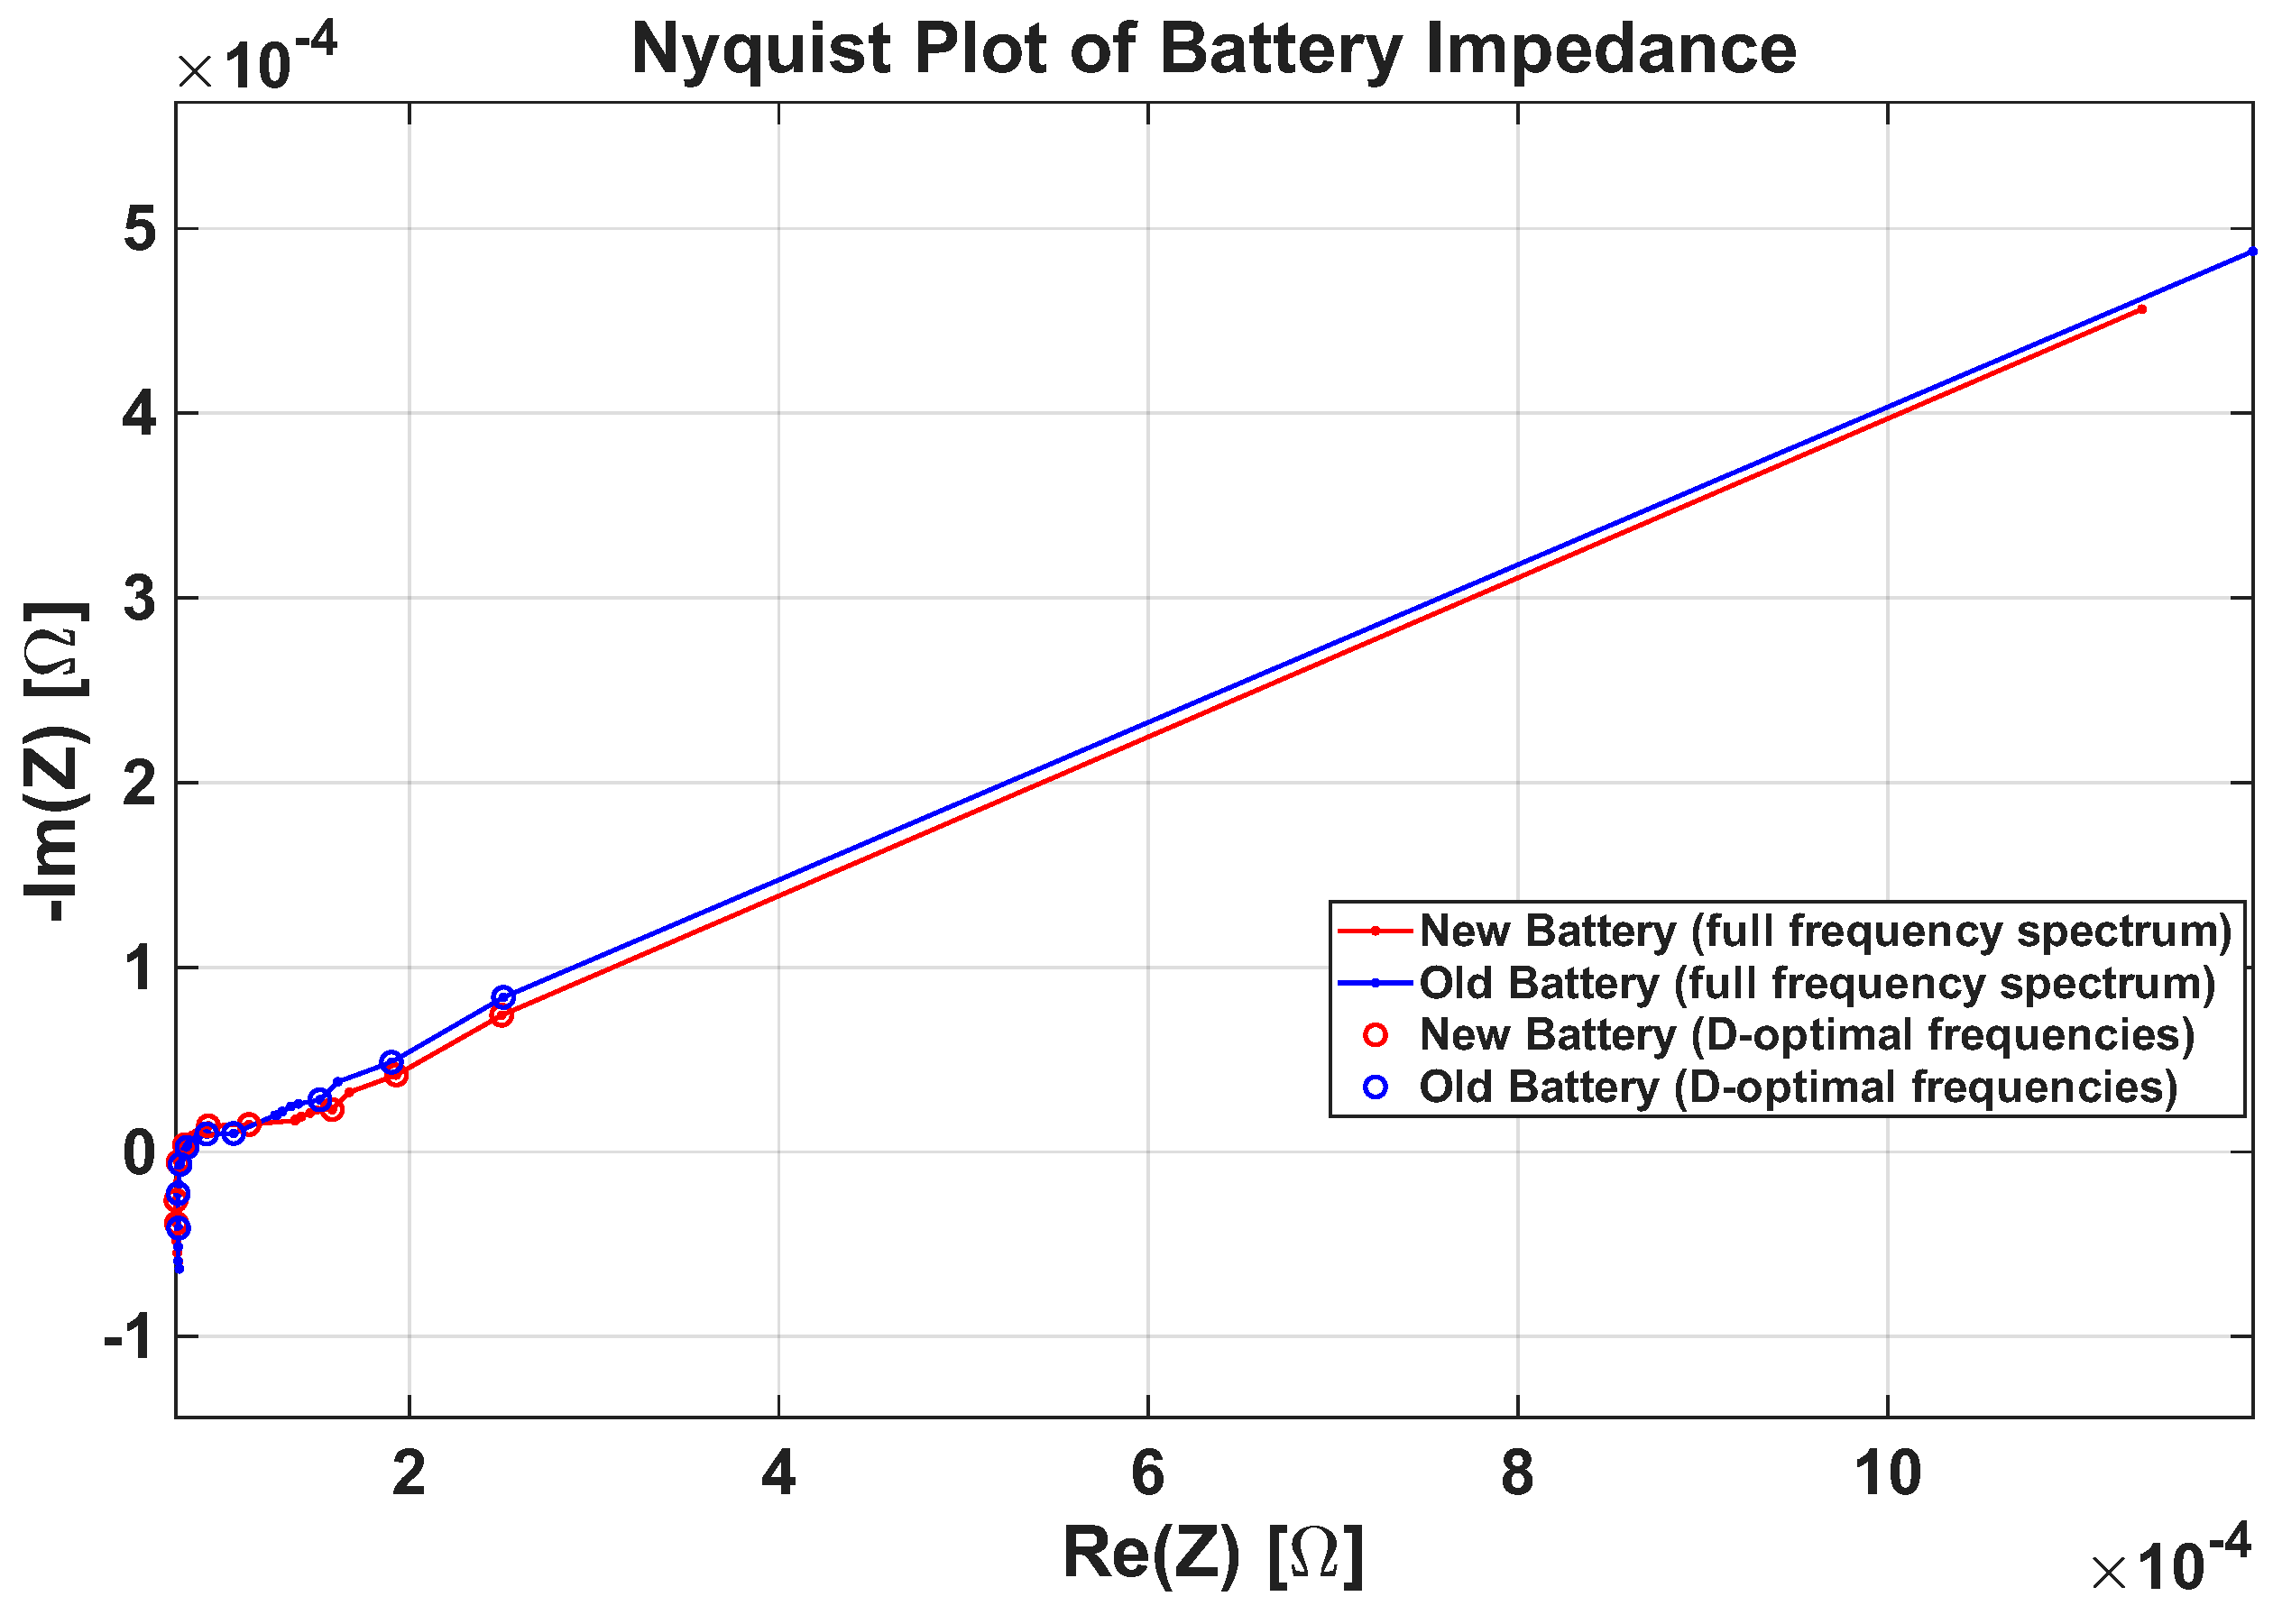
Figure 5 presents a comparison of the measured Nyquist plots for the new and aged battery packs, showing both the full EIS spectrum (solid lines) and the reduced set of D-optimally selected frequencies (markers). The imaginary component exhibits the most pronounced changes at medium-to-low frequencies, reflecting alterations in charge-transfer and diffusion-dominated processes, whereas the real component shows increases across the entire frequency spectrum, with the most substantial changes at low frequencies due to the combined influence of
and
.
Figure 6 further elaborates on these trends by presenting the frequency-resolved contributions of the real and imaginary components separately. This analysis confirms that the increases in both components observed in the Nyquist plots are consistent across frequencies whether one considers the full frequency set or only the D-optimal frequencies. The comparison of equivalent circuit parameters obtained from the full EIS spectrum and the reduced set of D-optimally selected frequencies provides valuable insights into the effect of frequency selection on parameter estimation.
Table 4 presents a comparison of the equivalent circuit parameters obtained from the full EIS spectrum and the reduced set of 10 D-optimally selected frequencies for both new and aged battery packs. All parameters were recalculated using the
fitEISModel procedure introduced at the beginning of this study to ensure consistent fitting across datasets. As observed, the overall trends of parameter variations due to aging are preserved when using the reduced frequency set. The most influential parameters, such as
,
,
, and
, maintain their relative changes and trends, while some parameters with lower sensitivity, such as
and
, show larger relative differences. This demonstrates that the D-optimal frequency selection effectively captures the dominant impedance features of the battery pack while significantly reducing measurement effort.
Finally,
Table 5 quantifies the relative change in each parameter when using only the 10 D-optimal frequencies compared to the full spectrum. This highlights which parameters are more sensitive to frequency selection, confirming that the reduced set provides a reliable estimation of the battery pack’s electrochemical state with a substantial reduction in measurement time.
4. Discussion
The results of this study demonstrate the effectiveness of combining equivalent circuit modeling, integrated gradients-based sensitivity analysis, and D-optimal frequency selection for EIS characterization of battery packs. The integrated influence analysis highlights the distinct informational content of the real and imaginary components of the impedance. While the real part is largely dominated by , limiting separability of overlapping processes, the imaginary part carries the majority of information for parameter identifiability, particularly in the medium-to-low frequency range. This insight explains why the D-optimal frequencies concentrate in regions of high sensitivity and confirms that the Fisher Information Matrix-based selection effectively targets the most informative portions of the spectrum.
It is important to note that this methodology was developed specifically for sensitivity analysis and full ECM parameter identifiability. Consequently, a sufficiently wide frequency range must be selected to capture all parameters, which naturally results in a higher number of D-optimal frequencies than would be required for applications that do not require full model identification. Nevertheless, the sensitivity-informed framework can provide a valuable foundation for correlation-based or data-driven approaches, such as state-of-health estimation or internal temperature inference, where even fewer frequencies may suffice if chosen within the most informative spectral regions, as reported in previous studies.
It is worth noting that the pack-level impedance model in this study assumes identical parameters for all cells and strings. While this simplification is reasonable for methodological development, it represents a limitation when considering realistic packs, where cell-to-cell variability is inevitably present. Variations in individual cell parameters can lead to a dispersion of the Jacobian gradients, reducing the Fisher Information content and potentially decreasing parameter identifiability at the pack level. Consequently, frequencies selected under the assumption of identical cells may not be fully optimal for all cells in practice, as some frequencies that are informative for certain cells may carry less information for others. Nonetheless, this approach provides a valuable baseline for methodological evaluation and demonstrates the fundamental principles of sensitivity-informed D-optimal frequency selection, while highlighting the importance of considering parameter variability in future studies to enhance robustness and applicability in real battery packs. Furthermore, with regard to the practical applications of the latter, the industrial applicability of the methodology could reduce measurement times for battery status diagnosis, which could translate into lower production costs.
Finally, future work will focus on integrating temperature-dependent ECM models to dynamically adapt the D-optimal frequency selection under varying thermal conditions, as well as extending the methodology to other battery chemistries and pack configurations. Since the D-optimal frequencies can vary with cell chemistry, pack topology, and operating temperature, recomputing the Fisher Information Matrix under these new conditions allows the methodology to remain fully applicable across different systems. This will allow a more comprehensive understanding of how temperature and design factors influence the most informative frequency regions and further optimize rapid EIS diagnostics.
5. Conclusions
This study presents a comprehensive methodology for efficient EIS characterization of lithium iron phosphate battery cells and packs, combining ECM fitting, integrated gradients sensitivity analysis, and D-optimal frequency selection. The approach enables a significant reduction in measurement points while preserving the essential information required to capture aging and dynamic electrochemical behavior.
The proposed framework provides a physically consistent, traceable, and rapid method for assessing battery pack performance, facilitating faster and more efficient diagnostics compared to full-spectrum EIS. Importantly, the methodology supports future applications in rapid battery health monitoring, standardization of measurements, and potentially data-driven estimation of state-of-health or internal temperature.
Future developments will focus on incorporating temperature-dependent models and extending the approach to different chemistries and pack configurations. This will further enhance the method’s applicability for real-world battery management systems and rapid, reliable characterization under variable operating conditions.