Article

Thermally Aware Design of Large-Format Batteries Driven by an Equivalent Circuit Network-Based Electro-Thermal Model

1
Beijing Capital International Airport Co., Ltd., Beijing 100621, China
2
National Active Distribution Network Technology Research Center (NANTEC), Beijing Jiaotong University, Beijing 100044, China
3
Key Lab of Vehicular Multi-Energy Drive Systems (VMEDS), Ministry of Education, Beijing Jiaotong University, Beijing 100044, China
4
CNPC Offshore Engineering Company Limited, Beijing 100176, China
5
Department of Mechanical Engineering, Imperial College London, London SW7 2AZ, UK
*
Author to whom correspondence should be addressed.
Batteries 2026, 12(2), 47; https://doi.org/10.3390/batteries12020047
Submission received: 10 December 2025 / Revised: 25 January 2026 / Accepted: 29 January 2026 / Published: 30 January 2026
(This article belongs to the Special Issue Advances in Lithium-Ion Battery Safety and Fire: 2nd Edition)

Abstract

Large-format pouch cells enable higher pack-level energy density and simplified system architecture, yet they pose significant thermal challenges due to long internal conduction paths, pronounced spatial gradients, and limited access to core temperature. This work develops a high-fidelity electro-thermal model for large-format cells based on an equivalent circuit network that mirrors the physical assembly of tabs, welds, and electrode stacks. The model couples three-dimensional ohmic conduction in tabs, welds, and current collectors with node-level equivalent circuit models in the stack, and uses measurement-anchored parameters. The model is used to study thermally critical design factors for a 44 Ah pouch cell, including thermal management configurations, tab width, tab thickness, and tab welding. Simulation results indicate that among four active cooling options, two-sided stack surface cooling achieves the lowest temperatures and the best uniformity, lowering the average temperature by about 11 °C relative to natural convection and reducing the temperature standard deviation to 1.43 °C. It also decreases the core maximum temperature by more than 9 °C, whereas other configurations provide only 4 to 5 °C core reductions. Changes to tab geometry and welding have minor effects except under one-sided tab cooling.

1. Introduction

In recent years, the trend toward higher integration in grid-scale energy storage and vehicle power systems has increasingly emphasized the need for battery cells with higher energy density [1]. From a cell fabrication perspective, there are three primary approaches to achieving high energy density. The first is to increase the compaction density of active materials, incorporating more active content per unit volume [2]. The second is to reduce the proportion of inactive components by using tabless designs, lightweight current collectors, and thinner separators [3]. The third is to enlarge the electrode area or thickness, or to increase the number of stacked layers or wound turns [4], which directly raises the total amount of active material. Although the first two approaches have seen notable progress in recent years, the third approach, by simply increasing the total active material, remains the most straightforward and impactful means of enhancing energy density [5]. Consequently, battery cells are increasingly being designed in larger formats with higher capacities and volumes. Recent developments show that Hithium has introduced its 587 Ah battery cell, featuring physical dimensions of 73.5 × 286 × 216 mm (about 4.54 L), and achieving a volumetric energy density of 415 Wh/L [6]. The use of large-format cells can reduce the number of series and parallel connections required within the battery pack, streamlining the overall system architecture [7]. This also reduces the complexity of system-level state monitoring and energy management, as well as the proportion of non-active structural components such as welds, brackets, and cabling [8]. As a result, it helps reduce system-level costs and enhances energy density without compromising reliability.
However, the adoption of large-format battery cells introduces several critical thermal challenges. First, as cell volume increases, the internal heat conduction path from the core to the casing becomes significantly longer, making it more difficult to dissipate heat efficiently [9]. This can lead to the formation of internal hot spots, posing potential safety risks [10]. Compounding this issue is the difficulty in directly measuring internal temperature, so that battery management systems (BMSs) typically lack access to the cell core temperature, limiting their ability to make informed thermal control decisions [11]. Second, large-format cells exhibit pronounced spatial differences in heat generation and dissipation, which often result in steep internal temperature gradients [12]. These gradients cause non-uniform electrochemical reaction rates and promote localized side reactions, such as lithium plating and gas formation in high-temperature zones, accelerating capacity fade and reducing cell lifespan [13]. Third, the higher thermal mass of large-format cells leads to slower thermal response under dynamic operating conditions [14]. This thermal inertia introduces a lag in cooling system effectiveness, making it challenging to suppress temperature rise promptly during rapid charge–discharge cycles or environmental temperature fluctuations [15]. These issues highlight the necessity of carefully accounting for the adverse thermal effects with large-format cells. This is particularly important during the early design phase, where decisions on cell geometry, structural configuration and thermal management can significantly influence heat generation, dissipation, and overall thermal stability [16]. Addressing thermal effects at the design phase helps prevent the onset of non-uniform temperature distribution, localized hot spots and degradation, as well as safety hazards during real-world operation [17].
To investigate the complex thermal behavior of large-format cells, cell thermal modeling has become an indispensable tool. Nieto et al. [18] developed a lumped-parameter thermal model for a large-format 10.5 Ah Li-ion pouch cell by deriving heat generation from experimental measurements of internal resistance and the entropic heat coefficient. They assessed the model’s predictive accuracy, reporting a maximum error of 21% at moderate rates and improving to 15% at high discharge currents. Hosseinzadeh et al. [19] proposed a COMSOL-MATLAB (v2016) co-simulation framework that integrates a one-dimensional electrochemical-thermal model of a 53 Ah NMC-graphite pouch cell along with an electrical circuit model of a battery system, aiming to investigate the current and thermal imbalance among parallel-connected large-format cells. Simulation results reveal that cells positioned closer to the battery system terminals are subjected to significantly higher current and temperature rise, especially at elevated load currents and interconnect resistance values, which in turn leads to state-of-charge (SOC) divergence, accelerated aging, and increased thermal safety risks. The study also demonstrates that even mild asymmetries in interconnect resistance or localized cooling can substantially affect current distribution and energy utilization. Hou et al. [20] developed an electrochemical-thermal model for large-format Li-ion cells by integrating the Maxwell–Cattaneo–Vernotte theory to account for lithium-ion transport inertia and the Marcus–Hush–Chidsey kinetics to model interfacial electron transfer. The model treats a large-format cell as multiple electrochemical model units connected in parallel, capturing non-uniformities from materials and manufacturing. Experimental validation shows that the temperature simulation error is within 3.9 °C during 2.0C discharge on a 155 Ah prismatic NCM523/graphite cell. The model revealed highly non-uniform internal current distributions, including local current reversals, due to spatial gradients in temperature and concentration.
Building on these cell modeling tools, research on large-format cell design has been conducted, mostly focusing on the design of tabs and current collectors. Wu et al. [21] developed a thermo-electrical model for large-format Li-ion pouch cells, combining a 2D electrical sub-model and a 3D thermal sub-model with parameters derived from carefully designed experiments. Sensitivity analysis showed that specific heat capacity most influences peak temperature, while in-plane thermal conductivity dominates temperature variation. Crucially, the study found that temperature non-uniformity is primarily caused by heat flux from the tabs, not internal heat generation gradients. Samba et al. [22] conducted a fully coupled three-dimensional electrochemical-thermal finite element simulation to investigate the impact of tab location on the performance of large-format LiFePO4 pouch cells under high discharge rates. The study compared multiple pouch cell designs with varying tab positions. Results demonstrated that symmetrical tab configurations minimized ohmic heating and enabled more uniform current, potential, and temperature distributions. Increasing tab width further improved uniformity and enhanced cell performance, suggesting a promising design pathway for improving battery longevity and thermal management efficiency at the pack level. Zhao et al. [23] employed a fully three-dimensional electrochemical-thermal model to investigate the impact of tab design on the performance of large-format Li-ion cells with spirally wound structures. The study reveals that non-uniform current density and ohmic losses in long current collectors significantly reduce active material utilization and usable energy density compared to coin cells. By introducing multiple evenly distributed tabs, the model demonstrates a substantial improvement in current uniformity and energy density, with diminishing returns beyond a certain number of tabs. The results underscore that cell design, particularly tab configuration, can unlock 50% performance gains without altering battery materials. Rieger et al. [24] developed a multi-dimensional electrochemical-thermal-mechanical model to investigate how tab alignment affects local temperature, displacement, and mechanical stress distributions in large-format Li-ion pouch cells during discharge. Two cell designs, a regular design with side-by-side tabs and a counter-tab design with opposing tabs, were compared. The study found that while displacement variations were minor due to opposing effects of thermal expansion and intercalation-induced swelling, significant stress gradients emerged in the positive electrode, especially under high C-rates and in the regular design. These stress inhomogeneities, driven by current density gradients, may accelerate localized aging in large-format pouch cells. Kosch et al. [25] developed a two-dimensional electro-thermal polarization model to study the influence of current collector geometry, specifically tab size, tab positioning, and collector thickness, on the temperature and depth-of-discharge (DOD) distribution in large-format 40 Ah Li-ion pouch cells under high-rate (4C) discharge. Simulation results revealed that reducing current collector thickness moderately increases temperature and DOD imbalance, but increasing tab size can mitigate this effect. Cells with tabs placed on opposite sides exhibited significantly more uniform thermal and electrochemical behavior than same-side tab designs. The study concluded that optimizing current collector geometry, especially through thinner collectors and larger tabs, can enhance energy density by up to 10% with only moderate thermal or DOD penalties. Lee et al. [26] used a three-dimensional electrochemical-thermal model to optimize tab attachment positions, tab types, and cell aspect ratios in 45 Ah LiFePO4 large-format pouch cells. The objective was to minimize the internal temperature difference (ΔT), and was optimized using sequential quadratic programming under the constraint of constant cell area. The optimized design with center-attached counter tabs and an aspect ratio of 2.0 reduced ΔT by 77.2% and lowered capacity fade by 7.3% after 1000 cycles. This study demonstrated that cell design optimization significantly enhances thermal uniformity and extends battery life.
While previous studies have provided significant insights, several important challenges in the thermal-informed design of large-format cells remain unsolved. First, existing battery thermal models are typically based either on simplified equivalent circuits with lumped parameters or on complex electrochemical representations with finite elements. The former lacks spatial resolution, leading to poor accuracy. The latter, although physically detailed, often embeds electrochemical mechanisms that are largely irrelevant to practical cell design and manufacturing, where considerations such as electrode architecture, current collector layout, separator configuration, and assembly geometry are of far greater importance [27]. This underscores the need for accurate, design-oriented models capable of bridging thermal behavior with practical cell design. Second, existing cell design studies have primarily focused on geometrical parameters such as tab size and current collector dimensions. However, they have largely overlooked the thermally critical yet modeling-challenging factors, such as tab welding and cell cooling configurations, which play a decisive role in shaping cell internal temperatures. As a result, existing studies have confined themselves to tractable design variables, without offering systematic cell design guidelines that reflect the complexities of real-world cell assemblies.
To address the aforementioned limitations, this work establishes an electro-thermal coupled modeling framework for large-format pouch cells and leverages it to investigate key cell design factors. The main academic contributions are as follows:
(1)
This work proposes a high-fidelity model that is tightly aligned with the physical assembly of large-format pouch cells. The model is an extension based on the authors’ previously developed distributed electro-thermal model, PyECN v1.0 (Python 7.9 based equivalent circuit network) [28,29], and it exhibits two key advantages over existing modeling approaches. First, it achieves exceptional thermal simulation accuracy across a wide range of current rates, with temperature errors below 0.9 °C at any location, including the electrode stack and tabs, during 1C to 5C discharges in a 219 × 70 × 4 mm pouch cell. Second, the model is structurally grounded, being directly parameterized from the geometric dimensions and material properties of key cell components, including electrodes, separators, current collectors, tabs, and welds. This structural fidelity ensures that the modeling process mirrors the actual manufacturing workflow, thereby providing qualitative guidance for cell design and engineering.
(2)
This work investigates thermally critical design factors that are often overlooked due to modeling complexity in large-format pouch cells. First, the thermal management configurations commonly adopted in practical engineering are investigated, including natural convection, one- or two-sided tab cooling, and one- or two-sided stack-surface cooling. This study finds that different thermal management configurations lead to substantial cooling performance differences in large-format pouch cells, reflected in distinct trends of average temperature, maximum temperature, and temperature uniformity. Second, building upon the thermal management configurations, this work further incorporates their coupling effects into the analysis of tab geometry (tab width and thickness) and tab welding methods (one-point and three-point welding). Since tabs serve as a key thermal conduction pathway linking internal layers to the external cooling environment, variations in their geometry and welding patterns are shown to influence the temperature distribution. This study captures the coupled interactions between tab design and cooling configuration, a key aspect that has been largely overlooked in existing literature.
In addition to the academic contributions, the engineering value of the present modeling framework is the ability to combine existing cell data with new structural design to infer the thermal behavior of sketched new cells that employ the same material system but updated structures, as reflected in the following two aspects:
(1)
Cell manufacturers may already have mature small-capacity pouch cells and intend to upscale them to large-capacity ones. In such cases, the material system generally remains unchanged, while capacity enlargement is achieved by increasing the number of stacked layers or enlarging the electrode dimensions. The feasible target capacity typically spans a wide design space with multiple candidates. However, manufacturing and experimentally testing a large number of prototypes for each candidate design would be extremely costly and time-consuming. Therefore, a modeling tool that can utilize the existing experimental data to rapidly predict the thermal performance of different upscaled designs in a virtual environment is highly wanted. The proposed framework is developed exactly for this purpose.
(2)
In other cases, the primary structure of the large-format cells may already be fixed, and the design question becomes whether improving the tab geometry or modifying the welding configuration is worthwhile for enhancing thermal performance. Since it is difficult to systematically isolate and then evaluate these factors, a model that can quantitatively assess the thermal impact of different tab geometries and welding strategies while keeping the material system and main cell structure unchanged is highly desirable. The proposed framework also serves this purpose.
The remaining paper is organized as follows. Section 2 presents a high-fidelity modeling approach based on an equivalent circuit network (ECN) that closely reflects the physical cell assembly. Section 3 describes the experimental procedures, including both model parameterization and validation. Section 4 details the simulation setup for evaluating thermally critical design factors using the proposed model. Section 5 presents the simulation results and analyzes key observations. Section 6 concludes the paper.

2. Modeling Methodology for Large-Format Pouch Cells

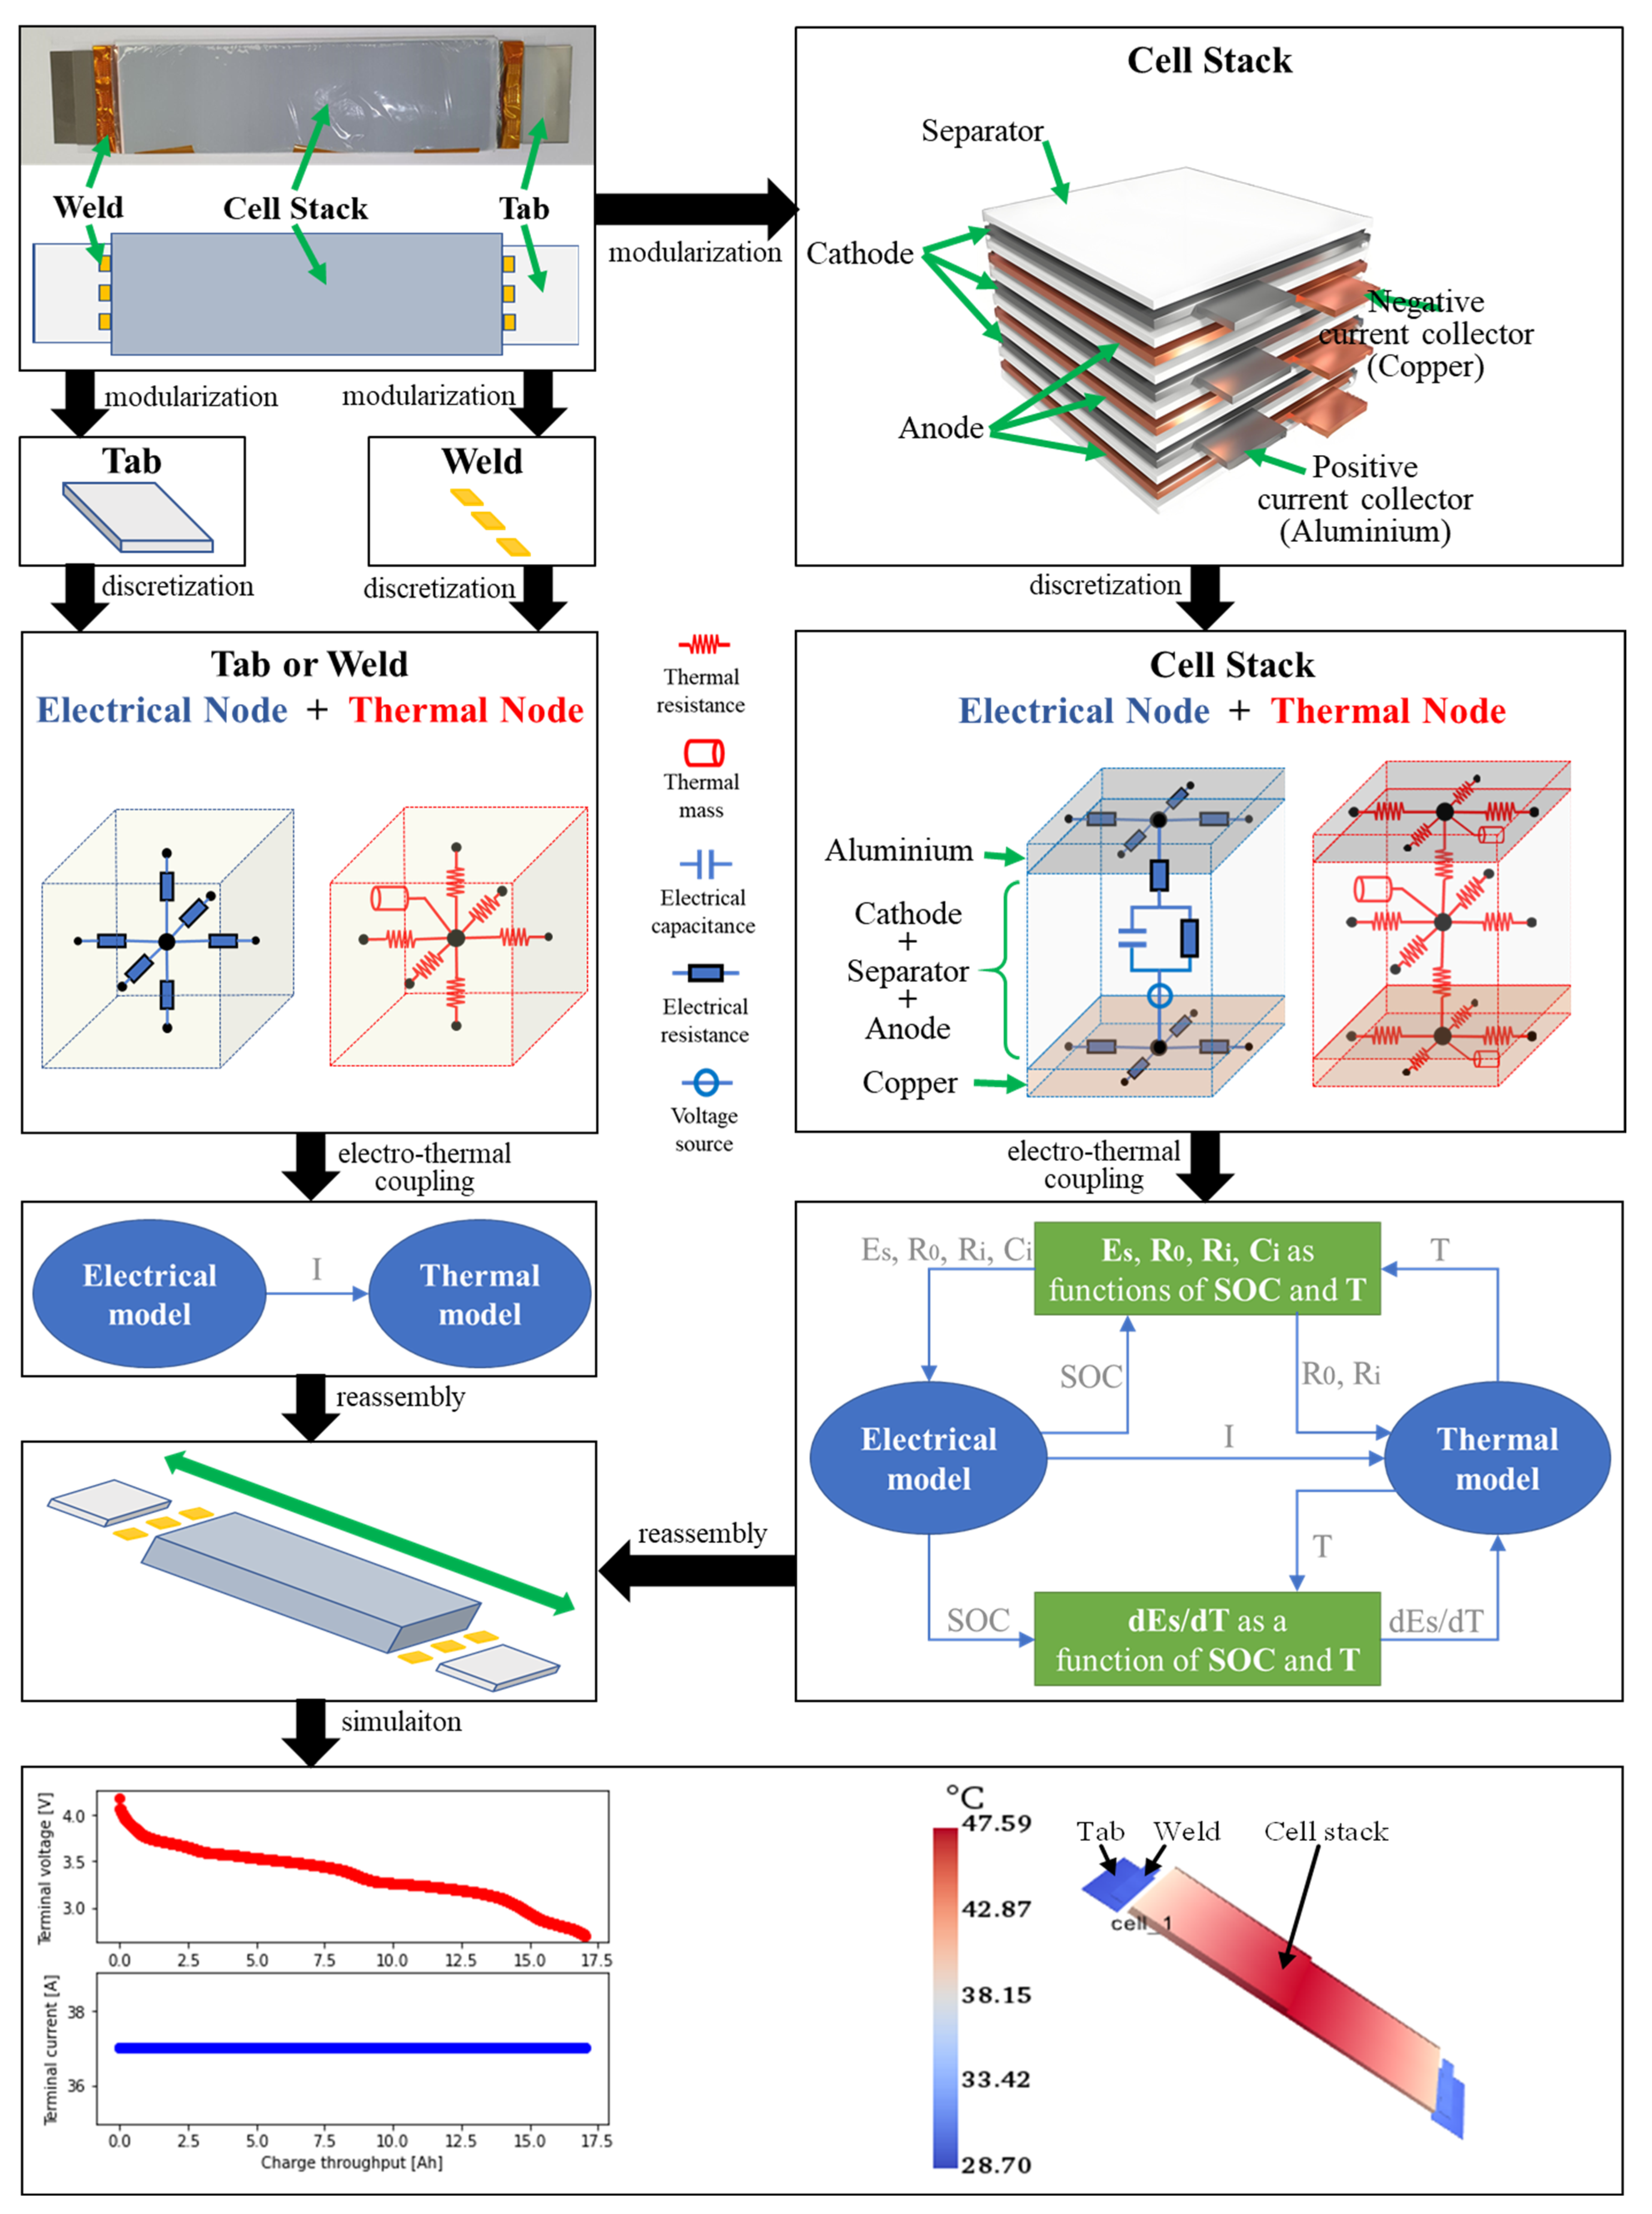
Using a counter-tab pouch cell (in which the positive and negative tabs are located on opposite edges of the cell) as an example, the modeling methodology is illustrated in Figure 1. The model is assumed in a spatially normalized manner, where electrical and thermal parameters are defined on a per-unit-length, per-unit-area, or per-unit-volume basis. Under this formulation, capacity upscaling is achieved through geometric expansion of the electrode dimensions or an increased number of stacked layers, while preserving the same material system and normalized electrical and thermal properties. It should be noted, however, that the present formulation does not account for potential changes in material properties, manufacturing-induced variations, or defect-related effects that may emerge during large-format cell fabrication.
In general, the procedure comprises of the steps shown in Section 2.1, Section 2.2, Section 2.3, Section 2.4, Section 2.5 and Section 2.6.

2.1. Modularization

The pouch cell is represented as consisting of three modules: the tab, the weld, and the stack. The stack is constructed from multiple layers of electrodes (cathode and anode), separators, and current collectors (aluminum and copper), arranged in an alternating sequence.

2.2. Discretization

Each of the tabs and welds consists of a single material (aluminum or copper) and can therefore be meshed into three-dimensional nodes with uniform physical properties. To enable electro-thermal coupling, each tab or weld node is further defined to possess both an electrical node and a thermal node. Compared to the discretization of tab or weld, the discretization of the cell stack is subject to greater constraints because it consists of multiple layers of materials with differing physical properties. In this study, the smallest indivisible stack node is defined as comprising two adjacent current collector layers (one aluminum layer and one copper layer) as well as the cathode layer, the anode layer, and the separator layer positioned between the adjacent current collector layers. Each stack node is treated as a functional micro-cell, allowing its electrical node to be represented by a complete equivalent circuit model (ECM). In addition to the electrical node, each stack node also contains a thermal node.

2.3. Electrical Node Modeling

For electrical nodes in the tabs and welds, the ohmic potential drop caused by the finite electrical conductivity of the material is considered. The governing equations for these electrical nodes are given by Equations (1) or Equation (2), where σTab and σWeld denote the electrical conductivity of the tab and weld material, ϕTab and ϕWeld represent the local electric potential within the tab and weld nodes, and x, y, and z are the spatial coordinates along the length, width, and thickness directions, respectively. The operator ∇ is the vector differential (gradient) operator.
σ T a b ϕ T a b = σ 2 ϕ T a b x 2 + 2 ϕ T a b y 2 + 2 ϕ T a b z 2 = 0
σ W e l d ϕ W e l d = σ 2 ϕ W e l d x 2 + 2 ϕ W e l d y 2 + 2 ϕ W e l d z 2 = 0
For the electrical nodes in the stack, the governing equation consists of two parts. The first part represents the ohmic potential drop in the current collector, as given by Equation (3), where σCC and ϕCC represent the electrical conductivity and the local electric potential within the current collector. The second part accounts for the potential variation described by the ECM formed by the cathode, anode, and separator. Although the ECM shown in Figure 1 is a first-order RC model, in a generalized form it can be extended to any n-order RC model, in which case the terminal voltage of the ECM is given by Equation (4), where, ϕECM denotes the terminal voltage of the ECM, Es is the open-circuit voltage (OCV) of the ECM, Ri and Ii represent the resistance and corresponding branch current of the i-th RC element, R0 is the ohmic resistance of the ECM, and I is the total current flowing through the ECM. In addition, the SOC of the ECM node can be expressed in differential form by Equation (5), where t denotes the time (s), and QECM denotes the capacity of the ECM (A·s).
σ C C ϕ C C = σ 2 ϕ C C x 2 + 2 ϕ C C y 2 + 2 ϕ C C z 2 = 0
ϕ E C M   =   E s     i = 1 n R i   I i   R 0   I
d   S O C d   t = I Q E C M

2.4. Thermal Node Modeling

For any of the tab, weld, and stack nodes, its node temperature is described by the three-dimensional transient anisotropic heat conduction equation given in Equation (6), where T (K) is the temperature, ρ (kg/m3) is the density, and c (J/kg/K) is the specific heat capacity. λx, λy, λz (W/m/K) are the thermal conductivities in the x-, y-, and z-directions, respectively. The term qgen (W/m3) denotes the volumetric heat generation rate from internal sources, while qdis (W/m3) represents the volumetric heat dissipation rate determined by the applied thermal boundary conditions, such as convection or conduction.
ρ c T t = λ x   2 T x 2 + λ y   2 T y 2 + λ z   2 T z 2 + q g e n q d i s
For the tab and weld nodes, qgen accounts for the ohmic heat, which is calculated using Equation (7), where Ix, Iy, and Iz are the currents flowing along the x-, y-, and z-directions of the node. Rx, Ry, and Rz are the corresponding electrical resistances of these directions. V e is the volume of the node. For the stack nodes, qgen consists of two parts. The first part is the ohmic heat in the current collector, which can be calculated using Equation (7). The second part is the heat generation of the ECM formed by the cathode, anode, and separator, which is calculated using Equation (8), where dEs/dT is the entropic coefficient, which accounts for the reversible entropic heat. V e E C M is the volume of the ECM node.
q g e n T a b     o r   q g e n W e l d   o r   q g e n C C =   I x 2 R x + I y 2 R y + I z 2 R z / V e
q g e n E C M   = i = 1 n I i 2 R i   +   I 2 R 0   +   I   T   d E s d T /   V e E C M
The calculation of qdis depends on the applied thermal boundary conditions. For any node in the tabs, welds, or the stack, if none of the six faces of the node is in direct contact with a thermal boundary condition, such as air or a cold plate, then qdis = 0. If any face of the node is subject to a convection or conduction condition, qdis is calculated using Equation (9), where h (W/m2/K) is the equivalent heat transfer coefficient, which may represent convection, conduction, or combined heat transfer mechanisms. Δn (m) is the characteristic thickness in the heat transfer direction. Tref (K) is the ambient or reference temperature.
q d i s   = 0   ,   no   thermal   boundary   applied h Δ   n   T T r e f   ,   thermal   boundary   applied

2.5. Electro-Thermal Coupling

As illustrated in Figure 1, the electro-thermal coupling for the tab and weld nodes is relatively straightforward, involving only a one-way coupling from the electrical model to the thermal model, where the output current from the electrical model is used in the thermal model to calculate heat generation. For stack nodes, the electro-thermal coupling is considered separately for the current collector and the ECM. The coupling for the current collector is analogous to that of the tab or weld nodes, where only the output current from the electrical model is provided to the thermal model. By contrast, the coupling for the ECM is more complex. As shown in Figure 1, the parameters Es, R0, Ri, Ci, and dEs/dT are functions of SOC and T, while SOC and T are solved by the electrical and thermal models, respectively, creating a bidirectional coupling and iterative relationship between the electrical and thermal models.

2.6. Reassembly and Simulation

The distributed nodes are reassembled into tab, weld, and stack modules, which are then interconnected to form the complete cell model for simulation. For the tab or weld nodes, the reassembly of the electrical nodes involves connecting the resistances between adjacent nodes in three-dimensional space, whereas the reassembly of the thermal nodes involves connecting the corresponding thermal resistances. For stack nodes, the thermal node reassembly also involves connecting the thermal resistances between adjacent nodes in three-dimensional space. However, the reassembly of electrical nodes is more complex and depends on the layer in which the node resides. Adjacent nodes within the same layer are connected in series to form a complete layer, and the layers are then connected in parallel to construct the entire cell stack. In this approach, a large number of ECM nodes are interconnected through series and parallel connections to form the corresponding ECN. After forming the tab, weld, and stack modules, the tab and the stack modules are connected both electrically and thermally via the weld modules, rather than being directly joined. Once assembled and parametrized, the complete model enables fully coupled electro-thermal simulations of the entire cell. Under the assumption that the material system and manufacturing process remain unchanged, cell capacity upscaling can be achieved through geometric expansion of electrode dimensions and/or an increased number of stacked layers. This formulation preserves local electro-thermal behavior at the node level, while global behavior emerges from the scaled geometry.

3. Experiments for Model Parametrization and Validation

The experiments fall into two categories. The first category is parametrization tests for obtaining model parameter values, which include electrical parametrization and thermal parametrization. The second category is validation tests for comparing model simulation with actual test results, which include electrical validation and thermal validation.

3.1. Electrical and Thermal Parametrization Tests

Based on Equations (1)–(5), the electrical parameters of the model primarily comprise the electrical conductivity of the constituent materials, the capacity (QECM) and circuit parameters (Es, R0, Ri, Ci) of the ECM nodes. Among these, electrical conductivity is an intrinsic material property that can be obtained from cell specifications or relevant literature. In contrast, the ECM node capacity and circuit parameters must be experimentally determined. This involves first measuring the capacity and circuit parameters at the cell level, then proportionally distributing cell-level values to each ECM node according to its volume and series–parallel configuration. The cell-level capacity can be directly measured from a battery cycler device, whereas the cell-level circuit parameters can be derived by following the Galvanostatic Intermittent Titration Technique (GITT) testing protocol [30], combined with the parameter extraction method proposed in the authors’ previous work [31].
Based on Equations (6)–(9), the thermal parameters of the model primarily include the density, specific heat capacity, and thermal conductivity of the constituent materials, the entropic coefficient of the ECM nodes (dEs/dT), and the equivalent heat transfer coefficient (h) under specified thermal boundary conditions. The first three parameters are intrinsic material properties and can be obtained from the cell specifications or literature. The cell-level dEs/dT and h can be experimentally determined following the procedures described in ref. [32] and ref. [33], respectively. These cell-level values are then directly assigned to each ECM node, as the node-level dEs/dT and h are assumed to be identical to those at the cell level.
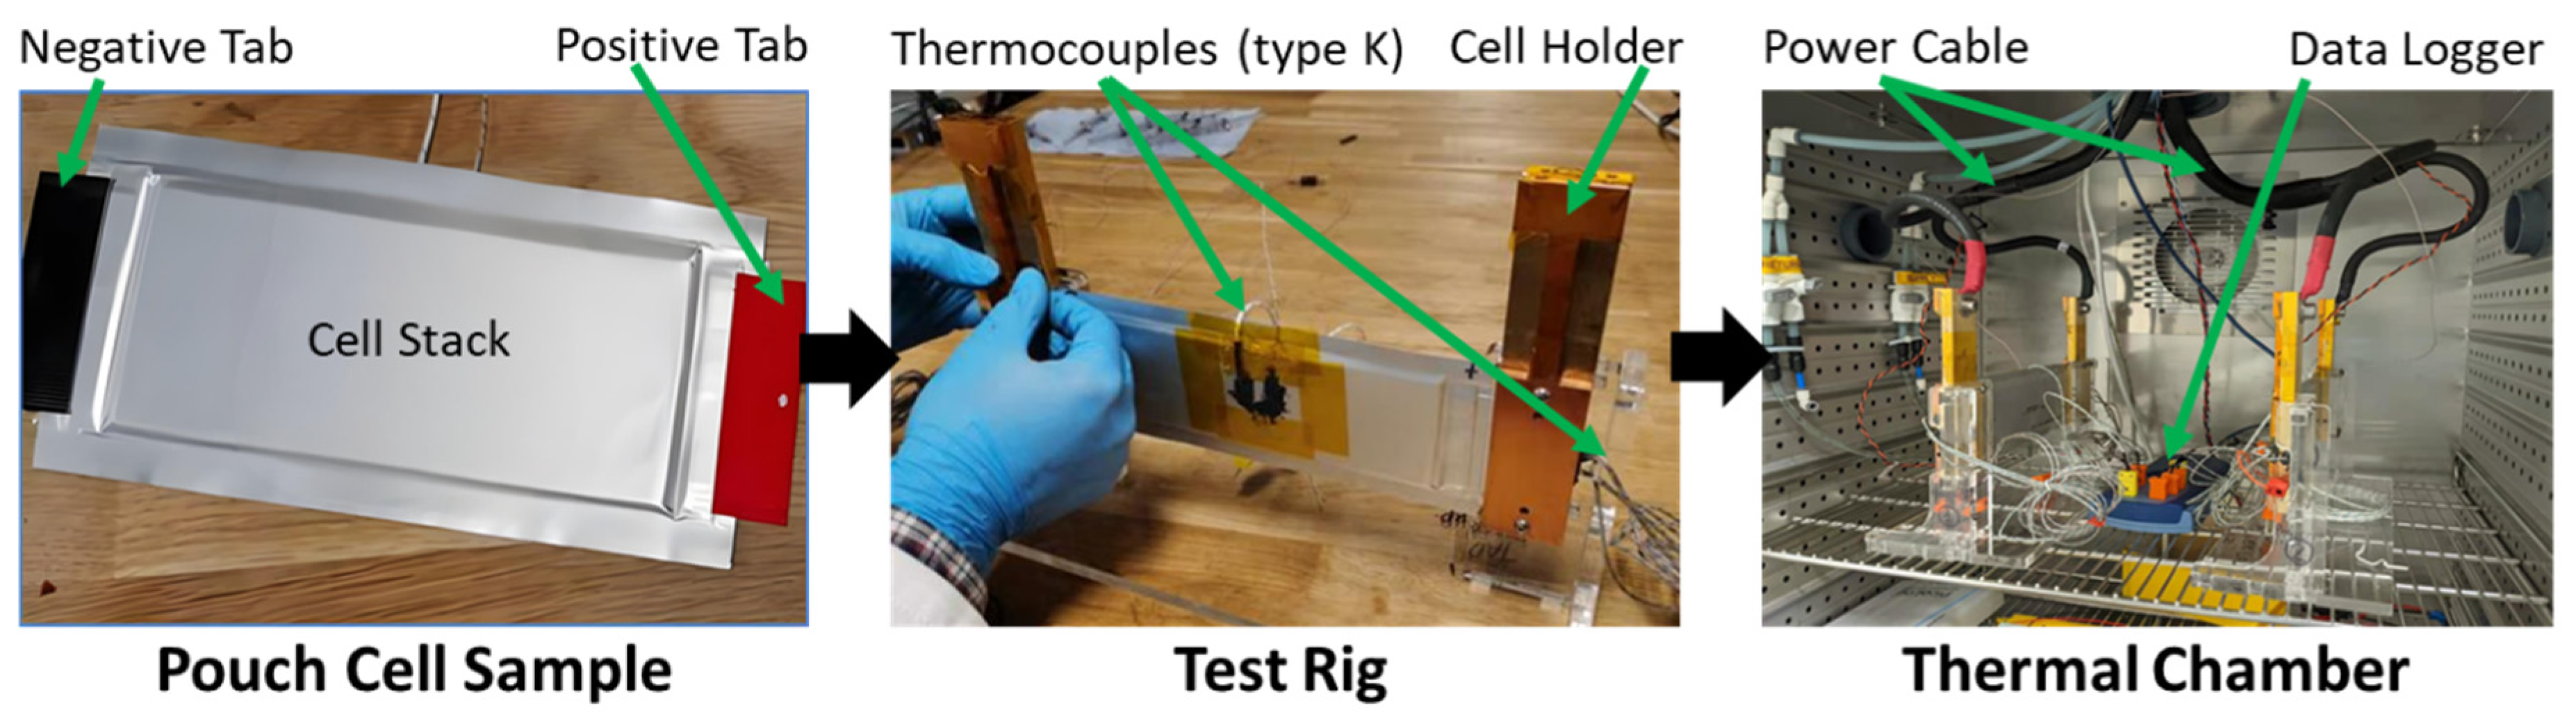
We fabricated a LiFePO4 cell as a reference cell, as shown in Figure 2, with a post-formation capacity of 4.4 Ah and the specified parameters listed in Table 1. Using the electrical and thermal parametrization methods described above, we tested this reference cell to obtain normalized parameters (e.g., per mass, area, volume, or temperature), with the measured values provided in Table 2. In our work, larger-format cells were fabricated using the same materials and fabrication processes as the reference cell; therefore, the normalized parameters can be applied to model larger-format cells.

3.2. Electrical and Thermal Validation Tests

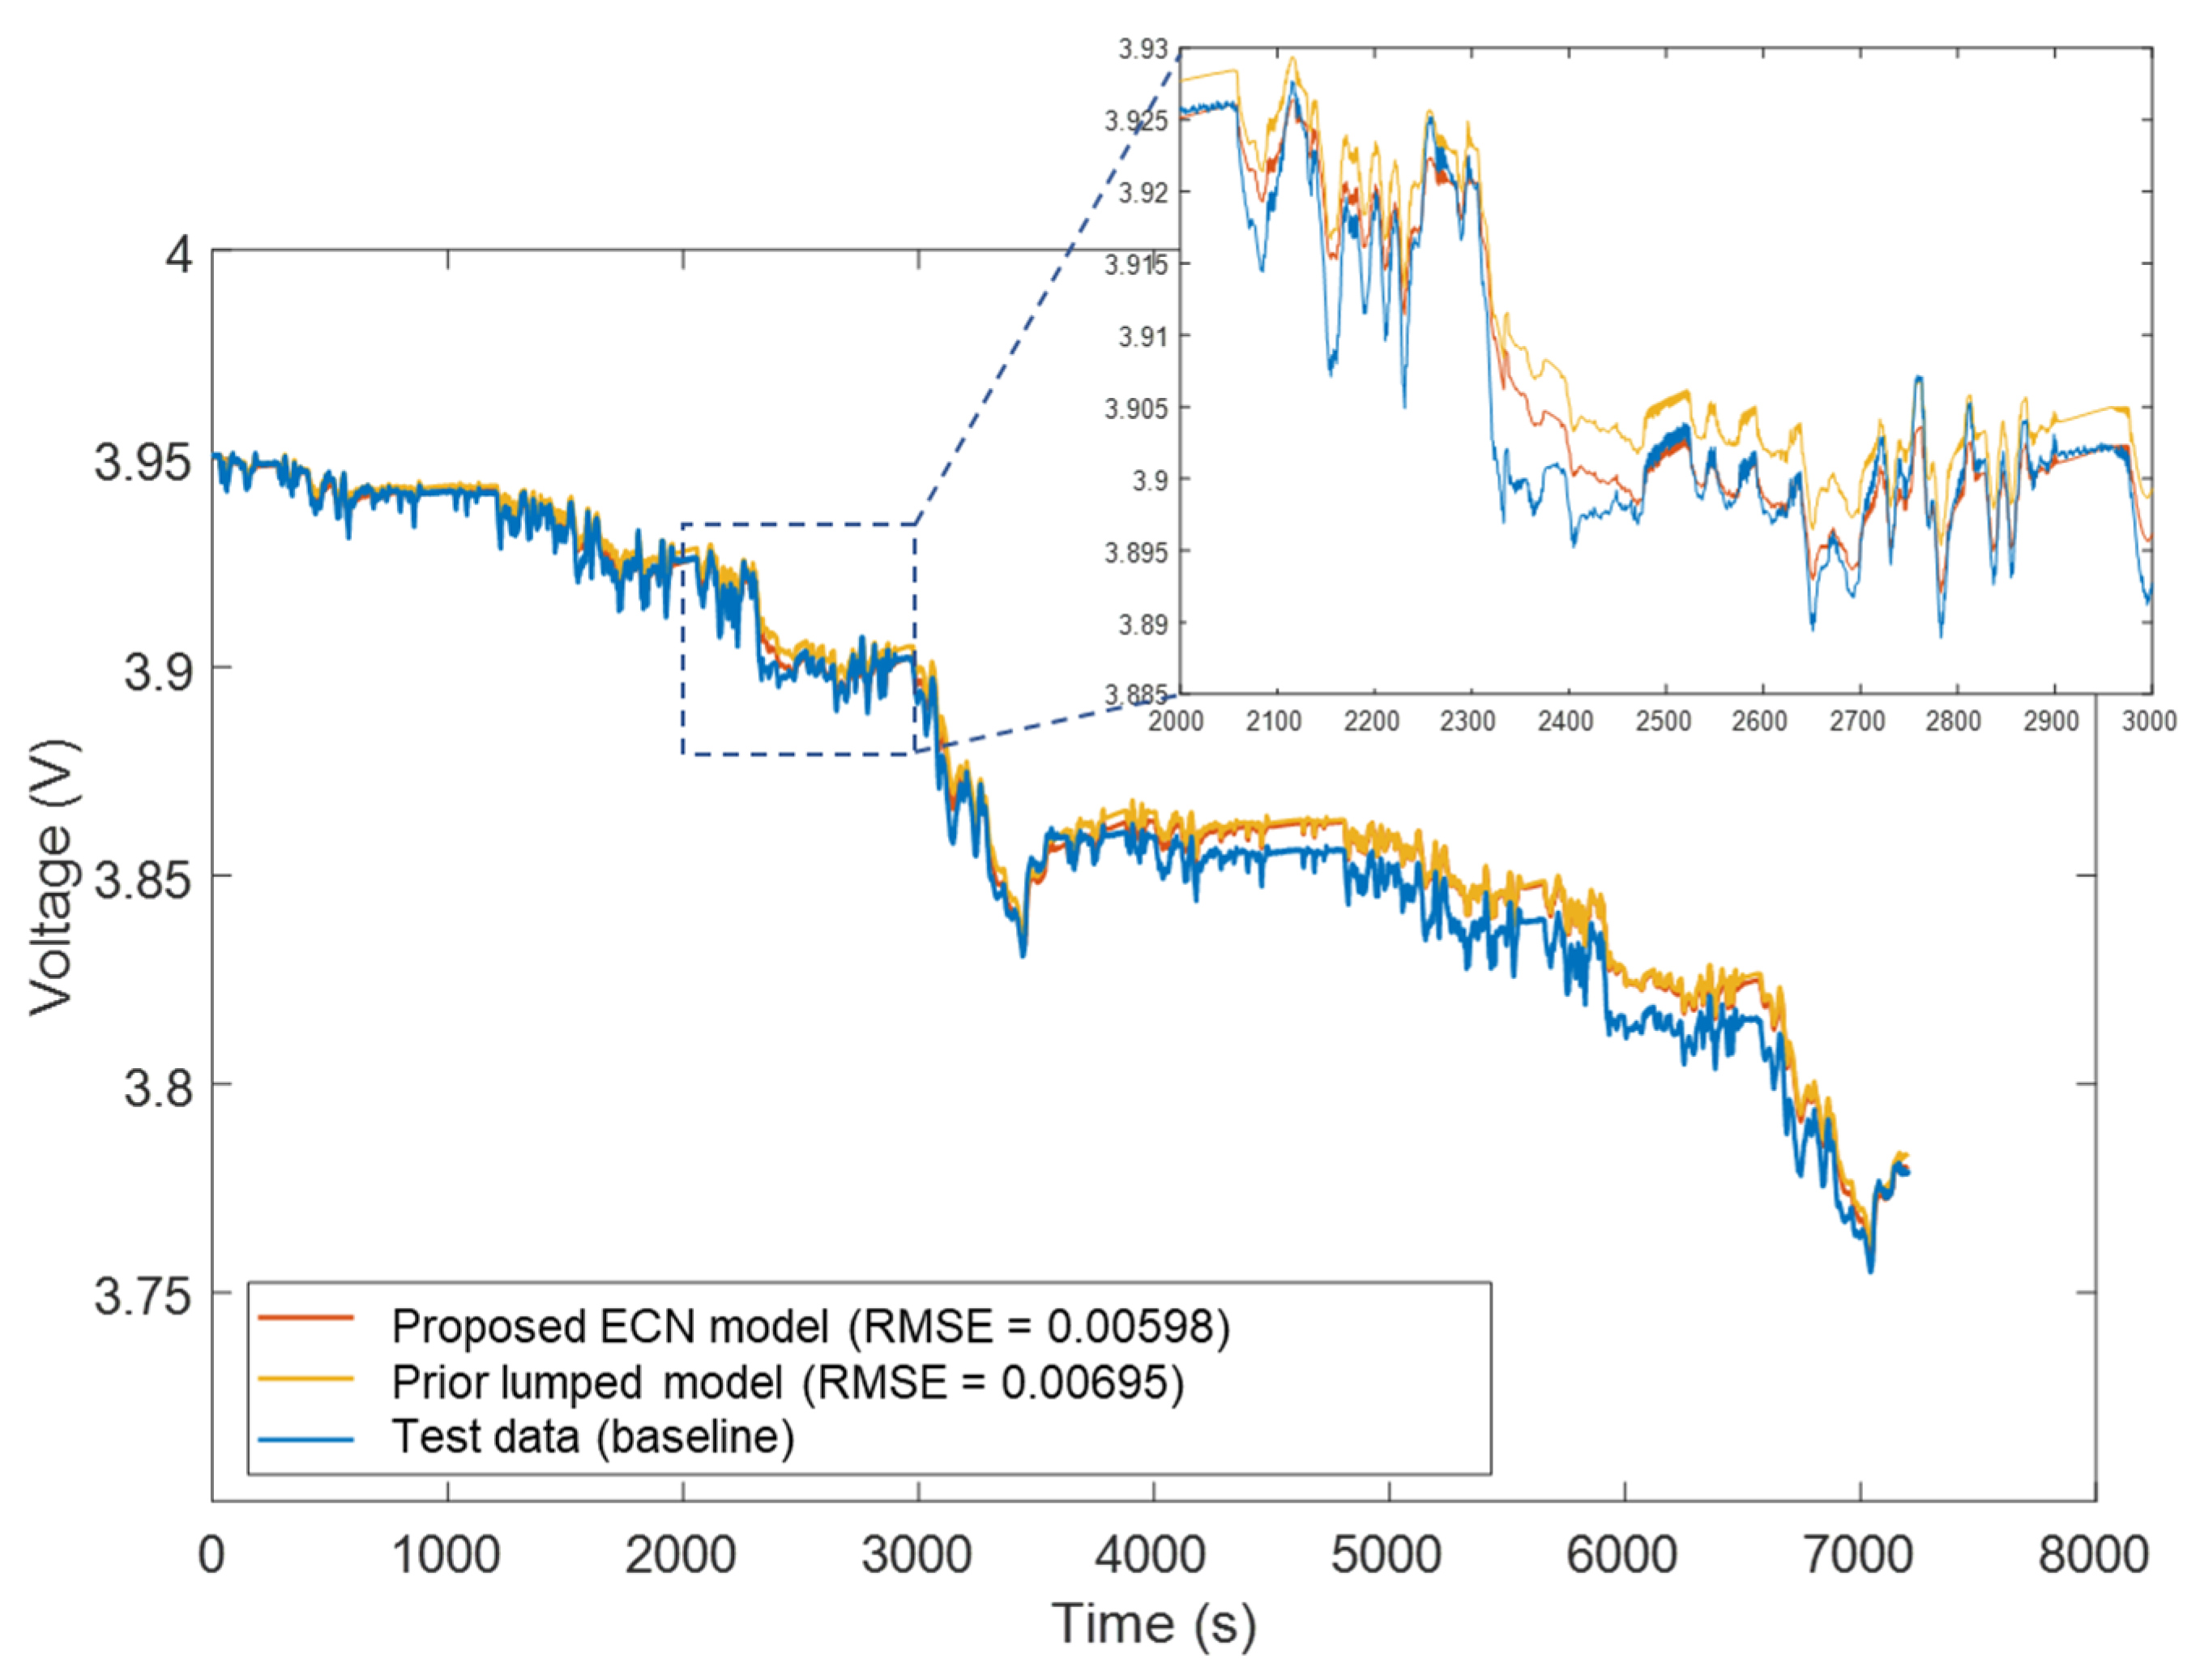
Using the modeling method in Section 2 and the parameter set in Section 3.1, we validated the ECN model’s electrical and thermal simulation accuracy. For the electrical validation, at 25 °C with an initial SOC of 80%, we recorded the cell current and voltage from a vehicle whose battery system is assembled from the target cell under a WLTP [34] drive cycle. The measured current profile was then applied as the model input to simulate the corresponding output voltage. For comparison, we also simulated the voltage response using the lumped model from our prior study [35]. It can be seen from Figure 3 that both the proposed ECN model and the prior lumped model can accurately reproduce the cell voltage variations under rapidly changing current input conditions; however, the former achieves higher accuracy, showing closer agreement with the measured voltage, with an RMSE of less than 6 mV.
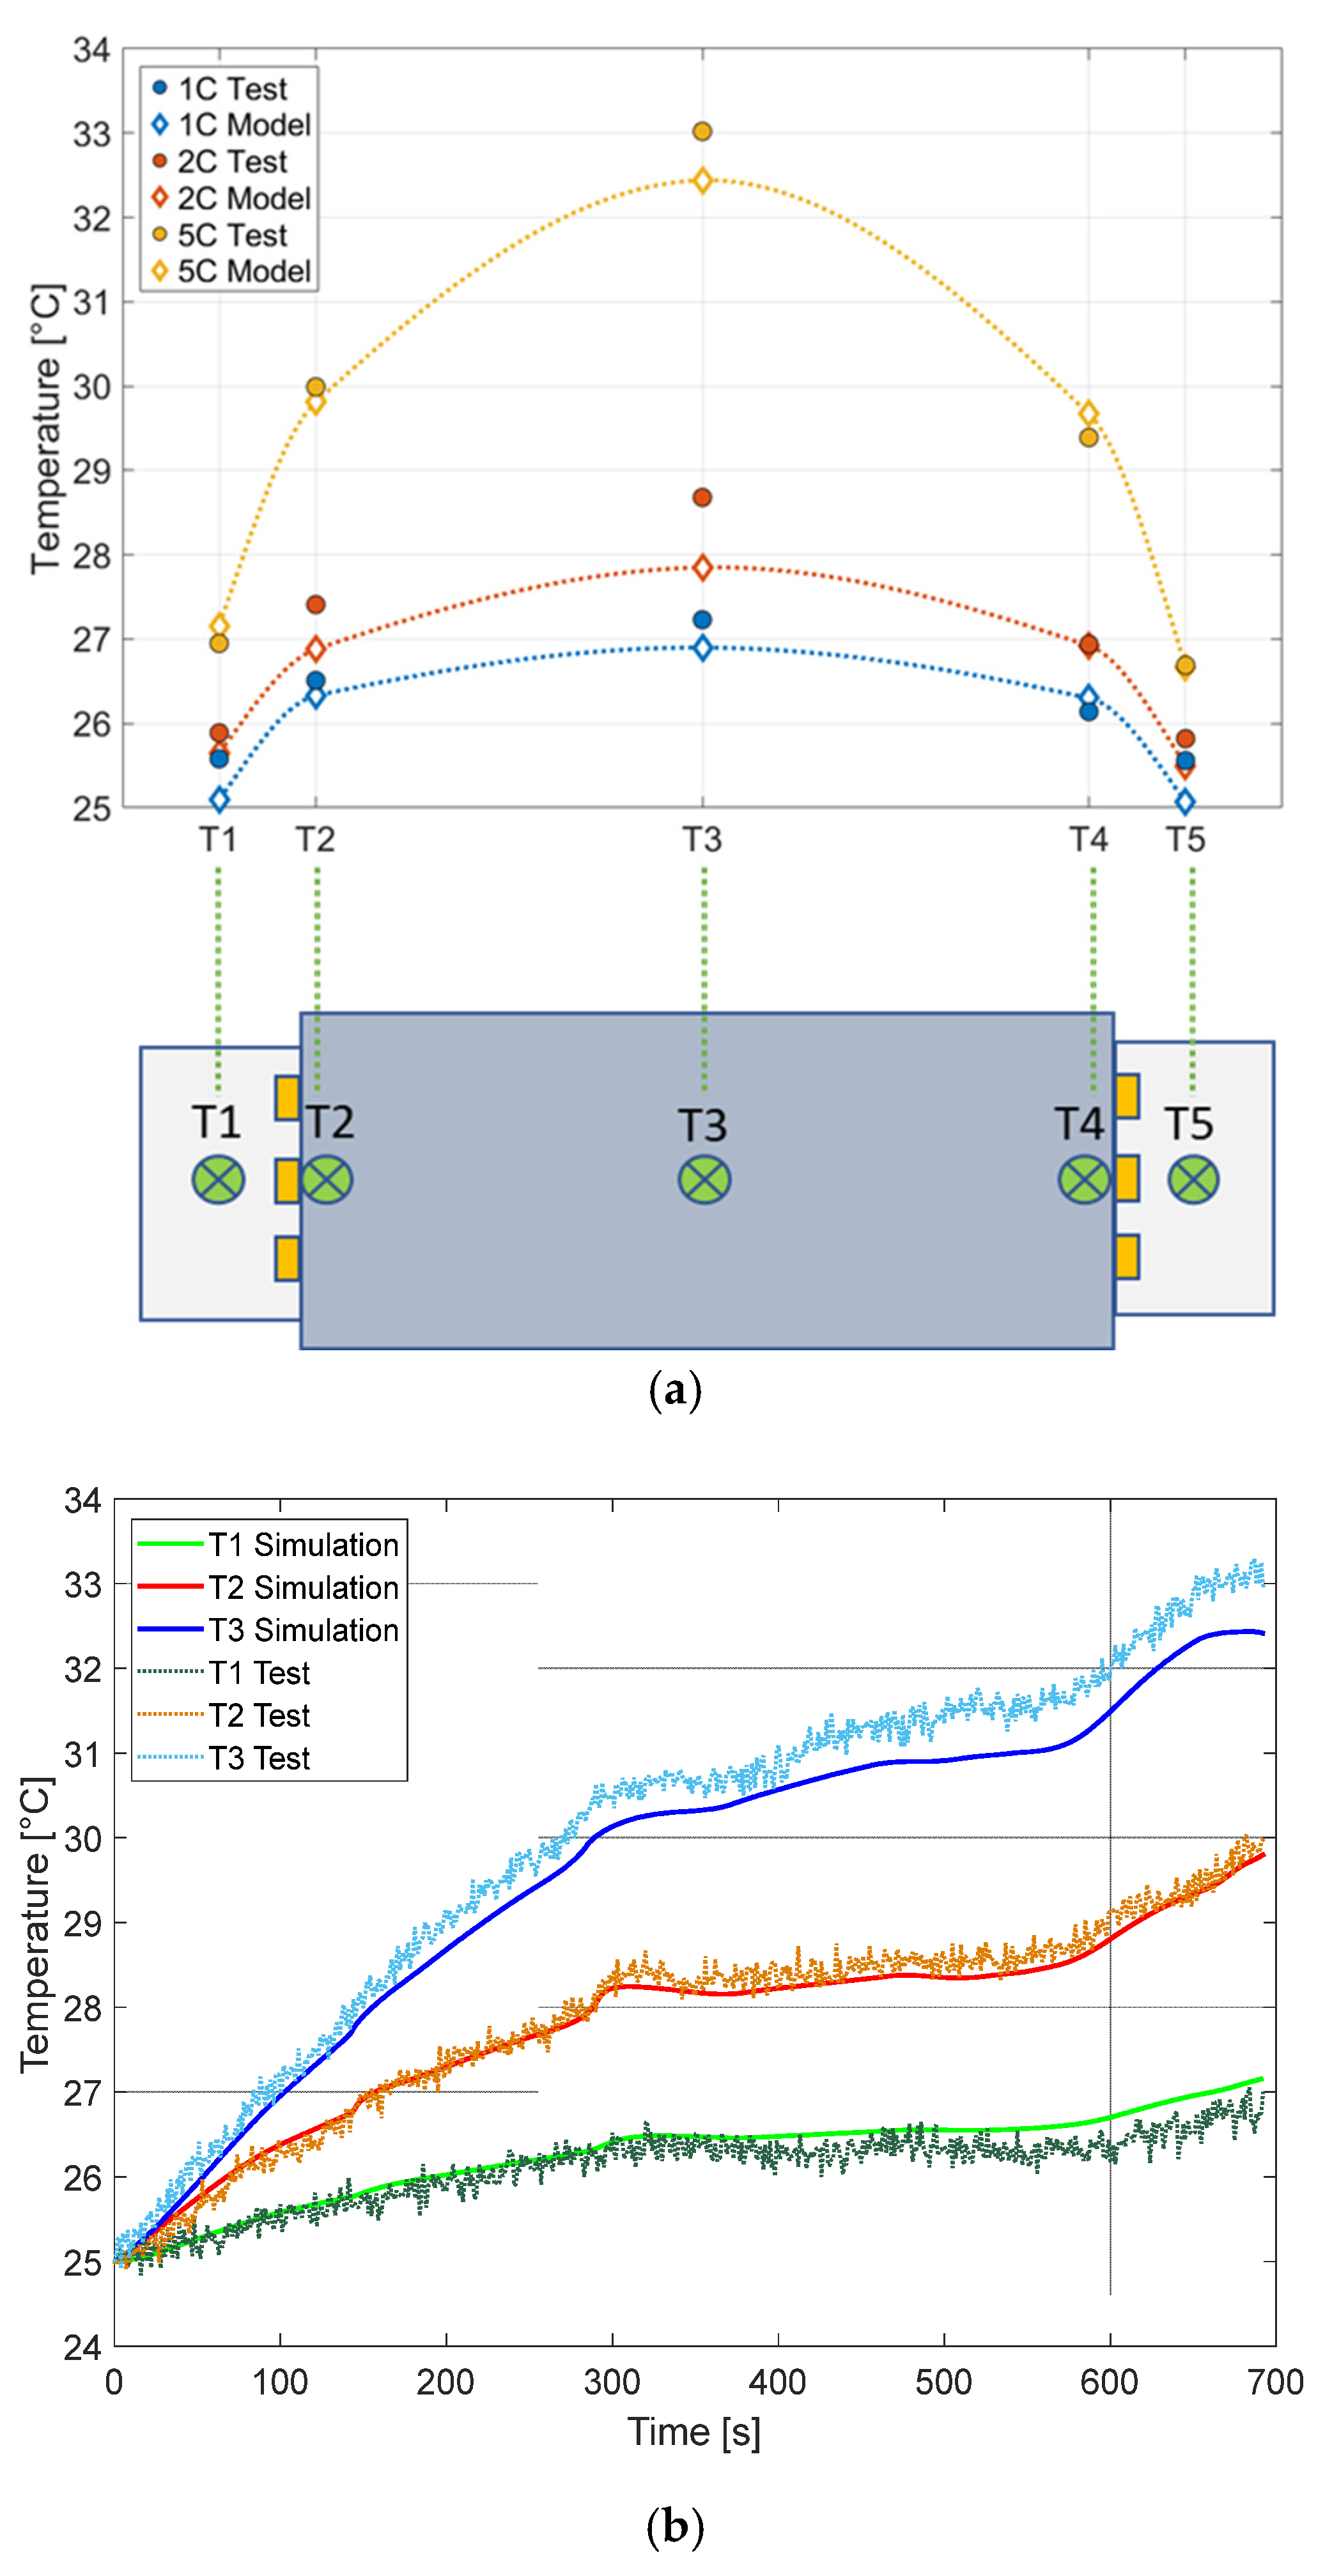
For the thermal validation, as shown in the lower panel of Figure 4, five temperature sampling points were placed along the cell’s length: T1 and T5 at the tab centers, T2 and T4 at the left and right edges of the stack, and T3 at the stack center. These points span the cell’s longest dimension to capture the maximum temperature gradient. The cell was discharged at 25 °C and 100% SOC at 1C, 2C, and 5C to the cutoff voltage, and the measured temperatures were compared with simulations to assess model accuracy. From Figure 4a in which the end-of-discharge temperatures at 5 sampling points were compared: at 1C the MAE of temperatures is 0.33 °C (max 0.49 °C at T5); at 2C the MAE is 0.39 °C (max 0.83 °C at T3); at 5C the MAE is 0.25 °C (max 0.58 °C at T3); overall the MAE is 0.32 °C with a worst case of 0.83 °C. From Figure 4b in which the temporal evolution of temperatures at 5C and 3 sampling points were compared: at point T1, the MAE of temperatures is 0.18 °C; at point T2, the MAE is 0.14 °C; at point T3, the MAE is 0.38 °C. These sub-degree errors demonstrate a highly accurate thermal model.
Taken together, the model qualifies as design-oriented on four grounds: (1) structural–physical isomorphism via tab-weld-stack modular discretization, with tabs and welds solved by 3D ohmic conduction and each stack node treated as a functional micro-cell; (2) bidirectional electro-thermal coupling, where electrical and thermal solvers iteratively exchange SOC, T, and parameter dependencies (Es, R0, Ri, Ci, and dEs/dT), reproducing device feedback; (3) per-unit, spatially normalized parameterization (per length/area/volume) that guarantees geometry-consistent scaling and cross-geometry portability, enabling reuse and comparison with reduced re-parametrization effort; and (4) measurement-based calibration and scenario validation, yielding a measurement-anchored, deployment-ready model. Collectively, these properties support its direct use in cell-design studies.

4. Cell Design Factors and Simulation Setup

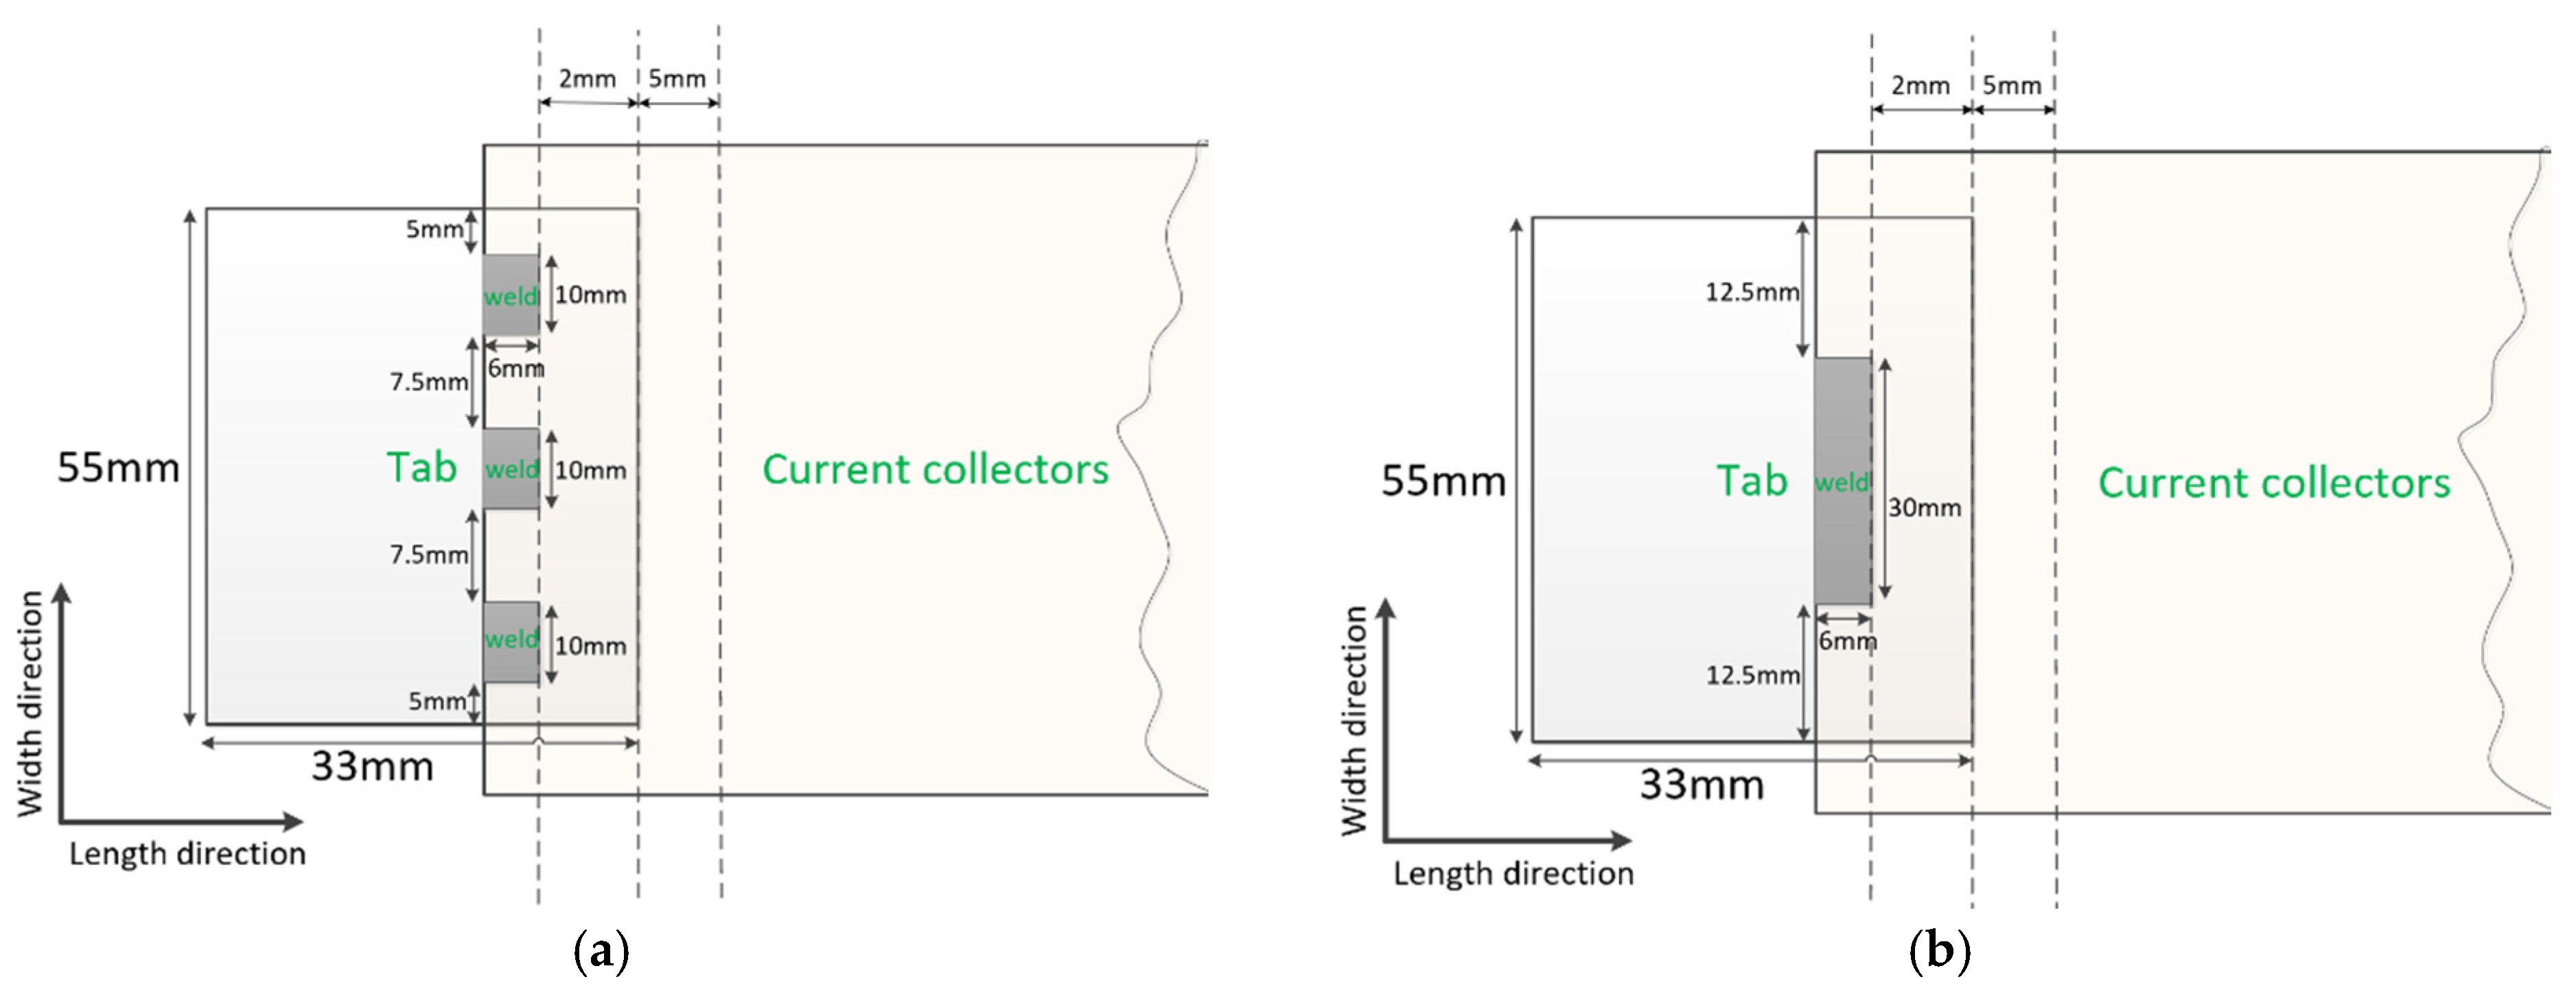
Based on the reference cell, a 44 Ah large-format pouch cell was investigated by simulations. In terms of stack design, the cell stack consists of 110 stacked layers, with each layer having a surface area of 260 mm × 85 mm. In terms of tab design, the tab geometry and welding methods are shown in Figure 5. Figure 5a,b share the same tab geometry with a tab thickness of 4 mm, but differ in welding methods. The former adopts three-point welding, in which three identical welds connect the tab to the current collectors within the stack. The latter adopts one-point welding, where a single weld is used, and its length equals the sum of the three welds in Figure 5a. In terms of operating condition, the cell is subjected to a full discharge at a 5C rate under an ambient temperature of 35 °C, to evaluate thermal management effectiveness under the most demanding conditions.
For the 44 Ah pouch cell, the following design factors are considered as variables in the simulations:
(1)
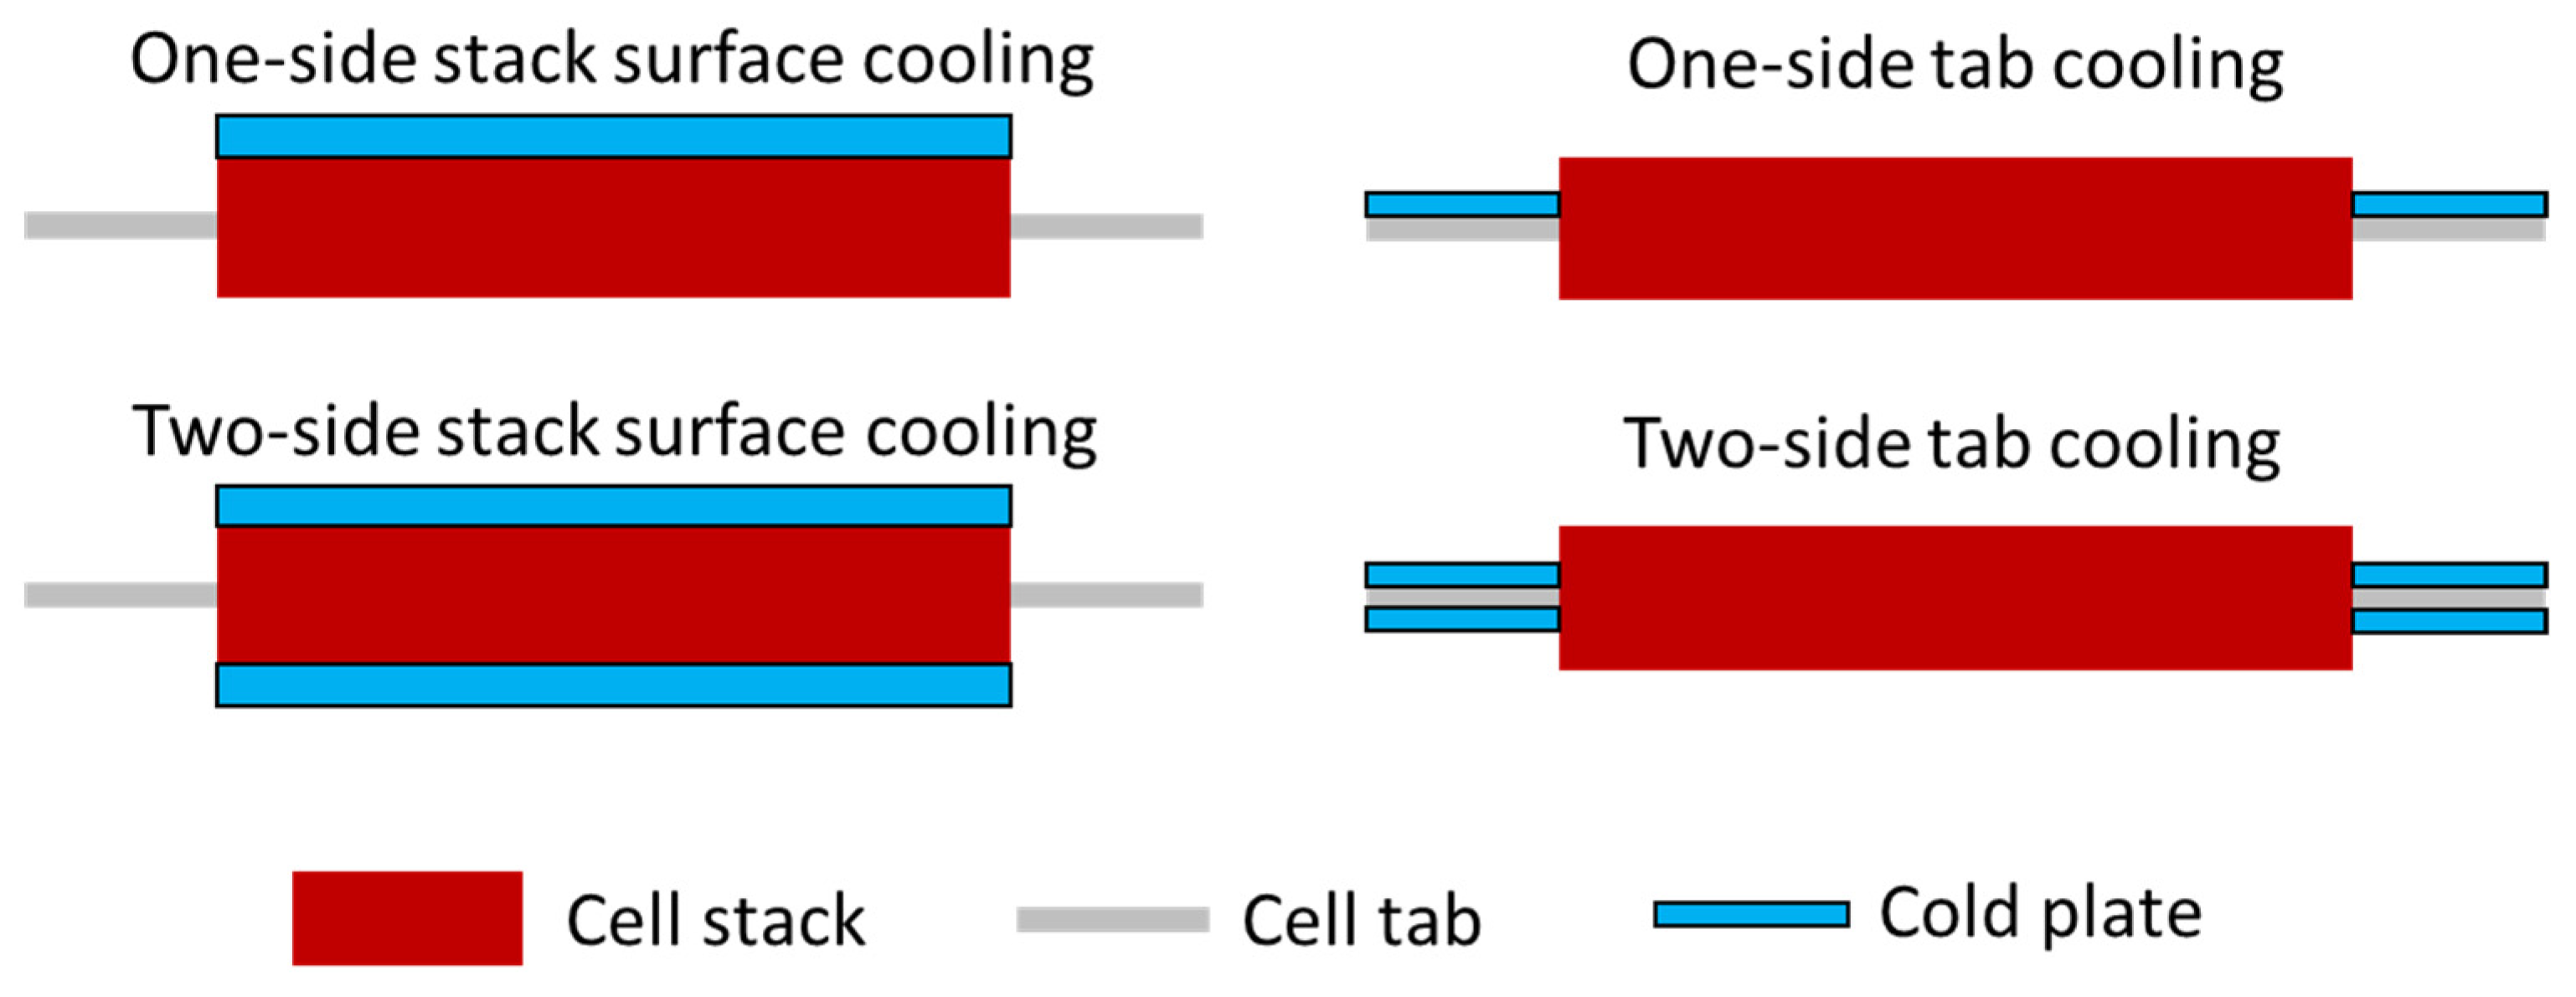
Thermal management configurations. Five cases were analyzed, including natural convection (no active cooling) and four active cooling configurations commonly used in engineering practice: one-sided stack surface cooling, two-sided stack surface cooling, one-sided tab cooling, and two-sided tab cooling, as illustrated in Figure 6. In all cases, the cooling plates employed a 1:1 water–ethylene glycol mixture maintained at a constant temperature of 15 °C, with a flow rate of 0.1 L/min. The heat transfer coefficient between the cooling plate and the stack surface is approximately 60 W/m2/K, and that between the cooling plate and the tabs is approximately 2980 W/m2/K.
(2)
Tab width. The baseline width is 55 mm, with a variant increased by roughly 50% to 80 mm.
(3)
Tab thickness. The baseline thickness is 4 mm, with a variant doubled to 8 mm.
(4)
Tab welding methods. The baseline uses three-point welding, with one-point welding as the variant.
In terms of simulation setup, the electro-thermal network employs a 7 × 7 × 6 node discretization in the x–y–z directions for the cell stack. The tab and weld regions are discretized and coupled to the stack nodes using the same spatial resolution strategy to ensure electrical and thermal continuity across modules. It should be noted that the number of nodes is a configurable parameter in the modeling framework. Increasing the number of nodes improves spatial resolution and temperature accuracy, while inevitably increasing computational cost. All simulations are performed using a fixed time step of 1 s, which provides a good balance between numerical stability, temporal resolution, and computational efficiency. The coupled electrical and thermal governing equations are solved using a time-marching scheme within the in-house implementation. The solver employs a relative tolerance of 1×10⁻⁶ for state updates, which were found sufficient to ensure stable and converged solutions under all simulated conditions. With the above discretization, time-step, and solver settings, a single discharge simulation with a physical duration of 701 s requires approximately 23 s of wall-clock time on a desktop with an Intel Core i9-13900H (2.60 GHz) CPU.

5. Results and Discussion

5.1. Base Case Analysis

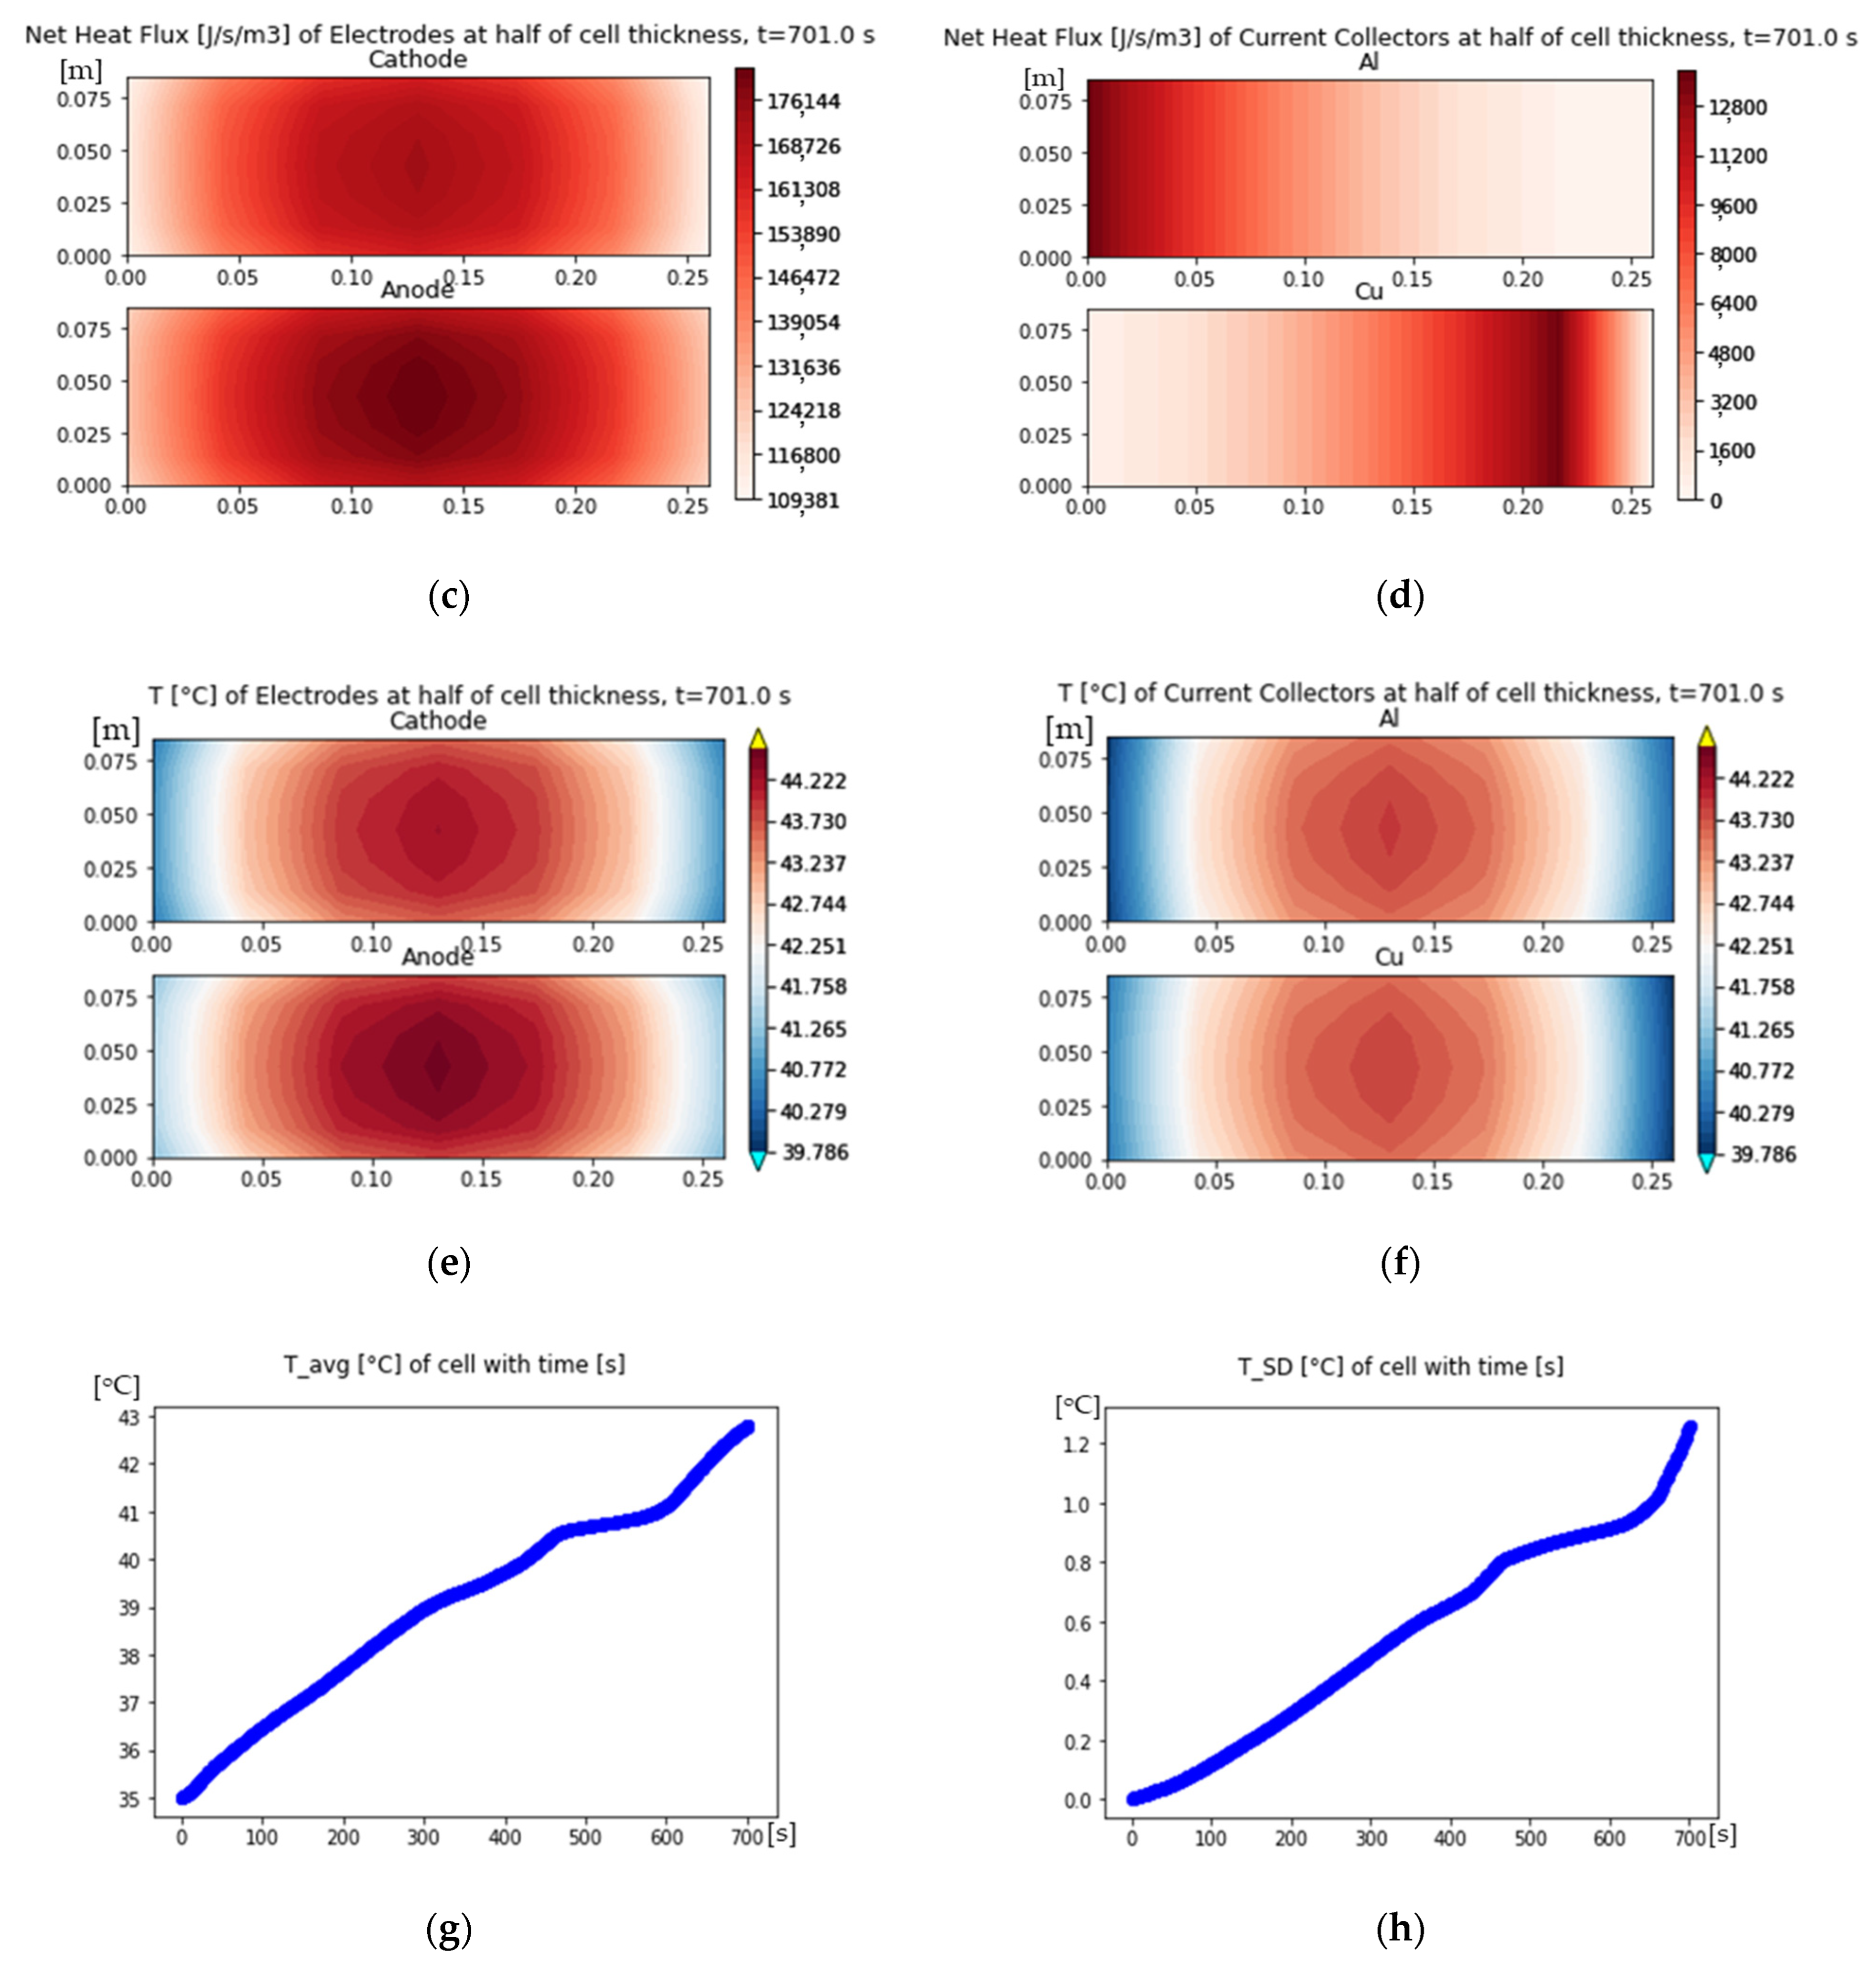
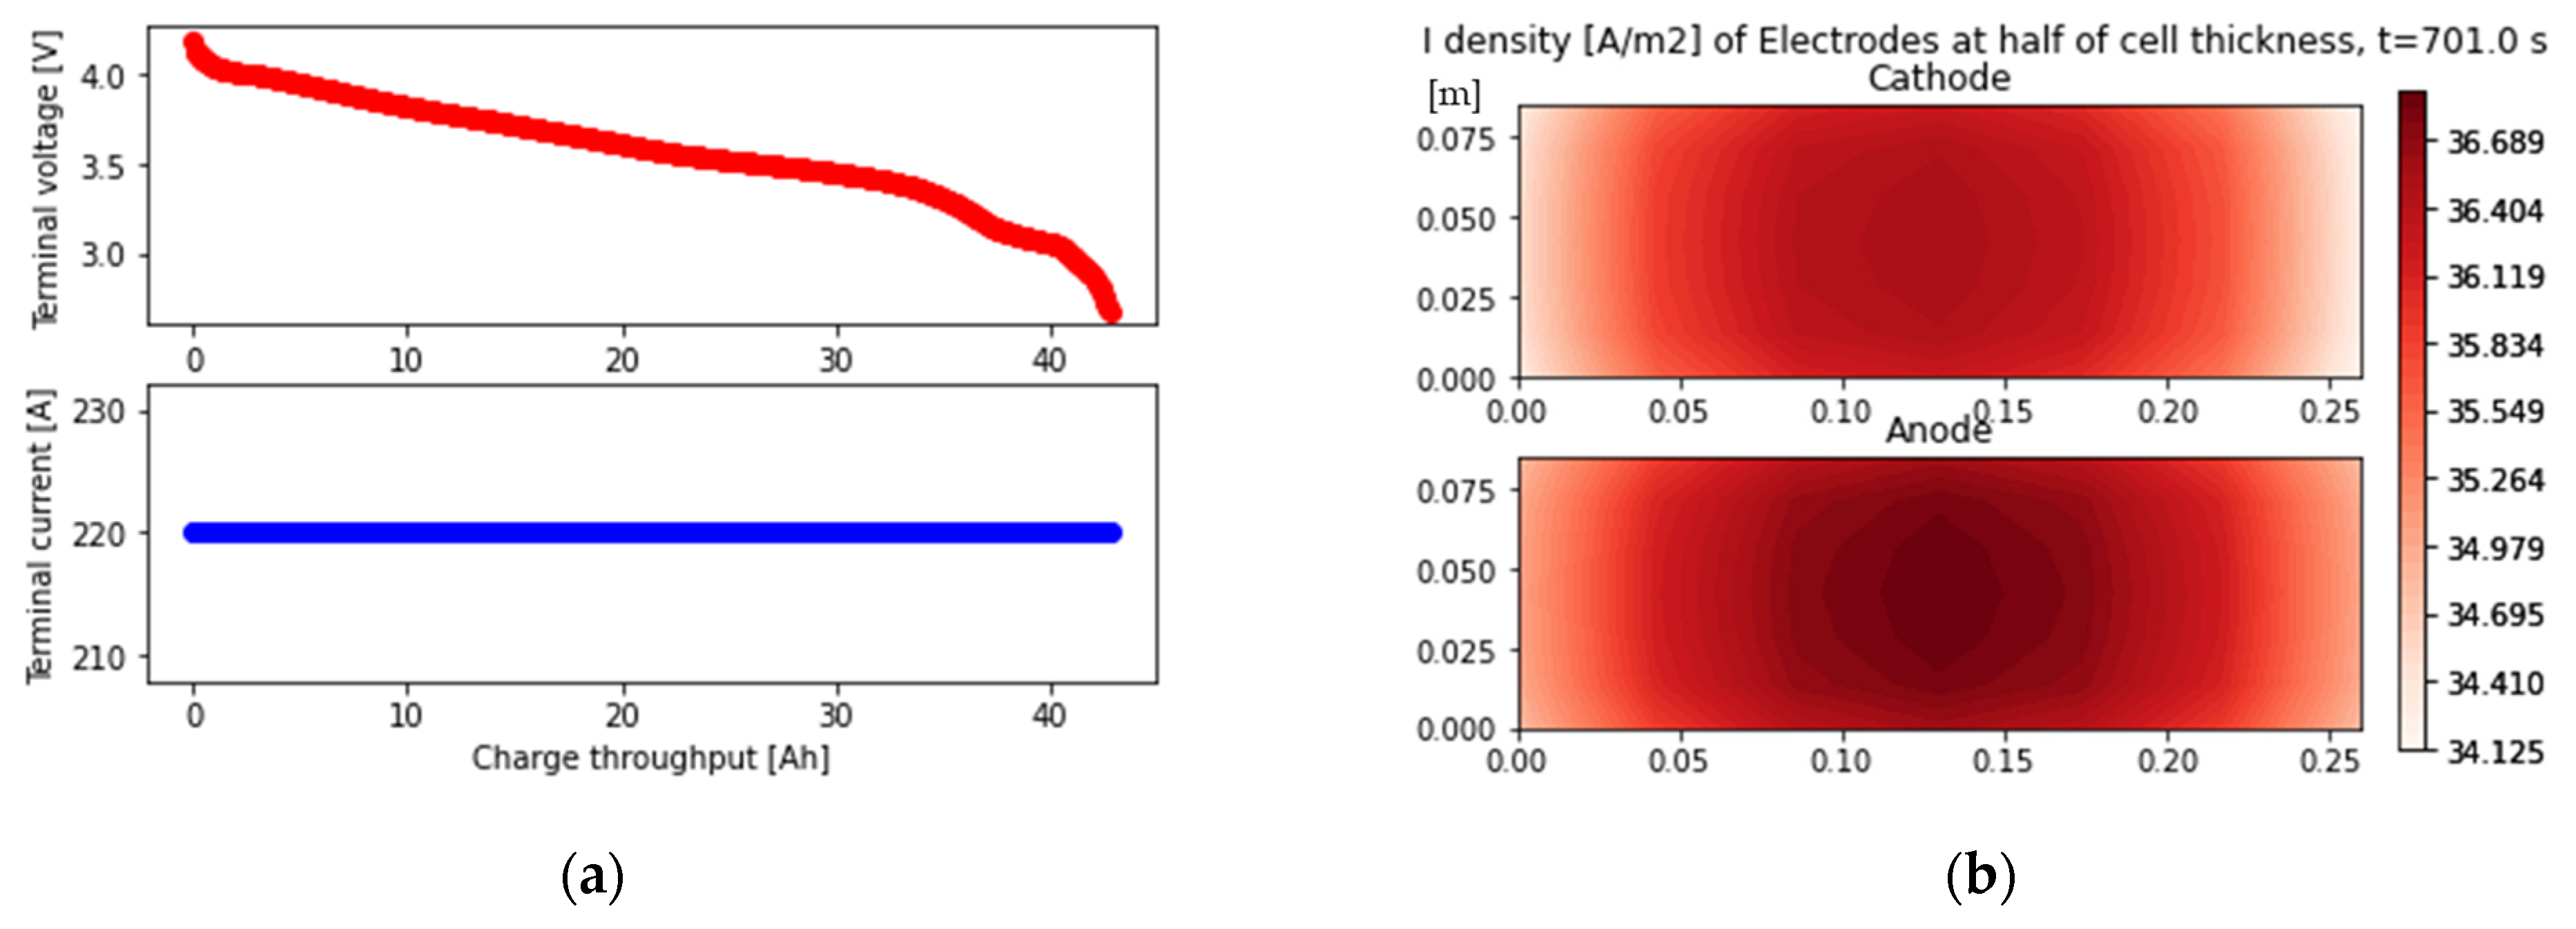
Following the aforementioned setup, a base-case simulation is performed under natural convection, 55 mm tab width, 4 mm tab thickness, and three-point welding. The results are provided in Figure 7. It can be observed that the proposed model is capable of capturing not only the cell-level electro-thermal behaviors shown in Figure 7a,g,h, but also the detailed distributions of current density, net heat flux, and temperature on the electrodes and current collectors as shown in Figure 7b–f.
Figure 7b shows that the current density exhibits a radial pattern with higher values in the center and lower values toward the edges. The variation in current density on the electrode can reach approximately 2 A/m2. Figure 7c indicates that the distribution of net heat flux on the electrode follows the same trend as the current density distribution, while Figure 7d shows that the net heat flux on the current collector increases progressively toward the tab region. A comparison between Figure 7c,d reveals that the heat flux on the electrode is more than one order of magnitude higher than that on the current collector, suggesting that heat generation is dominated by the electrode region. This explains why the temperature distribution on the electrode in Figure 7e follows the same trend as the heat flux distribution in Figure 7c, and even the temperature distribution on the current collector in Figure 7f exhibits a similar pattern. Figure 7g shows that the average cell temperature rises by approximately 8 °C within about 700 s, while Figure 7h demonstrates that the temperature non-uniformity continues to increase over time.

5.2. Thermal Impact Analysis of Cell Design Factors

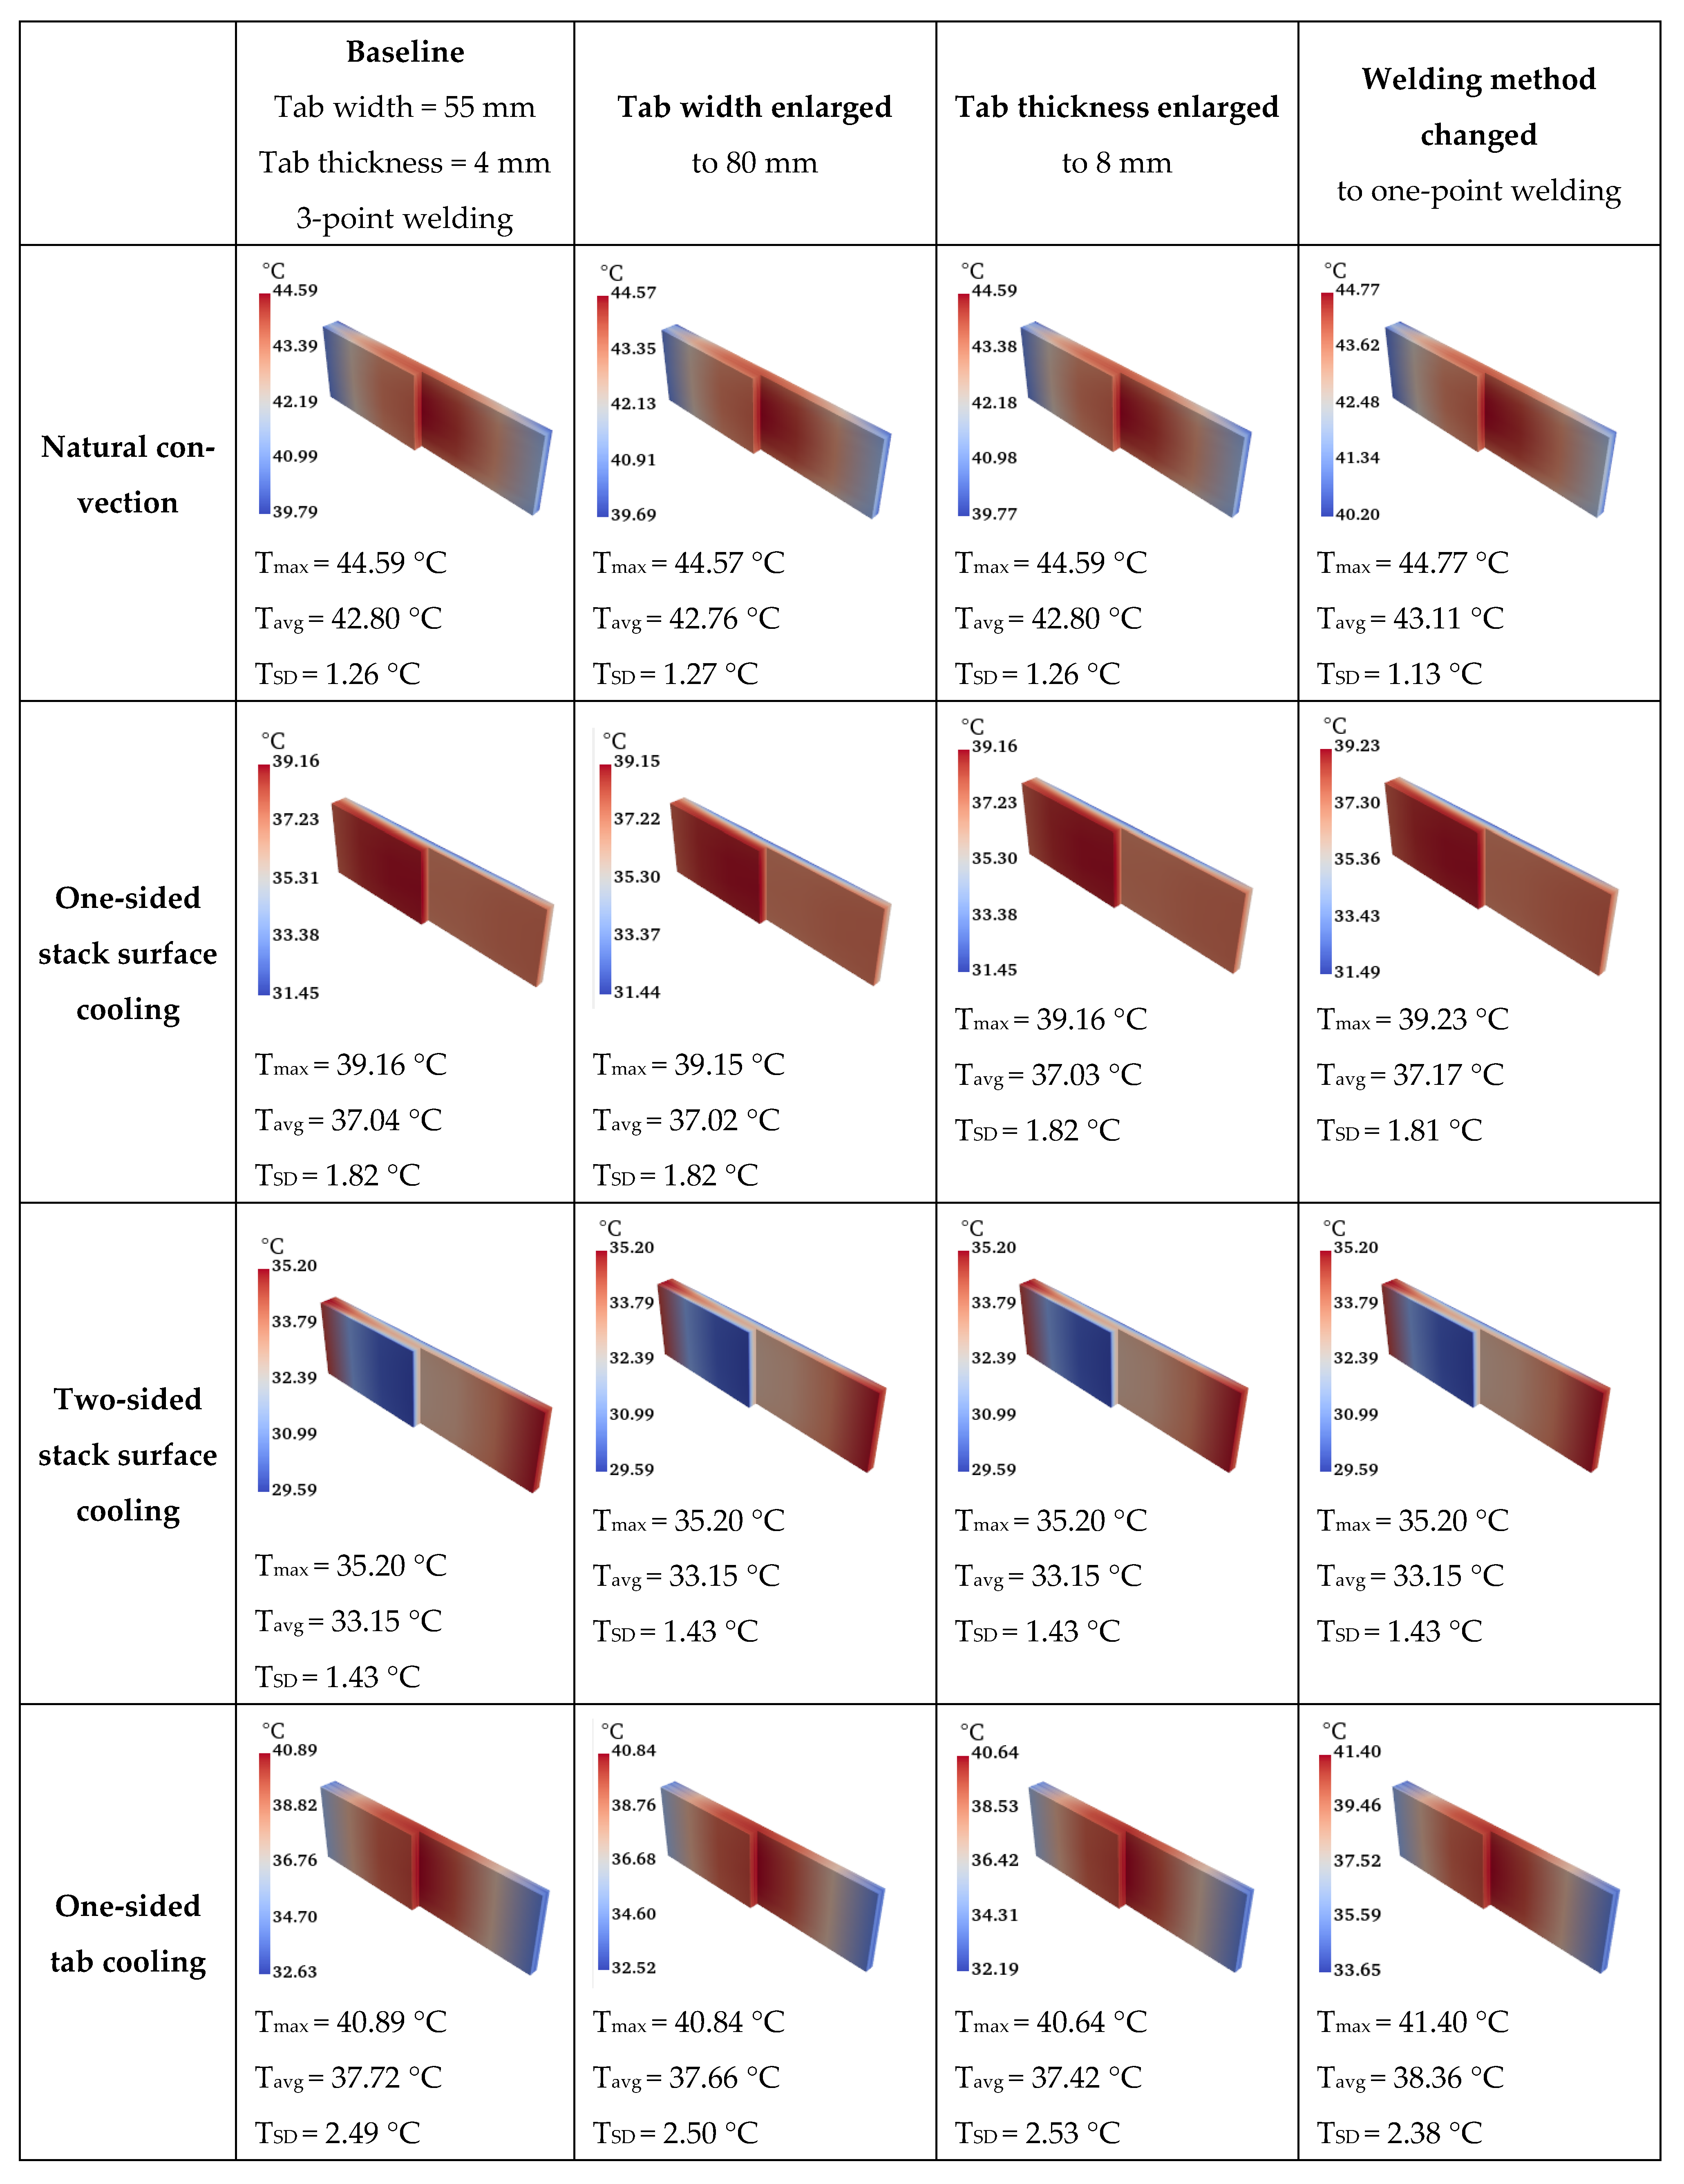
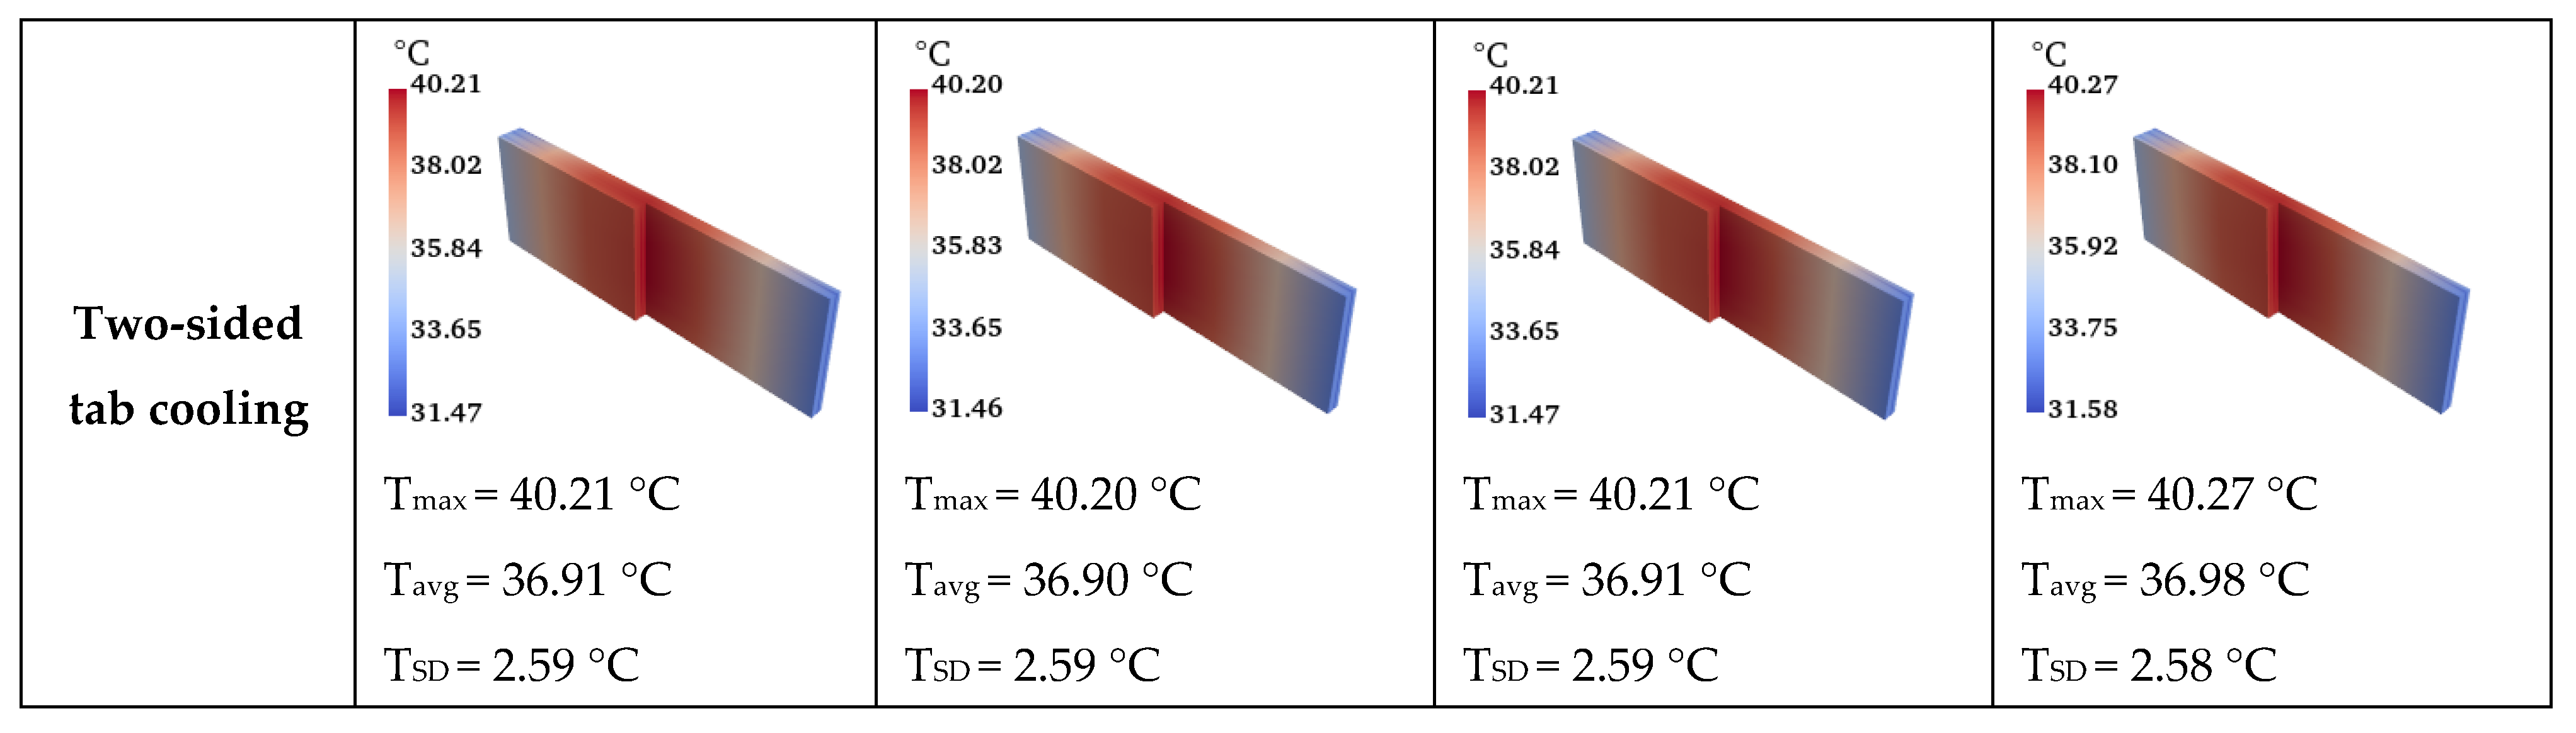
Building upon the base case, a series of additional simulations are conducted by modifying the thermal management configurations, as well as the tab width, tab thickness, and tab welding method. The comparative results are presented in Figure 8, which highlights the 3D temperature distribution of the cell stack. To better visualize the internal temperature field, the 3D cell stack was partially sectioned, and one quarter of the volume was removed to expose the internal temperature gradients. In addition, Figure 8 summarizes the key thermal metrics, including the spatial maximum, spatial average, and spatial standard deviation of the cell stack temperature. A comparative analysis of different simulation cases yields the following key findings:
(1)
Thermal management configuration is the most influential cell design factor, and its impact far exceeds that of the tab width, tab thickness, or tab welding method.
(2)
All four active cooling configurations are capable of reducing the average cell temperature by more than 5 °C. However, significant temperature gradients exist within the cell under all configurations, and the temperature difference between locations exceeds 5 °C in each case.
(3)
A comparison between stack surface cooling and tab cooling shows that stack surface cooling achieves a lower overall cell temperature and better temperature uniformity. In contrast, tab cooling induces a pronounced temperature gradient between the tab and the stack core. Therefore, for pouch cells with large surface areas, stack surface cooling is a more suitable and effective option.
(4)
A comparison between one-sided and two-sided cooling reveals that, for stack surface cooling, switching from one-sided to two-sided cooling can further reduce the maximum and average temperatures by approximately 4 °C and decrease the temperature standard deviation by around 0.4 °C. For tab cooling, however, the temperature reduction is less than 0.8 °C, and the temperature non-uniformity slightly increases. This indicates that adopting two-sided cooling is meaningful for stack surface cooling, while its effectiveness for tab cooling is limited.
(5)
Two-sided stack surface cooling is identified as the optimal configuration among the four active cooling strategies. It not only achieves the lowest average cell temperature (a reduction of about 11 °C compared to no cooling) but also yields the smallest temperature standard deviation (1.43 °C). More importantly, it significantly decreases the maximum stack core temperature by more than 9 °C, whereas the other three configurations reduce the core temperature by only about 4~5 °C.
(6)
Considering the combined effects of maximum temperature, average temperature, and temperature standard deviation, the four active cooling configurations can be ranked as follows: two-sided stack surface cooling > one-sided stack surface cooling ≫ two-sided tab cooling > one-sided tab cooling.
(7)
Increasing the tab width or thickness has a noticeable effect only under one-sided tab cooling, while its impact is negligible under the other three active cooling configurations. Enlarging the tab slightly reduces the overall cell temperature but tends to increase temperature non-uniformity.
(8)
Changing the tab welding method from three-point to one-point welding produces a measurable effect only under one-sided tab cooling and is almost insignificant under the other three configurations. One-point welding slightly raises the stack temperature but improves temperature uniformity by simplifying the heat flow path.
In summary, thermal management configuration is the dominant factor influencing the thermal performance of large-format pouch cells. Among the investigated configurations, two-sided stack surface cooling proves to be the most effective configuration, achieving both the lowest average temperature and the best temperature uniformity. One-sided stack surface cooling ranks second, while tab cooling serves only as a compromise solution for space-constrained applications. Increasing the tab width or thickness provides minor thermal benefits only under one-sided tab cooling, with negligible effects under other cooling configurations. Concentrated welding, such as one-point welding, can simplify the heat transfer path and slightly improve temperature uniformity, but it reduces the heat flux between the tab and the stack, leading to a modest rise in stack temperature. Overall, engineering efforts and resources should be primarily devoted to optimizing the cell stack and cooling system, rather than over-designing the tabs.

6. Conclusions

This work introduced a high-fidelity electro-thermal model for large-format pouch cells that mirrors the physical assembly of tabs, welds, and the cell stack. Metallic regions are solved by 3D ohmic conduction, while each stack node is represented by an equivalent circuit micro-cell coupled with transient heat conduction. The model achieves electro-thermal coupling and 3D simulation capability, providing a physically consistent foundation for thermal analysis and cell design optimization, positioning the model as complementary to, rather than competitive with, existing modeling paradigms.
Using the proposed model to perform simulations, the study quantified how thermally critical cell design factors govern temperature levels and uniformity in a 44 Ah pouch cell. The results show that thermal management configuration is the dominant lever for thermal performance. Two-sided stack surface cooling achieved the lowest temperatures and the best uniformity, reducing the average temperature by about 11 °C relative to natural convection, lowering the temperature standard deviation to 1.43 °C, and decreasing the core maximum temperature by more than 9 °C. One-sided stack surface cooling ranked second. Tab cooling produced larger spatial gradients and smaller temperature reductions. Changes to tab geometry or welding produced only secondary effects. Increasing tab width or thickness offered small benefits mainly under one-sided tab cooling and showed negligible influence under stack surface cooling. Switching from three-point to one-point welding slightly improved temperature uniformity by simplifying heat flow but tended to raise the stack temperature due to reduced heat transfer between the tab and the stack.
The conclusions of this study should be interpreted within the defined scope of the proposed modeling framework. Under the assumption that the material system and manufacturing process remain unchanged, capacity upscaling is achieved through geometric expansion of electrode dimensions and an increased number of stacked layers. This formulation preserves local electro-thermal behavior at the node level, while global behavior emerges from the scaled geometry. Such normalization enables consistent analysis of structural and cooling-related thermal trends, which is the primary objective of this study. Its application to other chemistries, operating regimes, or aging scenarios would require appropriate parameter identification and validation. This scaling strategy does not account for potential changes in contact resistances, manufacturing-induced variability, thickness-dependent effects, or local thermal interface non-uniformities that may arise in large-format cell fabrication. These factors may influence absolute temperature levels in practical cells.

Author Contributions

Conceptualization, T.L. and T.Z.; Methodology, K.G. and T.Z.; Software, H.L. and B.S.; Validation, B.S.; Formal analysis, C.Z. and K.G.; Investigation, C.Z.; Resources, H.T.; Data curation, H.L.; Writing—original draft, T.Z.; Writing—review & editing, J.N. and L.Z.; Visualization, L.Z.; Supervision, H.T.; Project administration, T.L.; Funding acquisition, J.N. All authors have read and agreed to the published version of the manuscript.

Funding

This research was supported by the Talent Fund of Beijing Jiaotong University (2024XKRC087) and the Beijing Municipal Natural Science Foundation (L257024).

Data Availability Statement

The original contributions presented in this study are included in the article. Further inquiries can be directed to the corresponding author.

Conflicts of Interest

Author Junlong Niu, Hua Tang and Hongwei Li were employed by the company Beijing Capital International Airport Co., Ltd. Author Tong Li was employed by the company CNPC Offshore Engineering Company Limited. The remaining authors declare that the research was conducted in the absence of any commercial or financial relationships that could be construed as a potential conflict of interest.

References

  1. Zhu, Z.; Jiang, T.; Ali, M.; Meng, Y.; Jin, Y.; Cui, Y.; Chen, W. Rechargeable batteries for grid scale energy storage. Chem. Rev. 2022, 122, 16610–16751. [Google Scholar] [CrossRef] [Scilit]
  2. Shi, T.; Tu, Q.; Tian, Y.; Xiao, Y.; Miara, L.J.; Kononova, O.; Ceder, G. High active material loading in all-solid-state battery electrode via particle size optimization. Adv. Energy Mater. 2020, 10, 1902881. [Google Scholar] [CrossRef] [Scilit]
  3. Xiong, Y.; Yan, X.; Li, T.; Jin, H.; Chen, Z.; Xu, X.; Ji, X.; Ge, X. Micro-tabless-pouch-cell (MTPC) with high energy density and exposed functional current collector for flexible device. Chem. Eng. J. 2023, 451, 138913. [Google Scholar] [CrossRef] [Scilit]
  4. Boyce, A.M.; Cumming, D.J.; Huang, C.; Zankowski, S.P.; Grant, P.S.; Brett, D.J.; Shearing, P.R. Design of scalable, next-generation thick electrodes: Opportunities and challenges. ACS Nano 2021, 15, 18624–18632. [Google Scholar] [CrossRef] [Scilit] [PubMed]
  5. Li, W.; Liu, J.; Zhao, D. Mesoporous materials for energy conversion and storage devices. Nat. Rev. Mater. 2016, 1, 16023. [Google Scholar] [CrossRef] [Scilit]
  6. Shaw, V. Hithium debuts 587 Ah cell and 6.25 MWh storage system. pv magazine, 16 April 2025. Available online: https://www.pv-magazine.com/2025/04/16/hithium-debuts-587-ah-cell-and-6-25mwh-storage-system/ (accessed on 1 August 2025).
  7. Hesse, H.C.; Schimpe, M.; Kucevic, D.; Jossen, A. Lithium-ion battery storage for the grid—A review of stationary battery storage system design tailored for applications in modern power grids. Energies 2017, 10, 2107. [Google Scholar] [CrossRef] [Scilit]
  8. Haruna, H.; Itoh, S.; Horiba, T.; Seki, E.; Kohno, K. Large-format lithium-ion batteries for electric power storage. J. Power Sources 2011, 196, 7002–7005. [Google Scholar] [CrossRef] [Scilit]
  9. Longchamps, R.S.; Yang, X.G.; Wang, C.Y. Fundamental insights into battery thermal management and safety. ACS Energy Lett. 2022, 7, 1103–1111. [Google Scholar] [CrossRef] [Scilit]
  10. Wang, G.; Ping, P.; Kong, D.; Peng, R.; He, X.; Zhang, Y.; Dai, X.; Wen, J. Advances and challenges in thermal runaway modeling of lithium-ion batteries. Innovation 2024, 5, 100624. [Google Scholar] [CrossRef] [Scilit]
  11. Balasingam, B.; Ahmed, M.; Pattipati, K. Battery management systems—Challenges and some solutions. Energies 2020, 13, 2825. [Google Scholar] [CrossRef] [Scilit]
  12. Veth, C.; Dragicevic, D.; Merten, C. Thermal characterizations of a large-format lithium ion cell focused on high current discharges. J. Power Sources 2014, 267, 760–769. [Google Scholar] [CrossRef] [Scilit]
  13. Storch, M.; Fath, J.P.; Sieg, J.; Vrankovic, D.; Krupp, C.; Spier, B.; Riedel, R. Temperature and lithium concentration gradient caused inhomogeneous plating in large-format lithium-ion cells. J. Energy Storage 2021, 41, 102887. [Google Scholar] [CrossRef] [Scilit]
  14. Wu, W.; Wu, W.; Wang, S. Thermal optimization of composite PCM based large-format lithium-ion battery modules under extreme operating conditions. Energy Convers. Manag. 2017, 153, 22–33. [Google Scholar] [CrossRef] [Scilit]
  15. Mahek, M.K.; Ramadan, M.; bin Dol, S.S.; Ghazal, M.; Alkhedher, M. A comprehensive review of thermoelectric cooling technologies for enhanced thermal management in lithium-ion battery systems. Heliyon 2024, 10, e40649. [Google Scholar] [CrossRef] [Scilit]
  16. Fayaz, H.; Afzal, A.; Samee, A.M.; Soudagar, M.E.M.; Akram, N.; Mujtaba, M.A.; Jilte, R.D.; Islam, T.; Ağbulut, Ü.; Saleel, C.A. Optimization of thermal and structural design in lithium-ion batteries to obtain energy efficient battery thermal management system (BTMS): A critical review. Arch. Comput. Methods Eng. 2022, 29, 129–194. [Google Scholar] [CrossRef] [Scilit]
  17. Boretti, A. Advanced Battery Thermal Management: A Review of Materials, Cooling Systems, and Intelligent Control for Safety and Performance. Energy Storage 2025, 7, e70273. [Google Scholar] [CrossRef] [Scilit]
  18. Nieto, N.; Díaz, L.; Gastelurrutia, J.; Alava, I.; Blanco, F.; Ramos, J.C.; Rivas, A. Thermal modeling of large format lithium-ion cells. J. Electrochem. Soc. 2012, 160, A212. [Google Scholar] [CrossRef] [Scilit]
  19. Hosseinzadeh, E.; Marco, J.; Jennings, P. Combined electrical and electrochemical-thermal model of parallel connected large format pouch cells. J. Energy Storage 2019, 22, 194–207. [Google Scholar] [CrossRef] [Scilit]
  20. Hou, M.; Hu, Y.; Zhang, J.; Cao, H.; Wang, Z. Development of electrochemical-thermal modelling for large-format Li-ion battery. Electrochim. Acta 2020, 347, 136280. [Google Scholar] [CrossRef] [Scilit]
  21. Wu, B.; Li, Z.; Zhang, J. Thermal design for the pouch-type large-format lithium-ion batteries: I. Thermo-electrical modeling and origins of temperature non-uniformity. J. Electrochem. Soc. 2014, 162, A181. [Google Scholar] [CrossRef] [Scilit]
  22. Samba, A.; Omar, N.; Gualous, H.; Capron, O.; Van den Bossche, P.; Van Mierlo, J. Impact of tab location on large format lithium-ion pouch cell based on fully coupled tree-dimensional electrochemical-thermal modeling. Electrochim. Acta 2014, 147, 319–329. [Google Scholar] [CrossRef] [Scilit]
  23. Zhao, W.; Luo, G.; Wang, C.Y. Effect of tab design on large-format Li-ion cell performance. J. Power Sources 2014, 257, 70–79. [Google Scholar] [CrossRef] [Scilit]
  24. Rieger, B.; Erhard, S.V.; Kosch, S.; Venator, M.; Rheinfeld, A.; Jossen, A. Multi-dimensional modeling of the influence of cell design on temperature, displacement and stress inhomogeneity in large-format lithium-ion cells. J. Electrochem. Soc. 2016, 163, A3099. [Google Scholar] [CrossRef] [Scilit]
  25. Kosch, S.; Rheinfeld, A.; Erhard, S.V.; Jossen, A. An extended polarization model to study the influence of current collector geometry of large-format lithium-ion pouch cells. J. Power Sources 2017, 342, 666–676. [Google Scholar] [CrossRef] [Scilit]
  26. Lee, J.J.; Kim, J.S.; Lee, D.C.; Chang, H.; Kim, C.W. Design optimization of tab attachment positions and cell aspect ratio to minimize temperature difference in 45-Ah LFP large-format lithium-ion pouch cells. Appl. Therm. Eng. 2021, 182, 116143. [Google Scholar] [CrossRef] [Scilit]
  27. Von Kessel, O.; Hoehl, T.; Heugel, P.; Brauchle, F.; Vrankovic, D.; Birke, K.P. Electrochemical-mechanical parameterization and modeling of expansion, pressure, and porosity evolution in NMC811∣ SiOx-graphite lithium-ion cells. J. Electrochem. Soc. 2023, 170, 090534. [Google Scholar] [CrossRef] [Scilit]
  28. Li, S.; Rawat, S.K.; Zhu, T.; Offer, G.J.; Marinescu, M. Python-based equivalent circuit network (pyecn) modelling framework for lithium-ion batteries: Next generation open-source battery modelling framework for lithium-ion batteries. engrXiv 2023. [Google Scholar] [CrossRef] [Scilit]
  29. Li, S.; Zhang, C.; Zhao, Y.; Offer, G.J.; Marinescu, M. Effect of thermal gradients on inhomogeneous degradation in lithium-ion batteries. Commun. Eng. 2023, 2, 74. [Google Scholar] [CrossRef] [Scilit]
  30. Kang, S.D.; Chueh, W.C. Galvanostatic intermittent titration technique reinvented: Part I. A critical review. J. Electrochem. Soc. 2021, 168, 120504. [Google Scholar] [CrossRef] [Scilit]
  31. Zhu, T.; Tomlin, R.; Garcia, C.; Rawat, S.; Holland, T.; Offer, G.; Marinescu, M. Lithium-ion battery model parametrisation: BatPar an all-in-one toolkit for equivalent circuit models. J. Energy Storage 2024, 92, 112220. [Google Scholar] [CrossRef] [Scilit]
  32. Eddahech, A.; Briat, O.; Vinassa, J.M. Thermal characterization of a high-power lithium-ion battery: Potentiometric and calorimetric measurement of entropy changes. Energy 2013, 61, 432–439. [Google Scholar] [CrossRef] [Scilit]
  33. Zhang, X.; Klein, R.; Subbaraman, A.; Chumakov, S.; Li, X.; Christensen, J.; Linder, C.; Kim, S.U. Evaluation of convective heat transfer coefficient and specific heat capacity of a lithium-ion battery using infrared camera and lumped capacitance method. J. Power Sources 2019, 412, 552–558. [Google Scholar] [CrossRef] [Scilit]
  34. Demuynck, J.; Bosteels, D.; De Paepe, M.; Favre, C.; May, J.; Verhelst, S. Recommendations for the new WLTP cycle based on an analysis of vehicle emission measurements on NEDC and CADC. Energy Policy 2012, 49, 234–242. [Google Scholar] [CrossRef] [Scilit]
  35. Zhu, T.; Kirca, M.; Zhou, S.; Dinh, T.; McGordon, A. Thermal Management for Electric Motorcycles—Multi-Scale Modelling and Battery Thermal Design Evaluation. Appl. Sci. 2025, 15, 2713. [Google Scholar] [CrossRef] [Scilit]
Figure 1. Schematic diagram of the modeling method.
Batteries 12 00047 g001
Figure 2. Experimental setup of the parametrization tests.
Batteries 12 00047 g002
Figure 3. Electrical validation of the ECN model.
Batteries 12 00047 g003
Figure 4. Thermal validation of the ECN model: (a) temperature comparison at the end of discharge under different C rates, (b) temperature evolution during discharge under a 5C rate.
Batteries 12 00047 g004
Figure 5. Tab geometry and welding methods: (a) three-point welding, (b) one-point welding.
Batteries 12 00047 g005
Figure 6. Cell thermal management configurations.
Batteries 12 00047 g006
Figure 7. Base case simulation results: (a) cell voltage and current, (b) current density distribution on the electrodes, (c) net heat flux distribution on the electrodes, (d) net heat flux distribution on the current collectors, (e) temperature distribution on the electrodes, (f) temperature distribution on the current collectors, (g) spatial average cell temperature, (h) spatial standard deviation of cell temperature. (bf) is taken at the final simulation time and at the mid-plane of the cell thickness.
Batteries 12 00047 g007aBatteries 12 00047 g007b
Figure 8. Comparative results obtained by varying cell design factors: 3D temperature distribution and thermal statistical metrics.
Batteries 12 00047 g008aBatteries 12 00047 g008b
Table 1. Specifications of the reference cell.
ParameterValueParameterValue
Cathode geometry184 mm × 60 mm × 26.6 μmAnode geometry189 mm × 62 mm × 33 μm
Cathode layers21Anode layers22
Cathode density3200 kg/m3Anode density1600 kg/m3
Cathode specific heat capacity1.3 kJ/kg/KAnode specific heat capacity1.4 kJ/kg/K
Cathode thermal conductivity1.58 W/mKAnode thermal conductivity1.04 W/mK
Positive current collector materialAluminumNegative current collector materialCopper
Positive current collector thickness15 μmNegative current collector thickness10 μm
Separator density1017 kg/m3Separator thermal conductivity0.34 W/mK
Separator specific heat capacity1.978 kJ/kg/KSeparator thickness12 μm
Positive tab/weld materialAluminumNegative tab/weld materialCopper
Positive tab geometry33 mm × 55 mm × 0.4 mmNegative tab geometry33 mm × 55 mm × 0.4 mm
Positive weld geometry *6 mm × 10 mm × 0.54 mmNegative weld geometry *6 mm × 10 mm × 0.69 mm
Note. * The weld geometry refers to the dimensions of a single weld. As shown in Figure 1, each tab contains three such welds.
Table 2. Measured cell-level parameters.
ParameterValueParameterValue
Cell-level R0 *4.19 mOhmCell-level Capacity *4.4 Ah
Cell-level R1 *5.72 mOhmCell-level Es *4.18 V
Cell-level R2 *31.2 mOhmCell-level dEs/dT *0.0899 mV/K
Cell-level C1 *2710 FEquivalent heat transfer coefficient of stack surface under natural air7.1 W/m2/K
Cell-level C2 *20,700 FEquivalent heat transfer coefficient of tab surface under natural air31.2 W/m2/K
Note. * These cell-level parameters were measured over the ranges of 5–45 °C and 0–100% SOC. For simplicity, only the values at 25 °C and 100% SOC are listed.
Disclaimer/Publisher’s Note: The statements, opinions and data contained in all publications are solely those of the individual author(s) and contributor(s) and not of MDPI and/or the editor(s). MDPI and/or the editor(s) disclaim responsibility for any injury to people or property resulting from any ideas, methods, instructions or products referred to in the content.