


Abstract
Electrochemical energy storage systems are increasingly utilized across a wide range of applications, from small-scale consumer electronics to large-scale utility systems providing grid services. Among these, lithium-ion batteries have emerged as a preferred solution because of their high efficiency and power density. However, accurately modeling the behavior of Li-ion cells remains a critical and complex task. It is particularly important to determine the open-circuit voltage (OCV), which is an essential component of most battery models. This paper presents the results of an experimental comparison of three common methods for measuring and estimating the OCV of lithium-ion cells with nickel–manganese–cobalt cathodes. Each method is described in detail, with particular attention given to the testing procedures and influence of the experimental parameters on the accuracy of the resulting OCV curves. The outcomes are then analyzed and compared to highlight the strengths, limitations, and practical considerations associated with each approach. The findings of this work will assist researchers and practitioners in selecting the most appropriate OCV measurement techniques for various applications, especially where time constraints or experimental limitations must be considered.
1. Introduction
Electrochemical storage systems are becoming increasingly vital, particularly for powering advanced, smaller devices like computers and mobile phones. They are also crucial for power tools, electric vehicles, and large-scale renewable-energy storage devices [1]. Lithium-ion batteries are becoming more popular in the electric vehicle (EV) industry because their energy density surpasses that of other types of electrochemical storage devices [2]. In electrochemical storage systems, although the cost of lithium-ion storage technology is higher than that of the alternatives, it remains a more attractive option because of its superior power density and high efficiency. These advantages often outweigh its shorter lifespan relative to technologies such as the vanadium redox flow battery [3].
When designing battery systems, creating an accurate model is crucial. A well-developed battery model helps in predicting its performance under various conditions. Some models focus on estimating the state of charge (SOC) using approaches such as physical electrochemical models [4], electrical equivalent circuit models [5], or data-driven models [6]. These models are essential for understanding battery performance and ensuring efficient operation in various applications. Other models concentrate on cell aging, aiming to determine the usable capacity and characterize cell behavior across different life stages using characterization tests [7,8]. In some cases, acoustic emission signals are used for state of health (SOH) estimation [9]. Other models focus more on mechanical-chemical degradation [10], which is vital for predicting the battery lifespan and optimizing maintenance strategies. Moreover, some models focus on safety to prevent thermal runaway in batteries because they are becoming increasingly popular in commercial devices [11]. Lastly, there are models designed to optimize battery usage in grid-connected storage by considering different scenarios, such as optimizing the usage of cells to achieve lower aging, by considering different market services such as arbitrage [12].
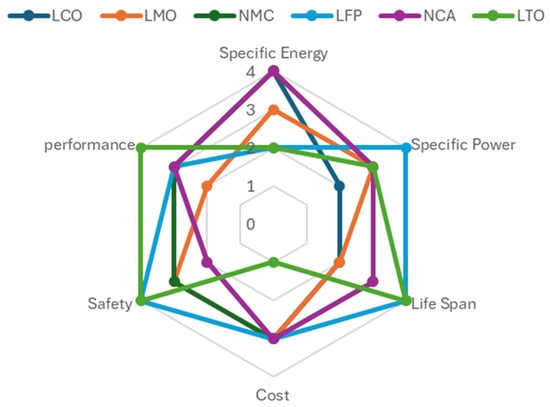
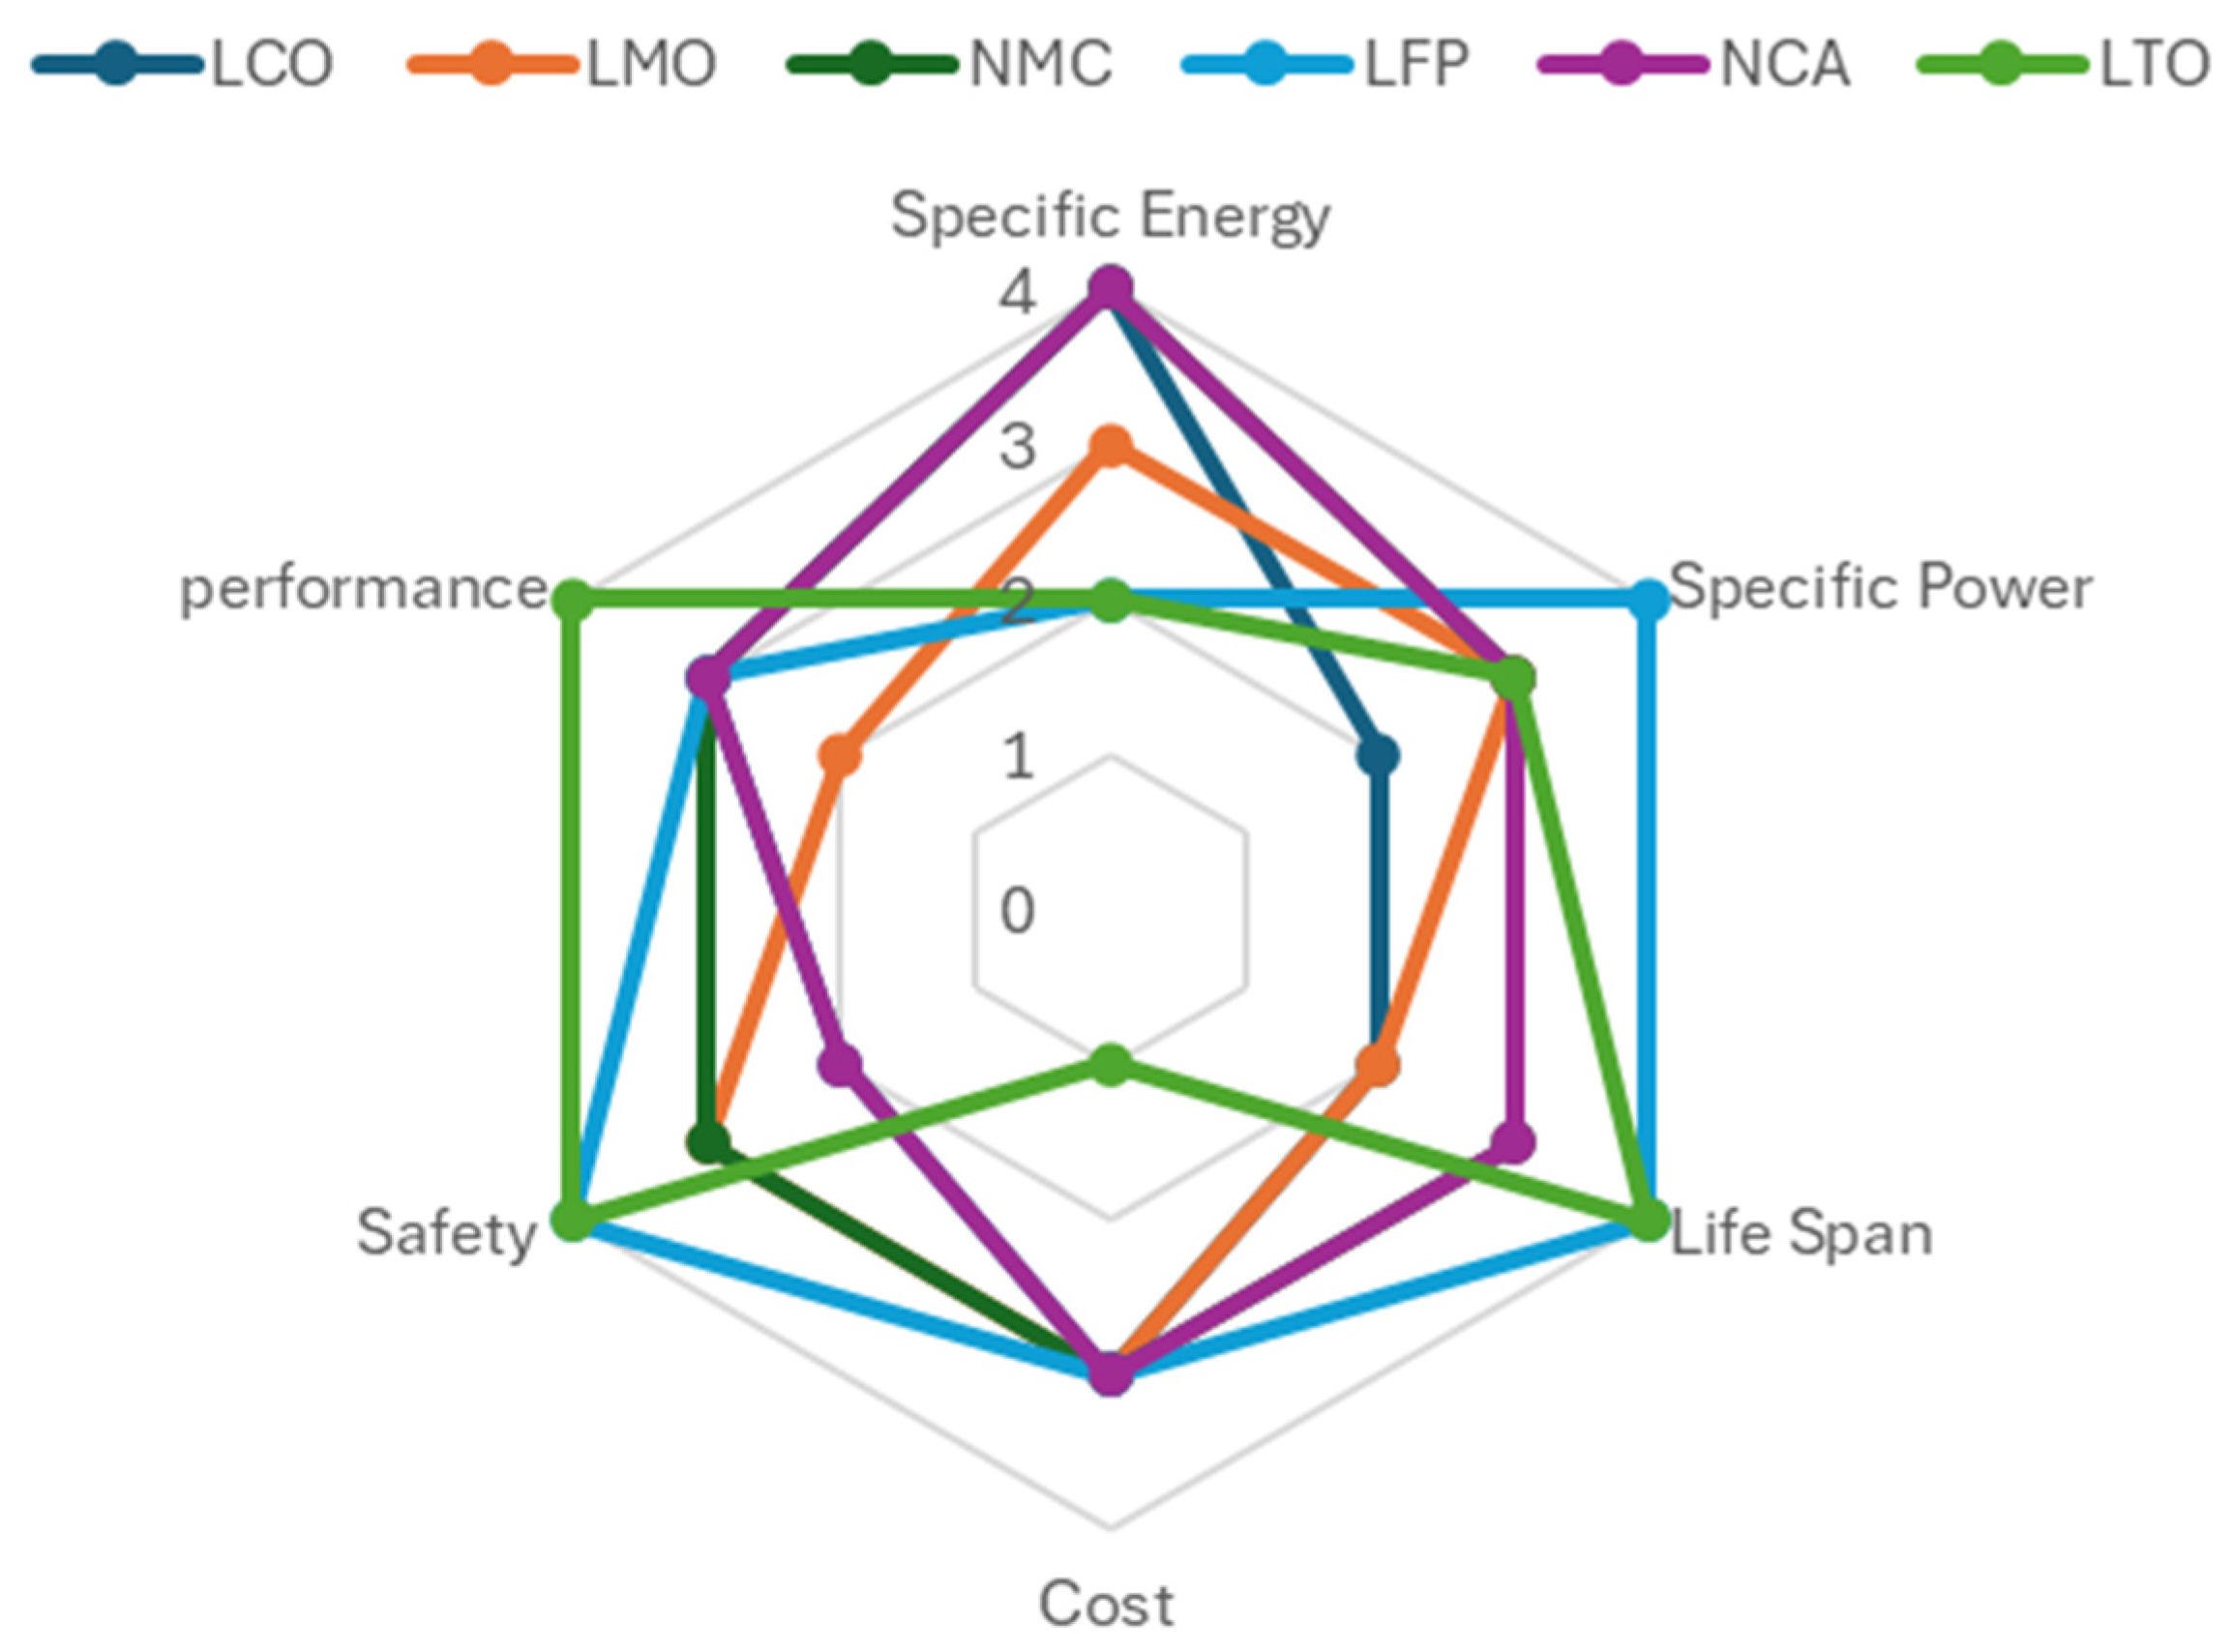
However, not all lithium batteries are identical. Lithium batteries come in a variety of chemistries, each with unique characteristics that influence their behavior. Among lithium-ion batteries, various chemistries—such as lithium cobalt oxide (LCO), lithium manganese oxide (LMO), nickel–manganese–cobalt (NMC), lithium nickel–cobalt–aluminum oxides (NCA), and lithium iron phosphate (LFP)—have emerged and are expected to remain significant in the future. These chemistries differ in terms of their specific energy, specific power, lifespan, cost, efficiency, and safety characteristics. A comparison of their different characteristics has been provided in Figure 1 using the data provided in [13].
Figure 1.
Characteristics of different chemistries [13].
Among the commercially dominant lithium-ion chemistries, NMC batteries are widely used because of their balanced energy density, power capability, and lifetime, particularly in electric vehicle and stationary storage applications. However, the accurate experimental determination of the OCV in NMC cells presents challenges that differ from those encountered with other chemistries such as LFP and LCO. Unlike LFP, which exhibits pronounced voltage plateaus, NMC cells show a steeper and more continuous OCV–SOC relationship, making the measured OCV more sensitive to the relaxation time and experimental conditions [14]. Recent studies have shown that the experimentally measured OCV in NMC cells often represents a pseudo-equilibrium voltage that depends strongly on the rest duration, SOC step size, and charge or discharge direction, with limited accuracy gains beyond certain relaxation times [15]. Furthermore, voltage hysteresis in graphite–NMC systems leads to non-unique OCV values at identical SOC levels, requiring a careful experimental definition of the OCV used for modeling [16]. In addition, material-level modifications of NMC-based cathodes, such as AlF3 surface coatings, have been shown to improve the voltage stability by reducing interfacial side reactions and polarization, indicating that electrode–electrolyte interactions can further influence the measured voltage behavior [17]. These factors highlight the need for a chemistry-specific evaluation of the OCV measurement procedures for NMC batteries.
One of the key elements in modeling batteries with different chemistries is the OCV, which is particularly useful for SOC estimation. Determining the OCV is regarded as a simple yet precise method for determining the SOC, making it indispensable in various modelling approaches [18]. In models focused on aging, OCV measurement is one of the key parameters [7]. Furthermore, in safety-oriented models aimed at preventing hazards like thermal runaway, the OCV is essential for estimating the overpotential heat by comparing it with the cell voltage [11]. Thus, the OCV serves as a foundational parameter in both performance and safety assessments of batteries.
The experimental measurement of the OCV is influenced by several factors, including the temperature, SOC range, and cell aging. The sensitivities of individual experiments to these factors may vary, with certain experimental conditions being more appropriate for specific battery chemistries than others. Consequently, it is crucial to thoroughly consider these sensitivities when designing and conducting experiments to ensure that the results are as reliable and accurate as possible [19].
Numerous studies have attempted to compare different methods for experimentally measuring the OCV. However, a comprehensive comparison that specifically focuses on the experimental procedures themselves is still needed. For instance, studies such as [19] have examined the impact of various OCV tests on SOC estimation.
The novelty of this work lies in its systematic comparison of different OCV measurement methods and their associated accuracies, with the explicit aim of providing practical guidelines for the design of OCV tests for NMC cells. Rather than focusing solely on methodological performances, this paper offers actionable insights to assist future researchers and practitioners in selecting appropriate test parameters based on the application requirements, test complexity, duration, energy consumption, and suitability for online or offline implementation. Furthermore, the robustness of the proposed guidelines was verified by conducting experiments on three different cells, thereby reducing the dependence of the conclusions on cell-specific characteristics and enhancing the general applicability of the results.
2. OCV Measurement
The OCV is equal to the battery terminal voltage when there is no polarization effect or voltage drop due to internal impedance [20]. The OCV is related to the battery SOC and temperature, and this relationship varies from one chemistry to another. Moreover, it has been proven that the OCV will change as the battery degrades [21]. The OCV should be measured after a long relaxation time during which the voltage reaches its equilibrium point as a result of the polarization effect. The required relaxation time can vary with the chemistry and has a huge impact on the accuracy of the OCV. A longer relaxation time produces a more accurate OCV measurement. Nevertheless, an excessively long window can lead to changes in the OCV as a result of temperature changes and/or self-discharge phenomena. For this reason, selecting the optimum relaxation time is a key aspect of this measurement. Shan et al. experimentally showed that the self-discharge can be up to 2 mV/day after the first 24 h [22]. Typically, a 2–4 h rest is considered sufficient [23].
Most researchers have proposed OCV measurement methods that use either a low discharge/charge current or partial discharges and relaxation times. For example, in [24], the OCV was measured using partial discharges corresponding to 5% SOC increments, each followed by a 30 min rest period. To improve the accuracy, other studies have recommended smaller SOC increments—such as 3% steps—as shown in [25]. Furthermore, a variable-step approach has been proposed in some works, wherein finer SOC steps (e.g., 2%) are applied in the 0–10% and 90–100% SOC regions—where the OCV curve exhibits higher dependency on the SOC—while coarser steps (e.g., 5%) are employed in the mid-range SOC interval [22,26]. Each of these methods can be performed in different ways using different test parameters. In this study, the different methods were compared, taking into account the effects of the tuning parameters of each method. In the following, the main techniques will be described before comparing them. These include the “relaxation”, “low current”, and “rated current” tests [14].
3. OCV Measurement Techniques
3.1. Relaxation
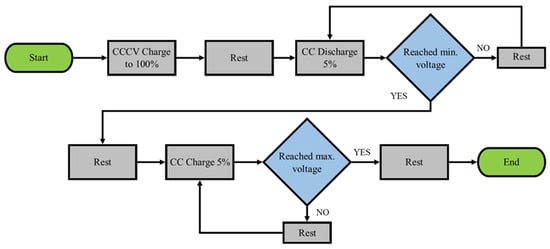
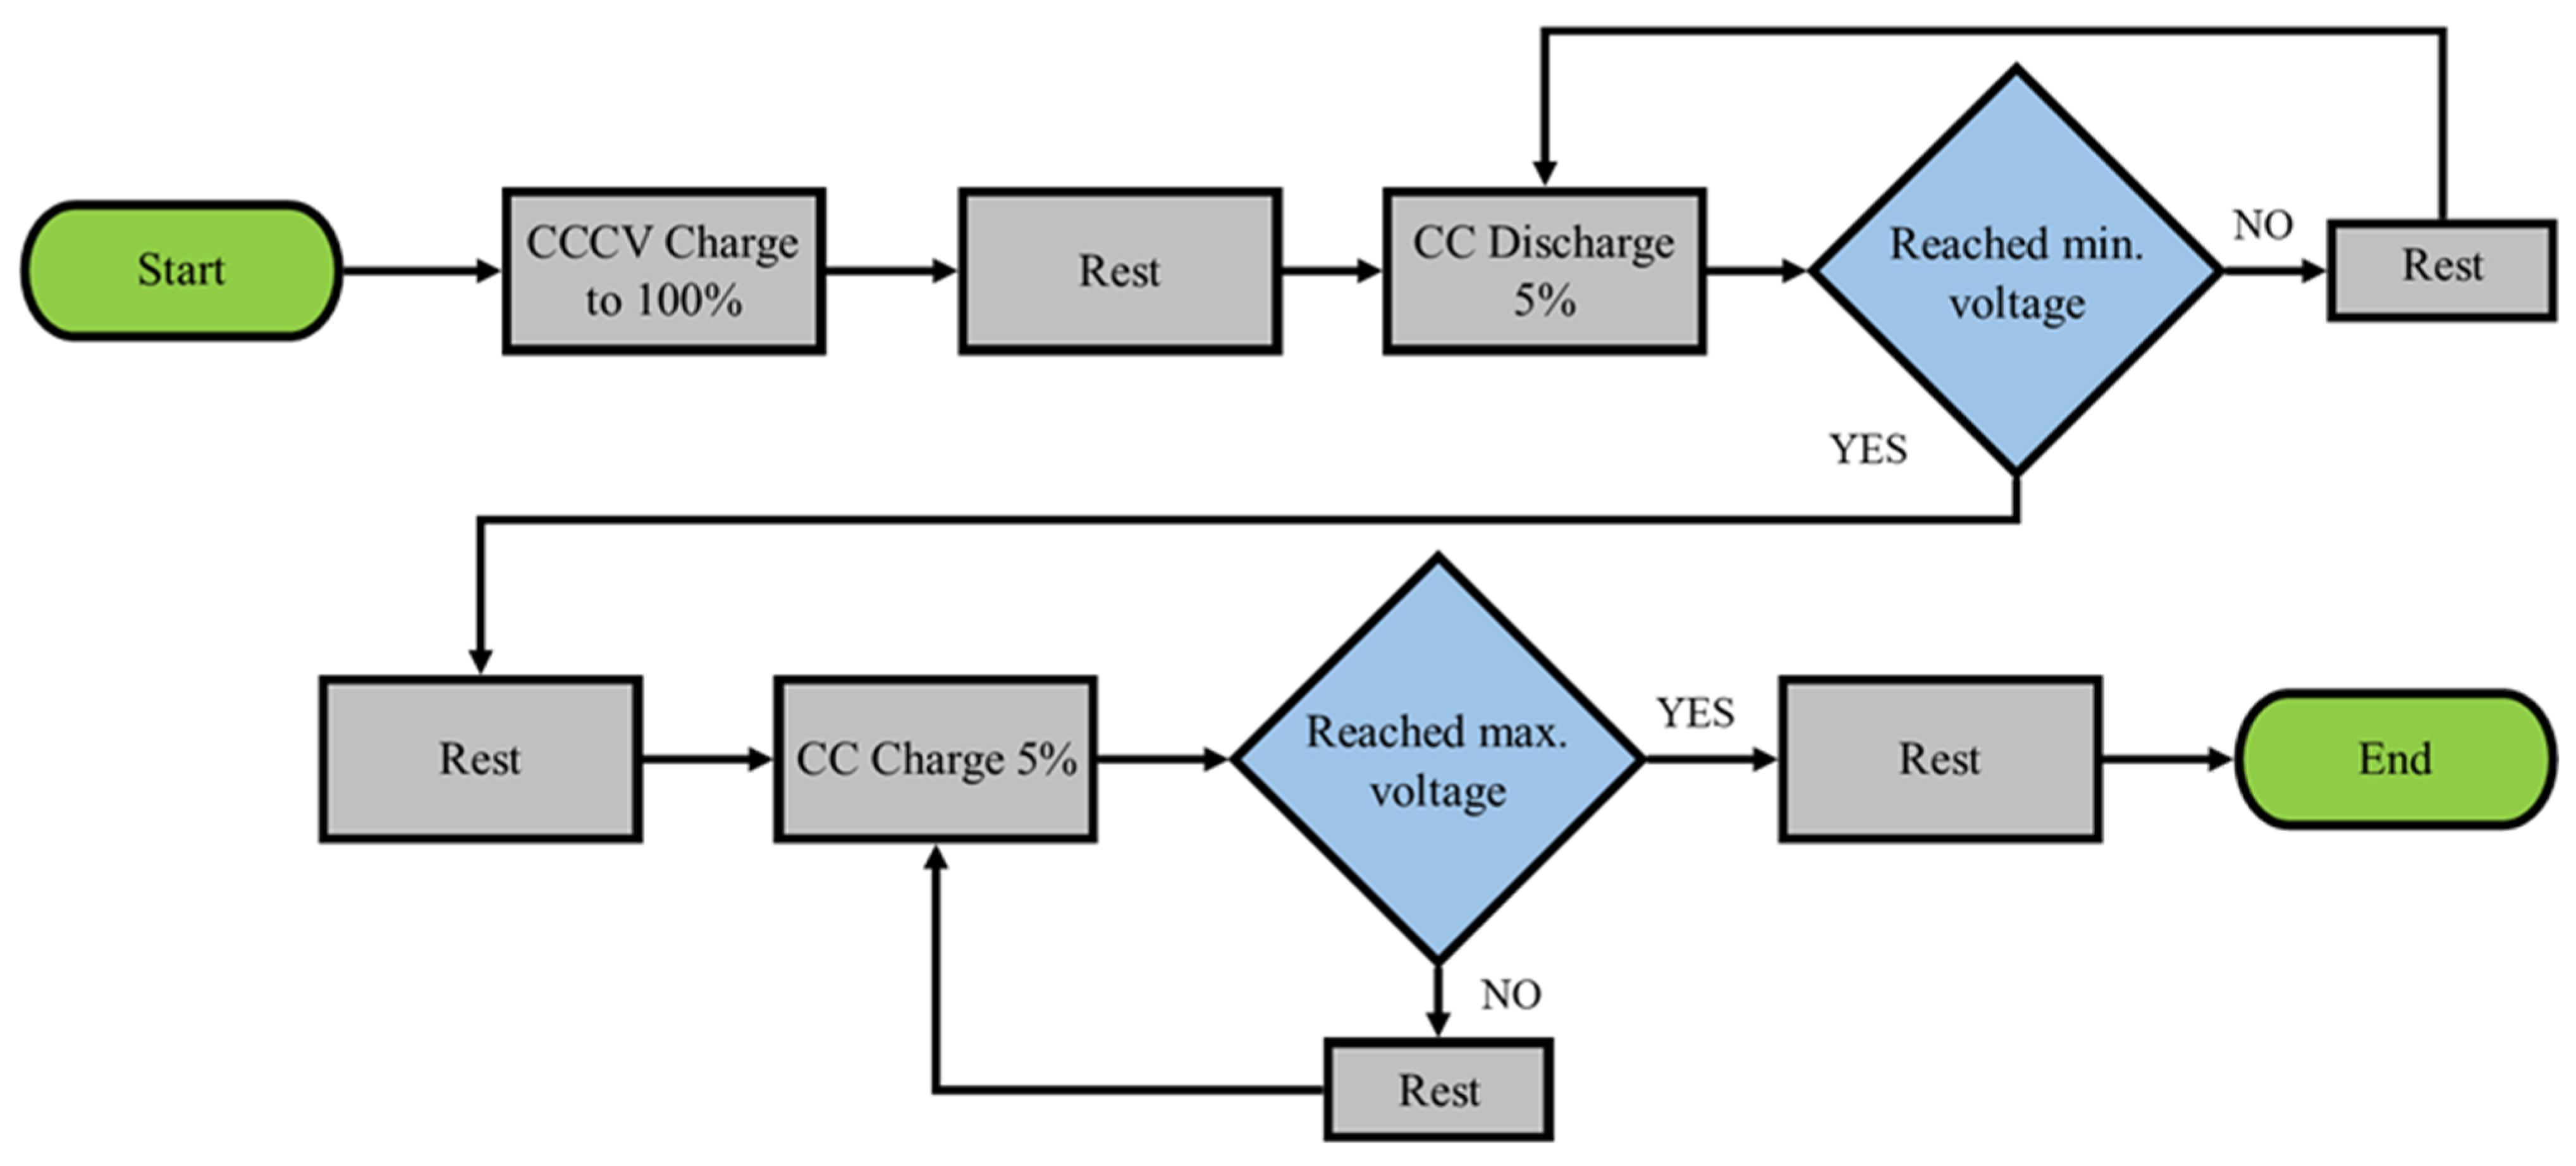
The relaxation method is widely recognized as the most reliable OCV measurement approach. This method involves charging or discharging the battery to predetermined SOC levels, followed by rest periods during which the OCV is directly recorded. The overall procedure is illustrated in Figure 2.
Figure 2.
Relaxation test procedure diagram.
To enable accurate SOC estimation through current integration, the test begins by fully charging the cell to 100% using a constant current–constant voltage (CCCV) protocol. Subsequently, the cell is discharged at a constant current in discrete steps. The accuracy of the OCV–SOC relationship is highly dependent on the number of measurement points, which must be balanced against the total test duration. According to the literature, SOC intervals of 2–5% offer a satisfactory trade-off between resolution and experimental time [24,26]. In this study, 5% SOC steps were selected. After the initial full charge, the cell was discharged in 5% SOC increments using a constant current, with the discharge time as the primary control variable. A voltage cut-off was also applied to prevent a deep discharge. Once the minimum voltage was reached, a final rest period marked the end of the discharge phase. The cell was then recharged using the same 5% SOC step protocol and current magnitude to obtain OCV values during charging.
An essential factor in this experiment was the magnitude of the current used for charging and discharging. To avoid excessive heat generation and ensure thermal stability, a relatively low current of 0.1 C was employed. While lower currents could potentially yield more precise results, they would significantly extend the duration of the experiment.
Each rest period was set to 2 h, in line with findings in the literature suggesting that relaxation durations of 2–4 h are generally sufficient for voltage stabilization [23]. The 2 h interval was chosen to strike a balance between the accuracy and the overall test duration. To evaluate whether the cell reached a relaxed state after 2 h, the voltage difference over the final 5 min of the rest period was calculated. To reduce the impact of measurement noise in this calculation, the voltage difference was not computed directly between two individual points. Instead, each point was represented by the average voltage over a 30 s interval prior to calculating the voltage difference. Therefore, the voltage difference could be calculated as follows:
where and are the numbers of samples in the indicated time intervals; T is the period used to perform the averaging of the signals, which was 30 s; is the end of the rest period, which was 2 h; and is the period used to evaluate the cell voltage relaxation, which was 5 min. To be able to directly compare the charge and discharge curves, the absolute value of the voltage difference was considered.
Based on the chosen parameters, the total duration of the test was estimated by summing the active and passive phases. At 0.1 C, the full charge and discharge cycle required approximately 20 h. Given that there were 21 rest periods during discharge and 20 during charge—each lasting 2 h—the total rest time amounted to 82 h. Therefore, the total estimated duration of the experiment was approximately 102 h.
Because the relaxation method is considered the most direct and reliable approach for determining the OCV, the value obtained using the 5% SOC step size and 2 h rest periods will serve as a reference OCV in this paper, and the errors of the other methods will be calculated using this reference. The rationale for choosing either the charging or discharging OCV curve as a reference will be discussed in detail in the following section.
Two key parameters significantly influence both the accuracy and total duration of the OCV measurement experiment: the SOC step size and rest-period duration. In the baseline test configuration, 5% SOC steps and 2 h rest periods were selected.
The baseline test design parameters were selected to ensure the practical feasibility of completing the experiments on three different cells. The 5% SOC step size was adopted to provide sufficient resolution for capturing the key characteristics of the OCV curve. While this choice may limit the ability to resolve fine details at extreme SOC levels, many practical applications predominantly operate cells within the mid-SOC range. Therefore, the selected SOC increment represents a balanced compromise between the measurement resolution and total test duration. A similar rationale was applied in selecting the 2 h rest period. According to the literature, a rest duration of 1–2 h is sufficient to observe the OCV with voltage deviations that are effectively negligible and below the measurement accuracy of the instrumentation. Therefore, a 2 h rest period was chosen to minimize the overall test duration while still ensuring a reliable estimation of the true OCV [27]. However, because of practical constraints related to the time and energy consumption, this study also investigated the effects of using larger SOC steps and shorter rest durations on the accuracy and reliability of the resulting OCV measurements.
To evaluate the sensitivity of the OCV to the density of SOC points, the measurements were taken at different SOC intervals larger than 5% (i.e., 10%, 15%, and 20%). To find the error of each OCV curve relative to the reference, the obtained OCV of each case was compared with the original OCV measured using the 5% SOC interval. Because data were not directly available for all the points, interpolation was needed. Therefore, a linear interpolation was used to calculate the OCV of each case at the missing SOC points. It is important to note that the error was calculated only at the measurement points.
There are various OCV models (curve expressions) available in the literature to fit an OCV vs. SOC curve. Some are more complex than others, which can make it harder to fit when the number of points is limited. As indicated in [20], each of these models has different sensitivities to the number of obtained points. A 5th-order polynomial function was selected to interpolate the OCV vs. SOC curve. The accuracies of the OCV estimations using different SOC point densities were also evaluated using a 5th-order polynomial function. The errors in each case were calculated separately for the charge and discharge cycles.
Finally, to evaluate the required relaxation time, Equation (1) was used by varying the from 5 to 120 min for all the SOC points available. The error could then be expressed as a percentage as follows:
Thus, it was possible to assess how the relaxation time affected the accuracy of the OCV for different SOC points.
Additionally, it should be noted that all of the error and root mean square error (RMSE) values reported in this paper were normalized with respect to the rated voltage. This normalization enabled the results to be readily extended to higher-capacity and higher-voltage energy-storage systems, thereby enhancing their general applicability.
3.2. Low Current Charge/Discharge Curve
This method relies on the principle that, with a low current, the overpotential on the electrodes is minimized, allowing it to be disregarded. Consequently, the voltage recorded during charging or discharging can be considered to be the OCV. To conduct the test, the cell should first be charged in the CCCV mode until it reaches its full charge. Following this, a rest period is required to allow the charges to diffuse in the electrolyte and the cell temperature to reach ambient conditions. In this study, a 0.5 C current was employed, followed by a 2 h rest interval. The procedure for this test is straightforward. After charging the cell, a CCCV discharge is conducted, followed immediately by a CCCV charge without an additional rest period. To perform the test at different C-rates, the fully charged cell was rested for 2 h, and the procedure was restarted with a new current.
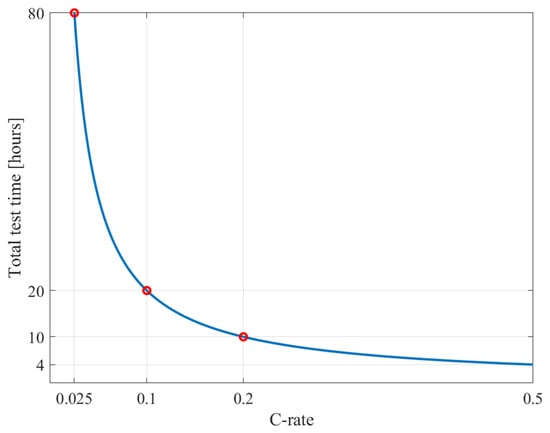
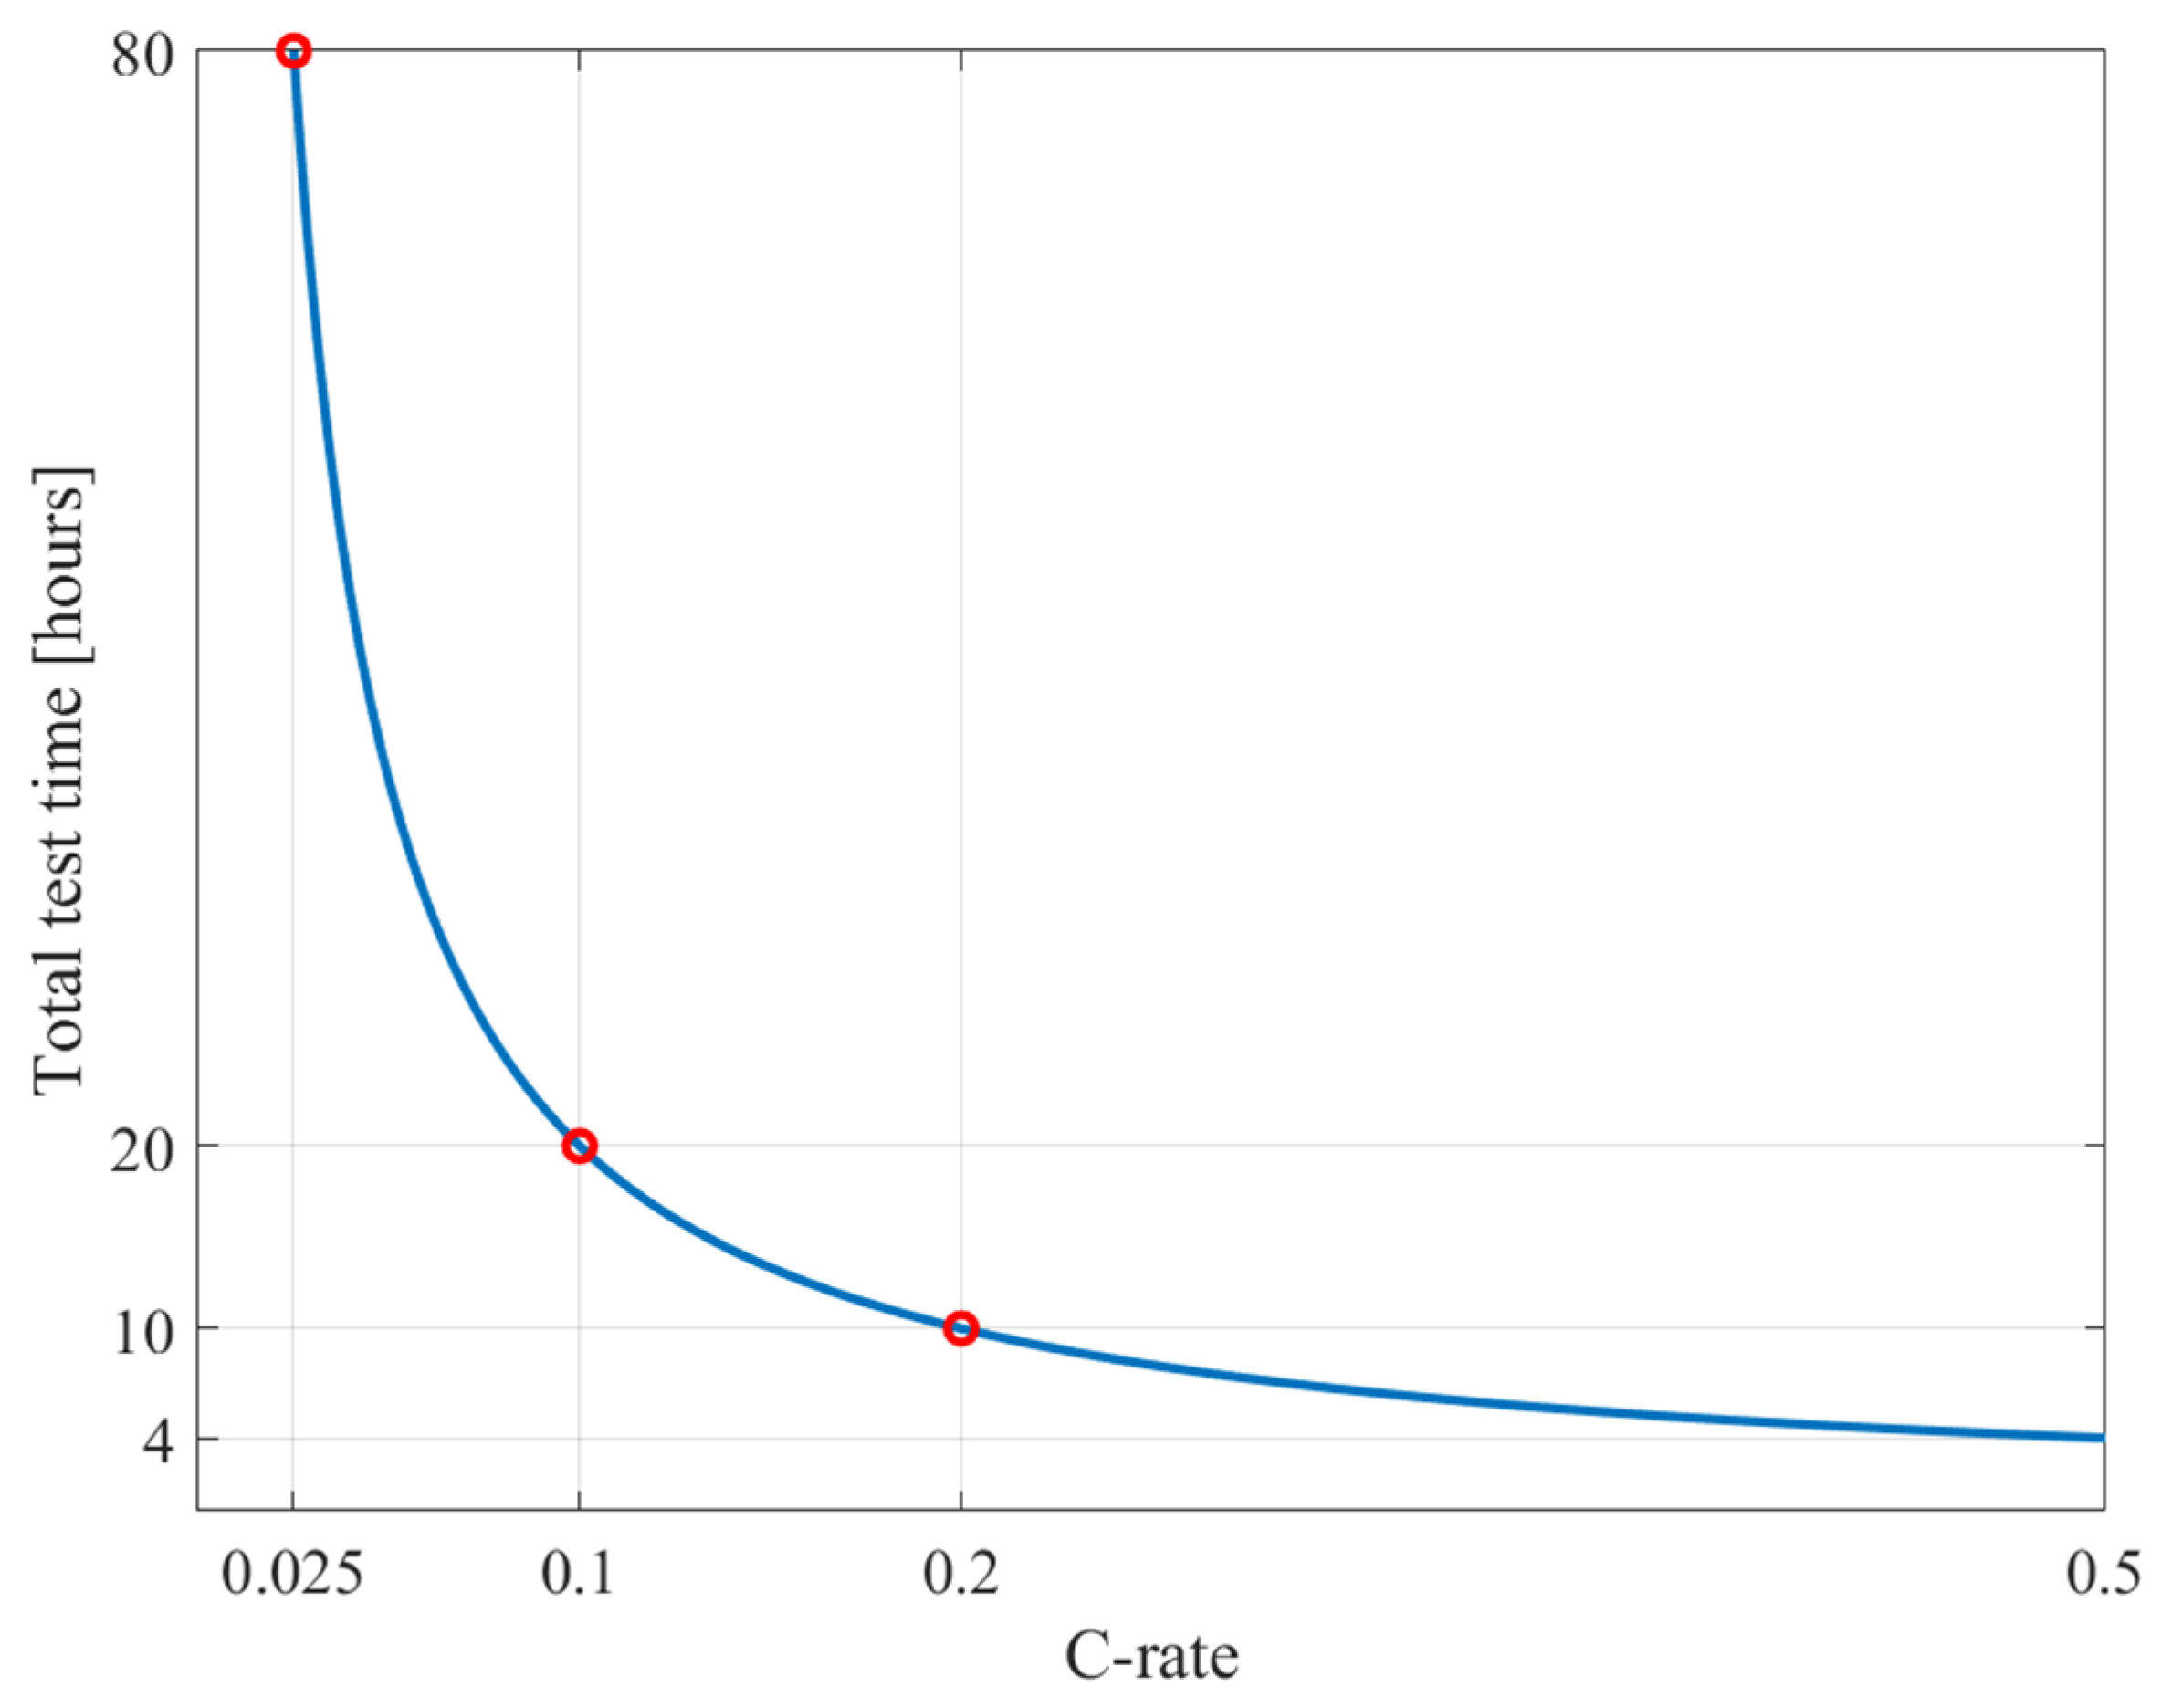
It should be noted that using lower current values results in data that more accurately reflect the true OCV because the overpotential at the electrodes is low, although this also exponentially increases the total duration of the test, as shown in Figure 3. It should also be noted that the estimated time reported does not take into account the time necessary for the CV part of the test, which can differ with the chemistry because of differences in the OCV shape. In this study, three different C-rates (0.025 C, 0.1 C, and 0.2 C) were employed to obtain the OCV curves, enabling a comparative analysis of the trade-off between the measurement accuracy and total test duration. The overall procedure had to be repeated for each current and is illustrated in Figure 4.
Figure 3.
Test time vs. C-rate.
Figure 4.
Low-current test procedure.
Additionally, it should be noted that the error in the OCV obtained from the low-current test was mainly attributable to neglecting the presence of the ohmic voltage drop, which, although reduced by using a low current, could not be completely eliminated. In addition, residual concentration polarization may also have contributed to the observed error.
3.3. Average at Rated Current
Conducting experiments at the rated current is not a widely recognized method for determining the OCV. Although it is not the most accurate approach due to various inherent limitations and potential inaccuracies, it can provide a rough estimation of the OCV while offering some notable advantages. For instance, this method is considerably faster than alternative testing procedures, and the required profile can be easily obtained in operational systems. In other words, the standard operating conditions of many systems can yield a full charge–discharge cycle at a rated current, making it possible to estimate an OCV profile without extensive modifications. Therefore, it is valuable to briefly examine this method as a potential approach. On the other hand, the use of higher currents can introduce inaccuracies in the measured OCV as a result of the increased influence of internal resistance variations across different SOC levels. Additionally, higher currents can lead to greater temperature fluctuations within the cell, further affecting the accuracy of the OCV measurements.
This testing procedure is also simpler than other methods. The overall procedure is illustrated in Figure 5. Following a full charge achieved through a CCCV approach, both discharge and charge phases are conducted at the rated current, without any resting interval between them. A diagram of this test procedure is provided in Figure 5. It is important to note that the resulting charging or discharging curve does not accurately represent the true OCV because significant overpotentials occur at the electrodes. Thus, only the average of the charge and discharge curves is considered. To compute the average of the charge and discharge curves, both curves are first linearly interpolated onto a common SOC vector with a resolution of 0.1%. This step is necessary because the SOC points of the two curves are not necessarily aligned. Owing to the high sampling rate during the test, the error introduced by this interpolation is negligible. Finally, considering that the two curves (i.e., charge and discharge) are obtained at the same current rate, the OCV is obtained as the arithmetic mean of the two interpolated curves.
Figure 5.
Rated-current test procedure.
4. Test Setup
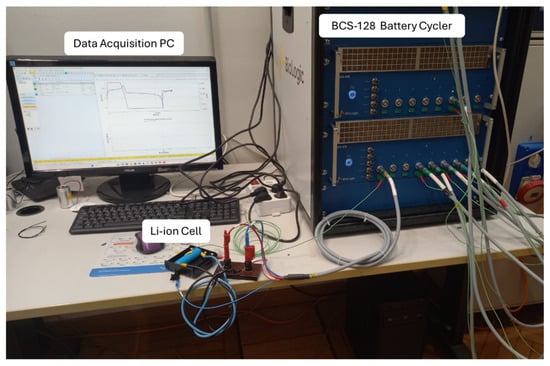
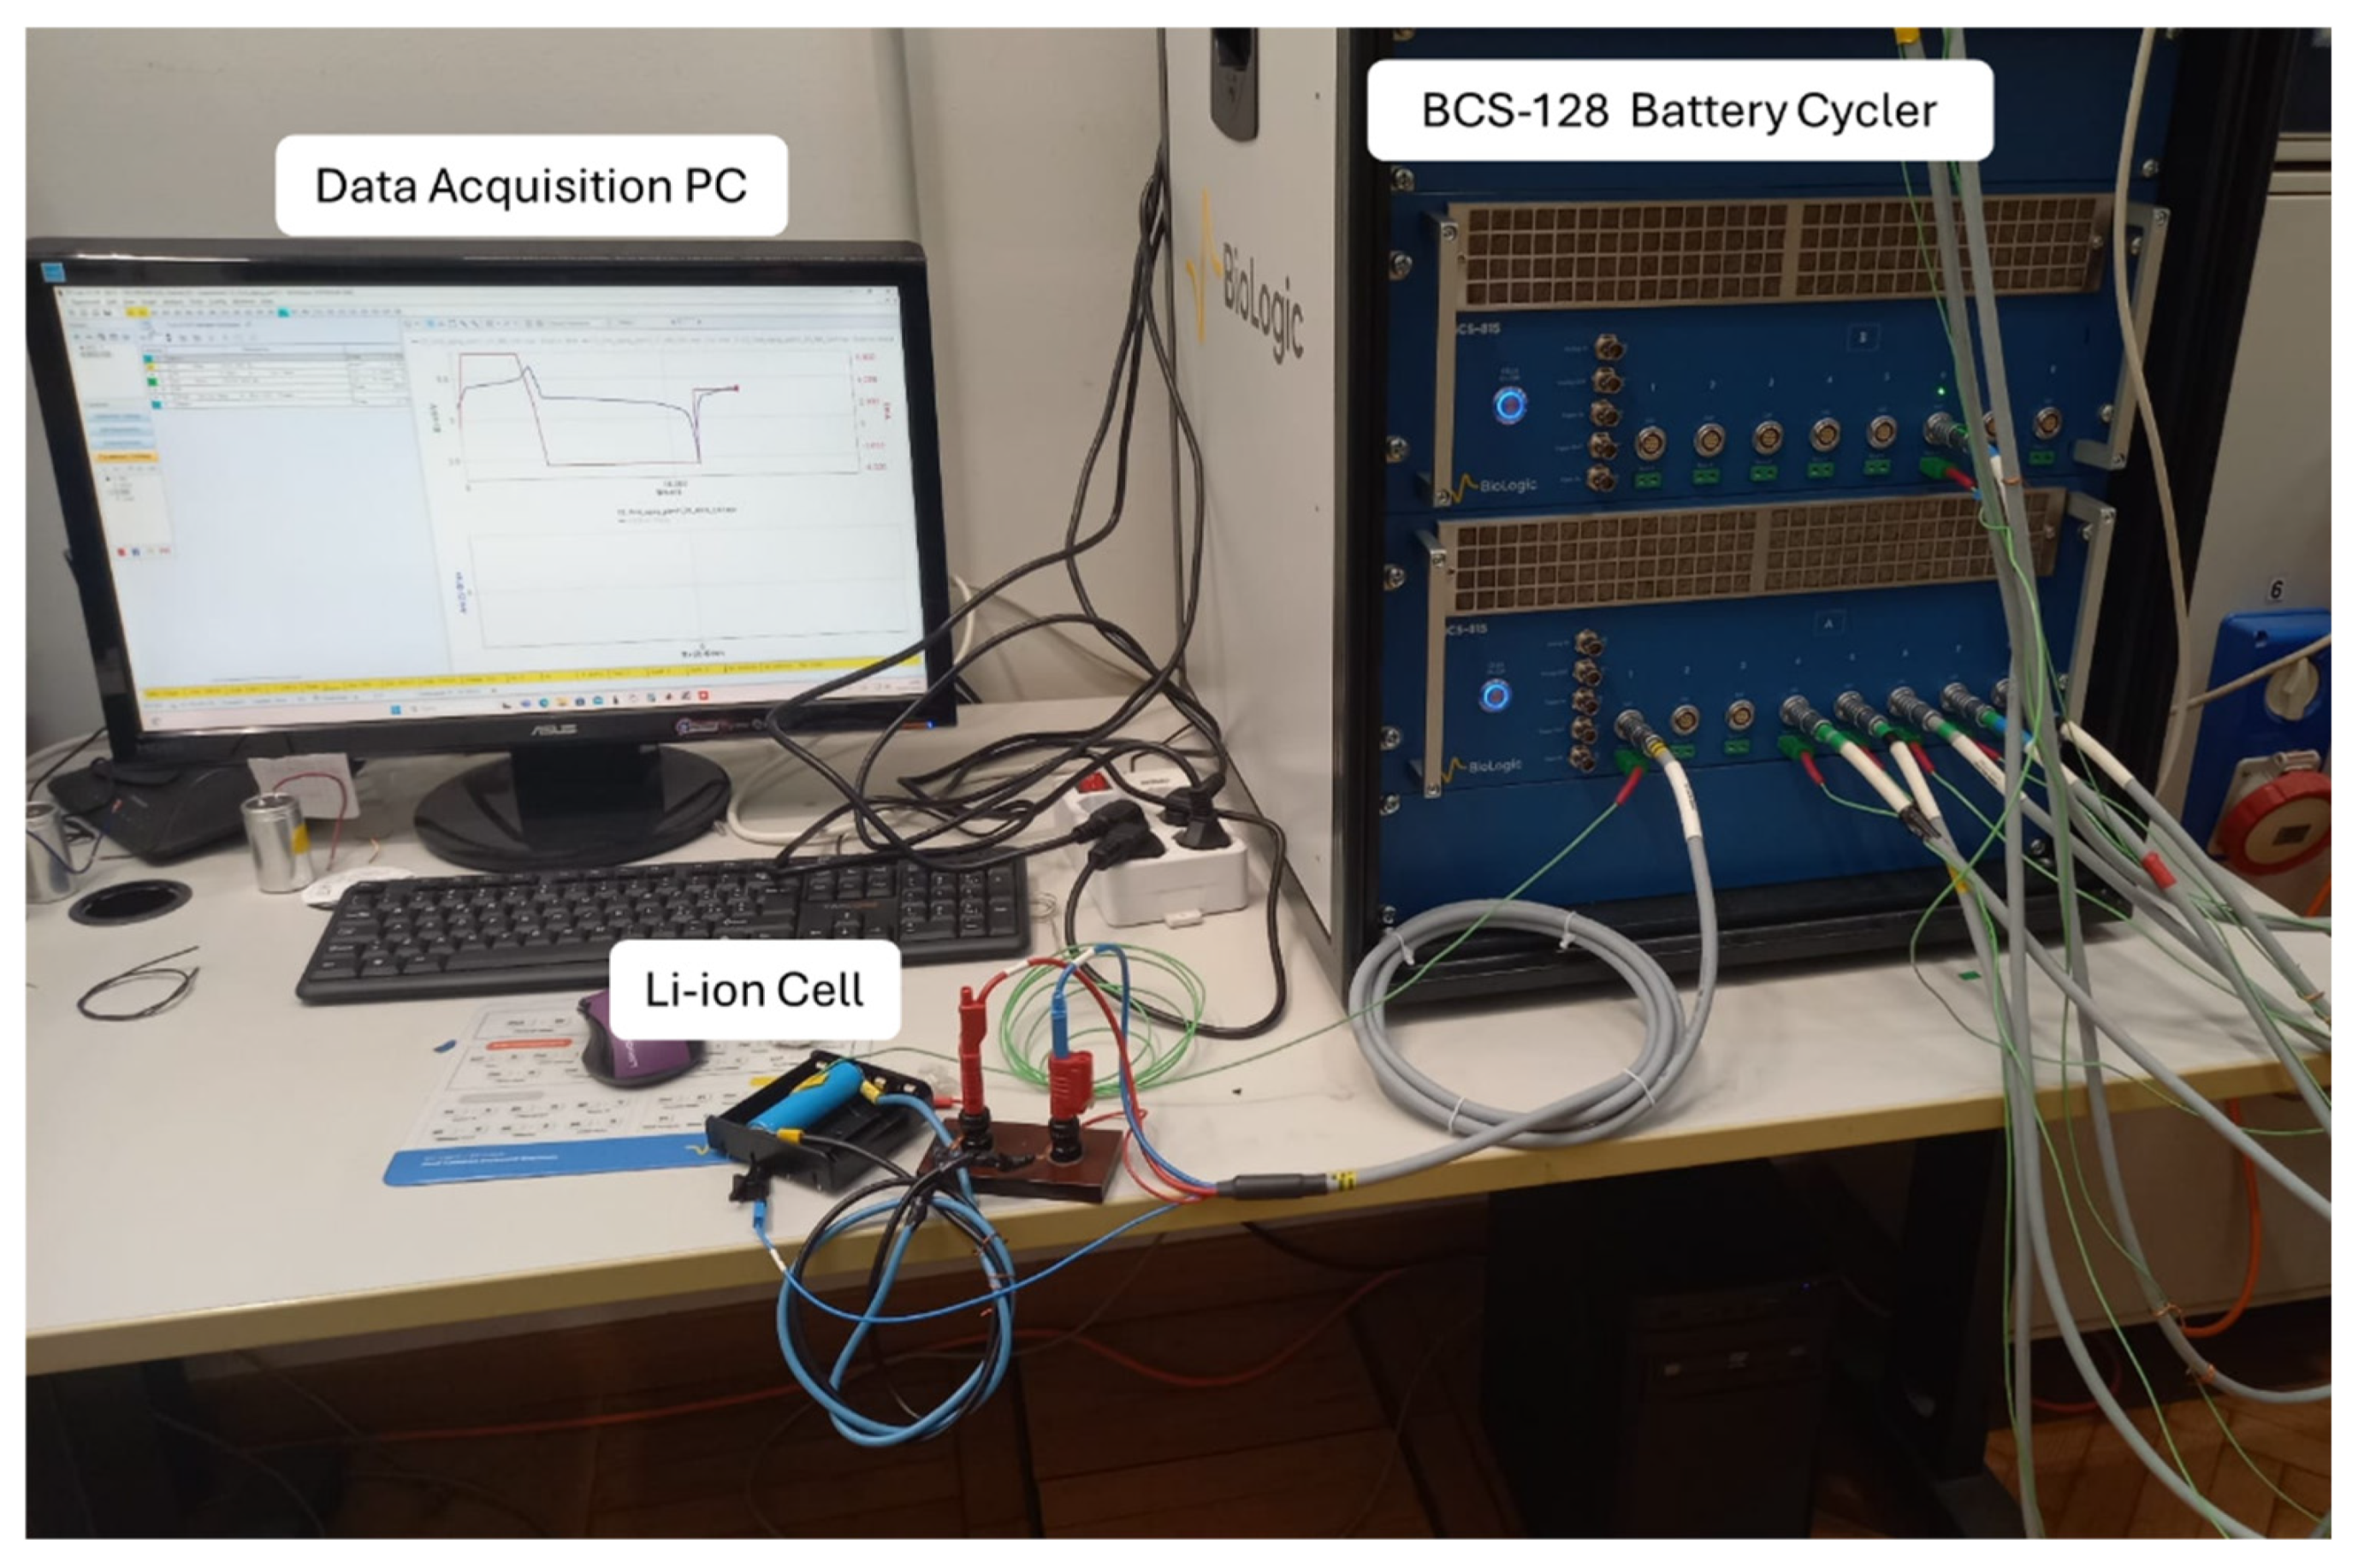
The test bench used in this study consisted of a BCS-128 Biologic cycler (Biologic, Seyssinet-Pariset, France) with an acquisition time of 0.1 s, which was connected to the PC via a LAN connection. The voltage measurement had an accuracy of 0.3 mV ± 0.01% of the setting. To avoid voltage drops caused by wire resistance, separate wires were directly welded to the battery for measurement. Moreover, the current measurement accuracy for a range of 1 A (i.e., the range used for low-current tests at 0.025 C and 0.1 C) was 0.05% of the value ±0.015% of the full-scale range (FSR). For the 10 A range (used for all the other tests). It was 0.3% of the value ±0.04% of the FSR. Finally, the temperature was measured using a type-k thermocouple that was fastened to the cylindrical cells using electrical tape, and the accuracy was ±2 °C. Figure 6 shows the test setup used for all the experiments. The primary data for the three Li-ion NMC cells used in the test are reported in Table 1. It is worth mentioning that all three tested cells (CL1, CL2, and CL3) were new.
Figure 6.
Test setup.
Table 1.
Characteristics of the tested cells.
5. Test Results and Comparison of the Methods
5.1. Relaxation
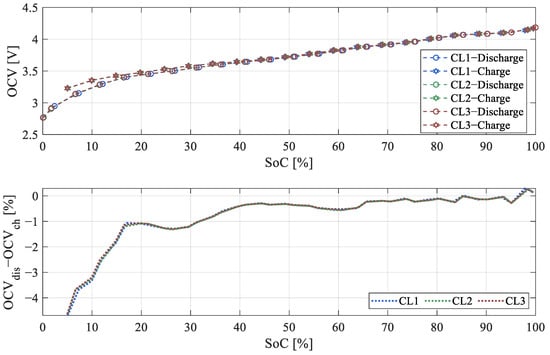
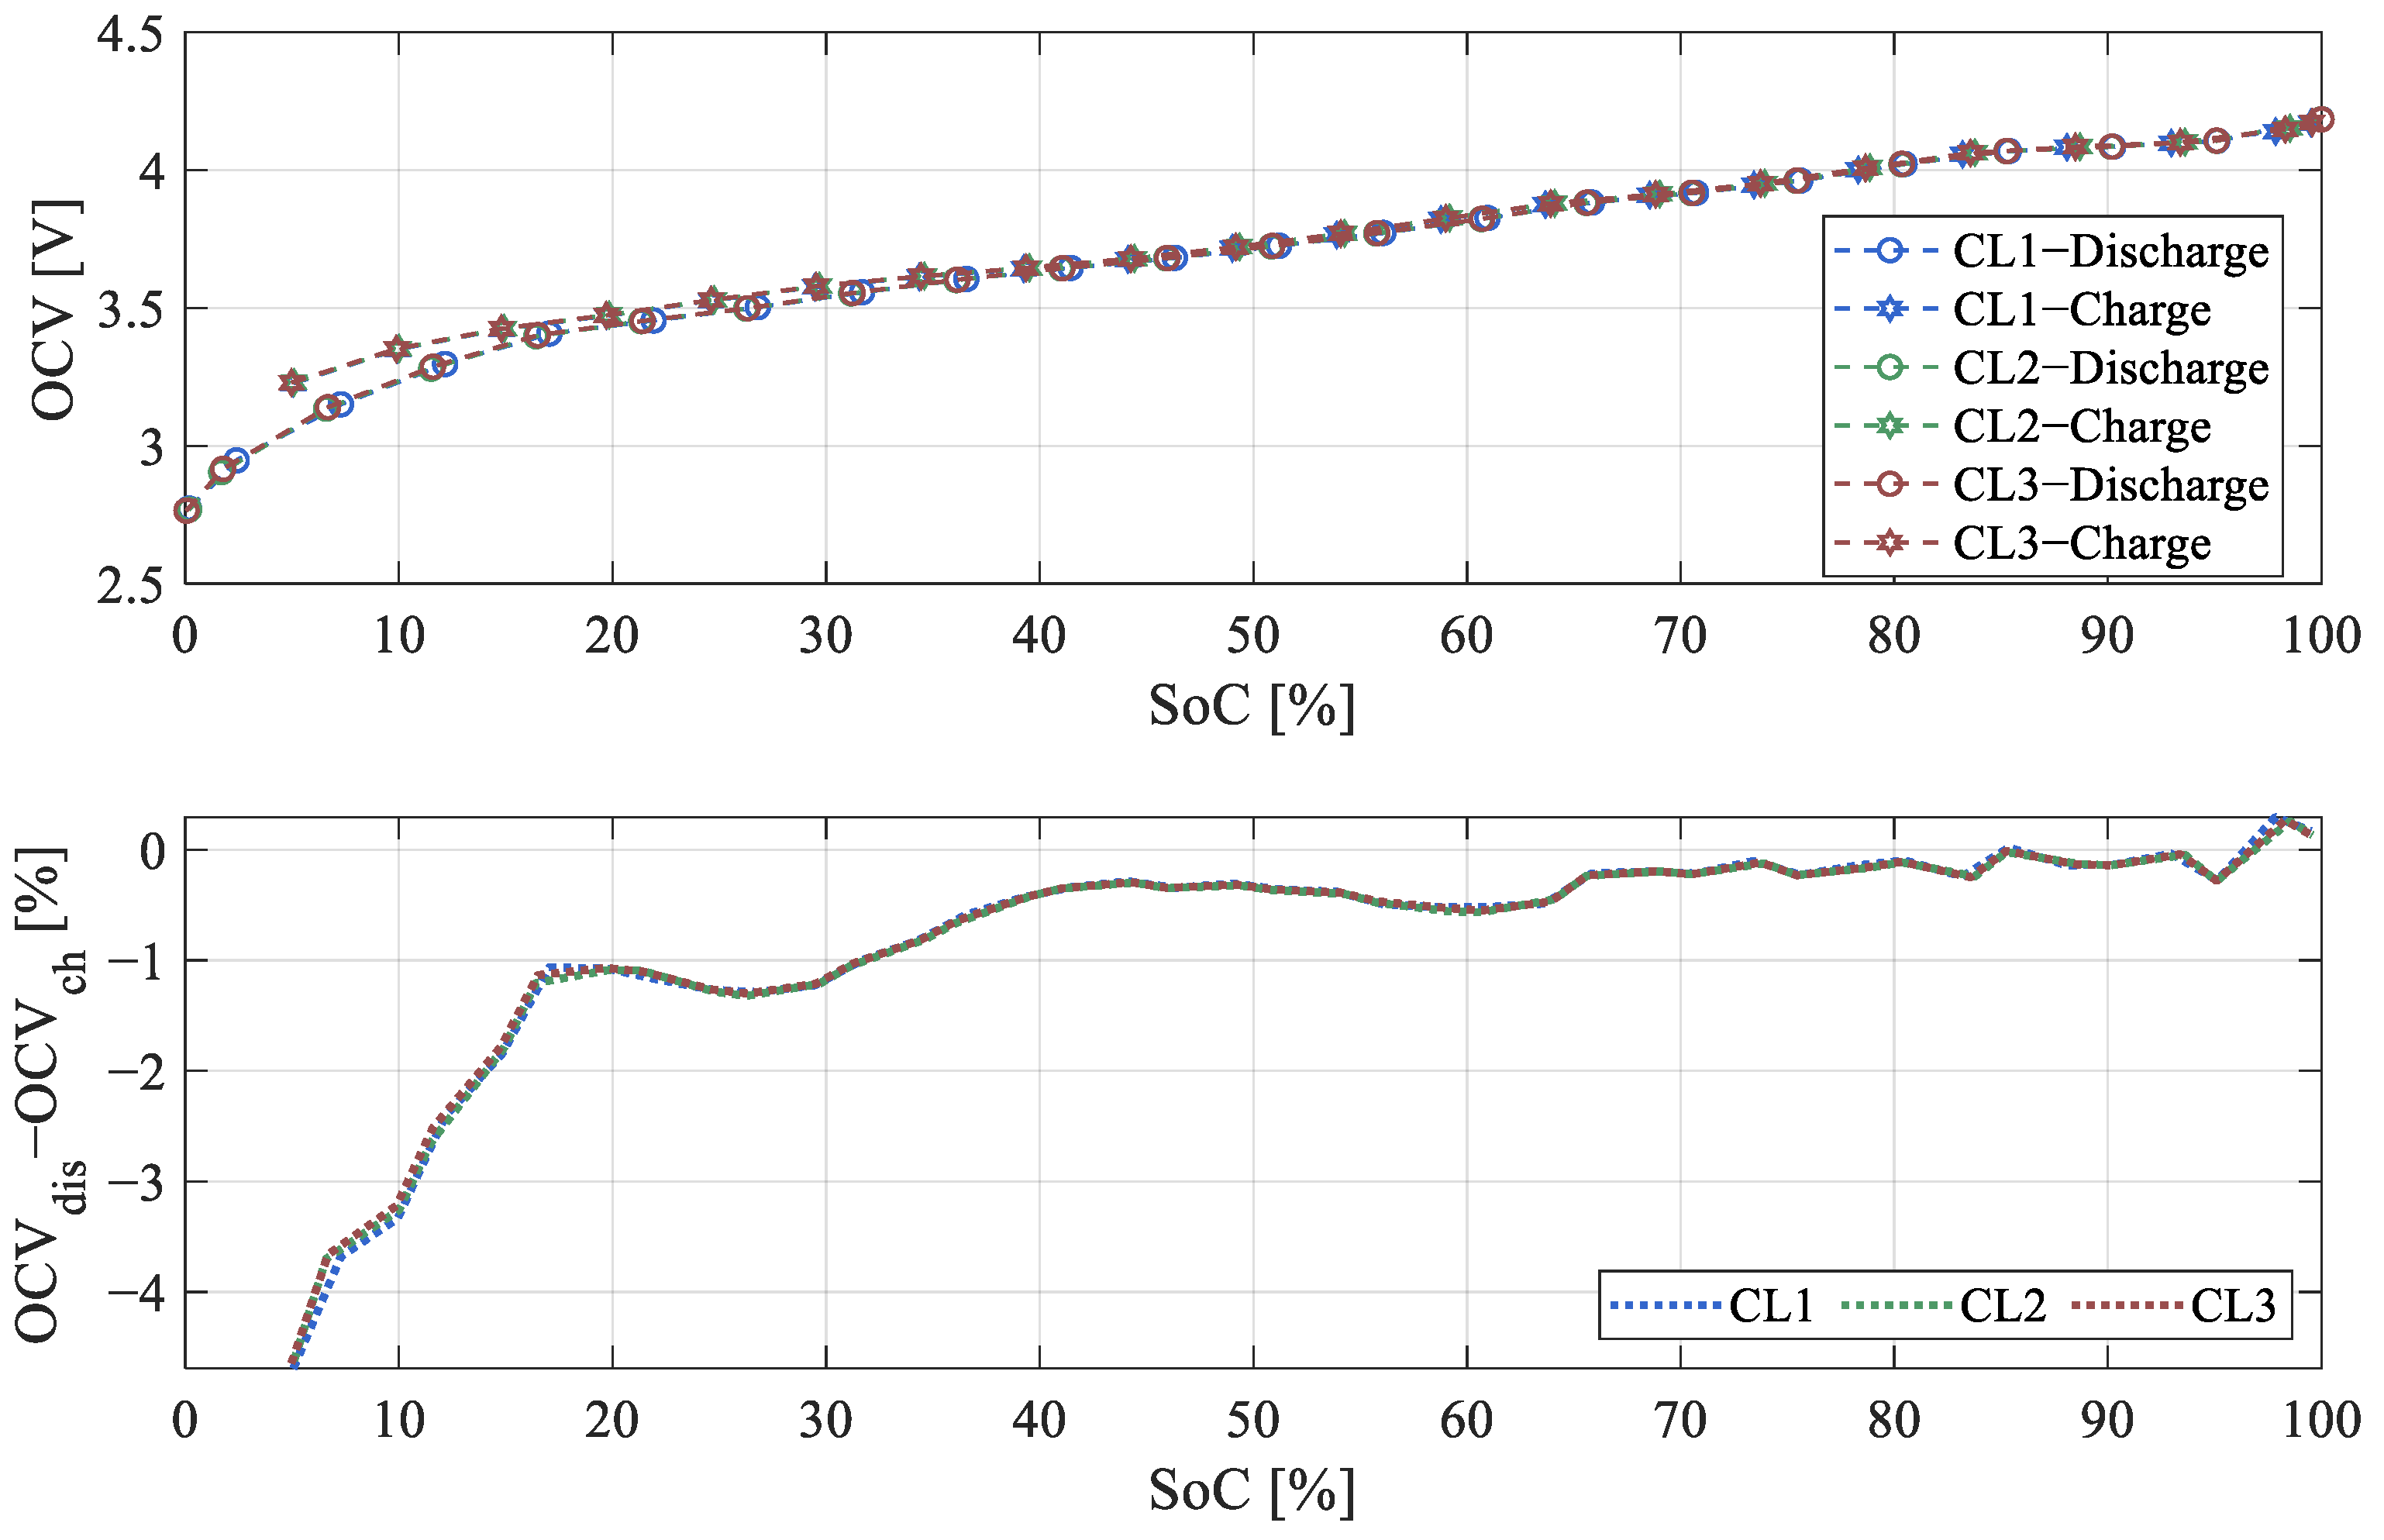
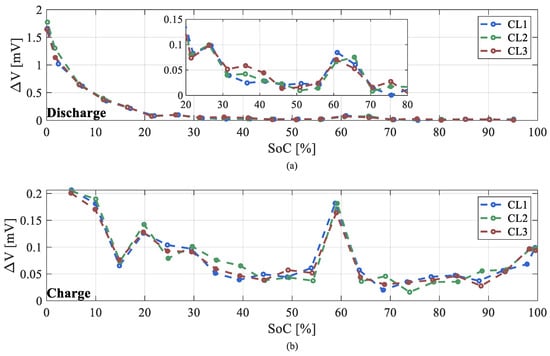
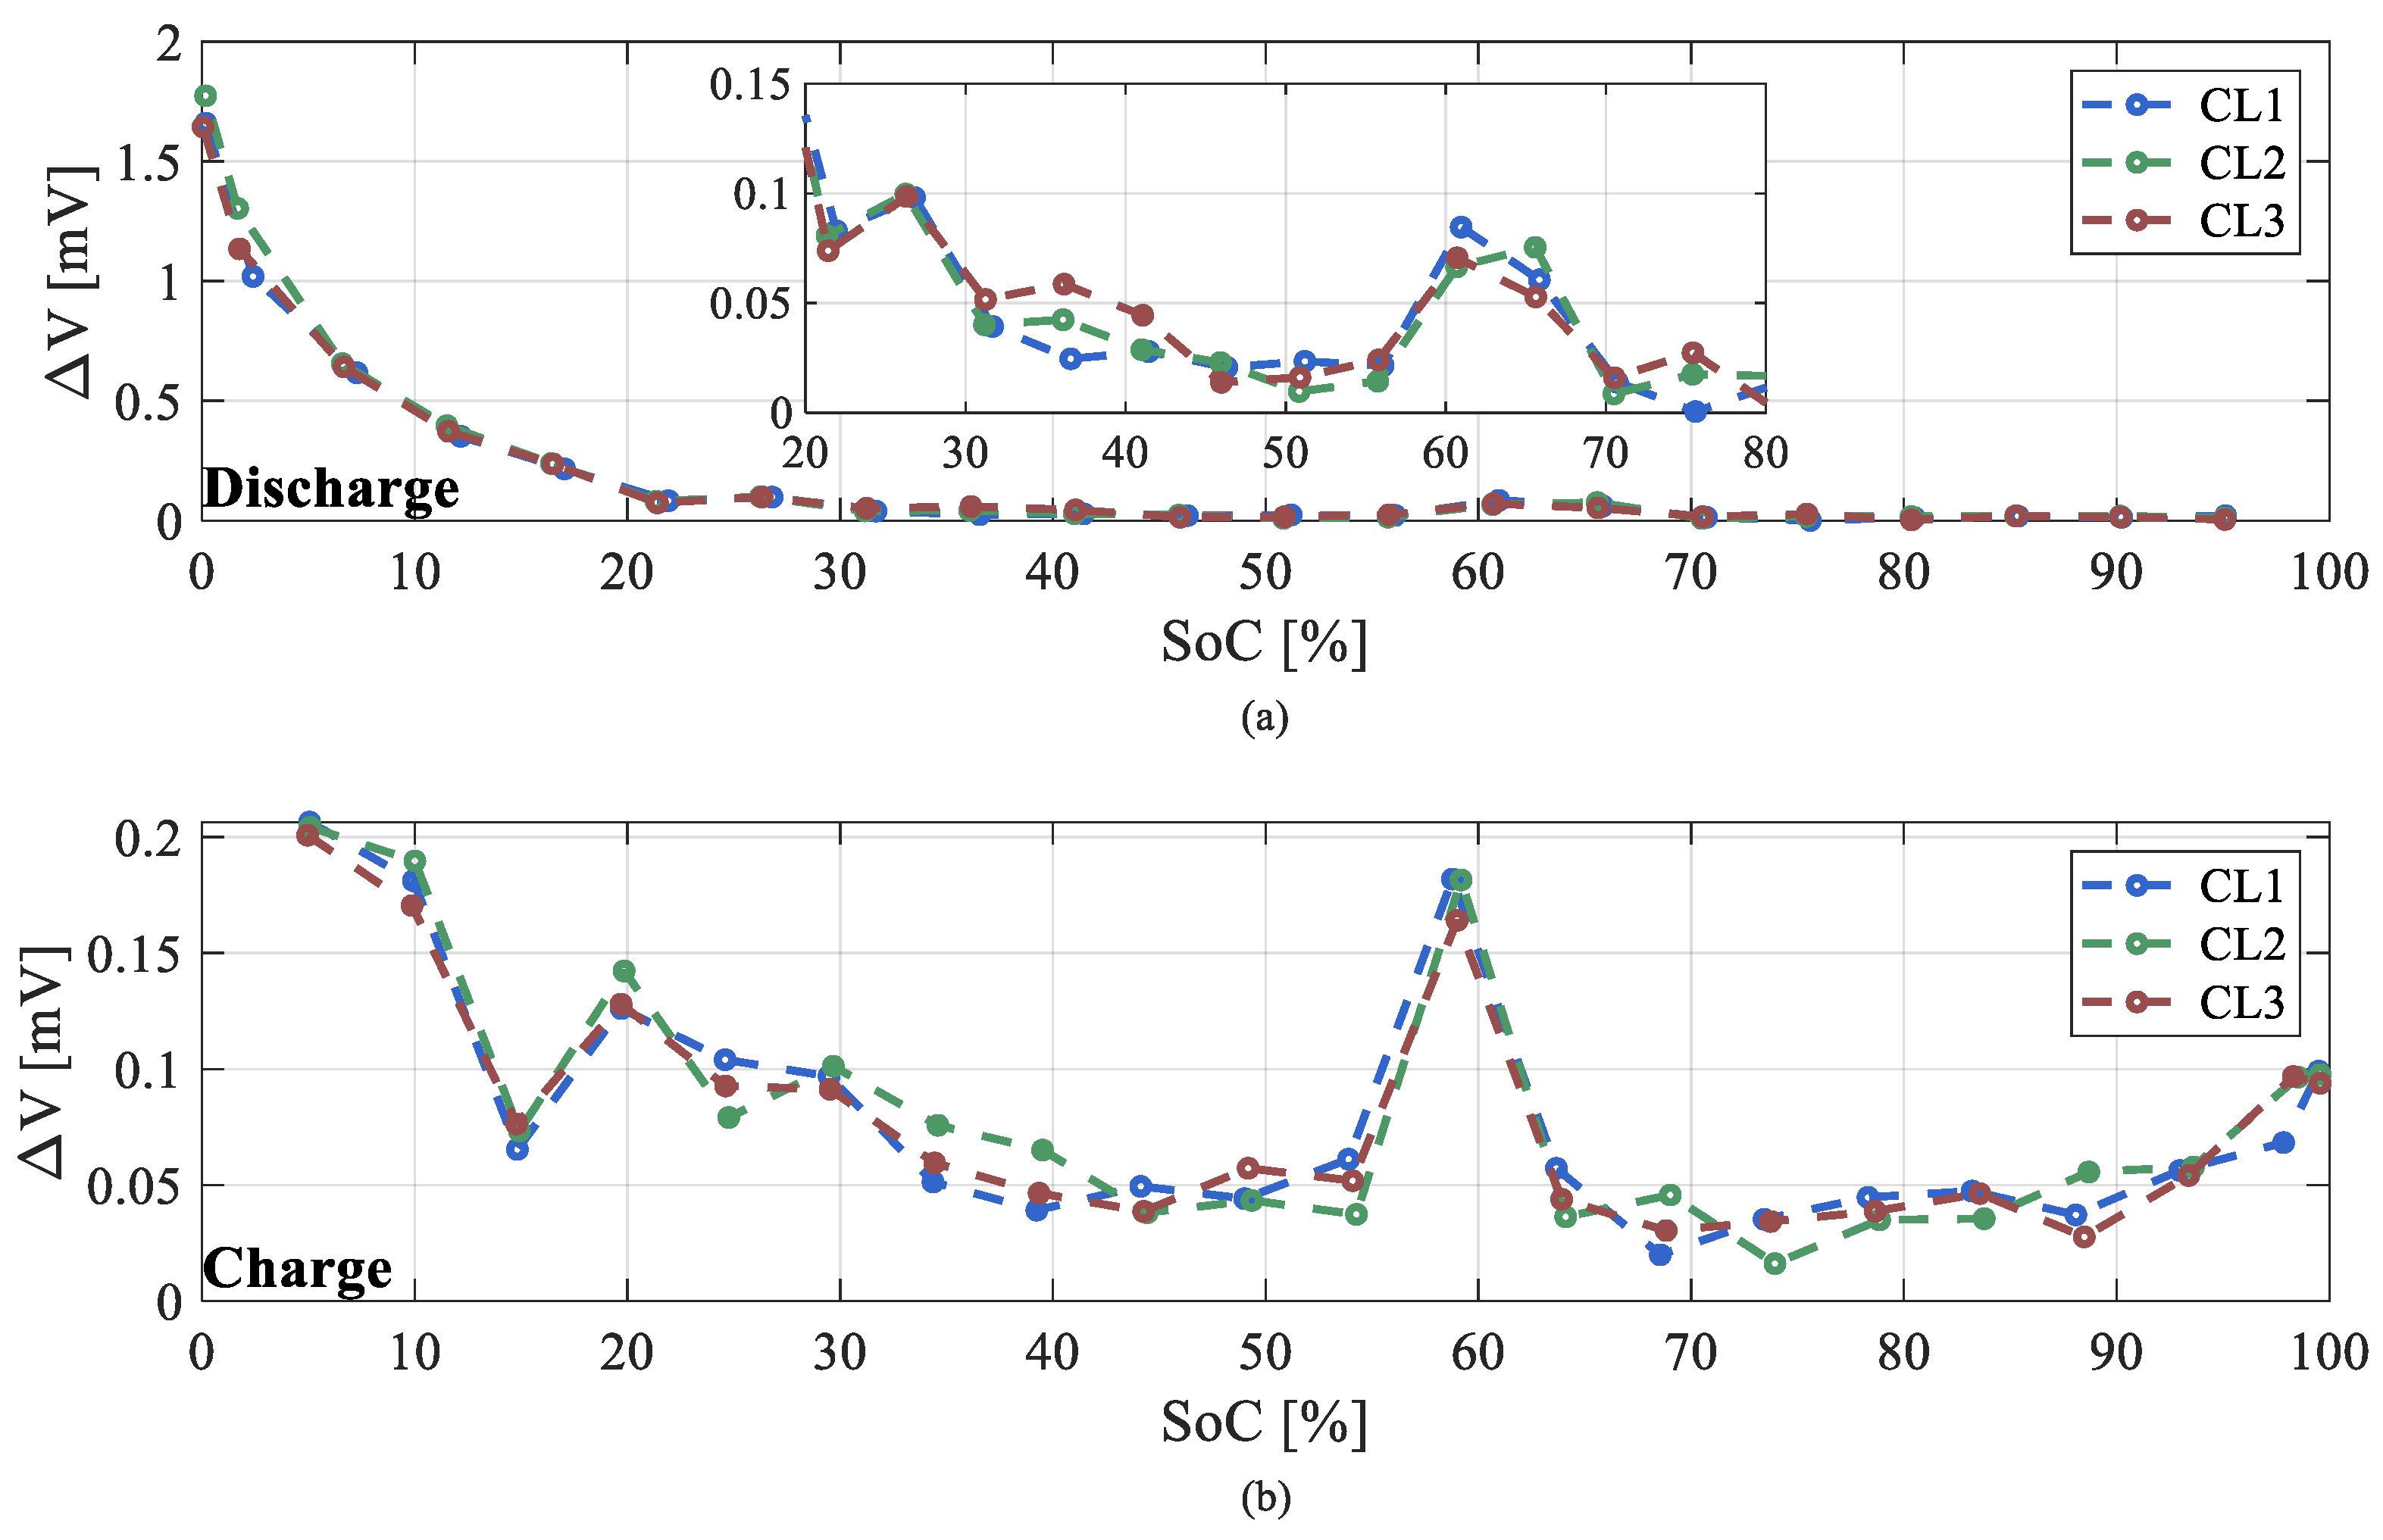
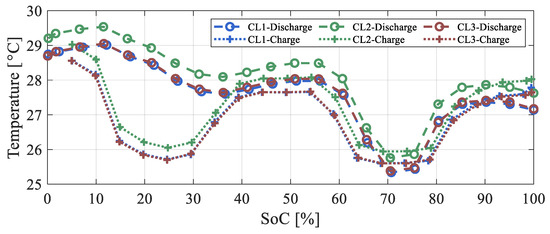
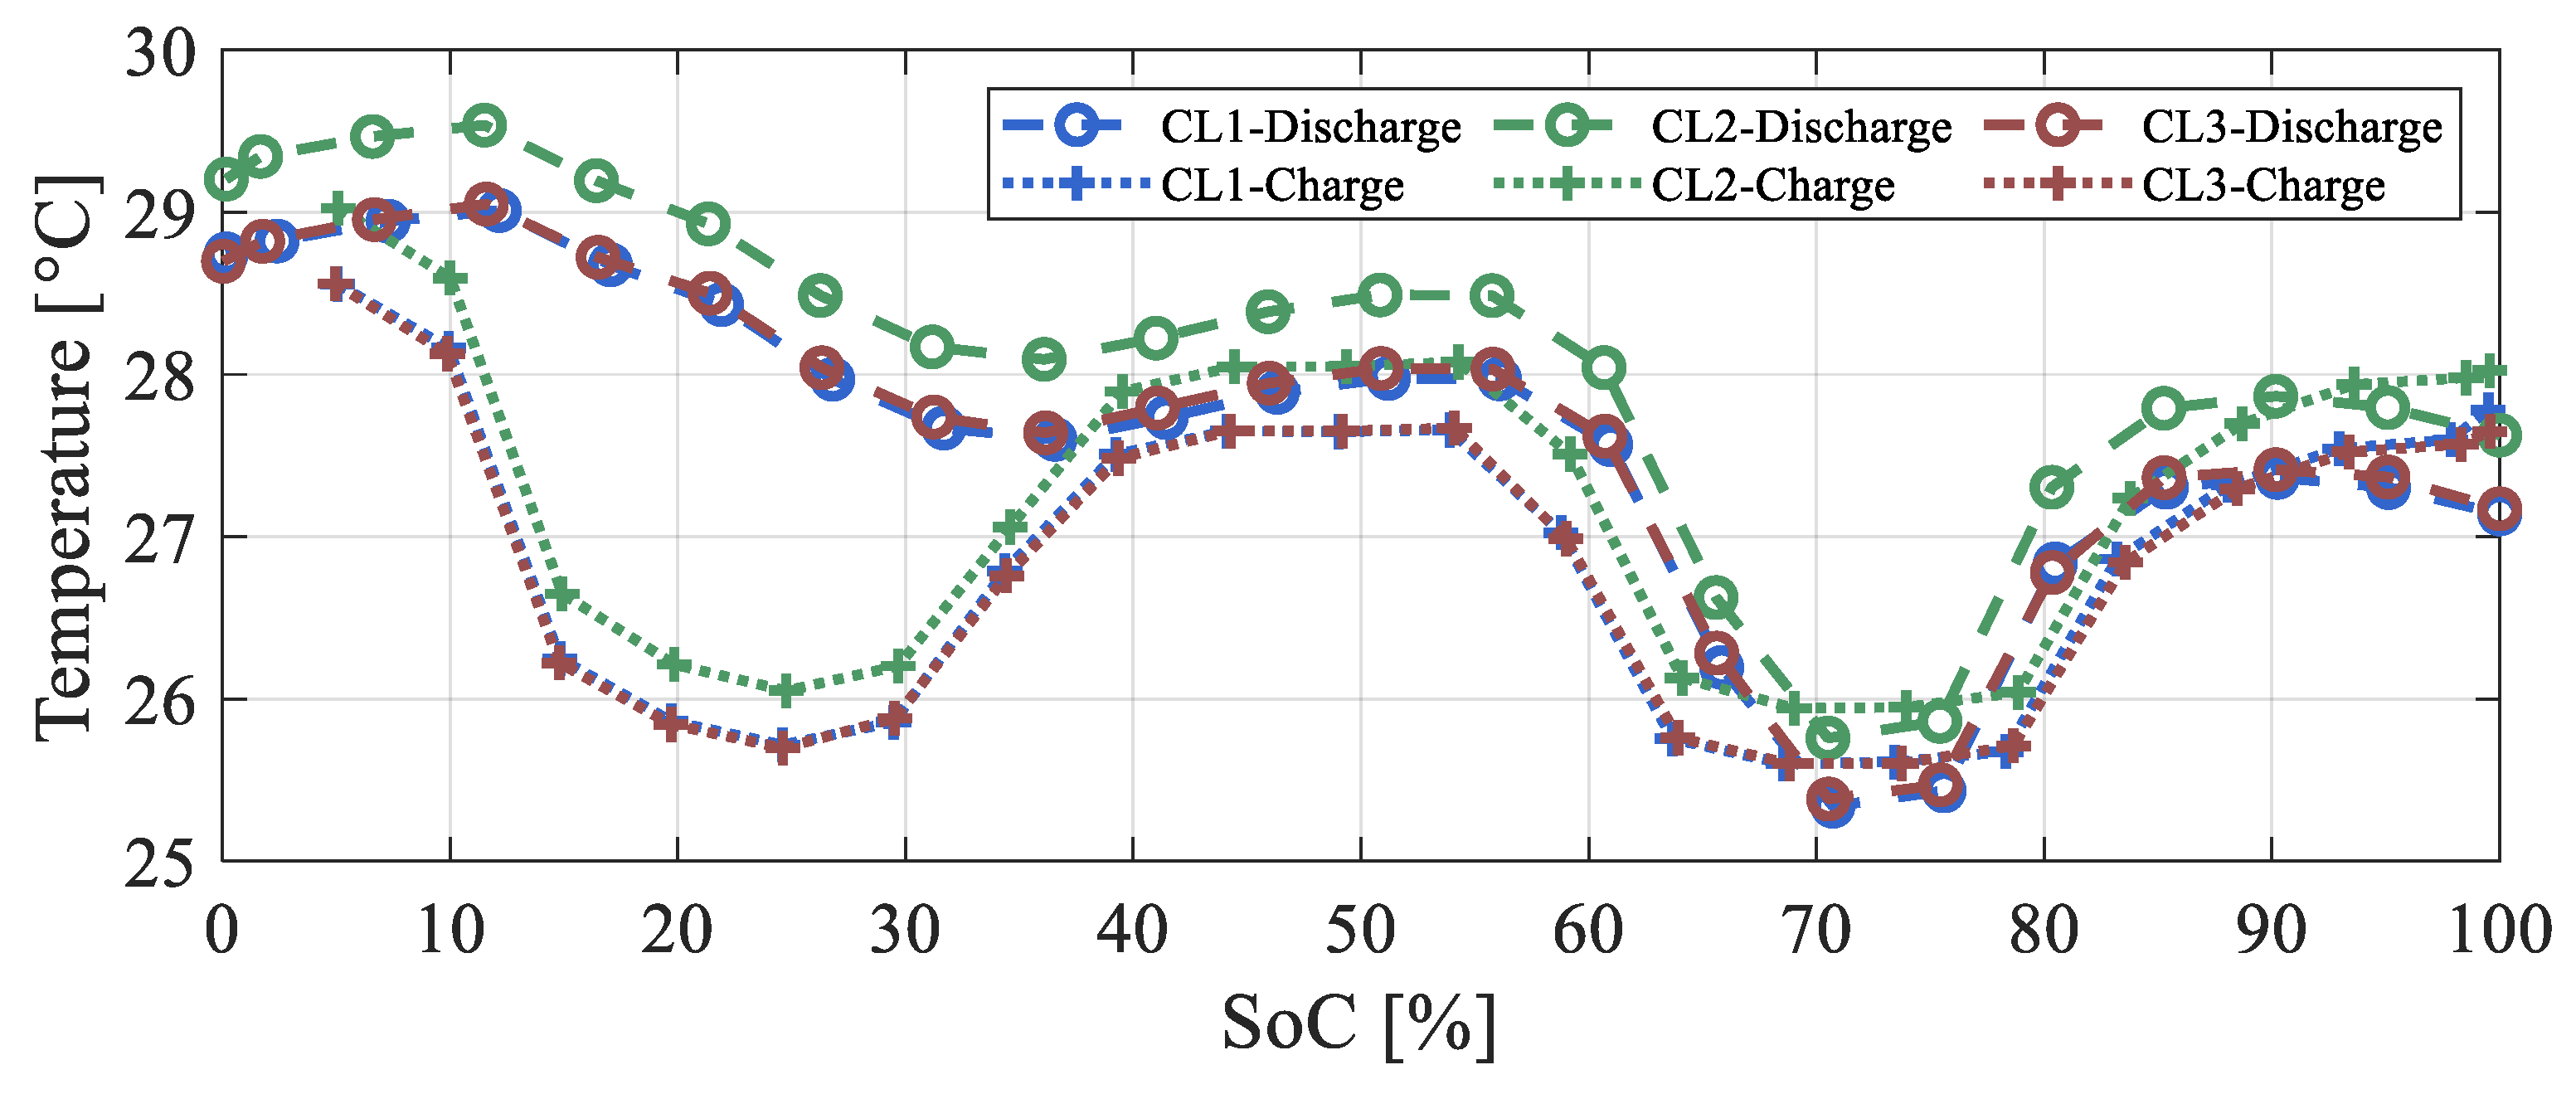
The OCV curves obtained using the relaxation method for both the charging and discharging phases are presented in Figure 7, which reveals that for SOC levels above 40%, the charge and discharge OCV curves nearly coincide. While the difference remains minimal above 40% SOC, it increases substantially below this threshold—rising from approximately 0.02 V to 0.18 V near 5% SOC. In addition to the hysteresis phenomenon, a potentially insufficient relaxation time, during either the charge or discharge process, could explain this discrepancy. However, as shown in Figure 8, the voltage difference within the last 5 min of the rest phase remains below 0.2 mV for both charge and discharge curves at SOC levels above 20%. This corresponds to an error of only 0.004% at low voltages (approximately 3 V), indicating that the cell was adequately relaxed in this range. Therefore, the observed divergence between the charge and discharge curves above 20% SOC cannot be attributed to inadequate relaxation. In contrast, for SOC levels below 20%, the discharge curve exhibits higher voltage variation during the final minutes of the rest phase—reaching differences of up to 1.7 mV. This suggests that the cell may not have fully relaxed in these cases, which likely contributed to the discrepancy between the charge and discharge OCV values in this range. Morover, as showin in Figure 9, the temperature of the three cells were close during the tests and the variation observed are mainly due to room temperature variation.
Figure 7.
Measured OCV in relaxation test.
Figure 8.
Voltage difference in the last 5 min of the rest during the (a) discharge and (b) charge.
Figure 9.
OCV temperature during relaxation.
Finally, it should be noted that the variation in cell behavior across the three cells was minor. Therefore, the discussion of the hysteresis voltage and voltage difference observed during the final 5 min is not specifically about any single cell, and the conclusions may be regarded as generally applicable. In order to take into account the hysteresis effects, the charge and discharge OCV curves are both used as references for the comparison of the different methods in the following.
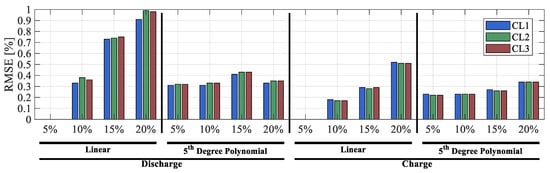
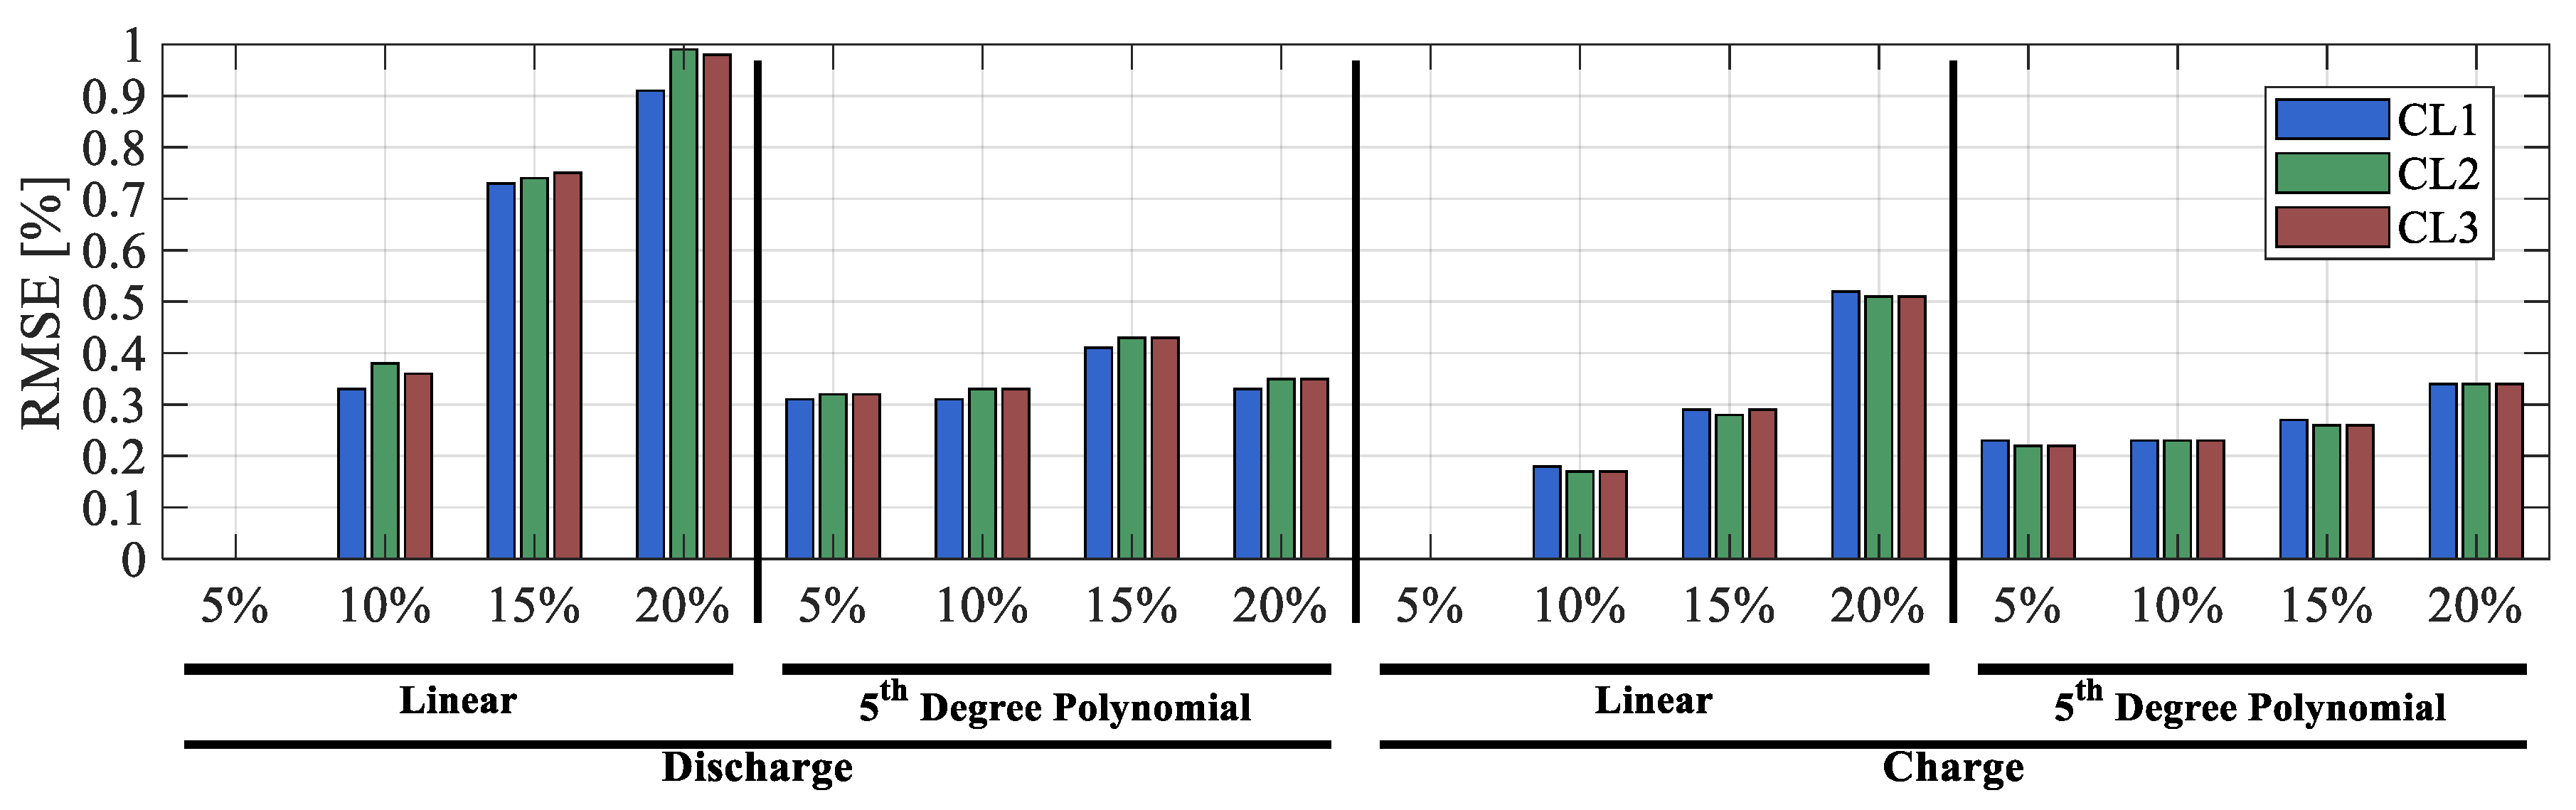
Figure 10 shows the sensitivity of the OCV to the number of SOC points. As discussed in Section 3.1, in reference to the charge and discharge curves, the only variability introduced was the number of SOC points. The results indicated that fitting the experimental data with a 5th-degree polynomial curve effectively reduced the sensitivity of the OCV model to the number of data points. This behavior was consistently observed in both the charge and discharge curves. However, the application of such a polynomial fitting introduces a form of systematic error into the OCV representation. In other words, if the fitted model lacks sufficient accuracy, errors may persist regardless of the number of data points. Nevertheless, when the number of available data points is limited, employing a fitted model can substantially mitigate the impact of data sparsity and improve the overall reliability of the OCV curve. Another important observation is that using polynomial fitting can also cover the lack of measurement density.
Figure 10.
Accuracy of the fitting versus number of available measurements.
Looking more closely, it is also evident that the OCV curve during charging was less dependent on the number of points. In this scope, the accuracy of the model prediction when using fitting was evaluated as a function of the amount of available data. Starting from all the measurements (i.e., data obtained when changing the SOC by 5% at a time), both the linear and polynomial fitting were repeated considering a reduced number of points (i.e., data obtained when changing the SOC by 10%, 15%, or 20 at a time). The resulting RMSE values are reported in Figure 10. In the worst case (i.e., data obtained when changing the SOC by 20% at a time), the RMSE of the linear interpolation during charging was almost half of that obtained during discharging. This can be explained by the fact that the obtained OCV from the discharge varied rapidly as the SOC dropped below 20%. This led to inaccurate results when the number of measurements was reduced. The solution was to use a representative model (in this study, the 5th-order polynomial) to compensate for the lack of information.
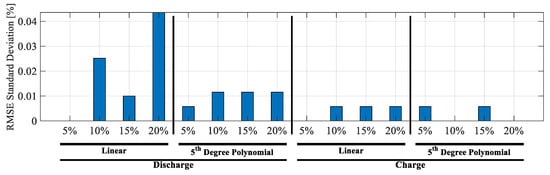
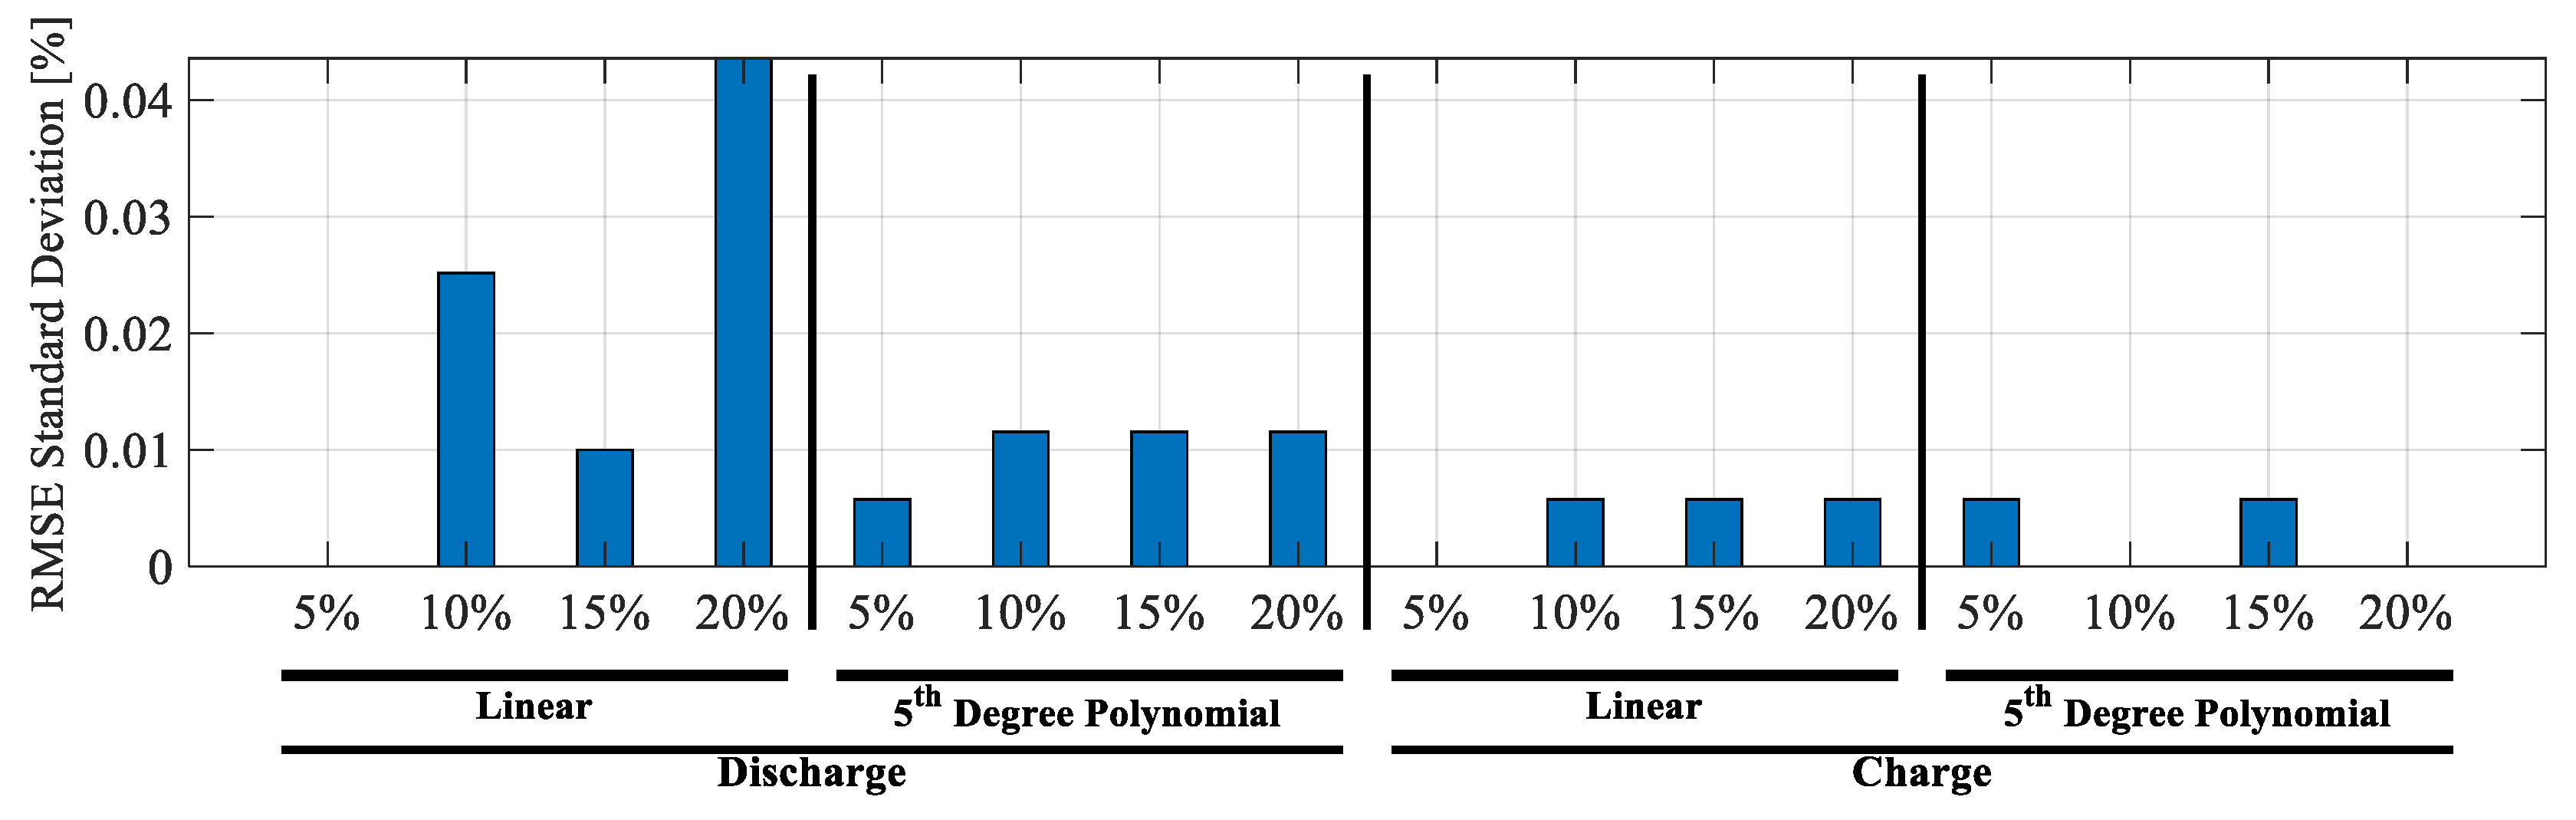
Additionally, as shown in Figure 11, it should be noted that the results were consistent across all three cells, with maximum and average standard deviations of 0.044% and 0.009%, respectively. Furthermore, although the differences among the standard deviations were relatively small, the values obtained under charging conditions were consistently lower than those observed during discharge (especially in cases of using linear interpolation). This further supports the conclusion that the charging curve can be considered more stable, because its sensitivity to the number of SOC points is less dependent on cell-to-cell variations.
Figure 11.
Standard deviation of the RMSE of the predicted OCV across the tested cells.
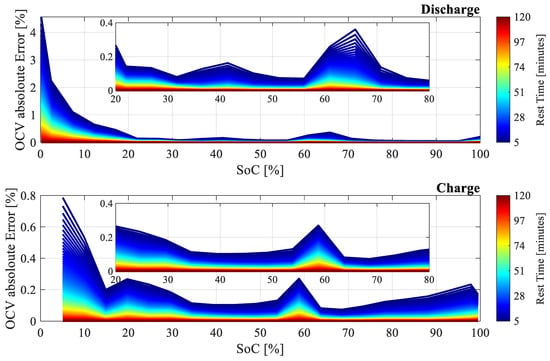
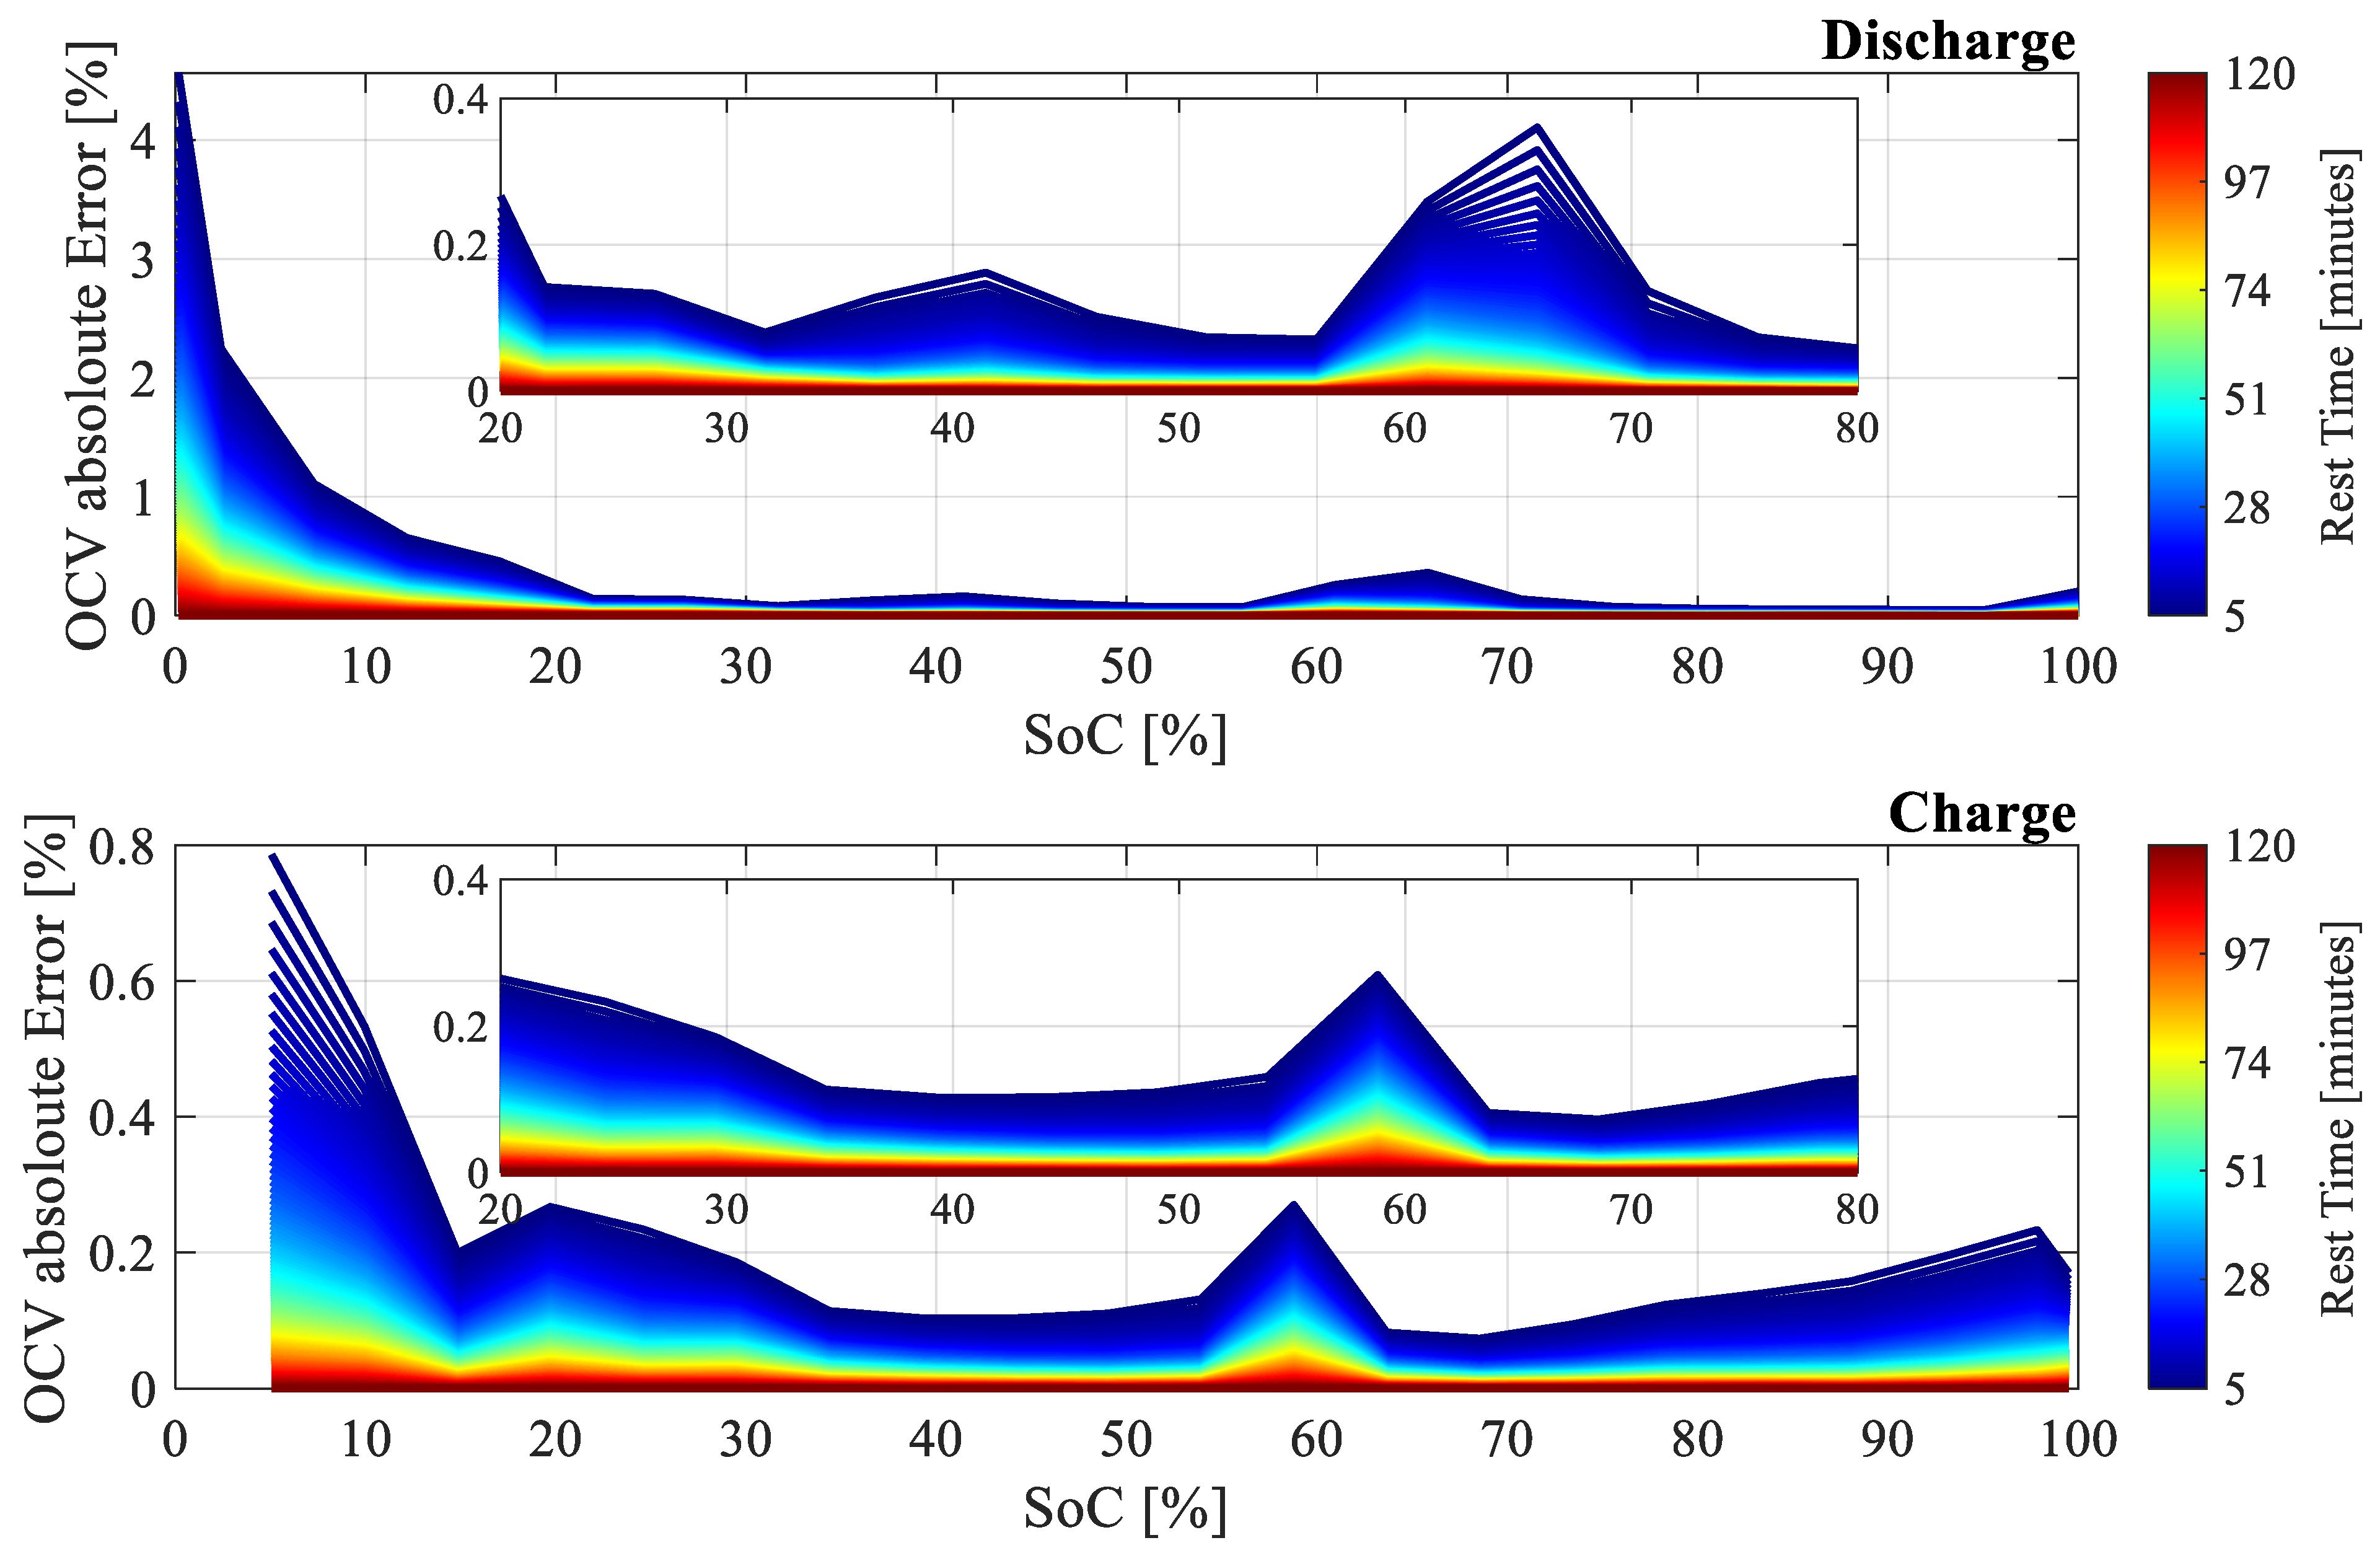
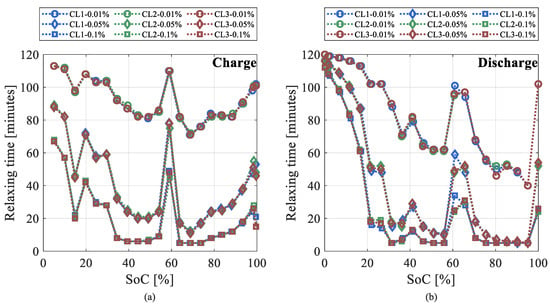
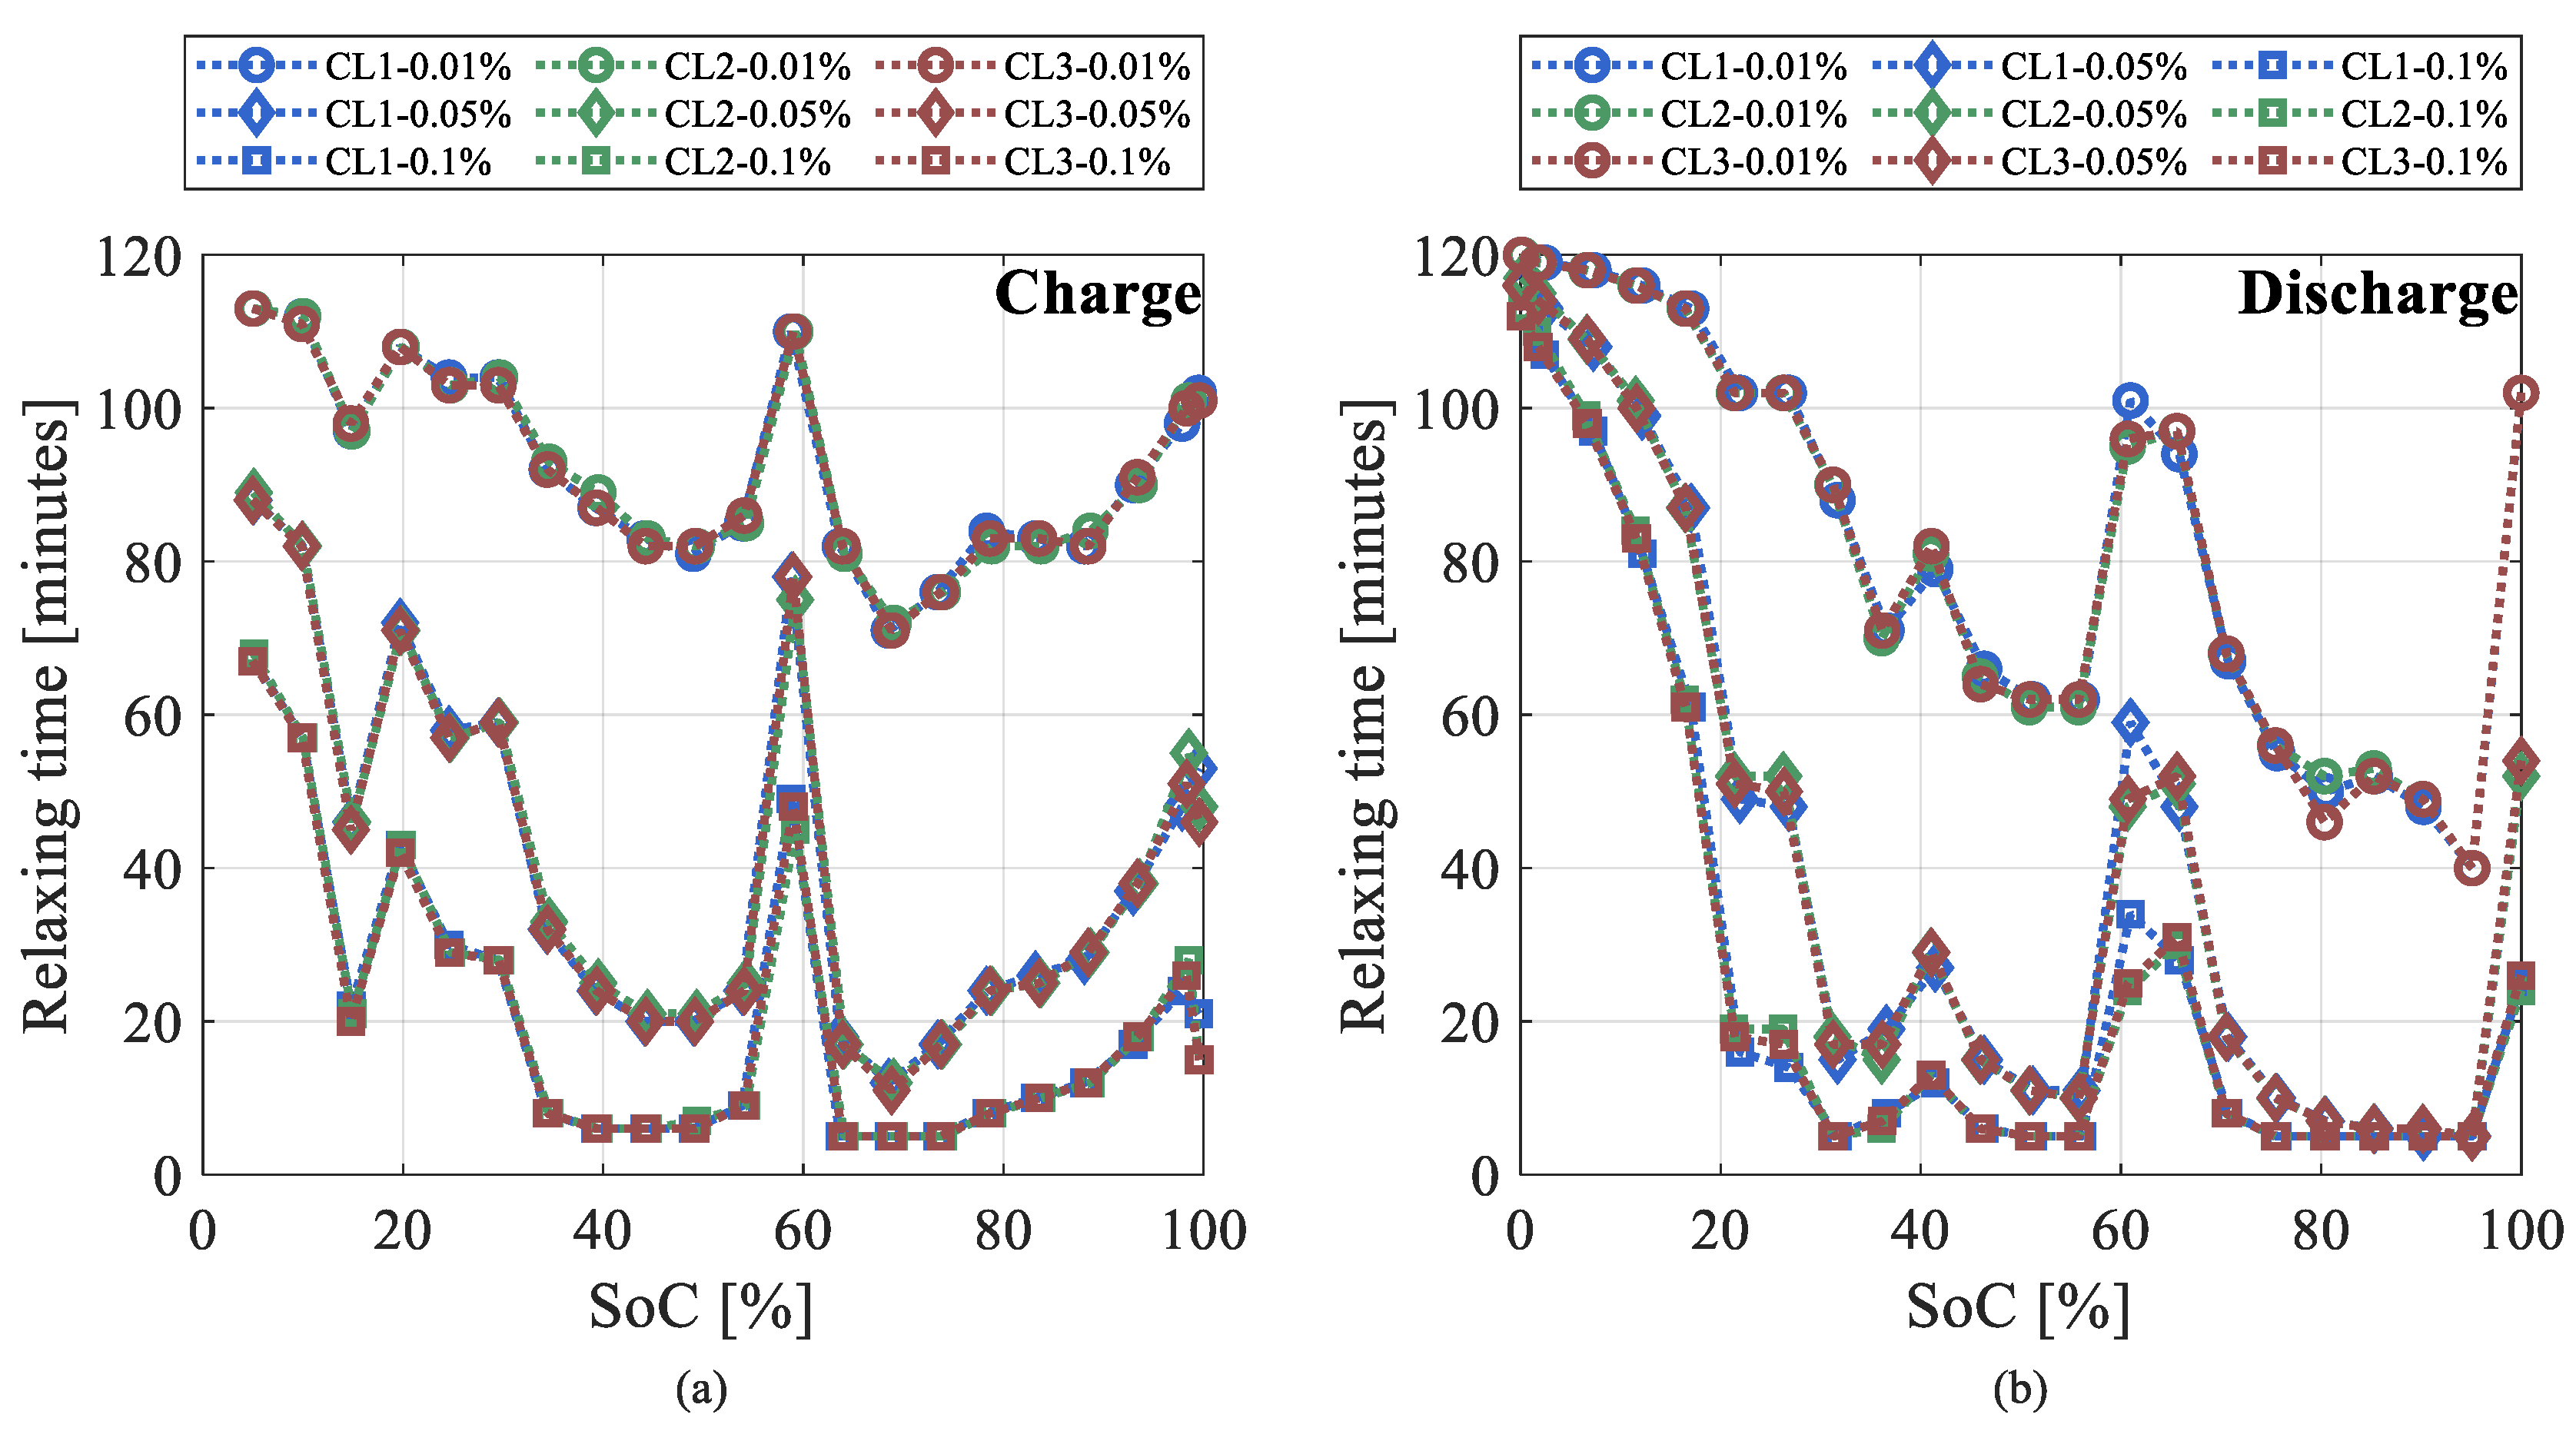
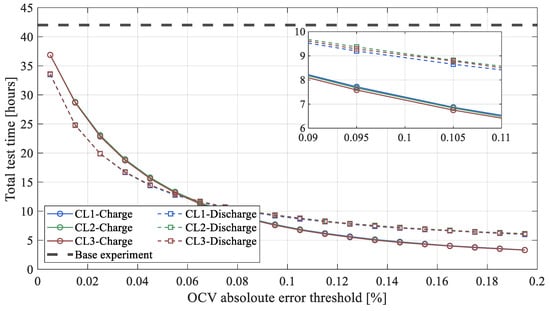
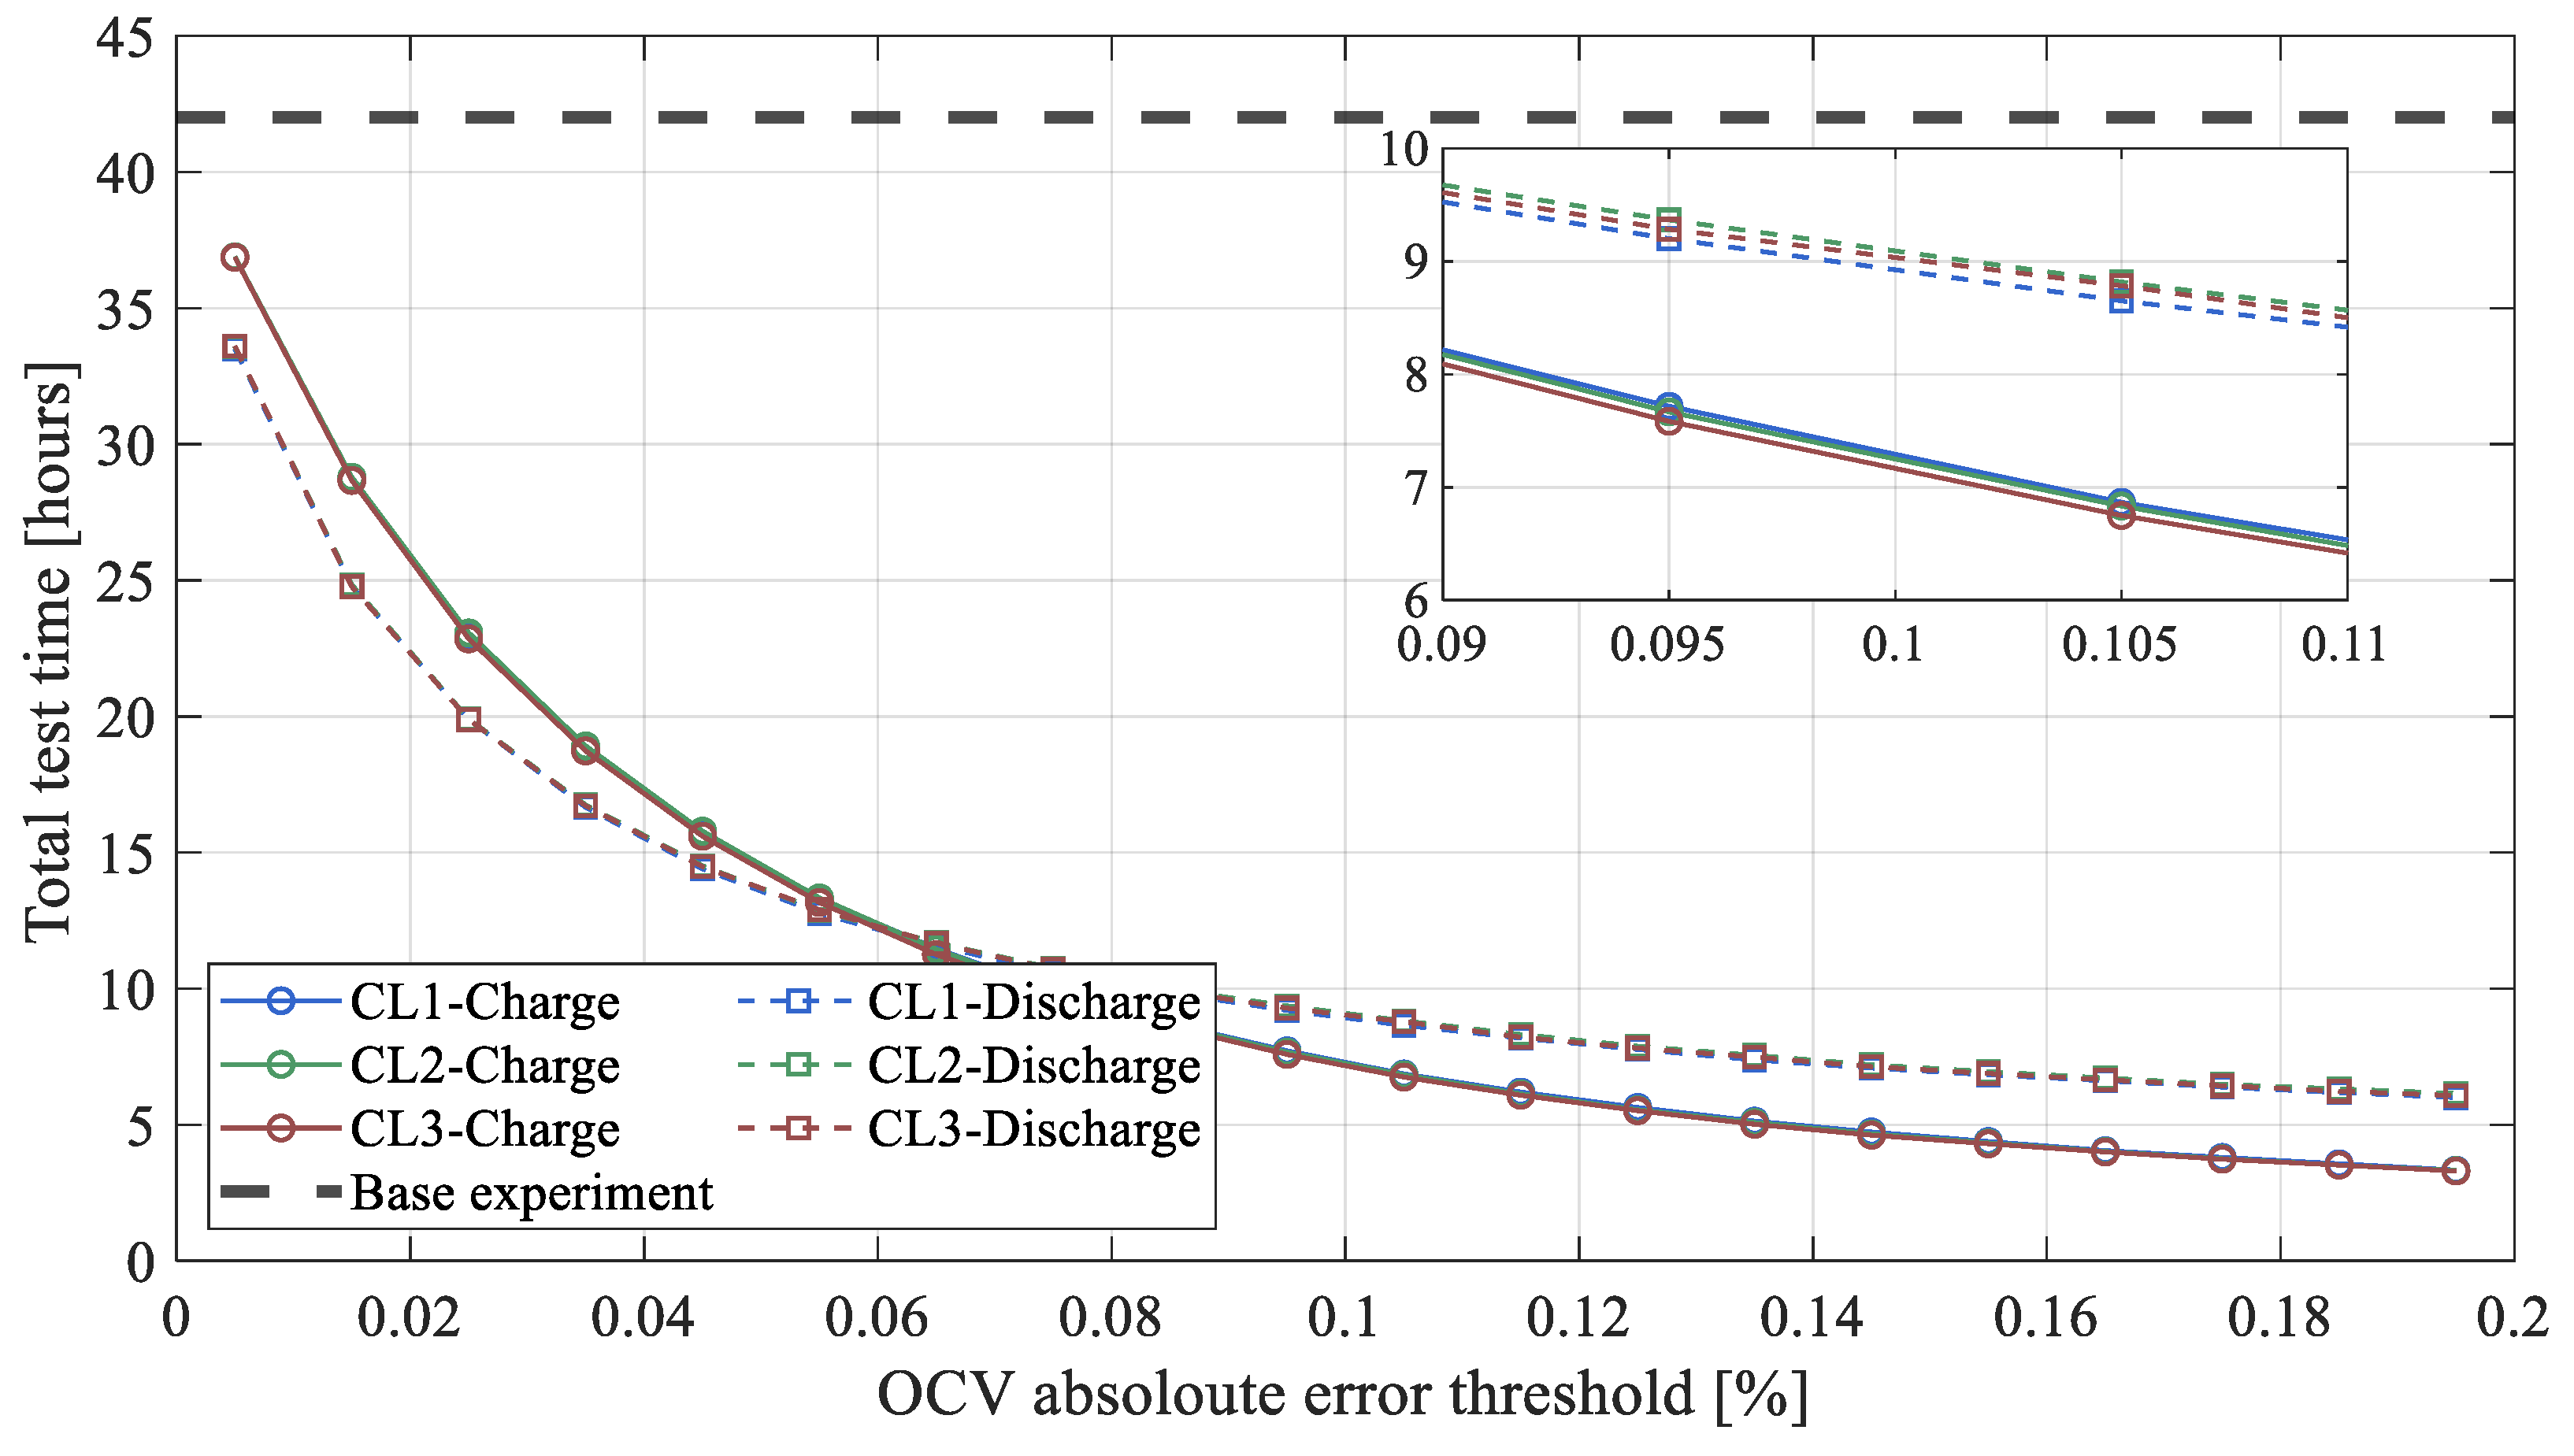
As reported in Figure 12, during discharge, for SOC below 20%, the measured error rises substantially as the rest time decreases, with the maximum error reaching almost 5% when measured at a 5 min rest interval. Conversely, for SOCs above 20%, the maximum error remains under 0.4%, a level deemed acceptable when considering that reducing the rest time could significantly decrease the overall test duration. In contrast, during charging, the overall error consistently remains below 0.8% for all the SOC intervals, and it is always below 0.3% at 20–80% of the SOC. It is important to consider that for both the charge and discharge curves, the error in estimating the OCV becomes more significant as we approach extreme SOCs (higher than 80% and less than 20%). Benefiting from these results, it is evident that using a relaxation time that varies with respect to the SOC can provide an accurate OCV while reducing the total duration of the test. Figure 13 shows the relaxation times needed for different accuracy thresholds for each SOC point. As evident from the results reported in Table 2, when setting the threshold at 0.1%, the required time can drop significantly to below 20 min for all the SOC points between 20% and 90% during both charge and discharge. Even when setting lower thresholds such as 0.01%, using a non-fixed relaxation time can lead to significant time saving in the test, reducing the total test time from 42 h to 32 and 28 h for the charge and discharge tests, respectively. Overall, employing a non-fixed relaxation time can significantly reduce the total duration of the experiment. As shown in Figure 14, for both the charge and discharge tests, the total testing time decreased exponentially from 42 h to approximately 5 h, while the accepted error was increased to 0.2%.
Figure 12.
OCV error values for different relaxation times.
Figure 13.
Relaxation time needed for each SOC with different accuracy thresholds for (a) charge (b) discharge.
Table 2.
Total test times considering different relaxation times for each SOC.
Figure 14.
Total test times using non-fixed relaxation times.
Finally, it is important to note that these results were not cell-dependent. As shown in Figure 13 and Figure 14, the variation in the required rest times and total test duration was negligible. More specifically, the maximum difference in the total test times between the tested cells was approximately 10 min for both the charge and discharge procedures, which can be considered negligible when compared to the overall test duration.
5.2. Low Current
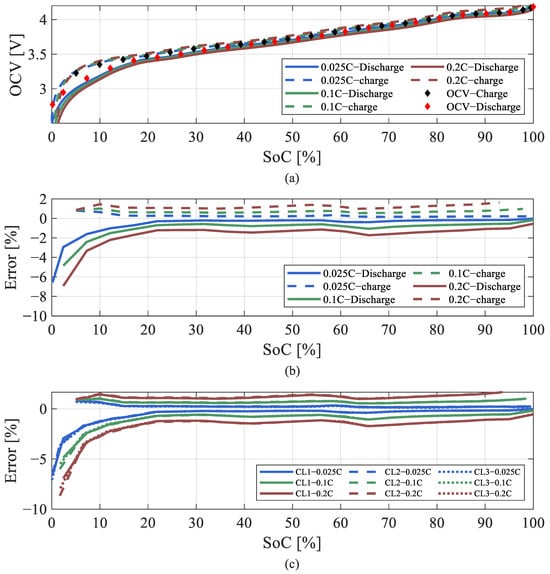
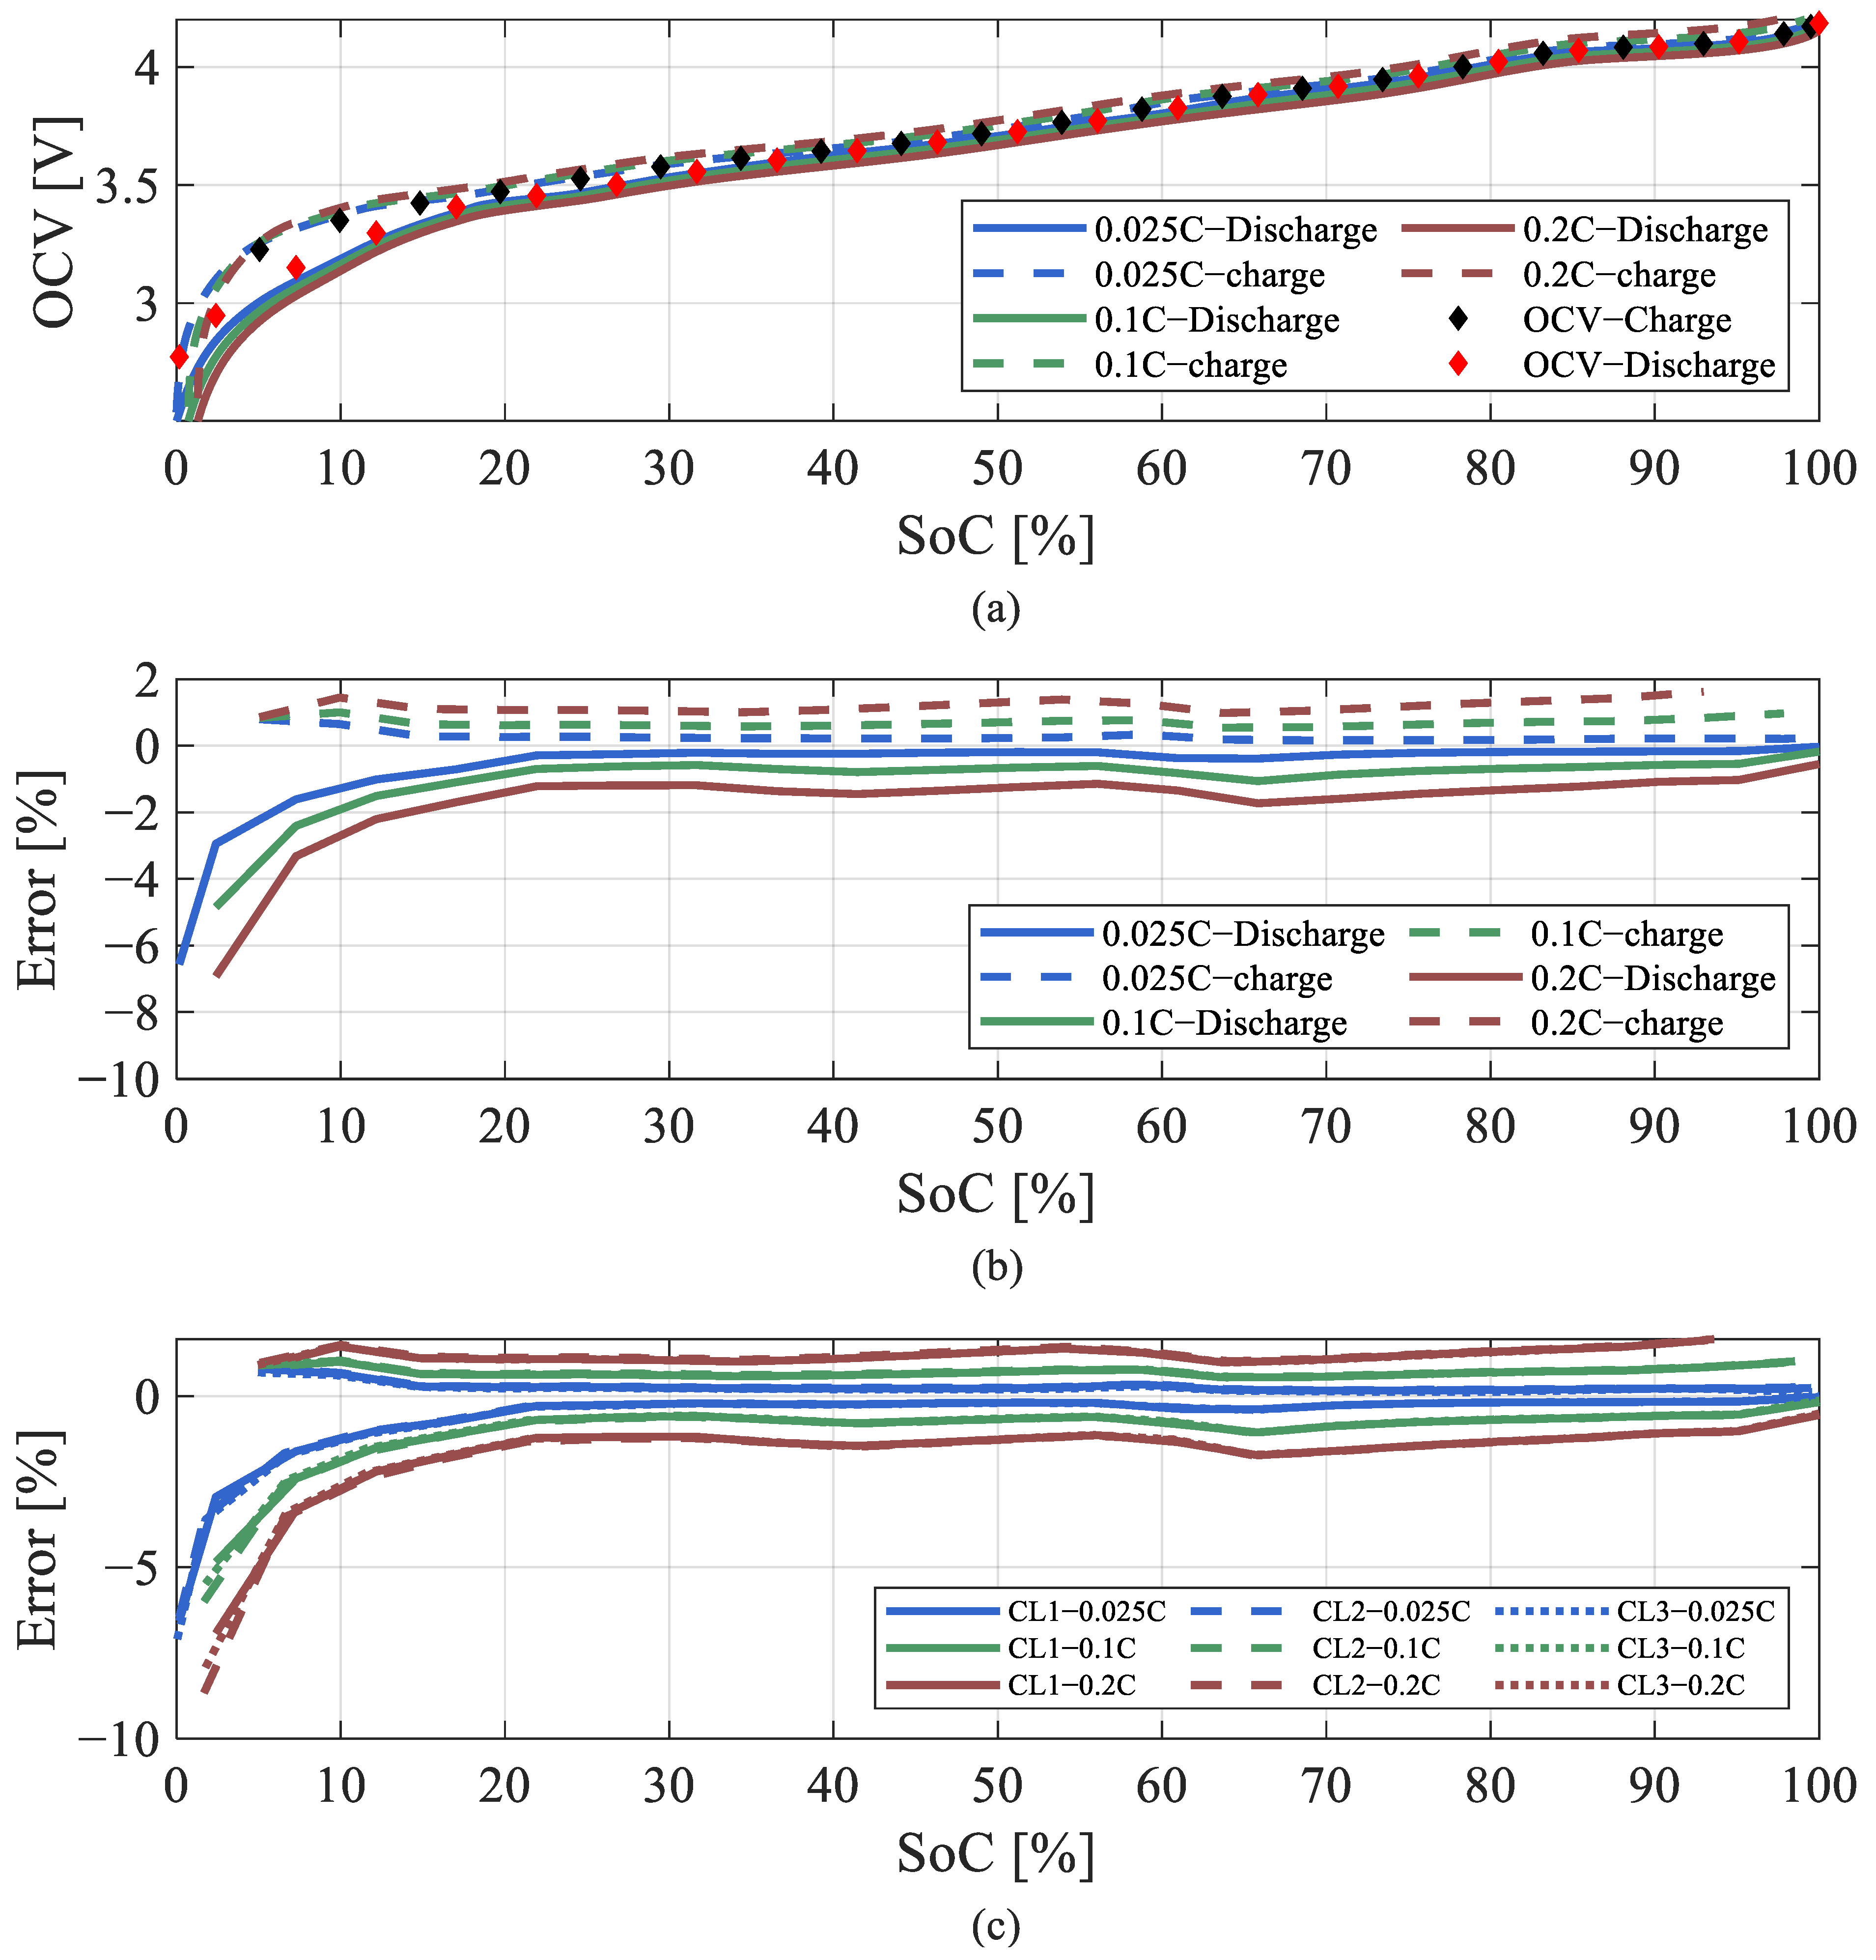
The OCV curves obtained in low-current tests using three different currents are reported in Figure 15a. As discussed earlier, the main principle of this method is to directly use the obtained voltage curve as the OCV. In particular, neglecting the ohmic voltage drop, this method makes it possible to obtain both charge and discharge curves, along with an estimation of the voltage hysteresis.
Figure 15.
(a) OCV obtained in low current test with CL1, (b) OCV error for CL1, and (c) OCV error values for all three cells.
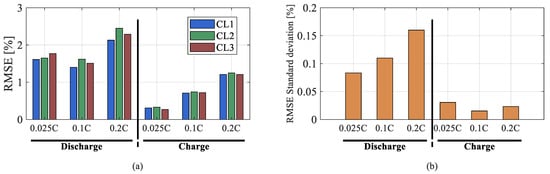
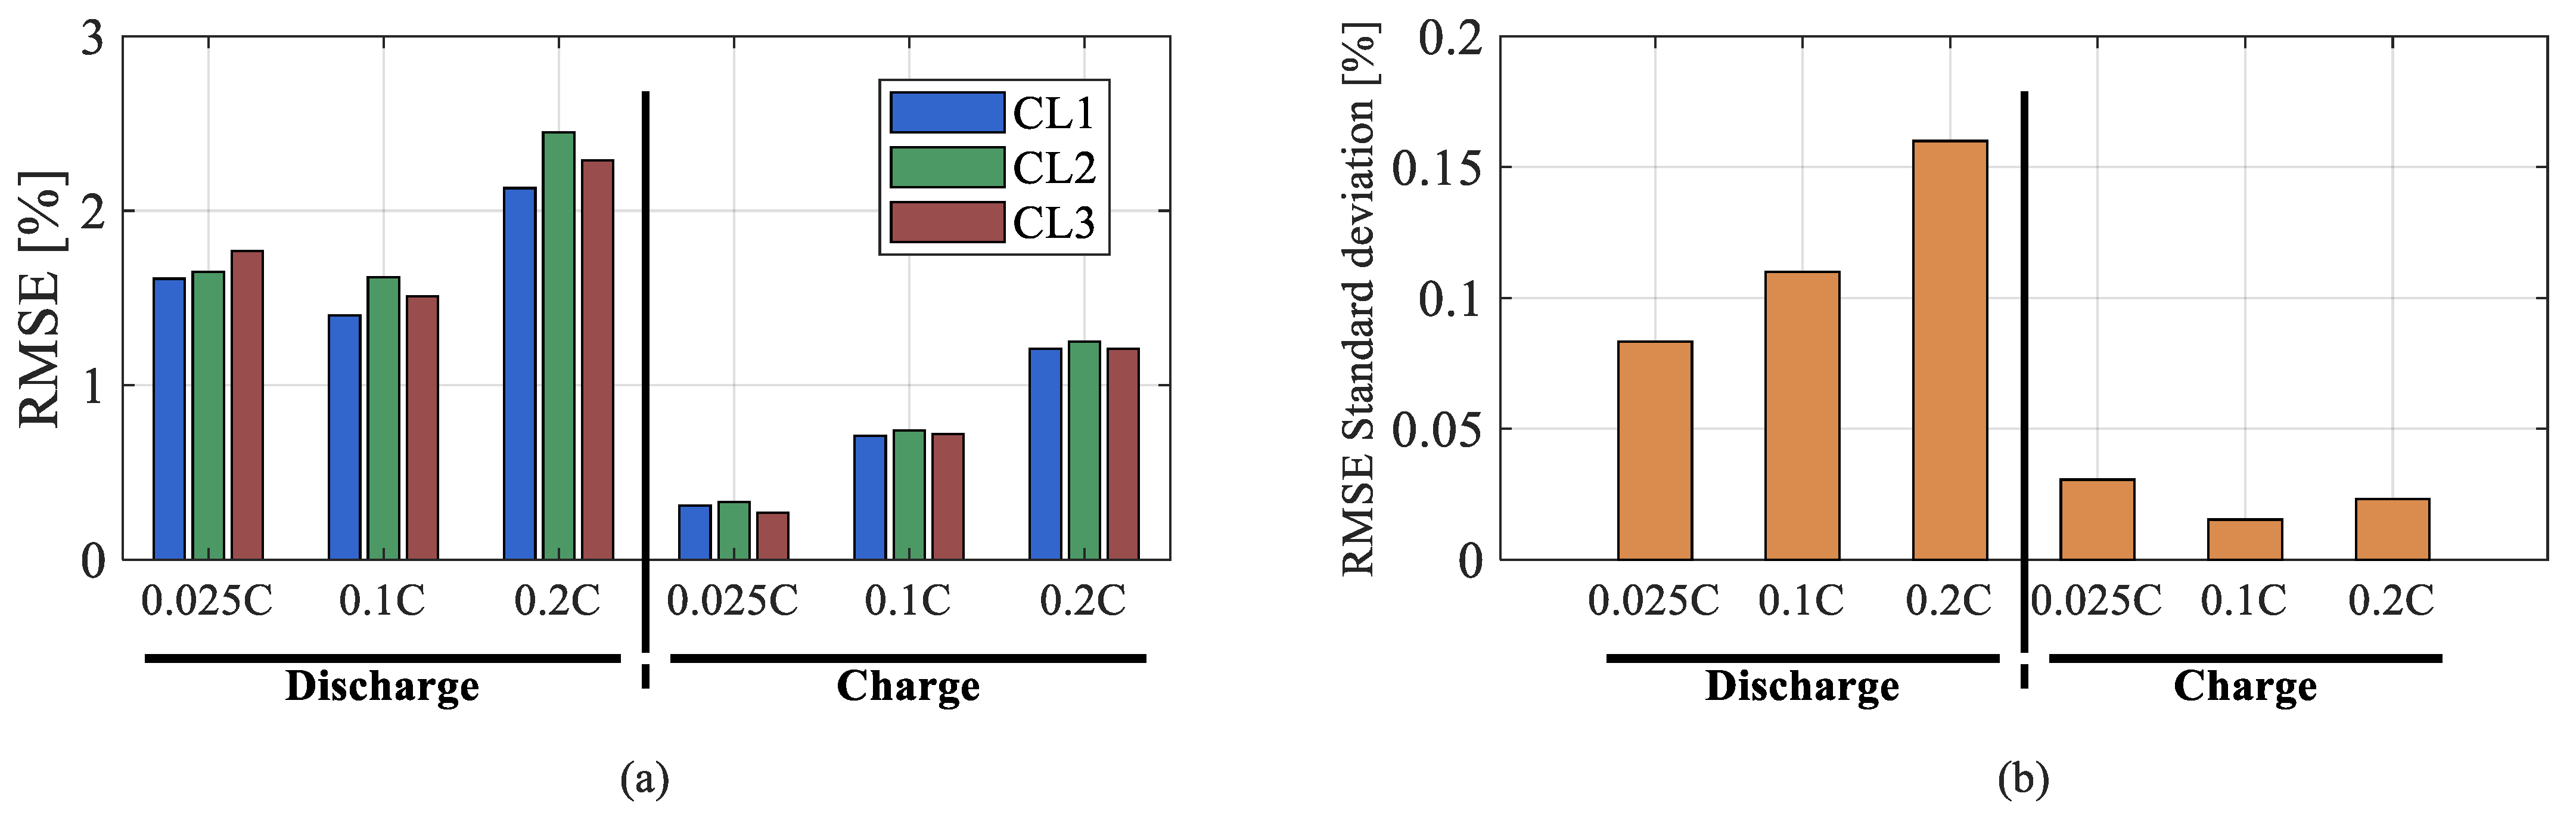
The OCVs and their percentage errors in Figure 15b reveal that for the charge curves, the errors remained below 2% for all the SOC ranges. In contrast, when using the discharge curve, the errors started to increase as the SOC decreased. Until 20%, the errors increased slowly, while for SOC values lower than 20%, the errors increased dramatically. The nonlinear behavior of the error can be considered a drawback because it makes it more challenging to compensate for it, whereas it is easier to compensate for the more constant errors of charging curves. Moreover, looking at the RMSE values of the three tests and three cells at different C-rates reported in Figure 16, it is evident that the RMSE values always remain lower for the charge curve. It is important to note that the large RMSE values for the discharge curves are the result of the gap for the OCVs below 20% SOC. Therefore, the results are always better when using the charge curves. An analysis of Figure 15 shows that the errors decrease with the current. This is because the main difference between the OCV values obtained with relaxation and low-current methods is a result of the ohmic voltage drop. The residual concentration polarization is much more visible when the ionic diffusion is slower, i.e., at a low SOC (<20%). Moreover, it is clear that the residual concentration polarization is more pronounced during discharging than during charging because of the stronger concentration gradients that develop at the electrode–electrolyte interface. From another perspective, it can be concluded that hysteresis effects can be effectively and straightforwardly captured using the low-current method, whereas the relaxation method may require extended rest periods at low SOC levels, which lead to long test times.
Figure 16.
(a) OCV error values during low-current testing and (b) standard deviation of the errors.
It should be noted that these results were not cell-dependent. First, the error profiles for the cells were very similar, with only minor differences observed, as reported in Figure 15c. Second, although internal-resistance variations caused the errors for different cells to diverge as the current increased, at low current levels, the influence of the internal resistance was significantly reduced, resulting in much closer RMSE values among the cells. This behavior was further supported by the standard deviation of the RMSEs shown in Figure 16b. With the exception of the 0.025 C charge case, under all of the other conditions, the OCV estimation accuracy across the cells began to diverge as the current increased, which can be attributed to the effect of internal resistance.
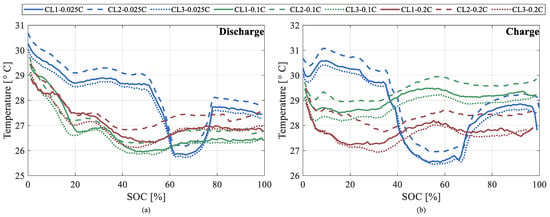
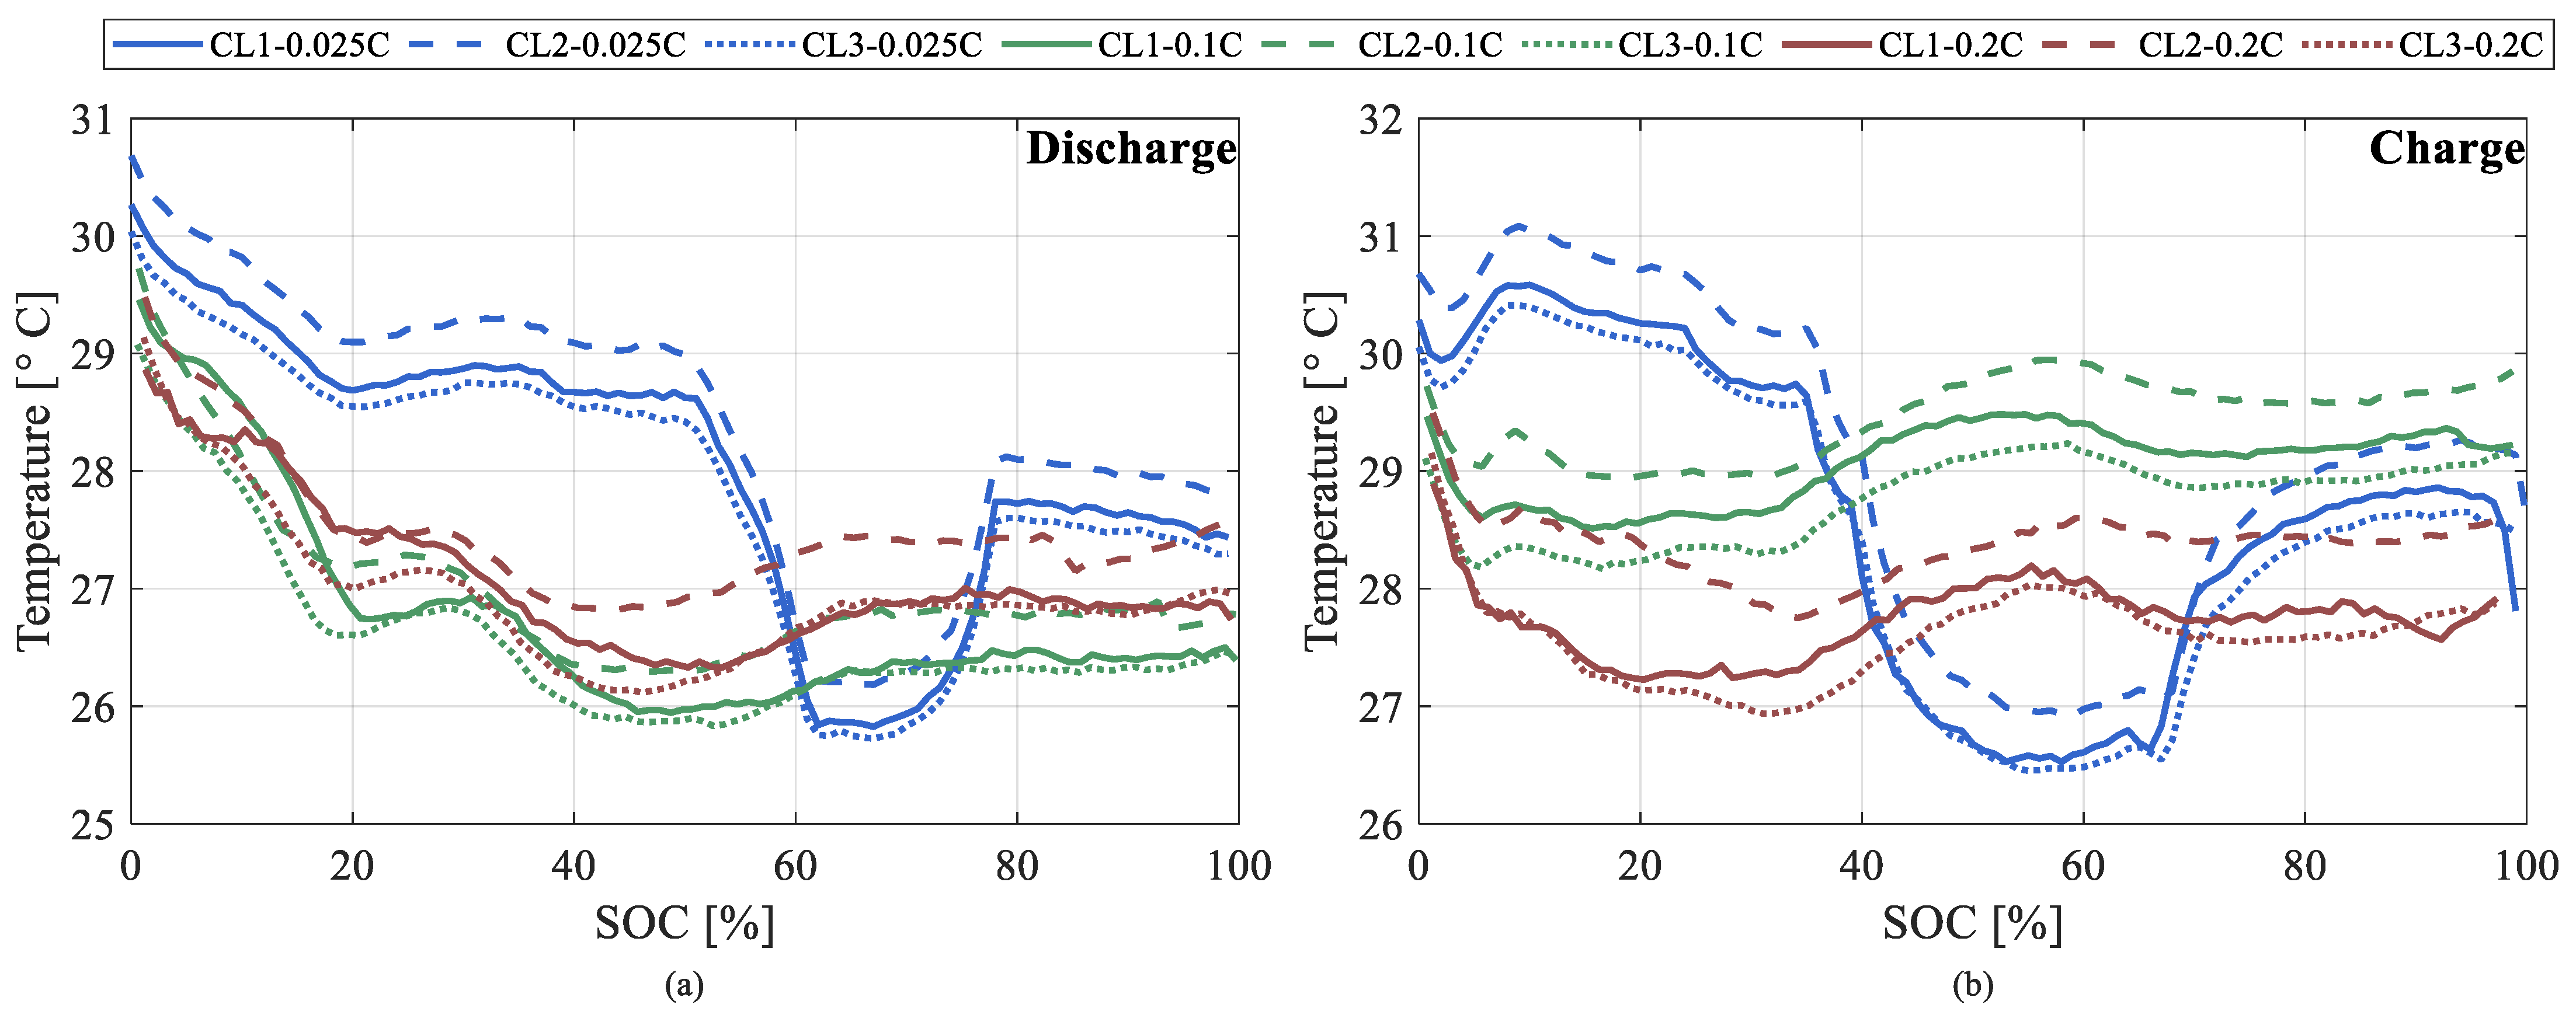
Figure 17 illustrates the temporal evolution of the cell temperature for the three C-rate low-current tests using all of the cells, while Table 3 summarizes the mean temperature and associated standard deviation values for the charge and discharge segments of each test using CL1. Although the 0.025 C experiment was conducted at the lowest current, its extended duration in an unregulated environment allowed ambient conditions to dominate the thermal behavior of the cell, resulting in a markedly larger temperature variation (standard deviation > 1 °C). By contrast, the 0.1 C and 0.2 C tests, which were completed in substantially shorter times, exhibited standard deviations consistently below 1 °C, indicating that the environmental temperature variation was less significant and self-heating could prevent the cell from cooling or heating up to the environmental temperature. Furthermore, the temperature variations during the charge phases of the 0.1 C and 0.2 C experiments were smaller than those during their respective discharges. This may have been due to the endothermic effect of the charge reaction in NMC cells. These findings suggest that low-current, long-duration tests (e.g., 0.025 C) should be performed in a temperature-controlled chamber to minimize environmental interference, whereas higher-current tests can be executed in an uncontrolled laboratory setting without significantly compromising the thermal consistency. Finally, it should be noted that the temperatures of the three cells followed the same pattern, and the observed temperature variations were not associated with individual cell characteristics (e.g., internal resistance), owing to the low current levels applied during the tests.
Figure 17.
Temperature profile of each OCV during low-current test for (a) charge and (b) discharge.
Table 3.
Results of the low-current tests.
5.3. Rated Current
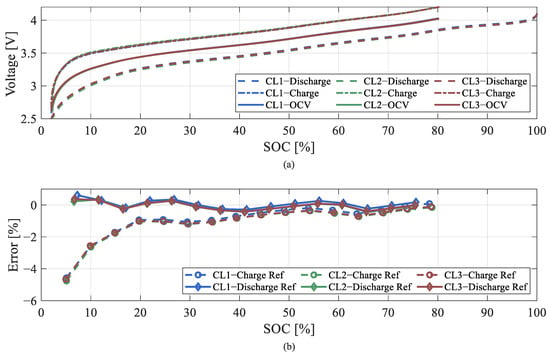
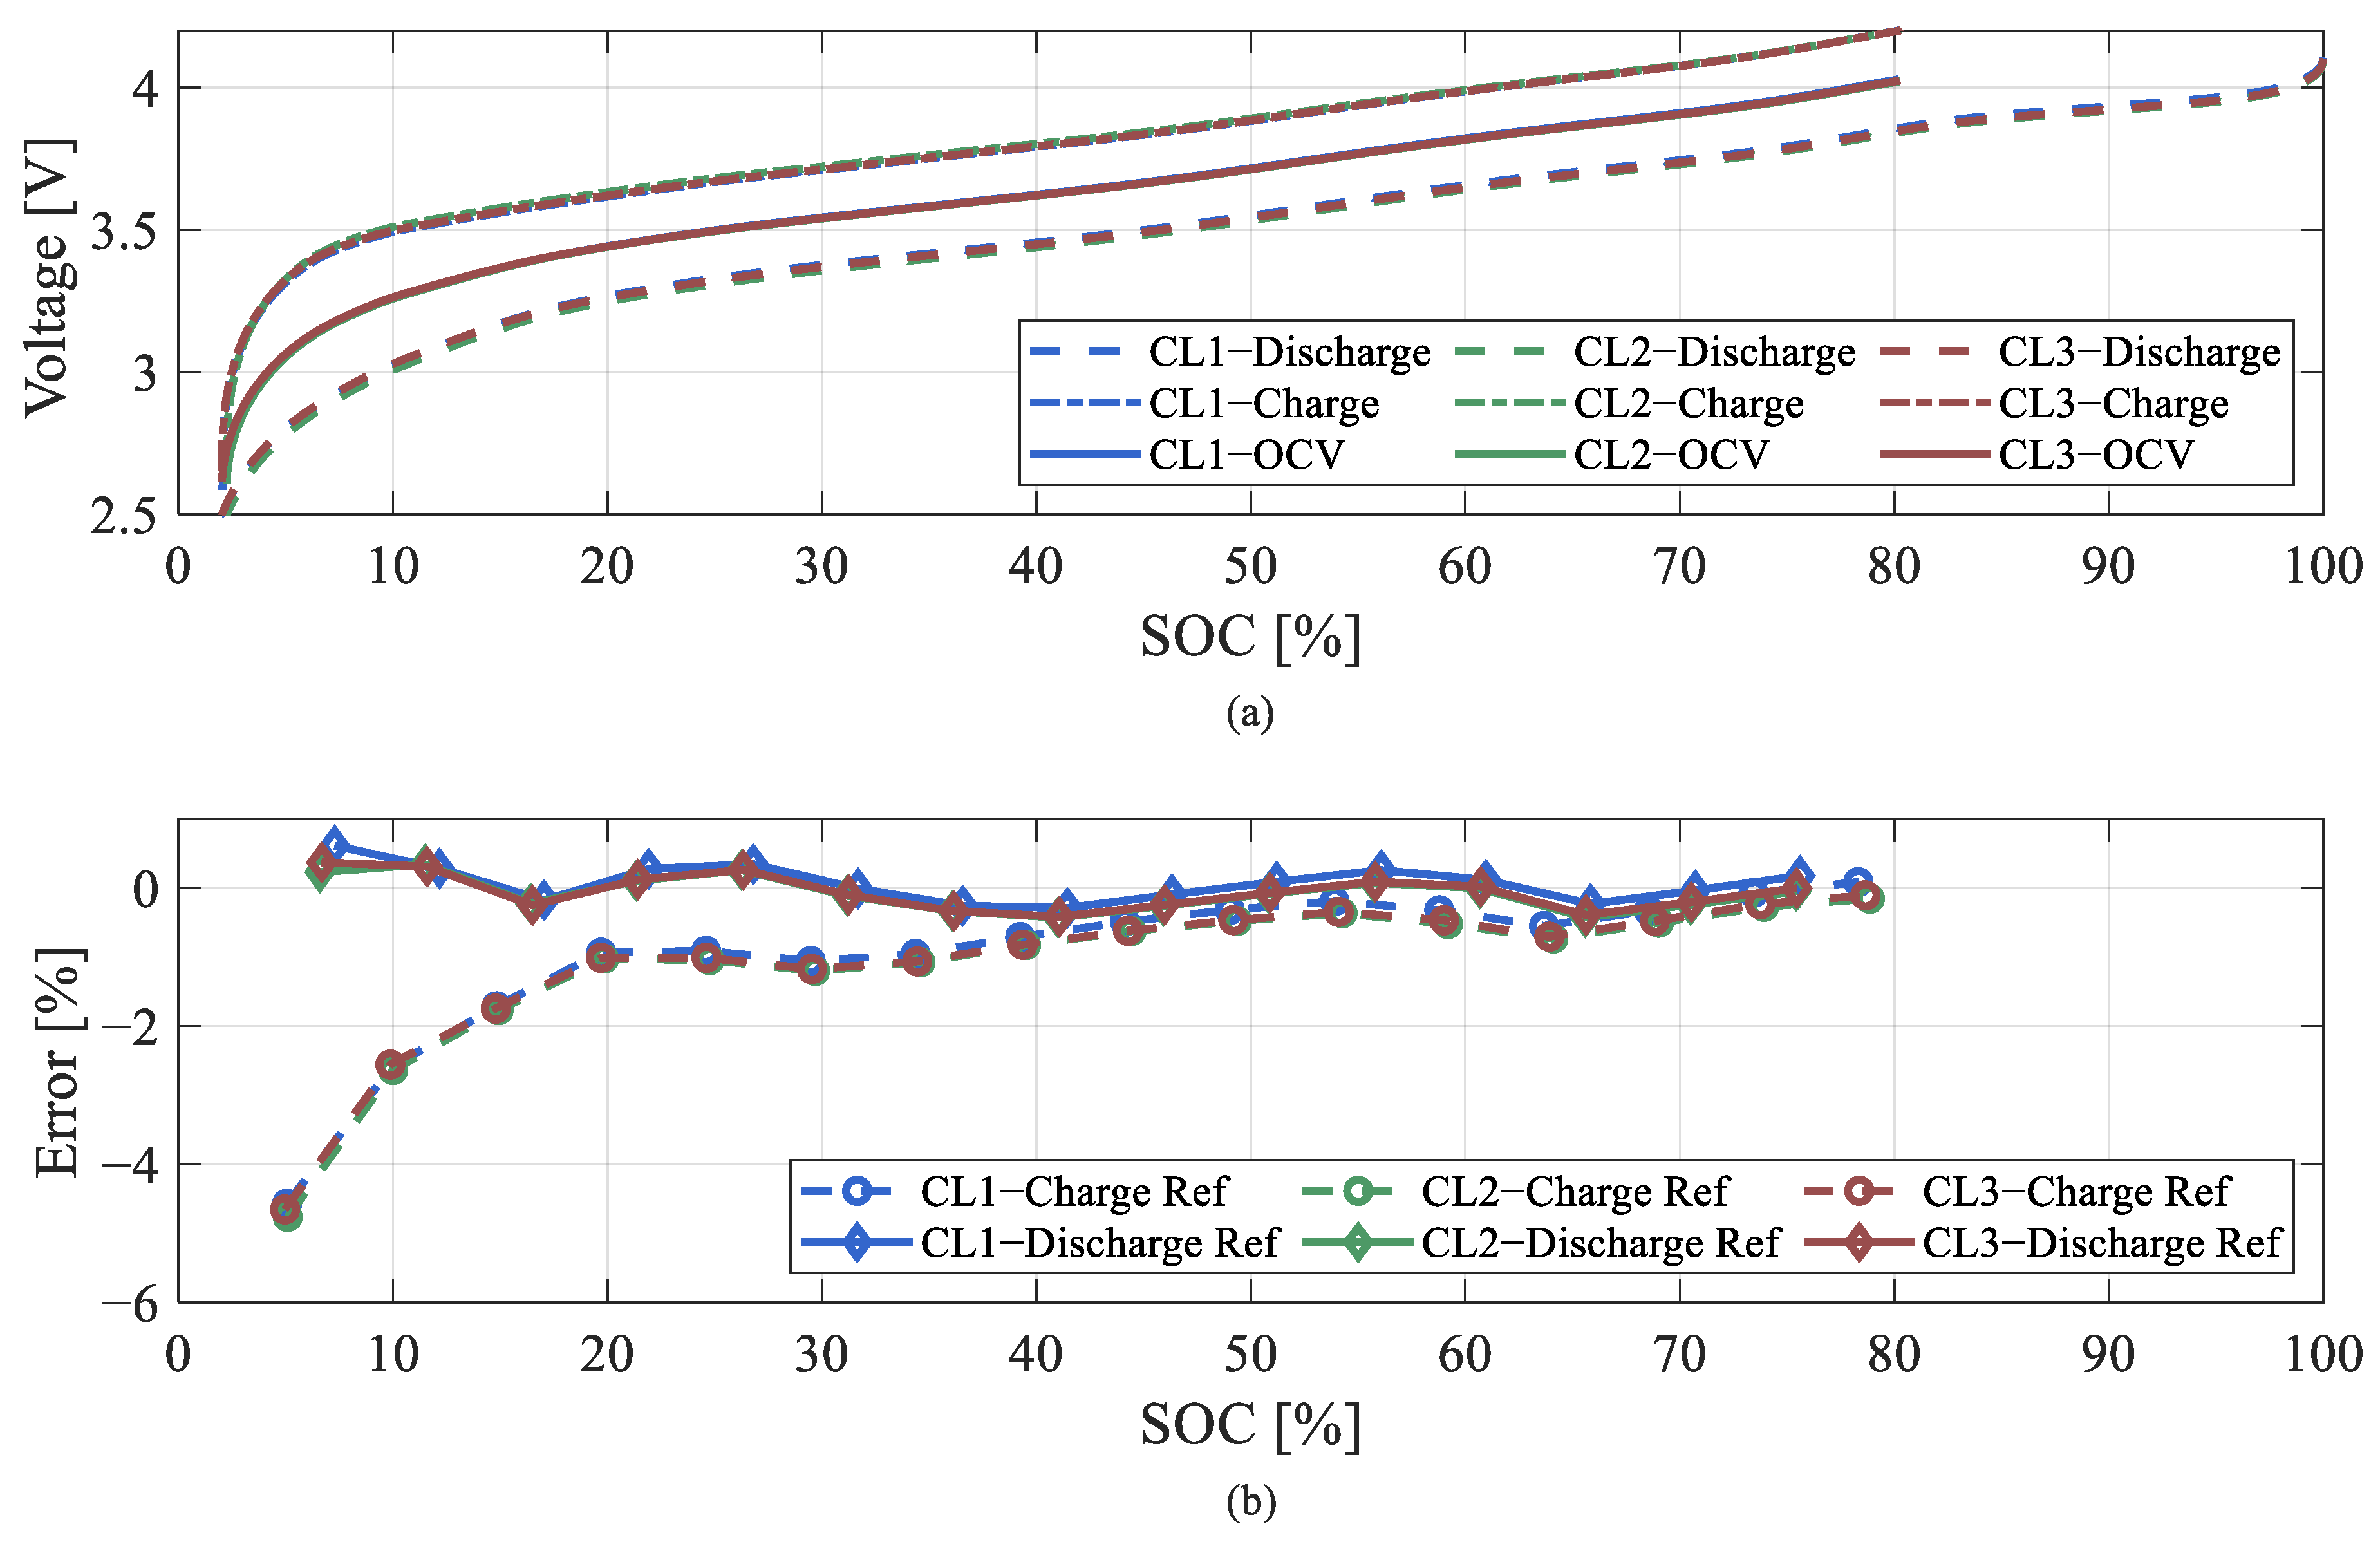
The OCV values obtained in the rated-current tests are presented in Figure 18, alongside the corresponding charge and discharge voltage profiles. A key limitation of this method is evident: because of the significant overpotentials at higher currents, the cell reaches its upper voltage limit at approximately 80% SOC. Because the OCV in this method is estimated by averaging the charge and discharge voltage curves, it is not possible to compute reliable OCV values beyond this SOC threshold. When using this test, it is not possible to distinguish between the charge and discharge OCV values. Therefore, the rated-current method cannot be used to estimate the voltage hysteresis. Because only a single OCV value is obtained in this test, the error was computed by considering both the charge and discharge curves as references. As can be observed in Figure 18, when the charge curve was taken as the reference, the OCV error gradually increased as the SOC decreased from 80%. Nevertheless, the error remained below 2% for SOC levels above 15%, while it approached 5% for SOC values around 5%.
Figure 18.
(a) OCV values obtained in rated-current tests and (b) OCV error values with respect to charge and discharge references.
In contrast, when the obtained OCV is compared with the discharge curve, the OCV error remains nearly constant and strongly reduced. Therefore, the rated-current method can be considered particularly reliable to find the discharge OCV.
Overall, the RMSE values of the estimated OCV values were approximately 1.5% and 0.25% with respect to the charge and discharge references, respectively. This represents a reasonable trade-off, given that the total test duration was reduced to less than 2 h—a substantial time reduction compared to more time-intensive methods.
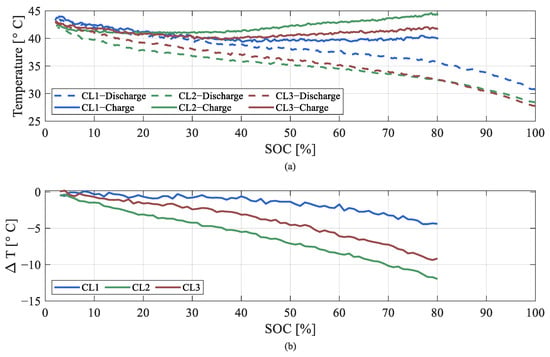
An important consideration in the rated-current test is the associated temperature profile. As shown in Figure 19, a high C-rate caused the cell temperature to rise to nearly 45 °C. Moreover, because of variations in the internal resistance values of the cells, the magnitude of this temperature increase differed from cell to cell. As observed, the temperature difference between the charge and discharge phases varied significantly, reaching approximately 5 °C, 9 °C, and 12 °C for CL1, CL2, and CL3, respectively. Moreover, the temperature was affected by the previous operation of the cells. Indeed, at the beginning, the cell was discharged, and its temperature increased from ambient temperature (25–30 °C) to 45 °C. During charging, the temperature change was smaller (within 5 °C) because the endothermic charging process partially compensated for the joule losses due to the internal resistance of the cell. Despite these substantial temperature differences during the tests, the final OCV values obtained remained very accurate for all three cells. As shown in Figure 18b, the OCV estimation error remained within 1% for state-of-charge values above 20% across all cells. A closer inspection reveals that CL1, which had the smallest temperature difference between charge and discharge, achieved slightly lower OCV errors. However, given the small magnitude of this improvement, it can be concluded that although the OCV obtained from the rated-current test was influenced by temperature, this effect was sufficiently small to be considered acceptable considering the lower time spent for this procedure.
Figure 19.
(a) Temperature profile of the rated-current test. (b) Temperature difference between charge and discharge profile.
5.4. Comparison of Techniques
The main characteristics of the analyzed test methods are compared in Table 4. Each test was investigated in detail, as discussed in the previous section. Based on the analysis, because the obtained OCV from the charge curve was better than that from the discharge curve in the low-current test, only the charge curve results are compared with those of other methods in this section.
Table 4.
Method comparison.
5.4.1. Complexity and Test Parameters
The complexity of each test is an important factor in determining its suitability for a given application. The “relaxation test” is considered the most complex among the three methods, because it involves multiple steps and requires significant effort to analyze the results. Additionally, two key parameters must be defined during the test setup: the number of points at which the OCV is to be measured, and the required rest time at each point. As discussed in the previous section, both parameters can be adjusted depending on the specific SOC range. The “low-current test” is regarded as moderately complex. While the test procedure itself is not particularly complicated, the low current levels necessitate the use of precise equipment to measure and apply the required current accurately. Furthermore, the test duration exceeds 40 h and must be conducted without interruption, adding to its complexity. Conducting the low-current test with higher C-rates can decrease the test time significantly, but as discussed in the last section, this comes at the cost of reduced accuracy. In contrast, testing at the rated current is the simplest of the three. It is relatively quick to perform, and the required measures can be obtained using less sophisticated equipment.
5.4.2. Time, Energy, and Data Continuity
The test duration becomes a crucial consideration when numerous tests need to be conducted, such as in aging studies where multiple cells must be characterized every n cycles. Although the “relaxation test” is more time-intensive than the other two methods, it is possible to design this test to reduce its total duration (e.g., by decreasing the number of SOC points or the resting time at each point). In contrast, the durations of the “low-current” and “rated-current” tests cannot be significantly shortened. In the case of the “low-current test,” reducing the test duration would require increasing the testing current, which compromises the OCV accuracy.
Considering the energy consumption of the tests, because only a charge or discharge process is needed for “relaxation” or “low-current” test, the required energy for either of these two tests is approximately 55% of that required for the “rated-current test”, which could be a significant factor in tests consisting of a large number of cells.
Additionally, unlike the other tests, data from the “relaxation test” is not continuous. Therefore, constructing a continuous OCV curve requires a fitting procedure (either linear or non-linear), which introduces some degree of inaccuracy in the resulting curve.
5.4.3. Accuracy
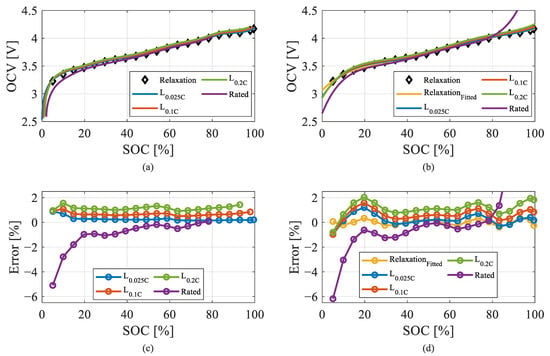
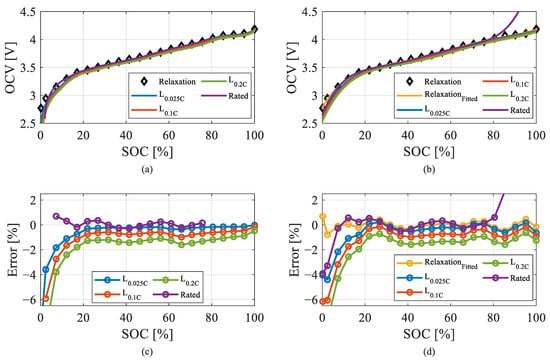
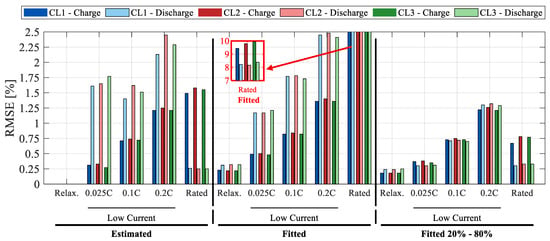
The final OCV curves obtained from each method, along with their corresponding fitted curves, are presented in Figure 20 and Figure 21 for the charge and discharge tests, respectively. The associated RMSE values relative to the charge and discharge references are reported in Table 5 and Table 6, respectively. The same results are also presented, for clarity, in Figure 22. The results indicate that the low-current test had a nearly constant error across the entire SOC range, which was always negative for the discharge and always positive for the charge (as a result of the internal resistance effect). Moreover, as explained earlier, the RMSE values for the low-current test results in the discharge cases were greater because of the greater error at a low SOC (i.e., lower than 20%).
Figure 20.
Charge OCVs: (a) measured OCVs, (b) fitted OCVs, (c) errors of the measured OCVs, and (d) errors of the fitted OCVs.
Figure 21.
Discharge OCVs: (a) measured OCVs, (b) fitted OCVs, (c) errors of the measured OCVs, and (d) errors of the fitted OCVs.
Table 5.
OCV RMSE values of different methods for charge curve (i.e., charge curves from the relaxation and low-current test results).
Table 6.
OCV RMSE values of different methods for discharge curve (i.e., discharge curves from the relaxation and low-current test results).
Figure 22.
RMSE of OCV values obtained with different methods for different cells.
The rated-current method can only predict a single OCV value for each SOC. If it is used to predict the discharge curve, it shows a limited and oscillating error. In contrast, when used to predict the charge curve, the error decreases as the SOC increases. Considering the charge curve, while the rated-current test yields an RMSE of approximately 1.5% (approximately five times that of the low current test result at 0.025 C), the results are comparable to those of the low-current test at 0.2 C, which has an RMSE of approximately 1.2%. Considering the fact that the rated-current test only requires approximately 25% of the time needed for the 0.2 C test, the increase in error may be acceptable for many practical applications. Additionally, when the discharge reference is considered, the RMSE drops significantly to approximately 0.25%, which is almost comparable to that of the low-current test at 0.025 C.
The following should be considered in relation to the fitting procedure. The fitting procedure provides good results when applied to the results of the relaxation test, with a very low RMSE of approximately 0.2% (for both charging and discharging), which indicates that the selected fitting equation provides an accurate representation of the true OCV of the cell. The application of the fitting procedure to the low-current test results for both charge and discharge cycles did not improve the accuracy; in fact, the RMSE slightly increased across all of the C-rates, although the increase remained marginal. Moreover, the errors of the fitted curves were no longer constant along the SOC axis, making it harder to compensate for them. However, by limiting the SOC range to 20–80%, the huge gap between the discharge and charge curves was no longer visible. These results are promising because, based on the application, a charge or discharge curve at low current may be available to be used for the OCV. In particular, for stationary applications, a constant current discharge over 4–8 h (i.e., 0.125–0.25 C) [28] could represent a required service scenario in the future development of power systems. In the case of the rated-current test, the limitation of usable data to SOC values below 80% causes the fitted curve to diverge substantially from the reference beyond that point, leading to an error that peaks at approximately 30% near full charge. Consequently, the overall RMSE increases significantly to near 10% and 8% for charge and discharge cycles, respectively. However, by restricting the fitting to an SOC range of 20–80%, the RMSE is reduced dramatically and becomes lower than that of the low-current test at 0.2 C during charging and almost equal to that of the low-current test at 0.025 C during discharging within the same SOC interval. These findings suggest that, despite its higher baseline error, the rated-current test can benefit significantly from post-processing techniques such as curve fitting—especially when limited to mid-range SOC values—making it a viable option for applications where the testing time is critical.
Finally, it should be noted that, across all of the methods, the accuracy values observed for the three cells were comparable. This indicates that, despite inherent differences in cell characteristics, the methods were able to maintain their accuracies, and the obtained results were not dependent on any specific cell. Consequently, the reported results can be regarded as generalizable rather than cell-specific.
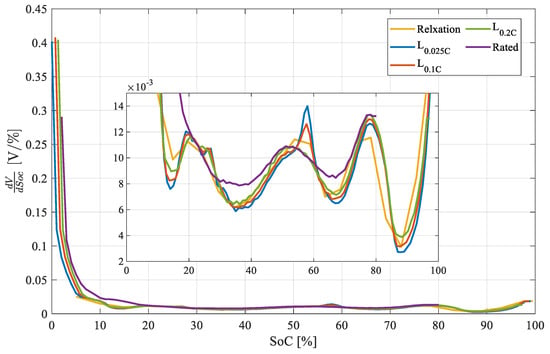
Another important aspect of comparison is the dynamic behavior of the OCV curve. This is expressed as the derivative of the voltage versus the SOC (i.e., ), which is relevant for various applications such as battery state estimation and control. The derivative of the OCV during charging versus the voltage is reported in Figure 23. As seen in the figure, the low-current test at 0.025 C captured more detailed features than the reference curve itself, including distinct peaks and valleys. Notably, a prominent peak appears at approximately 60% of the SOC in the 0.025 C data, which is absent in the relaxation as a result of a lack of data points in that specific SOC region. This level of detail is not observed in the results for the other two low-current tests (0.1 C and 0.2 C), although their overall shapes align closely with the reference.
Figure 23.
OCV dynamics of different test methods.
In contrast, the rated-current test produces a smoothed or filtered representation of the OCV dynamics, which limits its ability to capture finer variations. This effect is particularly evident below 20% of the SOC, where the rated-current test fails to reproduce valleys that are clearly visible in both the relaxation and low-current test results. These observations suggest that while the rated-current test is efficient in terms of the test duration, it compromises the fidelity of the OCV derivative, potentially limiting its utility in applications that rely on high-resolution dynamic voltage behavior.
5.4.4. Temperature Analysis
In the previous section, the temperature evolution of the cells during each test was presented in detail. This section discusses the results of a comparative analysis that was conducted to examine the effect of the temperature and provide further insights for the design of experimental procedures.
For the relaxation test, it has been well established in the literature [27] that temperature significantly influences the required relaxation time. As the temperature increases, the relaxation time decreases because electrochemical side reactions proceed more rapidly. Conversely, at lower temperatures, slower reaction kinetics result in longer relaxation times.
In the case of the low-current test, because the effect of the internal resistance is assumed to be negligible, the impact of temperature on the final OCV becomes more pronounced. Owing to the nonlinear relationship between the temperature and internal resistance, a decrease in temperature leads to reduced OCV accuracy, particularly at higher current levels. The experimental results corroborated this behavior: as the applied current increased, temperature variations resulted in greater divergence in the estimated OCV among the three cells, indicating a stronger temperature sensitivity at higher currents.
Finally, for the rated-current test, the results indicated that the effect of temperature was largely mitigated as a result of the averaging method used in the test procedure. In the conducted experiments, despite temperature differences exceeding 10 °C between the charge and discharge phases, the OCV estimation error remained below 1% and was comparable to those in cases with smaller temperature variations. It should be noted, however, that these conclusions may not hold at very low temperatures (approximately below 10 °C), where cell behavior can change significantly, and temperature effects may become dominant.
6. Conclusions
In this study, three commonly used OCV testing methods were experimentally evaluated on a Li-ion cell with an NMC cathode. Each method was analyzed independently to assess its accuracy and identify strategies for improving the testing efficiency. The results indicated that while the relaxation test yielded the most accurate OCV measurements, its primary limitation is the extended duration required. To address this, a variable relaxation time dependent on the SOC was proposed, enabling the estimation of the OCV within a predefined error threshold. For the low-current test, it was found that the OCV measured during the charging phase exhibited a more consistent error pattern, facilitating easier error compensation. Additionally, increasing the test current to 0.2 A resulted in a four-fold increase in the RMSE, while reducing the overall test duration by a factor of eight. This trade-off between accuracy and testing time provides flexibility in selecting an optimal current level based on specific application needs. Finally, the rated-current test demonstrated that, with appropriate post-processing, it is possible to obtain reasonably accurate OCV values in the mid-voltage range, while significantly reducing both the testing time and energy consumption. The rated-current test yielded the most reliable results when the SOC was restricted to the 20–80% range. The upper bound was primarily determined by the high current, which caused the cell to reach its maximum voltage at approximately 80% of the SOC, thereby reducing the accuracy of OCV curve fitting. Consequently, the highest fitting accuracy was achieved within the 20–80% SOC window.
The applicability of the investigated current profiles is therefore limited to operating conditions that are commonly encountered in practical battery applications, rather than being universally representative of all chemistries or use cases. Low-current profiles are frequently observed in electric vehicle charging scenarios, where constant-current charging is employed at relatively low C-rates, particularly in residential charging infrastructures where fast-charging capability is unavailable. In addition, rated-current charge and discharge profiles are representative of stationary energy-storage applications, especially in arbitrage-oriented services, where batteries are often operated at moderately high but constant C-rates for extended periods. Under such conditions, averaged voltage-based approaches, as adopted in the rated-current test, can provide a reasonable approximation of the OCV. Furthermore, OCV measurements based on relaxation profiles are relevant for applications that involve partial charge or discharge cycles followed by extended rest periods, such as stationary storage systems providing primary or secondary frequency control services. In these cases, a sufficient relaxation time allows the cell voltage to approach a quasi-equilibrium state, enabling more reliable OCV estimation. Moreover, because of the fundamental differences in cell characteristics across battery chemistries (e.g., NMC, LFP, and NCA), the results of this study cannot be directly generalized to all lithium-ion chemistries without loss of accuracy. Future work should therefore investigate one or more of the proposed methods across different chemistries to assess the extent to which the observed conclusions remain valid. A summary of the advantages and disadvantages of each method is reported in Table 7. For future research, these analyses can be extended to other cell chemistries to assess the generalizability of the findings. Moreover, the feasibility of applying these OCV estimation methods outside laboratory conditions, as explained earlier, can be investigated.
Table 7.
Advantages and disadvantages of test methods.
Author Contributions
Conceptualization, M.P.; methodology, M.P. and L.P.; software, M.P.; validation, M.P. and L.P.; formal analysis, M.P.; investigation, M.P.; resources, L.P.; data curation, M.P.; writing—original draft preparation, M.P.; writing—review and editing, L.P.; visualization, M.P.; supervision, L.P.; project administration, L.P.; funding acquisition, L.P. All authors have read and agreed to the published version of the manuscript.
Funding
This work was carried out within the MOST—Sustainable Mobility National Research Center and received funding from the European Union Next-GenerationEU (PIANO NAZIONALE DI RIPRESA E RESILIENZA (PNRR)—MISSIONE 4 COMPONENTE 2, INVESTIMENTO 1.4—D.D. 1033 17/06/2022, CN00000023). This manuscript reflects only the authors’ views and opinions; neither the European Union nor the European Commission can be considered responsible for them.
Data Availability Statement
The original contributions presented in this study are included in the article. Further inquiries can be directed to the corresponding author.
Conflicts of Interest
The authors declare no conflicts of interest.
Abbreviations
The following abbreviations are used in this manuscript:
| CCCV | constant current–constant voltage |
| LCO | Lithium Cobalt Oxide |
| LFP | Lithium Iron Phosphate |
| LMO | Lithium Manganese Oxide |
| NCA | Lithium Nickel–Cobalt–Aluminum Oxides |
| NCM | Nickel–Manganese–Cobalt |
| OCV | Open-circuit voltage |
| RMSE | Root mean square error |
| SOC | State of charge |
References
- Korthauer, R. Lithium-Ion Batteries: Basics and Applications; Springer: Berlin/Heidelberg, Germany, 2018; ISBN 3662530716. [Google Scholar]
- Ralls, A.M.; Leong, K.; Clayton, J.; Fuelling, P.; Mercer, C.; Navarro, V.; Menezes, P.L. The Role of Lithium-Ion Batteries in the Growing Trend of Electric Vehicles. Materials 2023, 16, 6063. [Google Scholar] [CrossRef] [Scilit]
- Šimić, Z.; Knežević, G.; Topić, D.; Pelin, D. Battery Energy Storage Technologies Overview. Int. J. Electr. Comput. Eng. Syst. 2021, 12, 53–65. [Google Scholar] [CrossRef] [Scilit]
- Wang, Y.; Tian, J.; Sun, Z.; Wang, L.; Xu, R.; Li, M.; Chen, Z. A Comprehensive Review of Battery Modeling and State Estimation Approaches for Advanced Battery Management Systems. Renew. Sustain. Energy Rev. 2020, 131, 110015. [Google Scholar] [CrossRef] [Scilit]
- Nejad, S.; Gladwin, D.T.; Stone, D.A. A Systematic Review of Lumped-Parameter Equivalent Circuit Models for Real-Time Estimation of Lithium-Ion Battery States. J. Power Sources 2016, 316, 183–196. [Google Scholar] [CrossRef] [Scilit]
- Wei, J.; Dong, G.; Chen, Z. Remaining Useful Life Prediction and State of Health Diagnosis for Lithium-Ion Batteries Using Particle Filter and Support Vector Regression. IEEE Trans. Ind. Electron. 2018, 65, 5634–5643. [Google Scholar] [CrossRef] [Scilit]
- Rumberg, B.; Schwarzkopf, K.; Epding, B.; Stradtmann, I.; Kwade, A. Understanding the Different Aging Trends of Usable Capacity and Mobile Li Capacity in Li-Ion Cells. J. Energy Storage 2019, 22, 336–344. [Google Scholar] [CrossRef] [Scilit]
- Pakjoo, M.; Piegari, L.; Rancilio, G.; Colnago, S.; Mengou, J.E.; Bresciani, F.; Gorni, G.; Mandelli, S.; Merlo, M. A Review on Testing of Electrochemical Cells for Aging Models in BESS. Energies 2023, 16, 6887. [Google Scholar] [CrossRef] [Scilit]
- He, Y.; Zeng, Q.; Tang, L.; Liu, F.; Li, Q.; Yin, Y.; Xu, S.; Deng, B. State of Health Estimation of Lithium-Ion Battery Based on Full Life Cycle Acoustic Emission Signals. J. Energy Storage 2025, 139, 118725. [Google Scholar] [CrossRef] [Scilit]
- Reniers, J.M.; Mulder, G.; Howey, D.A. Review and Performance Comparison of Mechanical-Chemical Degradation Models for Lithium-Ion Batteries. J. Electrochem. Soc. 2019, 166, A3189–A3200. [Google Scholar] [CrossRef] [Scilit]
- Abada, S.; Marlair, G.; Lecocq, A.; Petit, M.; Sauvant-Moynot, V.; Huet, F. Safety Focused Modeling of Lithium-Ion Batteries: A Review. J. Power Sources 2016, 306, 178–192. [Google Scholar] [CrossRef] [Scilit]
- Reniers, J.M.; Mulder, G.; Ober-Blöbaum, S.; Howey, D.A. Improving Optimal Control of Grid-Connected Lithium-Ion Batteries through More Accurate Battery and Degradation Modelling. J. Power Sources 2018, 379, 91–102. [Google Scholar] [CrossRef] [Scilit]
- Saldarini, A.; Longo, M.; Brenna, M.; Zaninelli, D. Battery Electric Storage Systems: Advances, Challenges, and Market Trends. Energies 2023, 16, 7566. [Google Scholar] [CrossRef] [Scilit]
- Blanc, J.; Schaeffer, É.; Auger, F.; Diab, Y.; Cousseau, J.F. A New Time-Adjustable Model-Based Method for Fast Open-Circuit Voltage Estimation of Lithium-Ion Cells. J. Power Sources 2023, 586, 233676. [Google Scholar] [CrossRef] [Scilit]
- Fernando, A.; Kuipers, M.; Angenendt, G.; Kairies, K.P.; Dubarry, M. Benchmark Dataset for the Study of the Relaxation of Commercial NMC-811 and LFP Cells. Cell Rep. Phys. Sci. 2024, 5, 101754. [Google Scholar] [CrossRef] [Scilit]
- Wycisk, D.; Mertin, G.K.; Oldenburger, M.; Latz, A. Analysis of Heat Generation Due to Open-Circuit Voltage Hysteresis in Lithium-Ion Cells. J. Energy Storage 2023, 61, 106817. [Google Scholar] [CrossRef] [Scilit]
- Zhu, Z.; Cai, F.; Yu, J. Improvement of Electrochemical Performance for AlF3-Coated Li1.3Mn4/6Ni1/6Co1/6O2.40 Cathode Materials for Li-Ion Batteries. Ionics 2016, 22, 1353–1359. [Google Scholar] [CrossRef] [Scilit]
- Espedal, I.B.; Jinasena, A.; Burheim, O.S.; Lamb, J.J. Current Trends for State-of-Charge (SoC) Estimation in Lithium-Ion Battery Electric Vehicles. Energies 2021, 14, 3284. [Google Scholar] [CrossRef] [Scilit]
- Ren, Z.; Du, C.; Wu, Z.; Shao, J.; Deng, W. A Comparative Study of the Influence of Different Open Circuit Voltage Tests on Model-Based State of Charge Estimation for Lithium-Ion Batteries. Int. J. Energy Res. 2021, 45, 13692–13711. [Google Scholar] [CrossRef] [Scilit]
- Yu, Q.Q.; Xiong, R.; Wang, L.Y.; Lin, C. A Comparative Study on Open Circuit Voltage Models for Lithium-Ion Batteries. Chin. J. Mech. Eng. 2018, 31, 65. [Google Scholar] [CrossRef] [Scilit]
- Lavigne, L.; Sabatier, J.; Francisco, J.M.; Guillemard, F.; Noury, A. Lithium-Ion Open Circuit Voltage (OCV) Curve Modelling and Its Ageing Adjustment. J. Power Sources 2016, 324, 694–703. [Google Scholar] [CrossRef] [Scilit]
- Shan, H.; Cao, H.; Xu, X.; Xiao, T.; Hou, G.; Cao, H.; Tang, Y.; Zheng, G. Investigation of Self-Discharge Properties and a New Concept of Open-Circuit Voltage Drop Rate in Lithium-Ion Batteries. J. Solid State Electrochem. 2022, 26, 163–170. [Google Scholar] [CrossRef] [Scilit]
- Yang, J.; Xia, B.; Huang, W.; Mi, C. Improved OCV Measurement Method with Reduced Relaxation Time. In Proceedings of the 2017 IEEE Transportation Electrification Conference and Expo, Asia-Pacific, ITEC Asia-Pacific, Harbin, China, 7–10 August 2017. [Google Scholar]
- Baccouche, I.; Jemmali, S.; Manai, B.; Nikolian, A.; Omar, N.; Essoukri Ben Amara, N. Li-Ion Battery Modeling and Characterization: An Experimental Overview on NMC Battery. Int. J. Energy Res. 2022, 46, 3843–3859. [Google Scholar] [CrossRef] [Scilit]
- Nikolian, A.; Firouz, Y.; Gopalakrishnan, R.; Timmermans, J.M.; Omar, N.; van den Bossche, P.; van Mierlo, J. Lithium Ion Batteries-Development of Advanced Electrical Equivalent Circuit Models for Nickel Manganese Cobalt Lithium-Ion. Energies 2016, 9, 360. [Google Scholar] [CrossRef] [Scilit]
- Omar, N.; Daowd, M.; Hegaz, O.; Mulder, G.; Timmermans, J.M.; Coosemans, T.; Van den Bossche, P.; Van Mierlo, J. Standardization Work for BEV and HEV Applications: Critical Appraisal of Recent Traction Battery Documents. Energies 2012, 5, 138–156. [Google Scholar] [CrossRef] [Scilit]
- Farmann, A.; Sauer, D.U. A Study on the Dependency of the Open-Circuit Voltage on Temperature and Actual Aging State of Lithium-Ion Batteries. J. Power Sources 2017, 347, 1–13. [Google Scholar] [CrossRef] [Scilit]
- Green Dealflow. MACSE Italy: Countdown to Europe’s Largest Energy Storage Auction. Available online: https://greendealflow.com/macse-italy-countdown-to-europes-largest-energy-storage-auction (accessed on 7 January 2026).





Disclaimer/Publisher’s Note: The statements, opinions and data contained in all publications are solely those of the individual author(s) and contributor(s) and not of MDPI and/or the editor(s). MDPI and/or the editor(s) disclaim responsibility for any injury to people or property resulting from any ideas, methods, instructions or products referred to in the content. |
© 2026 by the authors. Licensee MDPI, Basel, Switzerland. This article is an open access article distributed under the terms and conditions of the Creative Commons Attribution (CC BY) license.