Abstract
Fuel cells, as one of the most promising alternatives to lithium-ion batteries for portable power systems, still face significant challenges. A critical issue is their substantial performance degradation under low-humidity conditions. To address this, researchers commonly add silica to components. This study employs a control variable method to systematically investigate the impact of four parameters—gas stoichiometry, temperature, humidity, and silica content—on fuel cell performance. Initially, the effects of gas stoichiometry, temperature, and humidity on performance were examined. Subsequently, hydrophilic silica was incorporated into the membrane electrode assembly (MEA) to assess its potential for improving performance in low-humidity environments. Experimental results reveal that under 100% humidification, silica addition had a minimal impact on performance, particularly at high temperatures where performance improved by only 2.5%. This is attributed to increased water production at elevated temperatures, which—when combined with silica’s water retention properties—exacerbates flooding. However, when humidity was reduced to 50%, silica incorporation significantly enhanced performance. At high temperatures, silica addition resulted in a 126.2% performance improvement, demonstrating its efficacy as a rational strategy under low-humidity conditions.
1. Introduction
Fuel cells represent one of the most promising alternatives to lithium-ion batteries, offering advantages such as elimination of range anxiety and provision of clean, zero-emission energy. PEMFCs offer key advantages in electrochemical energy storage: (1) low-cost hydrogen storage from water electrolysis with minimal loss [1]; (2) >60% theoretical efficiency via direct chemical-to-electrical conversion, circumventing Carnot cycle limitations [2,3,4]; (3) zero-emission operation [5]; (4) high energy density for drones and portable devices [6,7,8]. However, prolonged operation inevitably induces progressive performance degradation in fuel cells, resulting from multifaceted factors including electrode material deterioration, catalyst loss, mechanical damage to membrane electrode assemblies (MEAs), and operational condition fluctuations. Such degradation not only compromises fuel cell efficiency and power output but also shortens service life and escalates maintenance/replacement costs. Critically, water management capability remains a pivotal determinant of performance—both excessive and insufficient humidity accelerate degradation mechanisms, as established in prior analysis. Crucially, while flooding causes severe but reversible performance fluctuations over short timescales and is readily detectable, membrane drying induces gradual yet insidious degradation that is often undetectable until irreversible damage occurs. Consequently, membrane drying poses a more critical threat to PEMFC durability. Hung-Fan Lee et al. [9] investigated an electrospun silica fiber material with hygroscopic and conductive properties for application in PEMFC microporous layers, achieving a 23% power density increase. Vani R et al. [10] studied PVA-silica composites in PEMFCs, reporting ~35% higher proton conductivity and ~28% maximum power density enhancement. Jing Li et al. [11] demonstrated that nanoscale silica suppresses MEA expansion while significantly improving DMFC performance. Ying-Jeng Kuo et al. [12] incorporated silicate materials into MEAs, enhancing proton conductivity by 50% and thermal stability by 45%. Guoxiao Xu et al. [13] developed in situ-sulfonated Nafion/silica composite membranes for high-temperature PEMFCs, increasing proton conductivity by 48% and power density by 40%, with notable improvements in thermal stability and oxidation resistance. Byungrak Son et al. [14] analyzed SiO2/Nafion membranes, finding that silica addition optimized MEA microstructure and water management, increasing water absorption by ~45% and maximum power density by ~28%. Y. Zhang et al. [15] demonstrated that mesoporous hollow silica spheres (MHSS) enhanced maximum power density by ~35% and thermal stability by ~30% in MEAs. Gicheon Lee et al. [16] applied heteropoly acid–imidazole modified mesoporous silica in low-humidity/high-temperature PEMFCs, improving proton conductivity (52%), maximum power density (47%), thermal stability (40%), and antioxidant capacity (38%). Serigne Seck et al. [17] developed fluoropolymer nanocomposites via sol–gel/reactive extrusion, enhancing proton conductivity (50%), power density (45%), and chemical degradation resistance (40%). Le Vu Nam et al. [18] embedded ordered mesoporous TiO2 microplates in Nafion® membranes for extreme conditions, improving proton conductivity (43%), power density (38%), hydrolysis resistance (30%), and mechanical strength (35%) through optimized water management. Chanmin Lee et al. [19] incorporated SiO2/heteropolyacid ionic polymers into polyetherimide nanofiber membranes, increasing proton conductivity (45%), power density (40%), thermal stability (35%), and mechanical strength (30%) via synergistic effects. Seansoo Hwang et al. [20] implemented functionalized organic/inorganic composite PEMs, enhancing proton conductivity (40%), power density (35%), mechanical strength (30%), and thermal stability (28%) through improved water management. Khaled Charradi et al. [21] developed silica/montmorillonite-LDH-SPEEK membranes, boosting proton conductivity (45%), power density (40%), mechanical strength (35%), and durability (30%) via enhanced chemical stability.
The aforementioned studies primarily focus on the use of SiO2 modifications in MEAs to enhance proton conductivity, thermal stability, antioxidant capacity, and power density, demonstrating that the hydrophilic properties of silica indeed contribute to improved fuel cell performance. However, current research is predominantly concentrated on the enhancement of performance through the addition of SiO2 [9,10,11,12,13,14,15,17,19], while studies on the effects of temperature and humidity variations remain relatively limited [16,18]. In response to this gap, the present study employs a controlled variable method to systematically investigate the effects of gas stoichiometry, temperature, humidity, and SiO2 content on fuel cell performance, providing valuable insights for the commercialization of fuel cells. This paper is organized into four main sections: the Section 1 reviews the current state of research both domestically and internationally; the Section 2 describes the preparation process of fuel cells; the Section 3 presents experimental results and discussions; and the Section 4 concludes the study.
2. Materials and Methods
This experiment uses a self-made MEA, which helps to observe and analyze the impact of the process flow on fuel cell performance, and lays a foundation for future research. Through preliminary experiments and reading relevant papers [22,23,24,25,26,27,28,29], the experimental temperatures of PEMFC in this article were selected as 65 °C, 80 °C and 85 °C. The fuel cell test station used in this study was Scribner Associates 850C (Scribner Associates Inc., Southern Pines, NC, USA), the potential was CORRTEST CS310 (Wuhan Corrtest Instruments Corp., Ltd., Wuhan, China), and the EIS analyzer was PaLmSens EmStat4R (PalmSens BV, Houten, The Netherlands).
2.1. Single Cell Structure
This study employs a single cell with a 5 cm2 active area. Components include the MEA, leak-proof gaskets, graphite bipolar plates, metal collector plates, and end plates. As the PEMFC was custom assembled, the fabrication process is briefly outlined to ensure structural clarity.
2.1.1. Gas Diffusion Layer (GDL)
The GDL needs to have the following properties: (1) It must have good gas diffusion capability, which is the basic condition to ensure the performance of PEMFC. (2) When the membrane deforms due to excessive water absorption, GDL must have sufficient mechanical strength to support the MEA. (3) GDL must have good conductivity, so that the electrons generated by the anode can be introduced into the external circuit, and the electrons from the external circuit can be introduced into the cathode. (4) PEMFC will produce water when working, so GDL must have good drainage capacity.
2.1.2. Catalyst Layer
The catalyst layer comprises catalyst particles, ionomer (proton conductor), and additives (e.g., pore formers, PTFE, hydrophilic ceramics). Its dual functions include reducing electrochemical reaction activation energy and enabling electron conduction. Complete reactions require efficient triple-phase boundaries (solid catalyst/liquid electrolyte/gas reactants). Optimal ionomer content enhances three-phase reaction zones, while additives like pore formers improve gas accessibility. PTFE content should be optimized for specific humidity conditions.
2.1.3. Membrane Electrode Assembly (MEA)
The MEA—PEMFC’s core component—directly governs cell performance and longevity. The main structure of the MEA studied in this paper can be divided into two parts: GDL and catalyst coated membrane (CCM). The basic manufacturing principle of CCM is to spray a catalyst (Pt/C) on a proton exchange membrane (PEM), and the PEM is a high-molecular polymer, which has the function of conducting hydrogen ions and blocking direct contact between cathode and anode gases. The other part is GDL, and the GDL used in this paper is commercially available.
2.1.4. PEM
PEM is a solid polymer with advantages like small size and light weight. It exhibits fuel and oxidant barrier ability, high-temperature resistance, good ion conductivity, and excellent mechanical properties. Nafion membranes, developed by DuPont in 1966, significantly improved PEMFC performance with their polytetrafluoroethylene structure and microporous network. Nafion’s performance relies on humidity and temperature, as hydrogen ion conduction requires water. Research to enhance water retention focuses on two approaches: modifying Nafion into self-humidifying membranes by embedding platinum or incorporating water-absorbent materials like silica or titanium dioxide. The PEM used in this study is Nafion 211, with a thickness of 25 μm and a proton conductivity of 0.083 S/cm.
2.1.5. Graphite Flow Plate
The graphite flow plate has the function of guiding hydrogen and oxygen gases and products in and out and conducting electrons. Therefore, the flow channel plate must first have good air tightness and cannot be made of porous material. On the other hand, the graphite flow plate also has the function of guiding electrons generated by chemical reactions, so it needs to have good conductivity. Finally, there are flow channels of various shapes inside the graphite flow plate to ensure that hydrogen and oxygen can be evenly distributed on the gas diffusion layer, so the graphite flow plate is in close contact with the GDL. Currently commonly used flow channel designs include grid flow channels, serpentine flow channels, parallel flow channels and metal mesh flow channels [30,31]. This experiment used a serpentine flow channel, which can thoroughly alleviate the problem of insufficient gas supply at the end of the flow channel, thereby improving performance.
2.1.6. Collector Plate
The function of the collector plate is to collect current and conduct heat energy, and conduct the electrons generated by the electrochemical reaction to the external load. The collector plate used in this paper is made of red copper and has additional surface gold plating to increase its corrosion resistance. The operating temperature is ensured by installing a heating plate on the outside, and grooves are processed at the gas inlet and outlet ends and O-type rubber rings are installed to avoid air leakage.
2.1.7. End Plate
The end plate is the outermost layer of PEMFC. Its main function is to apply uniform pressure inside the fuel cell so that the contact and chemical reactions inside the fuel cell can proceed stably. This paper uses 10 mm thick fiberglass end plates, which are not only insulating and heat-resistant, but also install sealing gaskets at the entrance and exit ends to prevent air leakage.
2.2. Catayst Coated Membrane CCM
The production of MEA is mainly divided into two methods: CCS (Catalyst coated substract) and CCM. CCS was the mainstream method for making MEA in the early days. It has the advantages of being a simple method and high output. The main disadvantage is that the contact surface between the catalyst layer and the membrane has high impedance, and it is difficult to reduce the impedance through the hot pressing process. CCM sprays catalyst slurry on the transfer substrate, and then transfers the catalyst layer to both sides of the film through a hot pressing process. Since the substrate used in this method is flatter than GDL, the impedance between the two interfaces can be reduced. The sprayer model used in this paper is Sono-Tek. In order to overcome the expansion problem of the membrane due to moisture, the spraying speed needs to be strictly controlled to prevent the membrane from expanding too fast.
2.2.1. Silica Preparation
In the experiment, the performance changes under low humidification were tested by adding different contents of SiO2 to the catalyst layer. Based on an average of 20 nm silica, the method proposed by Munakata et al. [32] was used to sulfonate it with 1,3-propylsulfonyl lactone. The sulfonated nano silica is collected and used in the laboratory through processes such as centrifugal separation and vacuum drying.
2.2.2. The Specific Process of CCM
The sulfonated silica was blended with conventional Pt/C catalyst at a predetermined mass ratio (e.g., 2 wt% silica). This mixture was ultrasonically homogenized with Nafion® solution and isopropyl alcohol for 30 min to form catalyst ink. The ink was deposited onto the PEM via automated spray coating with programmed serpentine trajectories. Coated MEAs underwent stepwise drying followed by hot-pressing against GDL. The specific steps are as follows:
- (1)
- Mix the catalyst with 5 wt% Nafion solution and then mix isopropyl alcohol solvent and deionized water. The ratio of catalyst to Nafion content is 2:1. Then place it in an ultrasonic oscillator as shown in Figure 1 for two hours to allow the slurry to be evenly distributed.
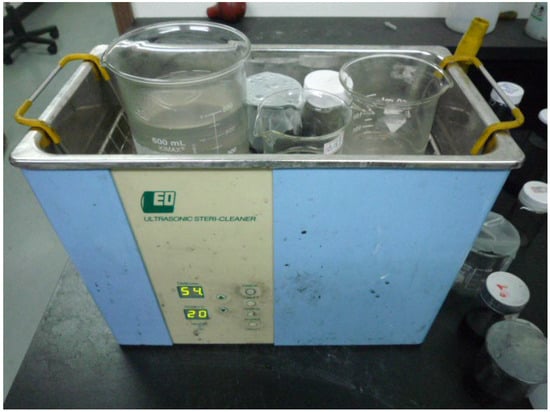 Figure 1. Ultrasonic oscillator.
 - (2)
- First, clean the automatic spraying machine pipeline with isopropyl alcohol, then open the air pressure bottle and set the heating plate temperature to 80 °C.
- (3)
- After the heating plate reaches the set temperature, the slurry is placed in the automatic spraying machine for positioning testing to determine whether the slurry can be sprayed normally.
- (4)
- Set the spraying parameters and do path testing to determine the correctness of the spraying position.
- (5)
- After spraying, place the MEA in a circulation oven and bake for eight hours.
- (6)
- Use protective paper for hot pressing to complete the production of the MEA.
2.2.3. Catalyst Layer Weight Detection
Due to the high price of the catalyst Pt, the amount of spraying needs to be accurately controlled during spraying.
This paper uses an automatic spraying machine to spray the catalyst on the surface of the substrate according to the preset path and spraying times and places it in a drying oven to dry at 60 °C for 8 h. The specific steps are as follows: (1) Start up and complete warm-up. (2) Set the spraying program. (3) Place the substrate at the designated position and set spraying for 10 times. (4) Place it in a drying box to dry for 8 h and then weigh it on a microbalance to determine the spray amount. (5) Change the number of sprays and repeat the above steps 5 times.
2.3. Fuel Cell Assembly Process
Assembly is an important step to ensure its performance. The fuel cell studied in this paper is a low-temperature type, and its assembly process is as follows:
- (1)
- Clean bipolar plates and graphite flow field plates with industrial-grade ethanol;
- (2)
- Assemble end plates and current collector plates, insert ten M6 fixation bolts through mounting holes, and apply helical PTFE tape wraps for electrical insulation between electrodes;
- (3)
- Stack the end plates, current collector plates, graphite flow channel plates, membrane electrode groups, graphite flow channel plates, current collector plates, and end plates in sequence and tighten them with nuts, preload is 2 MPa.
2.4. Activation and AC Impedance
After completing the air leakage inspection, the fuel cell still needs to undergo an activation process before performing various performance tests. The specific process is as follows: (1) Maintain the open circuit voltage (OCV) for ten minutes after introducing gas. (2) Run at 0.6 V and 0.2 V for 30 min, respectively, and cycle 6 times. (3) If the polarization curve is stable and the performance reaches the standard, the activation is completed.
AC impedance is a measurement method that uses small amplitude sine wave potential as a disturbance signal. On the one hand, it can avoid large interference to the fuel cell system. On the other hand, it can make the relationship between the disturbance and the system close to linear, thus simplifying data processing. AC impedance is also a frequency region measurement method that can study the electrode system with the impedance spectrum of the frequency range width. Therefore, it can obtain more information on dynamics or electrode interface results than other electrochemical methods.
2.5. Calculation of Relative Humidity
The percentage of the mass of water vapor in the fluid to the mass of saturated water vapor under the same conditions is the relative humidity. The calculation equation is
where Pv is the water vapor pressure (given by the bubbler temperature) and Ps is the saturated water vapor (given by the cell temperature).
2.6. Gas Stoichiometry
The fuel cell needs enough fuel when discharged. The following is the minimum amount of hydrogen and oxygen consumed to produce unit current.
The anode can release 2 mol electrons per mol of hydrogen, and the unit current represents the generation of electricity containing unit coulombs per second (i.e., 1 A = 1 coulomb/s). An amount of 1 mol electrons is approximately equal to 96,500 coulombs. The hydrogen required per ampere of current is calculated as follows:
1 A = 1 (C/s)(1 mole/96500 C)(1/2) = 5.18 × 10⁻⁶ mole/s.
This parameter is the number of moles of hydrogen required to produce unit current per second.
Due to
1 mole = 22.4 L = 22,400 mL (0 °C and 1 atm).
Therefore, the amount of hydrogen required per amp per minute is
5.18 × 10⁻⁶ mole/s × 22,400 mL × 60 s/min = 6.96 mL/min.
From the above calculation, it can be seen that the amount of gas required per unit current is 7 mL, which is equivalent to 1. The molar amount of oxygen required at the cathode is half that of hydrogen, that is, the amount of oxygen required to generate each ampere of current is 3.5 mL, which is one equivalent.
3. Results
This paper uses the CCM spraying method, using isopropyl alcohol and distilled water to prepare the spraying solvent, and analyzes the performance differences in the fuel cell under different relative humidity by changing the Nafion content. On the other hand, the performance changes under low humidification conditions were tested by adding different contents of SiO2 to the catalyst layer. Temperature and humidity are two critical factors influencing fuel cell performance. As established in prior studies [22,23,24,25,27,28,29], the operational temperature of fuel cells typically ranges between 60 and 80 °C (see Table 1), which enhances reaction kinetics and overall cell efficiency. The humidification range is generally maintained at 30–90% RH, as deviations below or above this threshold may induce membrane drying or cathode flooding, respectively—both are detrimental to performance. Notably, membrane drying causes irreversible degradation. Based on this analysis, the present study adopts a temperature range of 65–85 °C and humidity range of 50–100% RH. The 5 °C temperature increase (relative to conventional ranges) is implemented to leverage enhanced catalyst activity enabled by silica additives, while maintaining optimal hydration. Given our focus on performance variability across diverse MEAs under varying operational conditions, potential performance anomalies warrant consideration.

Table 1.
Temperature-humidity parameters in existing papers.
3.1. Performance Changes in Nafion Membranes of Different Weights Under Different Humidification
The catalyst content can be expressed in two ways: platinum loading (mg/cm2) and catalyst loading (mg/cm2), which represent the loading per unit area and the total loading, respectively. In this study, the former method is used for calculation, as shown in the following equation:
where Wcat is the catalyst loading (mg/cm2), Lcat is the total mass of the catalyst coated on the MEA (mg), and A is the effective area of the MEA (cm2).
According to the above calculation method, the cathode and anode catalyst loading of the fuel cell are 0.4 and 0.2 mg/cm2 respectively, and to ensure the uniformity of gas diffusion, the gas input amounts of the cathode and anode are 1.2 and 4 times stoichiometry, respectively. The optimal value of Nafion in the catalyst layer is studied by changing the operating temperature.
3.1.1. Performance Changes Under Different Nafion and Humidification at 65 °C
After the fuel cell is completed, the polarization curve and AC impedance test will be carried out on the fuel cell. Figure 2 shows the polarization curves with different Nafion masses and a reaction area of 5 cm2 at 65 °C and 100% humidification. It can be seen from Figure 2 that under 0.6 V, the fuel cell reaches the optimal performance: 559.12 mA/cm2 at Pt/C:N-2:0.75. A low platinum can cause rapid degradation of performance, and blindly increasing the platinum does not further improve performance.
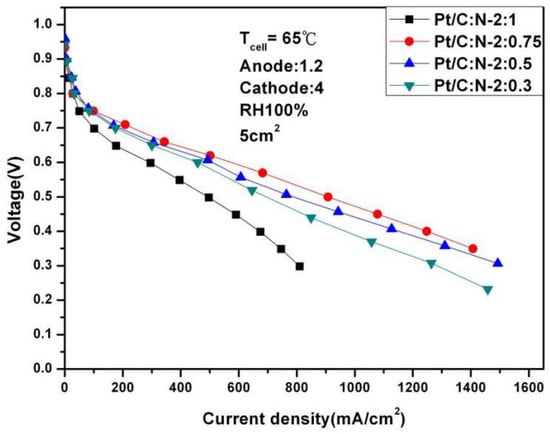
Figure 2.
Polarization curves of fuel cells under 100% humidification (65 °C).
It can be seen from Figure 3, when the humidity is reduced to 50%, Pt/C:N-2:0.75 is still the optimal performance combination at 0.6 V, but its performance has been significantly reduced to 311.43 mA/cm2. This shows that Nafion®-HP still has serious water shortage problems under low-humidity conditions, which in turn leads to a significant decrease in performance.
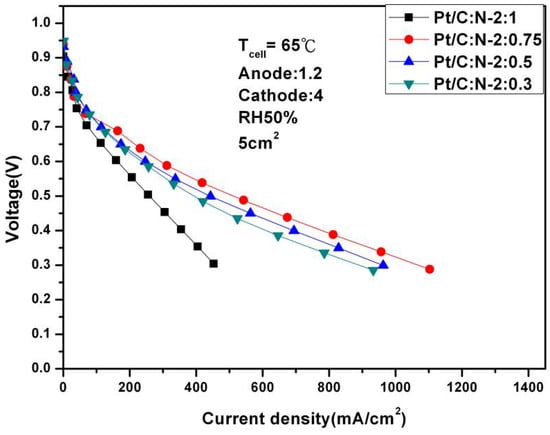
Figure 3.
Polarization curves of fuel cells under 50% humidification (65 °C).
Figure 4 and Figure 5 are AC impedance curves at different humidity at 65 °C. From the two figures, it can be seen that the impedance under different Nafion weights is very different. When the amount of Nafion is too high, the impedance will be greatly increased, resulting in a decrease in performance, which is consistent with the results in Figure 2 and Figure 3. When Pt/C:N-2:0.75, both ohmic impedance and polarization impedance are optimal values.
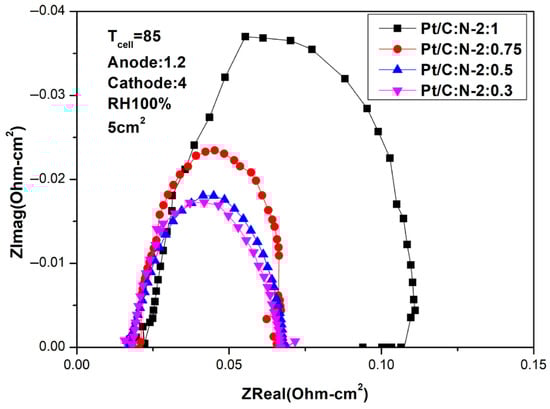
Figure 4.
AC impedance curves under 100% humidification (65 °C).
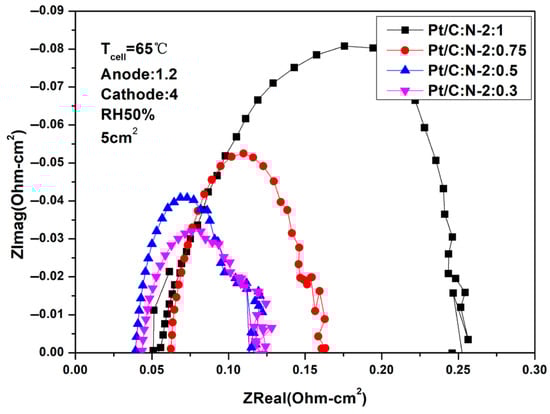
Figure 5.
AC impedance curves under 50% humidification (65 °C).
In addition, under 100% humidification, the impedance values under the conditions of Pt/C:N-2:0.5 and Pt/C:N-2:0.3 are relatively close. But when the humidity drops to 50%, their ohmic impedance and polarization impedance increase significantly. This shows that low humidity will make the reaction environment inside the fuel cell harsh, thereby affecting its performance.
3.1.2. Performance Changes Under Different Nafion and Humidification at 80 °C
Nafion®-HP developed by DuPont has high temperature and low humidity properties. After referring to the current common operating temperatures of fuel cells [22,23,24,25,26,27,28,29], this paper will continue to explore the performance changes in fuel cell under different humidity at 80 °C. Figure 6 and Figure 7, respectively, show the polarization curves at 80 °C with a fixed stoichiometric ratio (1.2 and 4) under different humidification (100% and 50%).
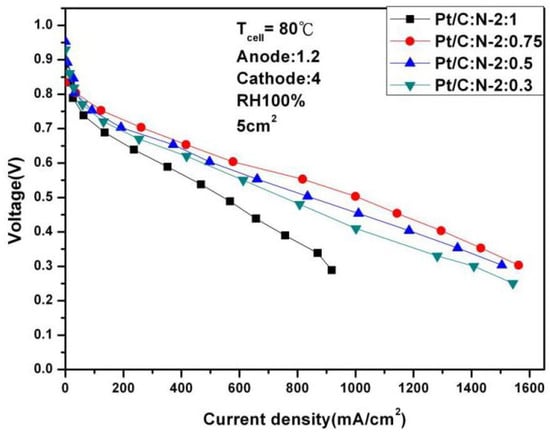
Figure 6.
Polarization curves under 100% humidification (80 °C).
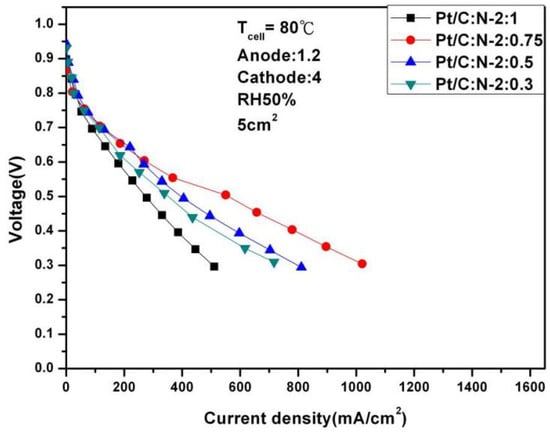
Figure 7.
Polarization curves under 50% humidification (80 °C).
It can be seen from the above two figures that under 100% humidity and 0.6 V, the performance reaches the optimal 587.56 mA/cm2 at Pt/C:N-2:0.75, which is similar to the situation at 65 °C. When the humidity is reduced to 50%, the performance at 0.6 V under the same conditions is 269.56 mA/cm2, and the degradation rate is 54%. Figure 8 and Figure 9 are the AC impedance curves of 100% and 50% humidification at 80 °C, respectively. It can be seen from the figures that although the impedance is optimal when Pt/C:N-2:0.75, it increases significantly compared with 65 °C, and the impedance increases less under other conditions. When the humidity becomes 50%, its impedance increases significantly. This is due to the significant decrease in the moisturizing ability of Nafion®-HP when the temperature increases. This also illustrates the importance of humidity on fuel cell performance and the significance of this study.
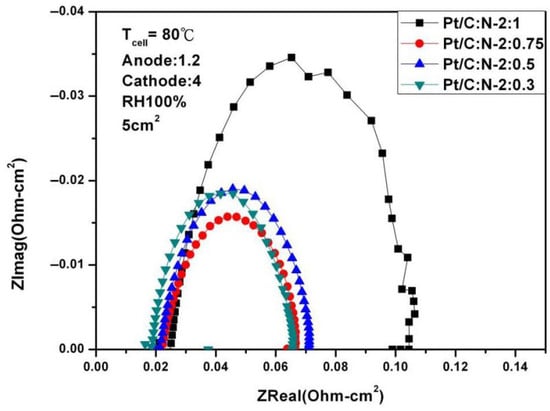
Figure 8.
AC impedance curves under 100% humidification (80 °C).
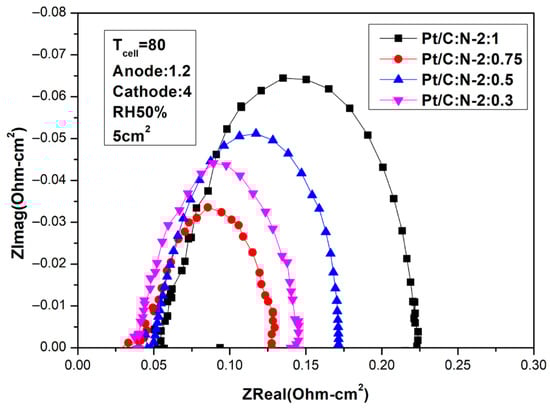
Figure 9.
AC impedance curves under 50% humidification (80 °C).
3.1.3. Performance Changes Under Different Nafion and Humidification at 85 °C
To further test the performance of the fuel cell, we continued to increase the temperature to 85 °C. Figure 10 and Figure 11 are polarization curves of 1.2 and 4 stoichiometric ratio gases at 85 °C under different humidification. The optimal performance is 607.56 mA/cm2 under 100% humidification, 0.6 V and Pt/C:N-2:0.75. This is due to the increase in temperature, so its performance has also slightly improved. But when the humidity drops to 50%, its performance at 0.6 V also drops sharply to 263.15 mA/cm2, with a degradation rate of 56%. This experiment shows that high temperature and high humidity have huge benefits on fuel cell activity and internal humidity, thereby ensuring stable performance. But when the humidity drops, the high evaporation due to high temperature will cause the performance of fuel cells to drop sharply.
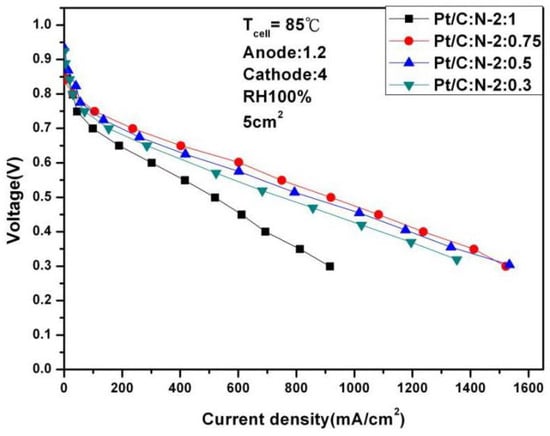
Figure 10.
Polarization curves under 100% humidification (85 °C).
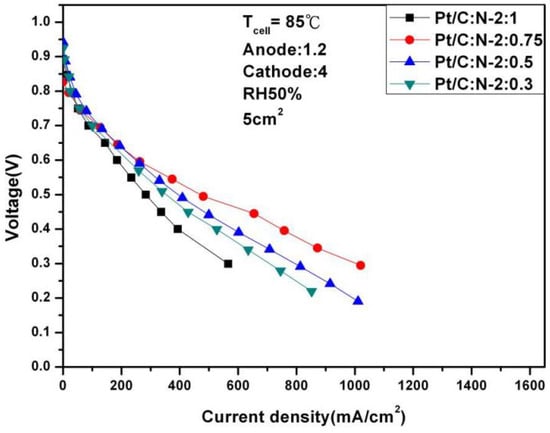
Figure 11.
Polarization curves under 50% humidification (85 °C).
Figure 12 and Figure 13 are AC impedance curves at 85 °C under different humidity. From the figures, it is found that the AC impedance curve is not very different from the 80 °C. After the humidity is reduced, the impedance increases significantly, which is due to the decrease in humidity inside the fuel cell, indicating that humidity has a crucial impact on performance.
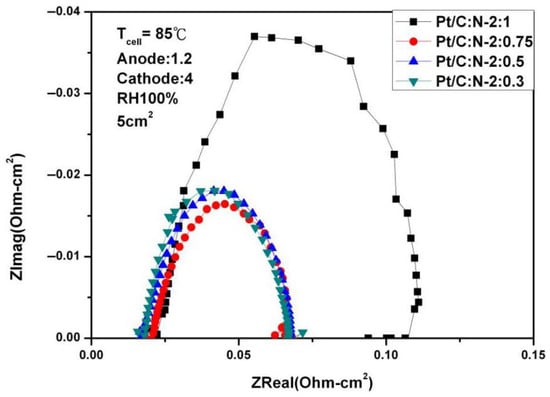
Figure 12.
AC impedance curves under 100% humidification (85 °C).
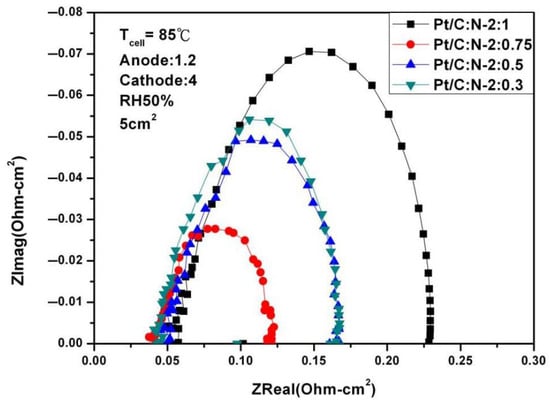
Figure 13.
AC impedance curves under 50% humidification (85 °C).
The above research results show that temperature and humidity have a crucial impact on fuel cell performance. The higher the temperature, the higher the activity, which helps to improve the performance. However, excessive temperature will also reduce the internal humidity and adversely affect performance. Therefore, there is a contradiction between the two, which is also the reason why water management is currently difficult. In response to the above situation, this paper will study how to improve the water retention in high temperature and low humidity condition and then improve the water management capabilities of the fuel cell itself.
3.2. Added SiO2 to Improve Moisturizing Ability
From the above research, it can be seen that humidity has a crucial impact on performance and internal AC impedance, so increasing humidity will play an important role in improving fuel cell performance. As an inorganic substance, SiO2 contains hydroxyl groups (Si-OH) on its surface. These hydroxyl groups can interact with water molecules through hydrogen bonds, making the SiO2 surface have a certain affinity for water. Therefore, this paper will study adding SiO2 to MEA to improve the water retention ability of the fuel cell in high temperature and low humidity condition. According to the previous test results, the amount of catalysts used in this part is the same as the previous one, and the gas stoichiometric ratio into the cathode and anode are 1.2 and 4 times, respectively. The performance changes at different temperatures were studied by adding different quantities of SiO2 to catalyst ink.
3.2.1. Fuel Cell Performance After Adding SiO2 at 65 °C
Figure 14 and Figure 15 show in detail the performance of adding different weights of SiO2 under different humidity. It can be seen from the figures that the performance does not fluctuate significantly under any conditions, but further observation reveals several phenomena: Firstly, 2 wt% SiO2 is the optimal value regardless of humidity. Secondly, after adding 2 wt% SiO2, the current densities of 646.73 mA/cm2 and 401.94 mA/cm2 were achieved, respectively, at 100% and 50% humidity and 0.6 V. Compared with the performance without adding SiO2, the performance was significantly improved. Finally, SiO2 itself is a double-edged sword because it is not conductive. Adding too much may cause internal resistance to increase and lead to a decrease in performance, which also explains the worst performance of the fuel cell at 5 wt%.
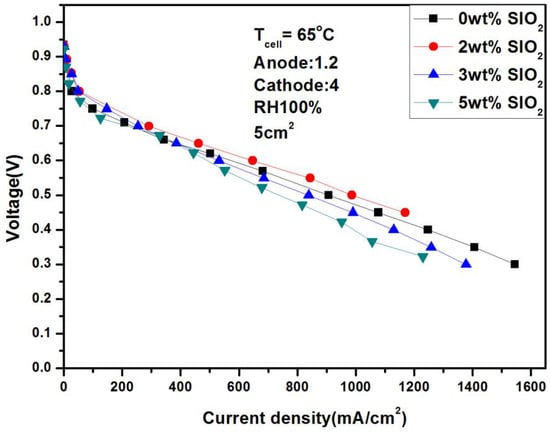
Figure 14.
Polarization curves under 100% humidification with SiO2 (65 °C).
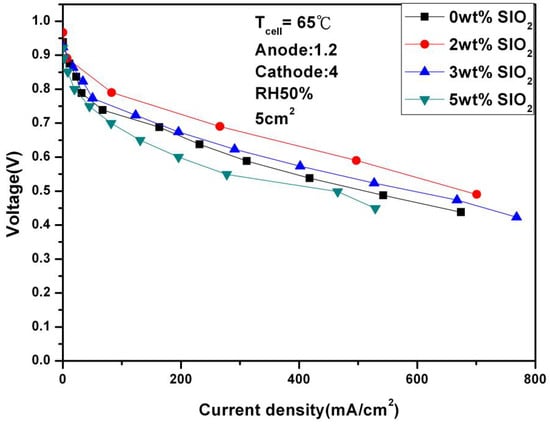
Figure 15.
Polarization curves under 50% humidification with SiO2 (65 °C).
3.2.2. Fuel Cell Performance After Adding SiO2 at 80 °C
High temperature and low humidity are the mainstream development direction of fuel cells due to their advantages of simple structure and stable operation under harsh working conditions. In order to ensure the completeness of the research, this paper continues to study the performance of the fuel cell after adding SiO2 at 80 °C. It can be seen from Figure 16 and Figure 17 that 2 wt% is still the optimal value. The performance of 617.52 mA/cm2 and 366 mA/cm2 was achieved under 100% and 50% humidification, respectively, with a performance gap of 41%. In addition, if you compare fuel cells with and without SiO2 under low humidification, you will find that the performance gap can reach 36%, which shows that the addition of SiO2 plays an important role in improving the water retention at low temperature.
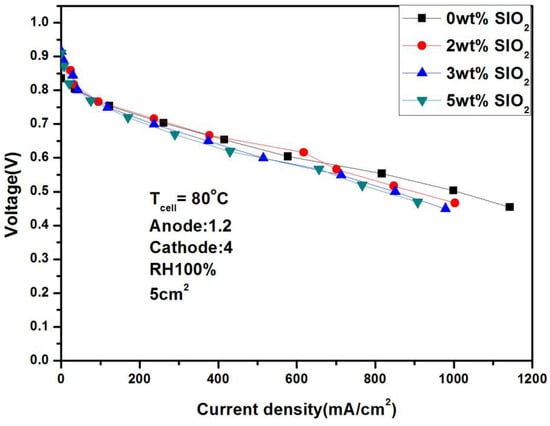
Figure 16.
Polarization curves under 100% humidification with SiO2 (80 °C).
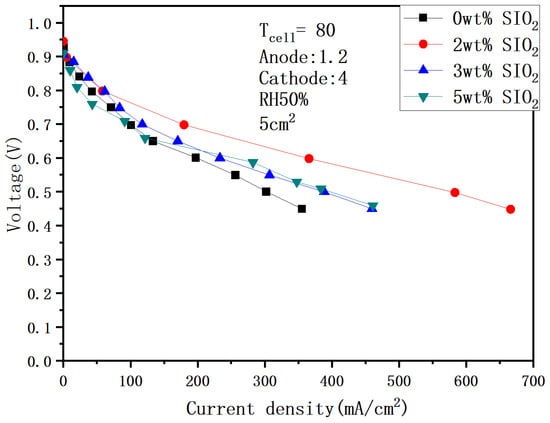
Figure 17.
Polarization curves under 50% humidification with SiO2 (80 °C).
3.2.3. Fuel Cell Performance After Adding SiO2 at 85 °C
Figure 18 and Figure 19 show the performance under different humidity after adding SiO2 at 85 °C. It can be seen from the figure that the performance is 616.8 mA/cm2 under 100% humidification and 0.6 V, and the current density does not increase significantly as the temperature rises. In addition, when the humidity drops to 50%, the performance drops to 386.28 mA/cm2, and the performance difference between the two is 37%. This is due to the increase in evaporation after the temperature rises and the decrease in the internal humidity.
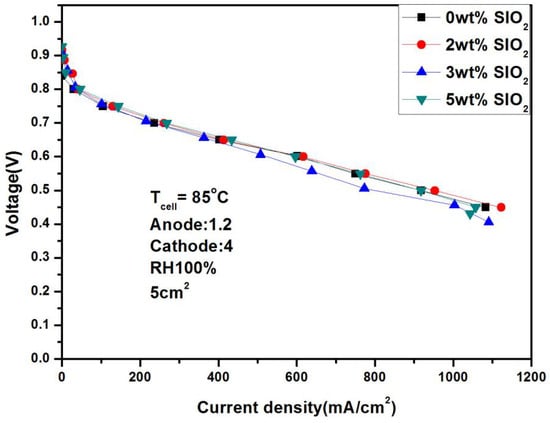
Figure 18.
Polarization curves under 100% humidification with SiO2 (85 °C).
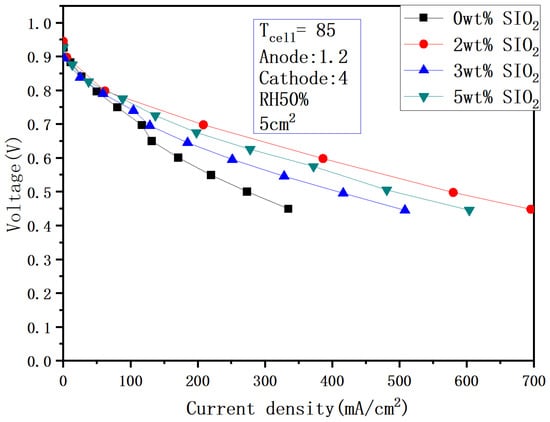
Figure 19.
Polarization curves under 50% humidification with SiO2 (85 °C).
Comparative analysis of Figure 14, Figure 16, and Figure 18 reveals significantly smaller performance deviations than those observed in Figure 15, Figure 17, and Figure 19. This indicates that silica addition exerts minimal influence on cell performance under high-humidity conditions (90–100% RH), attributable to adequate intrinsic hydration that diminishes silica’s water retention efficacy. Conversely, at reduced humidity (50% RH), external hydration decline coupled with rapid internal water evaporation amplifies the performance enhancement from silica-mediated water retention. Furthermore, owing to silica’s electrically insulating nature, increased loading does not proportionally improve performance, demonstrating a non-monotonic optimization threshold.
3.3. Comprehensive Analysis
Performance is the core parameter of fuel cells. Table 2 summarizes the experimental results of this paper in detail. It is found that whether adding SiO2 under high humidification does not significantly improve the performance, especially at high temperatures. When the humidity is reduced to 50%, adding SiO2 significantly improves the performance, and the higher temperature, the greater improvement. This is because the internal humidity drops rapidly under high temperature and low humidity, causing the performance to decline. The addition of hydrophilic SiO2 can effectively increase the internal humidity of under this working condition, thereby improving performance.
Table 2.
Performance with and without SiO2 under different humidity.
While silica, as a state-of-the-art hydrophilic material, has been extensively studied in fuel cells, existing research predominantly concentrates on three domains: water management optimization [33]; durability enhancement and degradation behaviors [34,35,36,37]; methanol crossover suppression [38]. In contrast, the correlation between silica content gradients and PEMFC performance evolution under varying temperature/humidity conditions remains underexplored. This gap underscores the innovative value of our work, which systematically quantifies the electrochemical response of SiO2-incorporated MEAs across critical operational ranges.
4. Conclusions
Fuel cells have great potential to replace fossil energy and lithium batteries as a new generation of power systems. This paper mainly studies the performance changes in fuel cells under high temperature and low humidity through a self-made MEA. Firstly, under the same humidification, the impact of temperature differences on performance is far less than the impact of humidity differences on fuel cell performance at the same temperature. Secondly, under high humidification conditions, adding hydrophilic materials will not significantly improve performance. Finally, under low humidification conditions, adding hydrophilic SiO2 can significantly improve performance, up to 126.2%. This study shows that the addition of hydrophilic materials under low humidification conditions greatly improves the humidity inside the fuel cell, making useful explorations for the development of self-humidifying fuel cells.
Author Contributions
Conceptualization, Q.B. and C.H.; methodology, Q.B.; software, Z.L.; validation, Q.B., Q.C. and F.W.; formal analysis, Q.C.; investigation, Z.L.; resources, Q.B.; data curation, Q.B.; writing—original draft preparation, C.H.; writing—review and editing, Q.B.; visualization, Z.L.; supervision, Q.C.; project administration, F.W.; funding acquisition, Q.B. All authors have read and agreed to the published version of the manuscript.
Funding
This work was funded by the Youth Science and Technology Talent Growth Project of Guizhou Provincial Department of Education (Guizhou Education Technology [2024]No.191), the Guiyang University Doctoral Research Launch Project (No:GYU-KY-[2025]), Growth Project for Young Scientific and Technological Talents in General Colleges and Universities of Guizhou Province (Grant No. Qianjiaoji [2024] 191), Guiyang City Science and Technology plan program (Grant No. [2023]48-18), Guizhou Provincial Department of Science and Technology’s academic new seedling cultivation and free exploration and innovation special project, the Guizhou Provincial Basic Research Program (Natural Science) (Grant No. Qiankehejichu-ZK [2023]General 014), Guizhou Province high-level innovative talent project (GCC[2023]010), Guiyang City Science and Technology plan program (Grant No. [2023]48-18), Guizhou Provincial Department of Science and Technology’s academic new seedling cultivation and free exploration and innovation special project.
Data Availability Statement
The data presented in this study are available on request from the corresponding author.
Acknowledgments
Thanks to Cheng-Kuan Li from Yuan Ze University for their assistance and valuable insights during the paper revision process and in the context for industrial applications.
Conflicts of Interest
The authors declare no conflicts of interest.
References
- Klosok-Bazan, I.; Gono, M.; Svehlakova, H. Water for Green Hydrogen Production. In Proceedings of the 2024 24th International Scientific Conference on Electric Power Engineering (EPE), Kouty nad Desnou, Czech Republic, 15–17 May 2024; pp. 1–5. [Google Scholar] [CrossRef]
- Liu, C.; Liu, G.; Qin, Y.; Zhuang, Y. Analysis of a combined proton exchange membrane fuel cell and organic Rankine cycle system for waste heat recovery. Int. J. Green Energy 2020, 18, 271–281. [Google Scholar] [CrossRef]
- Wu, Z.; Zhang, Z.; Ni, M. Modeling of a novel SOFC-PEMFC hybrid system coupled with thermal swing adsorption for H2 purification: Parametric and exergy analyses. Energy Convers. Manag. 2018, 174, 802–813. [Google Scholar] [CrossRef]
- Hou, Q.; Ge, P.; Lu, G.; Zhang, H. A novel PEMFC-CHP system for methanol reforming as fuel purified by hydrogen permeation alloy membrane. Case Stud. Therm. Eng. 2022, 36, 102176. [Google Scholar] [CrossRef]
- Mubin, A.N.A.; Bahrom, M.H.; Azri, M.; Ibrahim, Z.; Rahim, N.A.; Raihan, S.R.S. Analysis performance of proton exchange membrane fuel cell (PEMFC). IOP Conf. Ser. Mater. Sci. Eng. 2017, 210, 012052. [Google Scholar] [CrossRef]
- Oksuztepe, E.; Bayrak, Z.U.; Kaya, U. Effect of flight level to maximum power utilization for PEMFC/supercapacitor hybrid UAV with switched reluctance motor thruster. Int. J. Hydrogen Energy 2023, 48, 11003–11016. [Google Scholar] [CrossRef]
- Oh, T.H. Conceptual design of small unmanned aerial vehicle with proton exchange membrane fuel cell system for long endurance mission. Energy Convers. Manag. 2018, 176, 349–356. [Google Scholar] [CrossRef]
- Bayrak, Z.U.; Kaya, U.; Oksuztepe, E. Investigation of PEMFC performance for cruising hybrid powered fixed-wing electric UAV in different temperatures. Int. J. Hydrogen Energy 2020, 45, 7036–7045. [Google Scholar] [CrossRef]
- Lee, H.F.; Wang, P.C.; Chen-Yang, Y.W. An electrospun hygroscopic and electron-conductive core-shell silica@ carbon nanofiber for microporous layer in proton-exchange membrane fuel cell. J. Solid State Electrochem. 2019, 23, 971–984. [Google Scholar] [CrossRef]
- Vani, R.; Sundara, R.; Haridoss, P. Analysis of crosslinked polyvinyl alcohol membranes with silica fillers in polymer electrolyte membrane fuel cells. Mater. Res. Express 2019, 6, 105526. [Google Scholar]
- Li, J.; Xu, G.; Luo, X.; Xiong, J.; Liu, Z.; Cai, W. Effect of nano-size of functionalized silica on overall performance of swelling-filling modified Nafion membrane for direct methanol fuel cell application. Appl. Energy 2018, 213, 408–414. [Google Scholar] [CrossRef]
- Kuo, Y.J.; Lin, H.L. Effects of mesoporous fillers on properties of polybenzimidazole composite membranes for high-temperature polymer fuel cells. Int. J. Hydrogen Energy 2018, 43, 4448–4457. [Google Scholar] [CrossRef]
- Xu, G.; Wei, Z.; Li, S.; Li, J.; Yang, Z.; Grigoriev, S.A. In-situ sulfonation of targeted silica-filled Nafion for high-temperature PEM fuel cell application. Int. J. Hydrogen Energy 2019, 44, 29711–29716. [Google Scholar] [CrossRef]
- Son, B.; Oh, K.; Park, S.; Lee, T.G.; Lee, D.H.; Kwon, O. Study of morphological characteristics on hydrophilicity enhanced SiO2/Nafion composite membranes by using multimode atomic force microscopy. Int. J. Energy Res. 2019, 43, 4157–4169. [Google Scholar] [CrossRef]
- Zhang, Y.; Xue, R.; Zhong, Y.; Jiang, F.; Hu, M.; Yu, Q. Nafion/IL intermediate temperature proton exchange membranes improved by mesoporous hollow silica spheres. Fuel Cells 2018, 18, 389–396. [Google Scholar] [CrossRef]
- Lee, G.; Kim, J.; Park, J.; Jeon, Y.; Park, J.; Shul, Y.-G. Nano-Composite Filler of Heteropolyacid-Imidazole Modified Mesoporous Silica for High Temperature PEMFC at Low Humidity. Nanomaterials 2022, 12, 1230. [Google Scholar] [CrossRef] [PubMed]
- Seck, S.; Magana, S.; Prébé, A.; Buvat, P.; Bigarré, J.; Chauveau, J.; Améduri, B.; Gérard, J.-F.; Bounor-Legaré, V. New fluorinated polymer-based nanocomposites via combination of sol-gel chemistry and reactive extrusion for polymer electrolyte membranes fuel cells (PEMFCs). Mater. Chem. Phys. 2020, 252, 123004. [Google Scholar] [CrossRef]
- Choi, E.; Jang, S.; Kim, S.M. Patterned mesoporous TiO2 microplates embedded in Nafion® membrane for high temperature/low relative humidity polymer electrolyte membrane fuel cell operation. Renew. Energy 2021, 180, 203–212. [Google Scholar]
- Lee, C.; Na, H.; Jeon, Y.; Hwang, H.J.; Kim, H.-J.; Mochida, I.; Yoon, S.-H.; Park, J.-I.; Shul, Y.-G. Poly (ether imide) nanofibrous web composite membrane with SiO2/heteropolyacid ionomer for durable and high-temperature polymer electrolyte membrane (PEM) fuel cells. J. Ind. Eng. Chem. 2019, 74, 7–13. [Google Scholar] [CrossRef]
- Hwang, S.; Lee, H.G.; Jeong, Y.G.; Choi, C.; Hwang, I.; Song, S.; Nam, S.Y.; Lee, J.H.; Kim, K. Polymer electrolyte membranes containing functionalized organic/inorganic composite for polymer electrolyte membrane fuel cell applications. Int. J. Mol. Sci. 2022, 23, 14252. [Google Scholar] [CrossRef]
- Charradi, K.; Ahmed, Z.; Aranda, P.; Chtourou, R. Silica/montmorillonite nanoarchitectures and layered double hydroxide-SPEEK based composite membranes for fuel cells applications. Appl. Clay Sci. 2019, 174, 77–85. [Google Scholar] [CrossRef]
- Song, Y.; Wang, X. AI-based proton exchange membrane fuel cell inlet relative humidity control. IEEE Access 2021, 9, 158496–158507. [Google Scholar] [CrossRef]
- Zhang, Z.; Wu, S.; Li, K.; Zhou, J.; Zhang, C.; Wang, G.; Zhang, T. An Effective Force-Temperature-Humidity Coupled Modeling for PEMFC Performance Parameter Matching by Using CFD and FEA Co-Simulation. Sustainability 2022, 14, 14416. [Google Scholar] [CrossRef]
- Hou, S.; Ye, Y.; Liao, S.; Ren, J.; Wang, H.; Yang, P.; Du, K.; Li, J.; Peng, H. Enhanced low-humidity performance in a proton exchange membrane fuel cell by developing a novel hydrophilic gas diffusion layer. Int. J. Hydrogen Energy 2020, 45, 937–944. [Google Scholar] [CrossRef]
- Xie, Z.; Tian, L.; Zhang, W.; Ma, Q.; Xing, L.; Xu, Q.; Khotseng, L.; Su, H. Enhanced low-humidity performance of proton exchange membrane fuel cell by incorporating phosphoric acid-loaded covalent organic framework in anode catalyst layer. Int. J. Hydrogen Energy 2021, 46, 10903–10912. [Google Scholar] [CrossRef]
- Zhao, J.; Tu, Z.; Chan, S.H. In-situ measurement of humidity distribution and its effect on the performance of a proton exchange membrane fuel cell. Energy 2022, 239, 122270. [Google Scholar] [CrossRef]
- Wang, B.; Lin, R.; Liu, D.; Xu, J.; Feng, B. Investigation of the effect of humidity at both electrode on the performance of PEMFC using orthogonal test method. Int. J. Hydrogen Energy 2019, 44, 13737–13743. [Google Scholar] [CrossRef]
- Shao, Y.; Xu, L.; Hu, Z.; Xu, L.; Zhang, X.; Zhao, G.; Li, J.; Ouyang, M. Mechanistic investigation on the voltage collapse of polymer electrolyte membrane fuel cell under high-temperature and low-humidity conditions. J. Power Sources 2023, 581, 233520. [Google Scholar] [CrossRef]
- Zhang, L.; Liu, Y.; Bi, G.; Liu, X.; Wang, L.; Wan, Y.; Sun, H. Modeling and Experimental Investigation of the Anode Inlet Relative Humidity Effect on a PEM Fuel Cell. Energies 2022, 15, 4532. [Google Scholar] [CrossRef]
- Daricik, F.; Topcu, A.; Tüccar, G.; Aydin, K. Effects of Fibre Orientations and Flow Channel Patterns on the Durability of Composite Bipolar Plates Used in PEMFCs. In Proceedings of the 2019 8th International Conference on Modeling Simulation and Applied Optimization (ICMSAO), Manama, Bahrain, 15–17 April 2019; pp. 1–5. [Google Scholar] [CrossRef]
- Thongsuros, S.; Wattanutchariya, W.; Passadee, N. Optimization of polymer composite forming parameters for bipolar plate fabrication. In Proceedings of the 2011 IEEE International Conference on Quality and Reliability, Bangkok, Thailand, 14–17 September 2011; pp. 62–66. [Google Scholar] [CrossRef]
- Munakata, H.; Chiba, H.; Kanamura, K. Enhancement on proton conductivity of inorganic–organic composite electrolyte membrane by addition of sulfonic acid group. Solid State Ion. 2005, 176, 2445–2450. [Google Scholar] [CrossRef]
- Chen, J.; Qin, N.; Fan, R.; Jin, L.; Zheng, J.; Ming, P.; Zhang, C.; Zheng, J.P. Fumed silica additives enables tunable wettability of the resin for improved composite bipolar plate. Compos. Sci. Technol. 2024, 258, 110882. [Google Scholar] [CrossRef]
- Lee, Y.; Kwak, S.H.; Kim, S.; Son, H.J.; Kim, J.Y.; Kim, H.Y.; Joo, S.H. Mesoporous Silica-Stabilized Ceria Antioxidants for Enhancing PEMFC Durability. ChemElectroChem 2025, 12, e202500056. [Google Scholar] [CrossRef]
- Xu, G.; Ke, A.; Ji, F.; Liu, Y.; Zhao, Z.; Lv, R.; Huang, B.; Li, J.; Deng, C.; Sun, Y.; et al. Non-destructively incorporating ceria in Nafion membrane as hydroxyl radical scavenging agent for long-term PEMFC application. Fuel 2024, 361, 130706. [Google Scholar] [CrossRef]
- Cosenza, A.; Delafontaine, L.; Ly, A.; Wang, H.; Murphy, E.; Liu, Y.; Specchia, S.; Atanassov, P. Novel acid-free process intensification for the synthesis of non-precious metal-nitrogen-carbon electrocatalysts for oxygen reduction reaction. J. Power Sources 2023, 556, 232382. [Google Scholar] [CrossRef]
- Matsui, T.; Fujinaga, T.; Shimizu, R.; Ozeki, T.; Muroyama, H.; Eguchi, K. Degradation Behavior of Solid Oxide Fuel Cells Operated at High Fuel Utilization. J. Electrochem. Soc. 2021, 168, 104509. [Google Scholar] [CrossRef]
- Yagizatli, Y.; Ulas, B.; Sahin, A.; Ar, I. Preparation and Characterization of SPEEK–PVA Blend Membrane Additives with Colloidal Silica for Proton Exchange Membrane Fuel Cell. J. Polym. Environ. 2024, 32, 4699–4715. [Google Scholar] [CrossRef]
Disclaimer/Publisher’s Note: The statements, opinions and data contained in all publications are solely those of the individual author(s) and contributor(s) and not of MDPI and/or the editor(s). MDPI and/or the editor(s) disclaim responsibility for any injury to people or property resulting from any ideas, methods, instructions or products referred to in the content. |
© 2025 by the authors. Licensee MDPI, Basel, Switzerland. This article is an open access article distributed under the terms and conditions of the Creative Commons Attribution (CC BY) license (https://creativecommons.org/licenses/by/4.0/).