Article

Optimizing Porous Transport Layers in PEM Water Electrolyzers: A 1D Two-Phase Model

1
Department of Power Mechanical Engineering, Beijing Jiaotong University, Beijing 100044, China
2
School of Vehicle and Mobility, Tsinghua University, Beijing 100084, China
*
Author to whom correspondence should be addressed.
Batteries 2025, 11(6), 222; https://doi.org/10.3390/batteries11060222
Submission received: 25 April 2025 / Revised: 23 May 2025 / Accepted: 3 June 2025 / Published: 6 June 2025
(This article belongs to the Special Issue Challenges, Progress, and Outlook of High-Performance Fuel Cells)

Abstract

:
The proton exchange membrane electrolyzer (PEMWE) has been regarded as a promising technology for converting surplus intermittent renewable energy into green hydrogen through electrochemical water splitting. However, the multiphase mass and charge transport processes with countercurrent flow within the PEMWE create complex structure–property relationships that are difficult to optimize. The interdependent effects of multiple structural parameters on the coupled heat transfer, mass transfer, and charge transfer processes further obscure performance optimization mechanisms. To decouple these phenomena and elucidate the underlying mechanisms, a multiphase one-dimensional mathematical model was developed and experimentally validated. Based on the model, the mass transfer, charge conduction, and heat transfer processes inside the PEMWE have been systematically investigated, with a particular focus on the performance-related parameters of the porous transport layer (PTL). The results reveal that PTL thickness and porosity exhibit opposite effects on activation and ohmic overpotential at an elevated current density. Furthermore, a sharp performance decline occurs when PTL gas permeability falls below the critical threshold. These findings provide quantitative guidelines for multiphysics-informed component optimization in high-performance PEMWEs.

1. Introduction

Hydrogen production via water electrolysis has emerged as a pivotal research focus in sustainable energy systems, owing to its carbon-neutral nature and high environmental compatibility. Among electrolysis technologies, proton exchange membrane water electrolyzers (PEMWEs) stand out due to their compact design, rapid dynamic response, and superior compatibility with intermittent renewable power sources, positioning them as the most promising technology for scalable green hydrogen production [1,2]. However, their widespread deployment faces significant economic and material challenges. In particular, both the anode and cathode catalyst layers necessitate the use of precious metals such as iridium (Ir) and platinum (Pt), which contribute to over 40% of the total system cost [3,4]. Furthermore, the stringent requirements for the materials and fabrication of the porous transport layer (PTL) and bipolar plates substantially elevate the manufacturing cost.
Extensive research has been conducted to overcome cost barriers and maximize the efficiency potential of PEMWEs through multi-faceted approaches. A primary research direction focuses on the innovation of electrode materials to enhance electrolyzer performance. The development of novel, highly active, and stable catalysts has proven critical for improving reaction kinetics and overall cell efficiency [5,6]. Wang et al. revealed that a decrease in metal size increases the catalyst’s surface free energy, thereby enhancing the specific activity of catalyst sites [7]. Wu et al. further proposed that catalyst size modulation not only alters the electrochemically active surface area, but also modifies the electronic and surface properties of the catalyst, directly influencing their activity [8]. These findings highlight the fact that nanostructuring catalysts to optimize intrinsic activity presents an effective strategy for boosting electrochemical device performance. Beyond particle size control, compositional engineering—particularly through doping Ir-based oxides with metals (e.g., transition metals)—has emerged as a powerful approach to tailor the electronic structure of active sites and significantly enhance oxygen evolution reaction (OER) activity [9]. Additionally, morphology engineering strategies, including the design of low-dimensional and porous catalyst architectures, have been employed to maximize active site exposure and surface area, further improving electrocatalytic efficiency in PEMWEs [10,11,12]. To address the issue of reduced electrolysis efficiency due to discontinuous electron transfer paths during electrolysis, Hegge et al. inserted a microporous layer between the catalyst and diffusion layers, creating a more continuous electron transfer path and enhancing catalytic activity utilization [13]. From another perspective, employing high-conductivity materials and refining the microstructure of components can effectively lower contact resistance and improve mass transfer efficiency. Ultimately, this comprehensively enhances electrolysis efficiency.
In the operation of a PEMWE, liquid water is transported from the flow channel through the PTL to the CL for reaction. The gas generated at reaction sites passes through the PTL and is discharged via the flow channel. The generated electrons are collected by electrodes and transported through an external circuit to power the electrolyzer. Meanwhile, ions in the electrolyte migrate directionally to maintain charge balance and ensure continuous electrolysis. The coupling of multiphase and countercurrent component transport processes collectively influences PEMWE performance and efficiency. Mass transport optimization in PEMWEs primarily focuses on two critical components: bipolar plate flow fields and PTL microstructure. Maier et al. systematically analyzed the influence of flow field design on bubble dynamics and mass transport efficiency, identifying surface tension-driven bubble flow and Taylor flow as favorable patterns for efficient gas evacuation, while inertia-dominated annular flow was found to promote channel blockage [14]. Unlike the serpentine channels in PEM fuel cells, which are well-established as useful tools for water management, no consensus exists on the optimal flow field configuration for PEMWEs to promote liquid water diffusion toward the reaction layer. In straight channels, low flow velocity and uneven liquid water distribution can cause gas accumulation, whereas serpentine channels are prone to cross-channel slug bubble flow, resulting in significant pressure drops [15]. PTL design presents equally critical challenges, requiring the simultaneous optimization of multiphase transport pathways and electron conduction networks. The PTL must transport reactants to and products away from reaction sites with minimal thermal, ohmic, interfacial, and fluid losses. Research on the PTL emphasizes the coupled effects of thickness, porosity, and hydrophilicity on overall performance. Computational modeling has proven highly effective for rapidly identifying optimal electrolyzer designs, allowing potential optimization schemes to be screened at a low cost. These approaches use macroscopic 3D simulations via platforms like COMSOL or FLUENT to evaluate flow field configurations [16,17]. These studies have revealed significant in-plane heterogeneities in operating PEMWEs due to non-uniform two-phase flows and current density distributions, providing critical guidance for flow field optimization [17].
The PTL plays a pivotal role in facilitating two-phase countercurrent mass transfer within PEMWEs. Its unique microstructure determines transfer efficiency, making it a central research focus in the pursuit of optimizing the overall mass transfer performance of PEMWE. Current PTL research faces significant computational hurdles in structural modeling. While computational fluid dynamics (CFD) simulations of reconstructed 3D fiber networks can reveal preferential bubble pathways through paths of least resistance [18], integrating these findings with electrochemical performance predictions remains a formidable challenge. Moreover, the PTL’s structural parameters related to electrolyzer performance, like the thickness, porosity, and contact angle, are highly correlated [19,20,21]. For instance, porosity distribution directly impacts the surface contact angle. Uniform and fine porosity ensures stable gas adsorption and diffusion on the surface of the PTL, resulting in a small and consistent contact angle. In contrast, uneven porosity will cause larger contact angles in large-pore areas due to varied gas diffusion paths. This obstructs local gas–liquid transport and leads to uneven electrolyte distribution [22]. Also, the thickness and porosity of the PTL are closely linked. Thicker layers need higher porosity for adequate mass transfer efficiency, but too high a porosity weakens the mechanical strength of thick layers, risking structural damage during long-term operation. Additionally, thickness and porosity have complex effects on the gas permeability and conductivity of the PTL.
In general, 1D modeling serves as an efficient approach for rapid screening of component structural parameters in proton exchange membrane fuel cell (PEMFC) systems. By simplifying complex transport phenomena into directional variable gradients, 1D models enable the swift identification of optimal parameter ranges. Sensitivity analysis using such models can effectively elucidate the impact mechanisms of key parameters on electrochemical performance [23,24]. Compared to PEMFC systems, fewer 1D modeling studies have been conducted for proton exchange membrane water electrolyzers (PEMWEs) [25]. Furthermore, these 1D models typically focus on ohmic and activation overpotential while neglecting mass transfer effects, which may be reasonable for optimizing the structural parameters of catalyst layers (CLs) or membranes under various operating conditions. However, when investigating how PTL architecture influences electrolyzer performance, explicit consideration of mass transfer overpotential is essential. Moreover, to fundamentally understand the structure–performance relationships in PEMWEs, systematic decoupling of interdependent parameters is essential. Conventional experimental approaches face inherent limitations in isolating these complex, nonlinear interactions. To overcome this challenge, this paper details a comprehensive one-dimensional model that explicitly resolves the coupled electrochemical reactions, multiphase transport phenomena, and energy conversion processes within operating PEMWEs. This framework enables precise parametric studies by maintaining fixed baseline conditions while varying the individual structural parameters of the PTL. This approach reveals the relationships between structural parameters and performance, offering theoretical support for optimized electrolyzer design.

2. Model Description
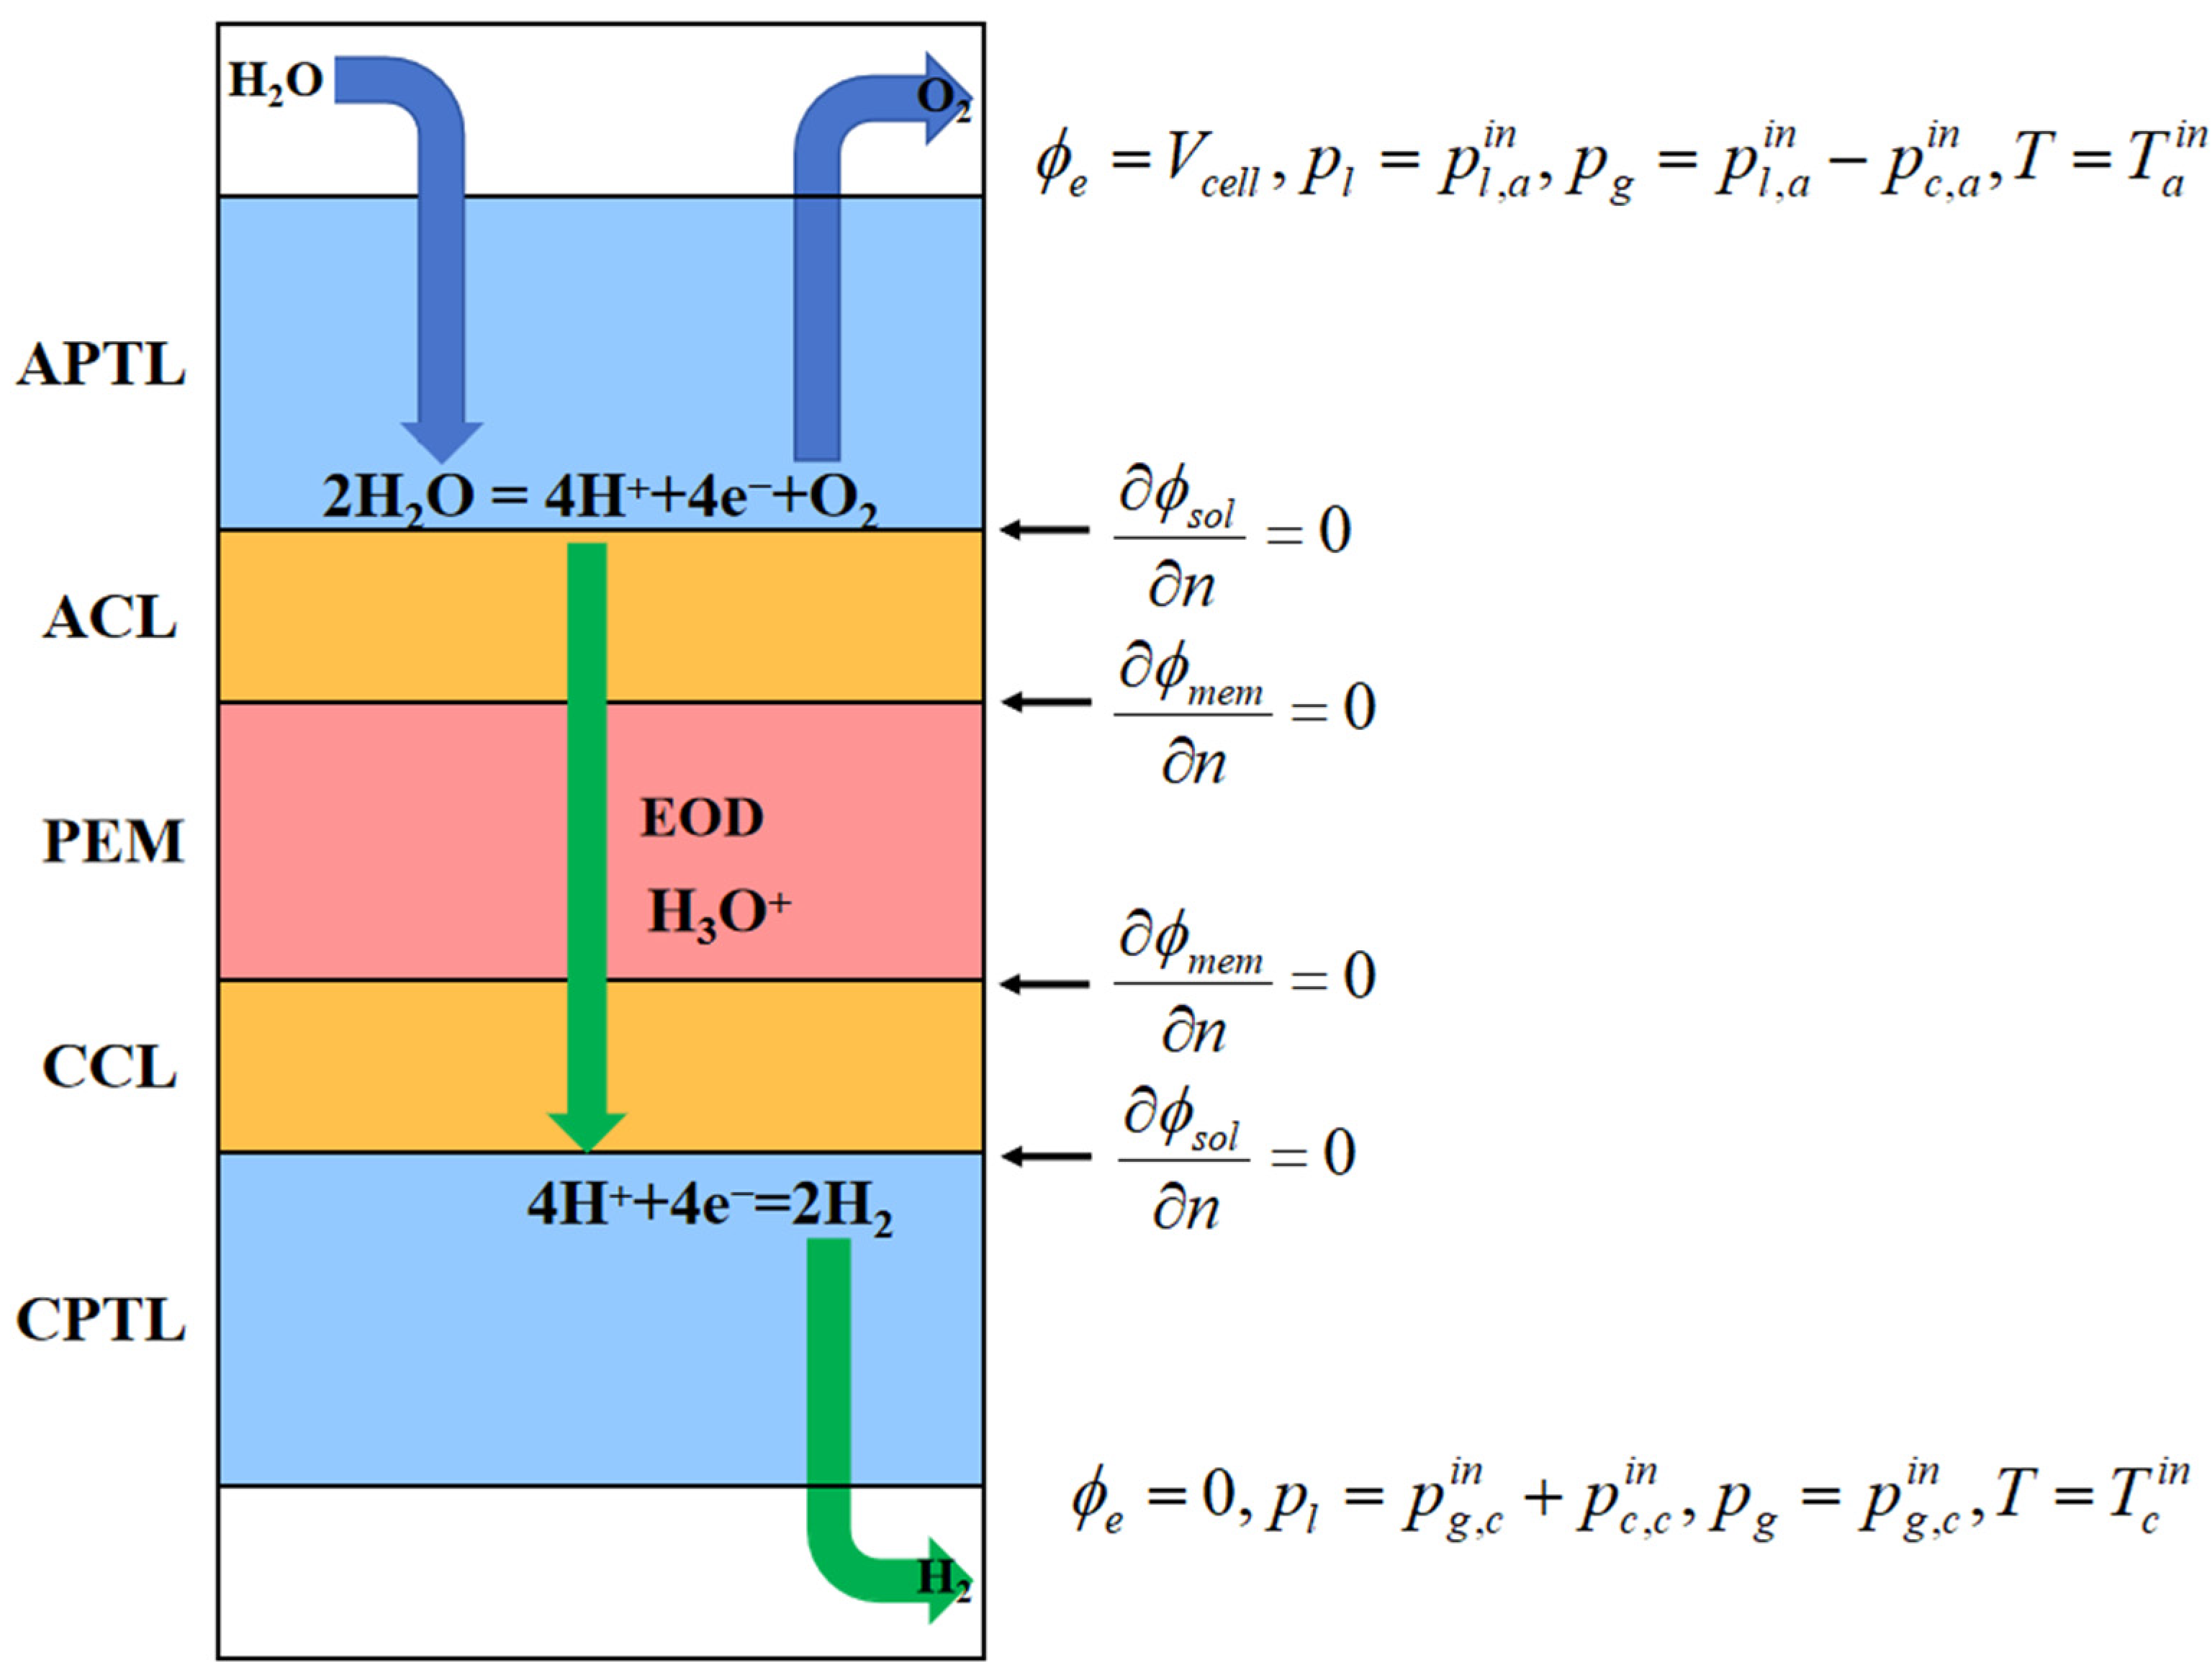
The developed model considers a 1D description of the transport process of gas species, liquid water, and dissolved water that spans the five layers of the membrane electrode assembly (MEA), which consists of the anode and cathode PTL (APTL, CPTL), the anode and cathode catalyst layer (ACL, CCL), and the proton exchange membrane (PEM), as illustrated in Figure 1. Liquid water is fed at the anode side, where it dissociates into oxygen and hydrogen ions at the interface of the anode catalyst layer. Oxygen (O2) is then transported from the APTL to the flow channel and subsequently exits the electrolyzer. Hydrogen ions (H+), accompanied by a fraction of liquid water under the effect of electro-osmotic drag (EOD), traverse the proton exchange membrane to reach the cathode side. At the cathode, hydrogen is generated and expelled from the flow channel.

2.1. Assumptions

To establish a computationally tractable yet physically representative model, the following fundamental assumptions are adopted:
  • Steady-state operation: the system is modeled under equilibrium conditions with ideal gas behavior for all gaseous species, while the membrane electrode assembly (MEA) is treated as macroscopically homogeneous.
  • Unidirectional transport: mass transfer is constrained to the through-plane direction (x-direction), neglecting in-plane gradients.
  • Membrane selectivity: the proton exchange membrane is considered impermeable to gas species (O2, H2) while maintaining perfect proton conductivity.
  • Simplified physics: Gravitational effects are neglected due to dominant capillary and pressure-driven flows. Interfacial contact resistances between adjacent layers are not considered.
  • Electrical insulation: all structural components are assumed to be perfectly insulated, preventing current leakage.

2.2. Analytical Solution

2.2.1. Electrochemistry

In a PEMWE, electrochemical reactions occur at the anode and the cathode, respectively:
A n o d e : H 2 O 1 / 2 O 2 + 2 H + + 2 e ,
C a t h o d e : 2 H + + 2 e H 2 .
The driving force for the electrolysis reaction in the electrolyzer is the overpotential η , which is the difference between the solid-phase potential φ s and the membrane-phase potential φ m of the anode and cathode:
η a n = φ s φ m U a n 0
η c a t = φ s φ m U c a t 0
σ s e f f φ s = R s
σ m e f f φ m = R m
where the source term Ri is the volume current density, and the relationship between the reaction rate and the activation overpotential is calculated through the Butler–Volmer equation.
R a = s i n s ζ a j a exp 4 α a F R T η a n exp 4 ( 1 α a ) F R T η a n , A C L R c = ζ a j a exp 2 α c F R T η c a t + exp 2 ( 1 α c ) F R T η c a t , C C L
where Ra and Rc are the electrochemical reaction rates, s i n s is the correction term for active sites covered by bubbles, s i is the liquid water saturation in the CL, ns is the volume fraction of gas covering catalyst active sites, ja and jc are the reference exchange current densities, and α a and α c are the transfer coefficients of the anode and cathode half-reactions.

2.2.2. Two-Phase Flow

Mass Conservation

The continuity equations for the liquid phase and the gas phase are as follows:
ε ρ l u l = S l
ε ρ g u g = S g
where ε is the porosity, ρ l and ρ g are the densities of the liquid phase and the gas phase, respectively, and u l and u g are the superficial velocities of the liquid phase and the gas phase. According to Darcy’s law:
u l = K k r , l μ l p l
u g = K k r , g μ g p g
where K is the absolute permeability, μ l and μ g are the dynamic viscosities, p l and p g refer the pressure levels, and K r , l and K r , g denote the relative permeabilities, which can be calculated by the Corey formula:
K r , l = K r , l 0 s l s l r 1 s l r n l
K r , g = K r , g 0 s g s g r 1 s g r n g
where K r , l 0 and K r , g 0 represent the reference relative permeabilities, s l r and s g r are the residual saturation, and nl and ng are the Corey indices of the liquid phase and the gas phase, respectively. In Equations (9) and (10), the source terms S l and S g represent the consumption of liquid water and the generation of gas.
S l = M H 2 O 2 F R a M H 2 O S v s ,   ACL S l = M H 2 O S v s ,   CCL , PTL
S g = M O 2 4 F R a M H 2 O S v s M H 2 O S v λ ,   ACL S g = M H 2 2 F R a M H 2 O S v s M H 2 O S v λ ,   CCL S g = M H 2 O S v s ,   PTL
where s v s means the water evaporation/condensation rate, which is driven by the difference between the partial pressure of water vapor and the saturation pressure of water:
s v s = γ e R T p H 2 O p H 2 O sat , p H 2 O < p H 2 O sat   ( evaporation ) γ c R T p H 2 O p H 2 O sat , p H 2 O p H 2 O sat   ( condensation )   .
where
  • γ e and γ c denote the evaporation and condensation rate coefficients, respectively.
  • s v λ is the conversion rate of liquid water to dissolved water, which is driven by the difference between the equilibrium water content and the actual water content of the membrane electrode:
    s v λ = M H 2 O γ s ρ m E W λ e q λ , λ < λ e q   ( sorption ) M H 2 O γ d ρ m E W λ e q λ , λ λ e q   ( desorption )   .
    where
  • γ s and γ d are the mass transfer coefficients of adsorption and desorption, respectively.
  • λ e q denotes the equilibrium water content and P H 2 O s a t is the saturated vapor pressure.
    λ e q = 0.043 + 17.81 R H 39.85 R H 2 + 36.0 R H 3
    log P H 2 O s a t = 2.1794 + 0.02953 T 273.17 9.1837 × 10 5 T 273.17 2 + 1.4454 × 10 5 T 273.17 3
    R H = x H 2 O p g p H 2 O s a t

Energy Conservation

k e f f T = S T
where k e f f represents the effective thermal conductivity. The source term S T stems from the irreversible electrochemical heat S T , i r v , the reversible electrochemical heat of the OER and HER S T , r v , the Joule heat caused by proton and electron conduction S T , x , and the heat caused by water phase change S T , w :
S T = S T , i = i i 2 σ m e m ,   PEM S T , i r v + S T , r v + S T , x + S T , w = R a η a R a 2 F Δ S a + i i 2 σ m e m + i e 2 σ s o l + h lg S v s + h lg S v λ ,   ACL S T , i r v + S T , r v + S T , x + S T , w = R c η c R c 2 F Δ S c + i i 2 σ m e m + i e 2 σ s o l + h lg S v s + h lg S v λ ,   CCL i e 2 σ s o l + h lg S v s ,   PTL
where i i and i s are the absolute values of the proton current density and the electron current density, respectively, σ m e m and σ s o l are the proton conductivity and the electron conductivity, respectively, and h lg refers the latent heat of the water phase change.

2.2.3. Dissolved Water

The dissolved water in the proton exchange membrane and the catalyst layer mainly comes from diffusion, electro-osmotic drag, the phase change of liquid water, and the generation of dissolved water.
σ m e m φ m e m n d F + D λ e f f ρ m E W m λ + ρ m λ E W m K l , p e m μ l p l , a p e m p l , c p e m δ p e m = S v λ
where n d refers to the electro-osmotic drag coefficient:
n d = 2.5 λ 22 .
where D λ e f f denotes the diffusion coefficient of the water content:
D λ e f f = ε m 1.5 3.842 λ 3 32.03 λ 2 + 67.74 λ λ 3 2.115 λ 2 + 33.013 λ + 103.37 × 10 10 exp E λ R 1 T r e f 1 T .

2.2.4. Overpotential Analysis

The overpotential is typically divided into the activation overpotential η a c t , ohmic overpotential η o h m , and mass transfer overpotential η t r a n s to evaluate the combined effects of the electrochemical reaction kinetics, the resistance properties, and the mass transfer process on the performance of the PEMWE.
E c e l l = E 0 + η a c t + η o h m + η t r a n s
The reversible voltage E0 can be calculated considering its dependency on temperature and reagent/product activities according to the Nernst equation:
E 0 = 1.229 0.9 × 10 3 ( T T r e f ) + R T 2 F ln α H 2 α O 2 0.5 α H 2 O
α H 2 = P H 2 P 0
α O 2 = P O 2 P 0
where α H 2 and α O 2 represent the activity of hydrogen and oxygen gas, which are associated with the partial pressure of hydrogen P H 2 and oxygen P O 2 . P 0 is the standard atmospheric pressure.
The activation overpotential η a c t comprises the anodic and cathodic reaction overpotential, arising from the kinetic resistance of electrochemical reactions at the anode and cathode, which creates a potential difference from the reversible voltage. The ohmic overpotential η o h m results from the resistance when the current passes through the electrolyte, electrode materials, and contact interfaces, and is calculated by the energy loss of electrons and protons from anode to cathode. The mass transfer overpotential η t r a n s arises from the concentration gradient between the electrode surface and the bulk solution, and is characterized by the partial pressure of gas on the catalyst layer surface and the reference concentration. During the operation of the electrolyzer, liquid water is continuously supplied to the anode channel. During actual operation, overstoichiometric water feeding is typically used, and its mass transfer limitation is negligible. However, the product gases constitute the main limiting step in the mass transfer process [26,27,28]. Therefore, this paper solves for the mass transfer overpotential by calculating the gas partial pressure differences of oxygen on the anode side and hydrogen on the cathode side.
η t r a n = R T 4 F log p O 2 , a c l p O 2 , r e f + R T 2 F log p H 2 , a c l p H 2 , r e f

2.3. Calculation Implementation

The model was computed using MATLAB to solve the coupled mass, energy, and charge conservation equations governing transport and reaction processes within the electrolyzer. The numerical solution is based on the finite difference method for the boundary value problem (BVP), and the built-in bvp4c solver in MATLAB R2024a is used to handle the nonlinear boundary value problem. The computational domain was divided into five layers and the equations of each layer are coupled through interface continuity conditions (such as potential continuity and flux conservation). The boundary conditions are depicted in Figure 1 and liquid water is introduced into the anode, accompanied by the application of external voltage Vcell. No water is supplied to the cathode, and its electric potential is set to zero. Within the predefined voltage range, a voltage sweep is executed with an increment of 50 mV to assess the performance of the electrolyzer under diverse operating conditions.

3. Discussion of Results

3.1. Model Validation

The model was validated by the experimental performance data obtained at various operation temperatures (40 °C, 60 °C, 80 °C), and the relevant model parameters are shown in Table 1. The performance of the membrane electrode assembly (MEA) was tested using a self-built PEM electrolyzer, whose structure is shown in Figure 2a. This electrolyzer consists of end plates, flow field plates with straight flow channels, a titanium felt PTL with 75% porosity, and an MEA with a self-made CCM structure, where the Ir loading on the anode is 0.7 mg/cm2, and the Pt loading on the cathode is 1 mg/cm2. During all tests, the PEM electrolyzer operated at the set temperature, with deionized water fed to the anode side at a flow rate of 100 mL/min. The performance of the PEM electrolyzer was evaluated using a Gamry Reference 3000 electrochemical workstation. As shown in Figure 2b, the current density rises with an increasing temperature. According to electrochemical reaction kinetics, an elevated temperature accelerates ion conduction within the membrane and electrochemical reactions on the electrodes, thereby reducing resistance and activation overpotential. This leads to a lower voltage requirement for a given current output, enhancing the electrolyzer’s energy efficiency. Moreover, under different temperature conditions, the model-predicted voltage–current density curves align well with the experimental curves. With a high current density, the model and experimental data nearly overlap, indicating that the model can precisely characterize the electrolyzer’s electrical performance under these operating conditions.
To enhance the performance of PEMWE, it is necessary to analyze various overpotential losses under baseline operating conditions (P = 1 atm, T = 80 °C, δ p t l _ a = 400 μm, δ p t l _ c = 400 μm, ε p t l _ a = 75%, ε p t l _ c = 75%, K p t l _ a = 1 × 10⁻¹² m2, K p t l _ c = 1 × 10⁻¹² m2). Figure 3a shows the variations of the activation overpotential η act , ohmic overpotential η ohm , and mass transfer overpotential η tran with the current density. At low current densities, η act is the primary cause of voltage loss. It mainly results from the kinetic losses of the anode’s OER and the cathode’s HER, and is primarily affected by catalyst activity and loading, as well as the reactant mass-transfer rate. As the current density increases, η act remains relatively constant. This occurs since, when catalyst active sites are fully occupied, a small current increase minimally affects the reaction’s activation energy barrier. Thus, reaction kinetics stay relatively stable, maintaining η ohm at a fairly constant value. The ohmic overpotential is the voltage loss caused by the resistance of components such as the electrodes and the diffusion layers during the conduction of protons and electrons. According to Faraday’s law, η ohm increases linearly with the increase in current density. As the current continues to increase, the impact of η tran becomes more pronounced. η tran is an additional potential loss that occurs when the diffusion rate of reactants to the electrode surface fails to keep up with the requirements of the electrochemical reaction rate. Under high current density operating conditions, the demand for reactant concentration surges sharply, resulting in a decrease in the concentration of reactants on the electrode surface and an elevation of the mass transfer overpotential.
Furthermore, the through-plane profiles of key performance-related variables (temperature, two-phase velocity, water saturation) were investigated. Figure 3b presents the through-plane temperature profile during electrolyzer operation. From left to right are APTL, ACL, PEM, CCL, and CPTL. The internal temperature distribution is closely linked to the thermal effects of anode OER and cathode HER. When a high voltage (2 V) is applied, the electrochemical reaction kinetics are significantly accelerated. Although the OER is an endothermic process, the exothermic nature of the HER and ohmic heating drive the overall temperature to rise. At the interface of the CLs, the temperature is relatively high due to the high concentration of electrochemical reactions and greater heat generation. Subsequently, along the direction of the CL, the heat gradually dissipates, and the temperature decreases accordingly. In addition, the OER occurring on the anode side consumes liquid water and generates oxygen. This process is highly sluggish, resulting in the anode overpotential being higher than that of the cathode. Meanwhile, the countercurrent with positive liquid-phase velocity and negative gas-phase velocity at the anode side (Figure 3c) exacerbates the temperature gradient. However, with the increase in hydrogen generated by HER, the water dragged over from the anode condenses at the cathode side, resulting in both the gas and liquid phase velocities being positive. These phenomena make the anode-side temperature higher than the cathode-side temperature. As the voltage decreases, the electrochemical reaction rate slows and the absolute values of the two-phase velocities decrease. When the voltage reaches 1.8 V, the temperature distribution curve flattens, showing less heat generation at lower voltages and a reduced impact of thermal effects. When the voltage further drops to 1.6 V, the effect of ohmic heating significantly weakens, and the endothermic effect of the OER becomes prominent, leading to a decrease in the temperature at the interface of the CL. The effect of dragged water carries away some of the heat, resulting in a decrease in temperature at the interface of the cathode catalytic layer. The temperature within the entire electrolyzer tends to be stable at low voltage, remaining at a relatively low and steady level. In addition, the water saturation gradually decreases from the flow channel to the CL, with the liquid water continuously consumed at the anode side, as shown in Figure 3d. The water saturation at the cathode is significantly lower than that at the anode due to the HER and the limited water replenishment.

3.2. Influence of the Structure of PTL

PTL enables gas and water transport, conducts electrons, and helps the CL to maintain its structure for PEMWE. In the case of the complex two-phase transport inside the PEMWE, especially with the countercurrent transport phenomenon on the anode side, the thickness of the diffusion layer is critical for gas–liquid transfer. From the perspective of gas transport kinetics, a thinner PTL can significantly shorten the gas diffusion path and reduce the mass transfer resistance, which is beneficial for improving gas transport efficiency. However, excessively reducing the PTL thickness shortens the transport path of liquid water, increases the difficulty of achieving uniform distribution, and may compromise the mechanical strength and electron conduction stability of the PTL. The performance of the PEMWE was calculated for different thicknesses of APTL (200 μm, 400 μm, 600 μm, and 800 μm), and the results are shown in Figure 4. As the thickness of the PTL increases from 200 μm to 800 μm, the voltage gradually rises. This indicates that with the increase in the thickness of the PTL, the performance of the PEMWE decreases and the energy efficiency is reduced. Further analyzing the decomposition of the overpotential under different thicknesses, it can be found that the thickness of the PTL mainly has a significant impact on η ohm . When the PTL thickens, the prolonged electron transfer path increases the ohmic resistance. In contrast, the η act is minimally affected by changes in the thickness of the PTL, as it is essentially dominated by reaction kinetics factors. With the increase in thickness of the PTL, η tran also gradually increases. At a current density of 2 A/cm2, the η act values corresponding to the PTL at thicknesses of 200 μm, 400 μm, 600 μm, and 800 μm are 414 mV, 457 mV, 477 mV, and 491 mV, respectively. As the thickness of the PTL gradually increases, the sensitivity of the influence of the PTL thickness on the mass transfer overpotential decreases. When determining the thickness of the PTL in a PEMWE, it is necessary to comprehensively balance the complex requirements of multiple aspects such as the mass transfer and electrochemical performance, while also taking into account the potential limitations of thin catalytic layers in terms of long-term operational stability.
The PTL typically features a porous structure, which is fundamental to component diffusion. An optimal porosity promotes gas diffusion and transport within the PTL. Higher porosity in the PTL provides more gas conduction pathways, facilitating the efficient diffusion of reactants from the electrode surface to the flow channels. This mitigates gas accumulation at the electrode surface and reduces concentration polarization. However, excessive porosity will bring about a series of negative effects. The paths of electron transfer will be reduced due to the increase in pore volume, making the conduction of electrons more difficult and, thus, increasing the ohmic resistance. Moreover, the mechanical strength of the PTL will be affected, and its structural stability will decrease, which may make it unable to provide reliable support for the catalytic layer. Figure 5 shows the performance changes of the PTL when the porosity ranges from 35% to 90%. It can be seen that when the porosity increases from 35% to 50%, the performance of the electrolyzer increases slightly. Further increases in porosity lead to a gradual decline, with a sharp deterioration at 90%. From the overpotential decomposition diagram in Figure 5b, it can be observed that as the porosity increases, the electrical conductivity of the PTL decreases, and η ohm increases. Although a higher porosity is beneficial for reducing the mass transfer loss, η tran is the lowest when the porosity is 50%. This phenomenon indicates that the mass transfer efficiency does not have a simple positive correlation with the porosity. This is because excessively high porosity will lead to the occurrence of “water flooding”, that is, the electrolyte will accumulate excessively in the PTL, blocking gas transmission, seriously hindering the effective diffusion and discharge of gas, and ultimately having a negative impact on the performance of the PEMWE.
High permeability means that gas molecules can move more freely and smoothly through the pores of the PTL, greatly reducing the resistance during gas diffusion. This enables the reactant gases to reach the active sites of the CL rapidly, ensuring the stability and efficiency of the electrochemical reaction. At the same time, it allows the product gases to be discharged promptly and efficiently, preventing them from accumulating near the catalytic layer and hindering the reaction. Figure 6 compares the current density under different permeabilities of the APTL. As the permeability decreases, the performance of the electrolyzer drops. When the permeability is greater than 10−12 m2, the impact of permeability on the performance of the electrolyzer is slight. However, when the permeability is less than 10−12 m2, gas diffusion is severely hindered, and the overpotential increases significantly. It can be intuitively seen from the overpotential decomposition in Figure 6b that when the permeability is 10−13 m2, the η tran increases significantly. This indicates that there is a critical value for the gas permeability of the PTL. Below this value, gas diffusion restricts severely, generating a gas concentration gradient around the CL. This results in insufficient reactant supply and impedes product discharge. Additionally, the conduction of ions inside the PEM relies heavily on its hydration. Low permeability may dry out the membrane, disturbing water transport and balance, and further degrading electrolyzer performance.
The above analysis of PTL structural parameters aims to clarify their impact on PEMWE overpotential for a clearer PTL optimization direction. However, practical implementation reveals complex interdependencies among these parameters that require further investigation. For example, porosity and permeability represent two highly intercorrelated performance metrics. In addition, in cases where the thickness of the PTL experiences an increase, the influence exerted by porosity on the overall performance becomes notably more intricate. In subsequent research, it is necessary to further optimize the model. Alongside clarifying univariate parameter impacts, exploring the collaborative mechanisms among parameters is crucial to obtain a more robust theoretical foundation for optimized design and efficiency augmentation.

4. Conclusions

In this study, a steady-state, multiphase one-dimensional model of a proton exchange membrane water electrolyzer (PEMWE) membrane electrode assembly has been developed and experimentally validated across multiple operating temperatures. The model enables detailed examination of through-plane distributions for key performance parameters during PEMWE operation, providing critical insights into electrolyzer design optimization.
Experimental isolation of individual structural parameter effects in PEMWEs has been demonstrated to be exceptionally challenging, often leading to ambiguous identification of performance-governing factors. Through systematic single-variable analysis using this computational framework, the influence of anode porous transport layer (PTL) structural parameters on cell performance has been rigorously evaluated.
The thickness and the porosity of the PTL notably impact both the ohmic and mass transfer overpotential of electrolyzers. Increasing thickness raises both ohmic and mass transfer overpotential, while the sensitivity of mass transfer overpotential to thickness decreases. High porosity aids mass transfer but sharply increases ohmic overpotential; excessively high porosity causes liquid water accumulation, impeding reactant diffusion. Gas permeability has been identified as a particularly critical parameter, with performance deterioration being observed when values fall below a threshold of 10−12 m2, manifesting as simultaneous increases in both activation and ohmic overpotential.
These findings suggest that future PTL optimization efforts should prioritize permeability enhancement over porosity maximization. A comprehensive approach considering the interdependent effects of thickness, porosity, and permeability has been demonstrated to be essential for advancing PEMWE performance. The developed modeling framework provides a valuable tool for guiding such optimization studies and informing the design of next-generation electrolyzer components.

Author Contributions

Conceptualization, L.Z. and J.L.; methodology, L.Z.; validation, J.L. and S.D.; writing—original draft preparation, L.Z.; writing—review and editing, L.Z. and J.L. All authors have read and agreed to the published version of the manuscript.

Funding

This research received no external funding.

Data Availability Statement

The original contributions presented in this study are included in the article. Further inquiries can be directed to the corresponding author.

Conflicts of Interest

The authors declare no conflict of interest.

Abbreviations

PEMWEProton exchange membrane water electrolyzer
PTLPorous transport layer
MEAMembrane electrode assembly
CLCatalyst layer
EODElectro-osmotic drag

References

  1. Chi, J.; Yu, H. Water electrolysis based on renewable energy for hydrogen production. Chin. J. Catal. 2018, 39, 390–394. [Google Scholar] [CrossRef]
  2. Wang, J.; Wen, J.; Wang, J.; Yang, B. Water electrolyzer operation scheduling for green hydrogen production: A review. Renew. Sustain. Energy Rev. 2024, 203, 114779. [Google Scholar] [CrossRef]
  3. Hughes, J.; Clipsham, J.; Chavushoglu, H.; Rowley-Neale, S.J. Polymer electrolyte electrolysis: A review of the activity and stability of non-precious metal hydrogen evolution reaction and oxygen evolution reaction catalysts. Renew. Sustain. Energy Rev. 2021, 139, 110709. [Google Scholar] [CrossRef]
  4. Shirvanian, P.; Berkel, F. Novel components in Proton Exchange Membrane Water Electrolyzers (PEMWE): Status, challenges and future needs. A mini review. Electrochem. Commun. 2020, 114, 106704. [Google Scholar] [CrossRef]
  5. Zhao, C.; Yuan, S.; Cheng, X.; Shen, S.; Zhan, N. Agglomerate Engineering to Boost PEM Water Electrolyzer Performance. Adv. Energy Mater. 2024, 14, 2401588. [Google Scholar] [CrossRef]
  6. Tao, L.; Lv, F.; Wang, D.; Luo, H.; Lin, F. Mass-efficient catalyst layer of hierarchical sub-nanosheets on nanowire for practical proton exchange membrane electrolyzer. Joule 2024, 8, 450–460. [Google Scholar] [CrossRef]
  7. Wang, H.; Gu, X.; Zheng, X.; Pan, H.; Zhu, J.; Chen, S. Disentangling the size-dependent geometric and electronic effects of palladium nanocatalysts beyond selectivity. Sci. Adv. 2019, 5, 6413. [Google Scholar] [CrossRef]
  8. Wu, T.; Han, M.; Xu, Z. Size Effects of Electrocatalysts: More Than a Variation of Surface Area. ACS Nano. 2022, 16, 8531–8539. [Google Scholar] [CrossRef]
  9. Hao, S.; Sheng, H.; Liu, M.; Huang, J.; Zheng, G.; Zhang, F. Torsion strained iridium oxide for efficient acidic water oxidation in proton exchange membrane electrolyzers. Nat. Nanotechnol. 2021, 16, 1371–1377. [Google Scholar] [CrossRef]
  10. Wang, K.; Mao, R.; Liu, R.; Zhang, J.; Zhao, H.; Ran, W. Intentional corrosion-induced reconstruction of defective NiFe layered double hydroxide boosts electrocatalytic nitrate reduction to ammonia. Nat. Water 2023, 1, 1068–1078. [Google Scholar] [CrossRef]
  11. Xie, Z.; Liang, X.; Kang, Z.; Zou, Y.; Wang, X. High-Porosity, Layered Iridium Oxide as an Efficient, Durable Anode Catalyst for Water Splitting. CCS Chem. 2025, 7, 216–228. [Google Scholar] [CrossRef]
  12. Ge, S.; Xie, R.; Huang, B.; Zhang, Z.; Liu, H.; Kang, X. A robust chromium–iridium oxide catalyst for high-current–density acidic oxygen evolution in proton exchange membrane electrolyzers. Energy Environ. Sci. 2023, 16, 3734–3742. [Google Scholar] [CrossRef]
  13. Hegge, F.; Lombeck, F.; Ortiz, E.; Bohn, L.; Holst, M.; Kroschel, M. Vierrath. Efficient and Stable Low Iridium Loaded Anodes for PEM Water Electrolysis Made Possible by Nanofiber Interlayers. ACS Appl. Energy Mater. 2020, 3, 8276–8284. [Google Scholar] [CrossRef]
  14. Maier, M.; Smith, K.; Dodwell, J.; Hinds, G.; Shearing, P. Mass transport in PEM water electrolysers: A review. Int. J. Hydrogen Energy 2022, 47, 30–56. [Google Scholar] [CrossRef]
  15. Toghyani, S.; Afshari, E.; Baniasadi, E.; Atyabi, S. Thermal and electrochemical analysis of different flow field patterns in a PEM electrolyzer. Electrochim. Acta 2018, 267, 234–245. [Google Scholar] [CrossRef]
  16. Zhang, L.; Liu, J.; Du, S.; Zhao, C. Multiphase flow dynamics in metal foam proton exchange membrane fuel cell. Renew. Energy 2024, 226, 120489. [Google Scholar] [CrossRef]
  17. Dang, D.; Zhou, B. Numerical analysis of bubble behavior in proton exchange membrane water electrolyzer flow field with serpentine channel. Int. J. Hydrogen Energy 2024, 88, 688–701. [Google Scholar] [CrossRef]
  18. Bhaskaran, S.; Pandey, D.; Surasani, V.; Tsotsas, E. LBM studies at pore scale for graded anodic porous transport layer (PTL) of PEM water electrolyzer. Int. J. Hydrogen Energy 2022, 47, 31551–31565. [Google Scholar] [CrossRef]
  19. Omrani, R.; Shabani, B. Gas diffusion layer modifications and treatments for improving the performance of proton exchange membrane fuel cells and electrolysers: A review. Int. J. Hydrogen Energy 2017, 42, 28515–28536. [Google Scholar] [CrossRef]
  20. Sinyakov, M.; Mensharapov, R.; Ivanov, B. Study of the water electrolyzer with proton exchange membrane performance based on Ti current collectors charged with hydrogen. Electroanalysis 2025, 37, e202400091. [Google Scholar] [CrossRef]
  21. Pushkarev, A.; Pushkareva, I.; Solovyev, M. On the influence of porous transport layers parameters on the performances of polymer electrolyte membrane water electrolysis cells. Electrochim. Acta 2021, 399, 139436. [Google Scholar] [CrossRef]
  22. Lin, R.; Huo, J.; Cai, X.; Lan, S.; Hao, Z. Numerical study of the effects of wettability and hierarchical porosity on oxygen transport within the porous transport layer of proton exchange membrane electrolyzers. J. Power Sources 2024, 614, 235030. [Google Scholar] [CrossRef]
  23. Jiang, Y.; Yang, Z.; Jiao, K. Sensitivity analysis of uncertain parameters based on an improved proton exchange membrane fuel cell analytical model. Energy Convers. Manag. 2018, 164, 639–654. [Google Scholar] [CrossRef]
  24. Vetter, R.; Schumacher, J. Free open reference implementation of a two-phase PEM fuel cell model. Comput. Phys. Commun. 2019, 234, 223–234. [Google Scholar] [CrossRef]
  25. García-Salaberri, P. 1D two-phase, non-isothermal modeling of a proton exchange membrane water electrolyzer: An optimization perspective. J. Power Sources 2022, 521, 230915. [Google Scholar] [CrossRef]
  26. Chen, J.; Sun, Y.; Hu, D.; Lv, H. Performance modeling and mechanism study of proton exchange membrane water electrolyzer coupled with water electroosmosis. Energy Convers. Manag. 2024, 315, 118753. [Google Scholar] [CrossRef]
  27. Carmo, M.; Fritz, D.; Mergel, J. A comprehensive review on PEM water electrolysis. Int. J. Hydrogen Energy 2013, 38, 4901–4934. [Google Scholar] [CrossRef]
  28. Kang, Z.; Mo, J.; Yang, G. Performance Modeling and Current Mapping of Proton Exchange Membrane Electrolyzer Cells with Novel Thin/Tunable Liquid/Gas Diffusion Layers. Electrochim. Acta 2017, 255, 405–416. [Google Scholar] [CrossRef]
Figure 1. A schematic of the 1D model of a PEMWE and the boundary conditions.
Batteries 11 00222 g001
Figure 2. (a) A schematic diagram of the experimental single PEMWE and (b) the predicted polarization curves compared to the experimental data.
Batteries 11 00222 g002
Figure 3. (a) The decomposition of voltage loss and the through-plane profiles of (b) temperature, (c) gas- and liquid-phase velocity, and (d) water saturation.
Batteries 11 00222 g003
Figure 4. The simulation results of PTLs with different thicknesses, (a) polarization curves, and (b) voltage losses.
Batteries 11 00222 g004
Figure 5. The simulation results of PTLs with different porosities, (a) polarization curves, and (b) voltage losses.
Batteries 11 00222 g005
Figure 6. The simulation results of PTLs with different permeabilities, (a) polarization curves, and (b) voltage losses.
Batteries 11 00222 g006
Table 1. The baseline properties with constant values and operating conditions used in the numerical model.
ParameterSymbolValue
Thickness of CL δ C L 20 μm
Porosity of CL ε C L 0.4
Thickness of PEM δ P E M 180 μm
Reference pressurePref1 atm
Reference temperatureTref353.15 K
Reference anode exchange current densityja5 × 10−3 A cm2
Reference cathode exchange current densityjc50 A cm2
Anode transfer coefficient α a 0.5
Cathode transfer coefficient α c 0.5
Coverage exponentns2
Electronic conductivity of CL σ C L 5000 S/m
Electronic conductivity of PTL σ P T L 1250 S/m
Disclaimer/Publisher’s Note: The statements, opinions and data contained in all publications are solely those of the individual author(s) and contributor(s) and not of MDPI and/or the editor(s). MDPI and/or the editor(s) disclaim responsibility for any injury to people or property resulting from any ideas, methods, instructions or products referred to in the content.

