Article

The Application of BiGRU-MSTA Based on Multi-Scale Temporal Attention Mechanism in Predicting the Remaining Life of Lithium-Ion Batteries

School of Automation, Shenyang Aerospace University, Shenyang 110136, China
*
Author to whom correspondence should be addressed.
Batteries 2025, 11(6), 223; https://doi.org/10.3390/batteries11060223
Submission received: 8 May 2025 / Revised: 25 May 2025 / Accepted: 3 June 2025 / Published: 7 June 2025

Abstract

Lithium-ion batteries are an indispensable component of numerous contemporary applications, such as electric vehicles and renewable energy systems. However, accurately predicting their remaining service life is a significant challenge due to the complexity of degradation patterns and time series data. To tackle these challenges, this study introduces a novel Multi-Scale Time Attention (MSTA) mechanism designed to enhance the modeling of both short-term fluctuations and long-term degradation trends in battery performance. This mechanism is integrated with the Bidirectional Gated Recurrent Unit (BiGRU) to develop the BiGRU-MSTA framework. This framework effectively captures multi-scale temporal features and enhances prediction accuracy, even with limited training data. The BiGRU-MSTA model is evaluated via two sets of experiments. First, using the NASA lithium-ion battery dataset, the experimental results demonstrate that the proposed model outperforms the LSTM, BiGRU, CNN-LSTM, and BiGRU-Attention models across all evaluation metrics. Second, experiments conducted on the CALCE dataset not only examine the impact of varying time scales within the MSTA mechanism but also compare the model against state-of-the-art architectures such as Transformer and LSTM–Transformer. The findings indicate that the BiGRU-MSTA model exhibits significantly superior performance in terms of prediction accuracy and stability. These experimental results underscore the potential of the BiGRU-MSTA model for application in battery management systems and sustainable energy storage solutions.

1. Introduction

The extensive deployment of lithium-ion batteries across a variety of energy-efficient applications positions them as critical components within contemporary energy infrastructures. Their usage spans electric vehicles (EVs), renewable energy storage systems—such as those for wind and photovoltaic power—and portable electronic devices [1,2,3,4,5,6,7]. Owing to their superior energy density, absence of a memory effect, and extended cycle life, lithium-ion batteries have increasingly supplanted conventional lead–acid and nickel–metal hydride batteries as the principal energy storage mediums in next-generation energy systems. Nevertheless, during operational deployment, these batteries inevitably undergo performance degradation. This degradation is primarily attributed to structural alterations in electrode materials, decomposition of the electrolyte, and the progressive thickening of the solid electrolyte interface (SEI) layer, which results from side reactions. Such processes contribute to a gradual reduction in capacity, an increase in internal resistance, and heightened demands on thermal management, collectively impinging upon the stability and efficiency of the overall system [8,9,10,11,12]. In extreme scenarios, these factors can precipitate unexpected battery failures, potentially leading to thermal runaway and significant safety hazards. Consequently, precise prediction of the Remaining Useful Life (RUL) of these batteries emerges as a pivotal challenge, essential for ensuring system safety, extending battery lifespan, and refining maintenance strategies. This is particularly critical in EVs and large-scale energy storage systems where battery RUL prediction is intricately linked to operational costs, resource management, and broader issues such as environmental sustainability and energy efficiency [13,14,15,16,17,18].
The methods for predicting the RUL of lithium-ion batteries can be broadly categorized into model-based and data-driven approaches [19,20,21,22]. Model-based approaches predominantly utilize either electrochemical models or equivalent circuit models. Among these, Sangwoo Han et al. [23] introduced an efficient technique to address the challenges associated with the full-order pseudo-two-dimensional (P2D) lithium-ion battery model. Nonetheless, the practical application of such electrochemical models is often hindered by the unmeasurable nature of some key parameters. In a related development, Wei et al. [24] advanced a multi-time-scale strategy that facilitates the simultaneous online estimation of both the SOC and capacity of batteries. This approach employs the Vector Recursive Least Squares (VRLS) algorithm to dynamically update model parameters, thereby ensuring swift convergence and high precision of the estimation process, albeit at the cost of increased computational load and time. Furthermore, Bizeray et al. [25] proposed a parameter identification method for the single-particle model (SPM) of lithium-ion batteries and conducted a thorough analysis of the model’s identifiability. By dimensionally reducing the model, they identified only six independent parameters and employed experimental data in the frequency domain for parameter estimation, thus confirming the model’s predictive capabilities in the time domain. Additionally, Xia et al. [26] developed an online parameter identification and state estimation methodology that integrates Recursive Least Squares with a forgetting factor (FFRLS) and nonlinear Kalman filtering. This method enables real-time updating of model parameters as battery characteristics vary with changes in temperature and SOC, enhancing the accuracy of SOC predictions.
With the rapid advancement of Machine Learning (ML) and Deep Learning (DL) technologies, data-driven approaches have become increasingly prevalent in the prediction of the residual life of lithium-ion batteries. These methods leverage extensive historical data from battery operations to extract decay patterns and characteristics, thereby enabling precise estimations of the RUL. Unlike traditional physical modeling, data-driven approaches obviate the need for internal mechanism modeling of the battery, offering the benefits of rapid development and enhanced adaptability [27]. Xue et al. [28] introduced a DL framework rooted in survival analysis for the prediction of lithium-ion batteries’ remaining lifespan. This innovative method merges traditional survival analysis with advanced DL techniques to address the uncertainties and intricacies within battery lifespan data, thus enhancing both the robustness and accuracy of the predictions. Tarar et al. [29] developed a deep neural network model that integrates memory features to precisely predict the remaining lifespan of lithium-ion batteries. The incorporation of a memory mechanism allows the model to more effectively track the evolving trends in battery performance over time, consequently enhancing predictive accuracy. Furthermore, Liu et al. [30] proposed a hybrid approach that combines multi-feature extraction with a Temporal Convolutional Network (TCN). They employ a channel attention mechanism within the TCN framework to process multi-dimensional features and optimally assign weights, thereby achieving accurate predictions of the battery’s remaining lifespan.
In recent years, the attention mechanism has gained significant traction in the domain of lithium-ion battery residual life prediction, substantially augmenting both the modeling capabilities and prediction accuracy concerning complex degradation patterns. The integration of an attention mechanism enables the model to more effectively identify critical features in the operational data of batteries, focus on pertinent information within the time series, and thus, refine the accuracy of RUL predictions [31,32,33,34,35]. Gao et al. [36] proposed a multi-stage time series processing framework that utilizes an attention mechanism. This framework consists of a class-based intra-cycle sequence feature extraction network and a cross-cycle global feature extraction network. A cross-attention mechanism is employed for feature integration, further enhancing the predictive capabilities. Additionally, Huang et al. [37] introduced a methodology that combines the Temporal Pattern Attention (TPA) mechanism with a CNN-LSTM model to predict the RUL, achieving noteworthy success.
Although existing prediction methodologies based on DL have shown progress in the RUL estimation of lithium-ion batteries, several challenges persist. These include the complexity of time series data, the issue of long-term dependencies, and the inadequate capability of models to process features across different scales. To address these challenges, this study introduces a novel Multi-Scale Temporal Attention (MSTA) mechanism and constructs a model termed BiGRU-MSTA, based on this mechanism. Utilizing the Bidirectional Gated Recurrent Unit (BiGRU), the proposed model incorporates the MSTA mechanism. This integration not only preserves BiGRU’s capacity to model temporal dependencies but also augments it with a multi-level attention structure that operates across diverse time scales. Consequently, the model enhances its capability to extract features from multiple time scales, thereby maintaining robust predictive performance even in the presence of complex time series degradation patterns.
The principal contributions of this study are outlined as follows:
  • Proposition of a novel MSTA: The study introduces a new MSTA mechanism specifically designed to address the complex degradation patterns observed in time series data for lithium-ion battery RUL prediction. This mechanism facilitates the extraction of multi-scale features from the degradation data, capturing both short-term fluctuations and long-term trends effectively. As a result, it significantly improves the model’s ability to represent temporal features.
  • Integration of MSTA with BiGRU: The BiGRU-MSTA model merges the bidirectional sequence modeling capability of BiGRU with the multi-scale feature extraction efficiency of MSTA. This innovative architecture allows for the effective learning of both forward and backward temporal dependencies, while simultaneously focusing on critical patterns at varying time scales. This integration markedly enhances the model’s prediction accuracy and robustness.
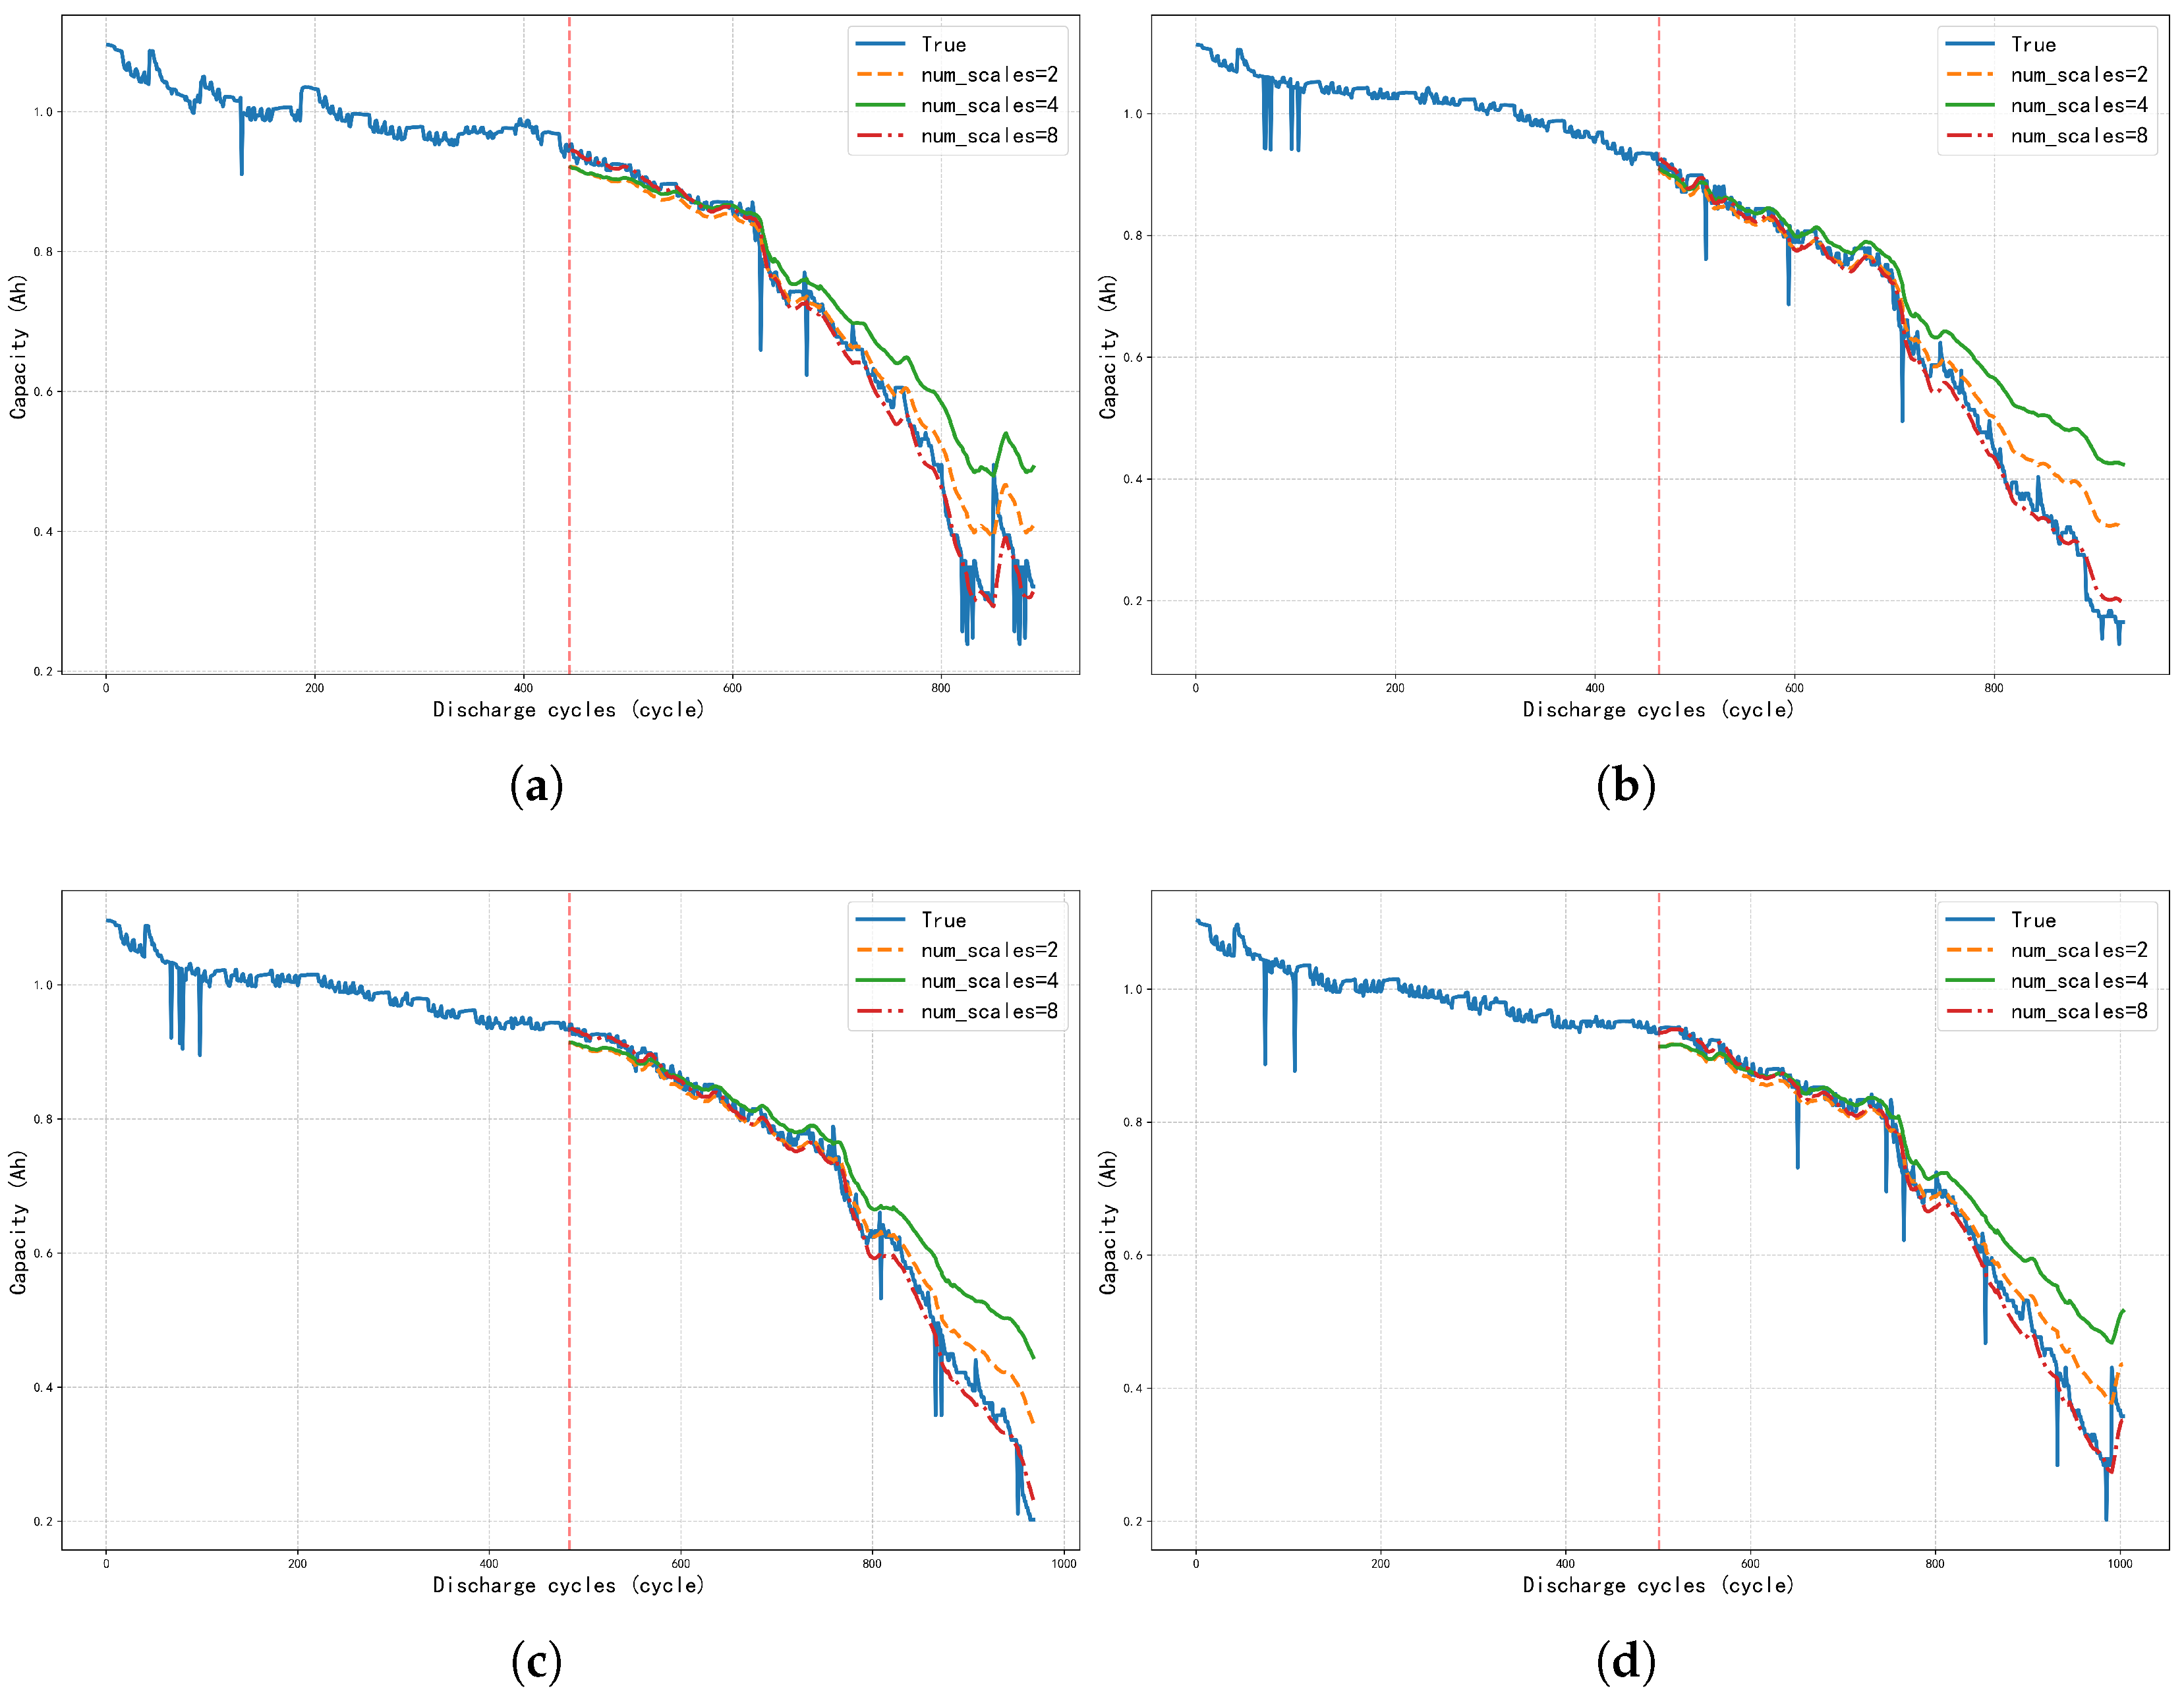
  • Evaluation on the NASA and CALCE lithium-ion battery datasets: For the NASA dataset, three distinct train–test split ratios (3:7, 5:5, and 7:3) were employed. The results consistently indicate that the BiGRU-MSTA model surpasses existing methods across all configurations, underscoring its exceptional predictive accuracy and generalization capability. Furthermore, the CALCE dataset experiment investigates the impact of varying numbers of temporal scales within the MSTA mechanism. The findings reveal that the model achieves optimal performance with an increased number of scales, thereby reinforcing its robustness and superior performance relative to state-of-the-art models.

2. Materials and Methods

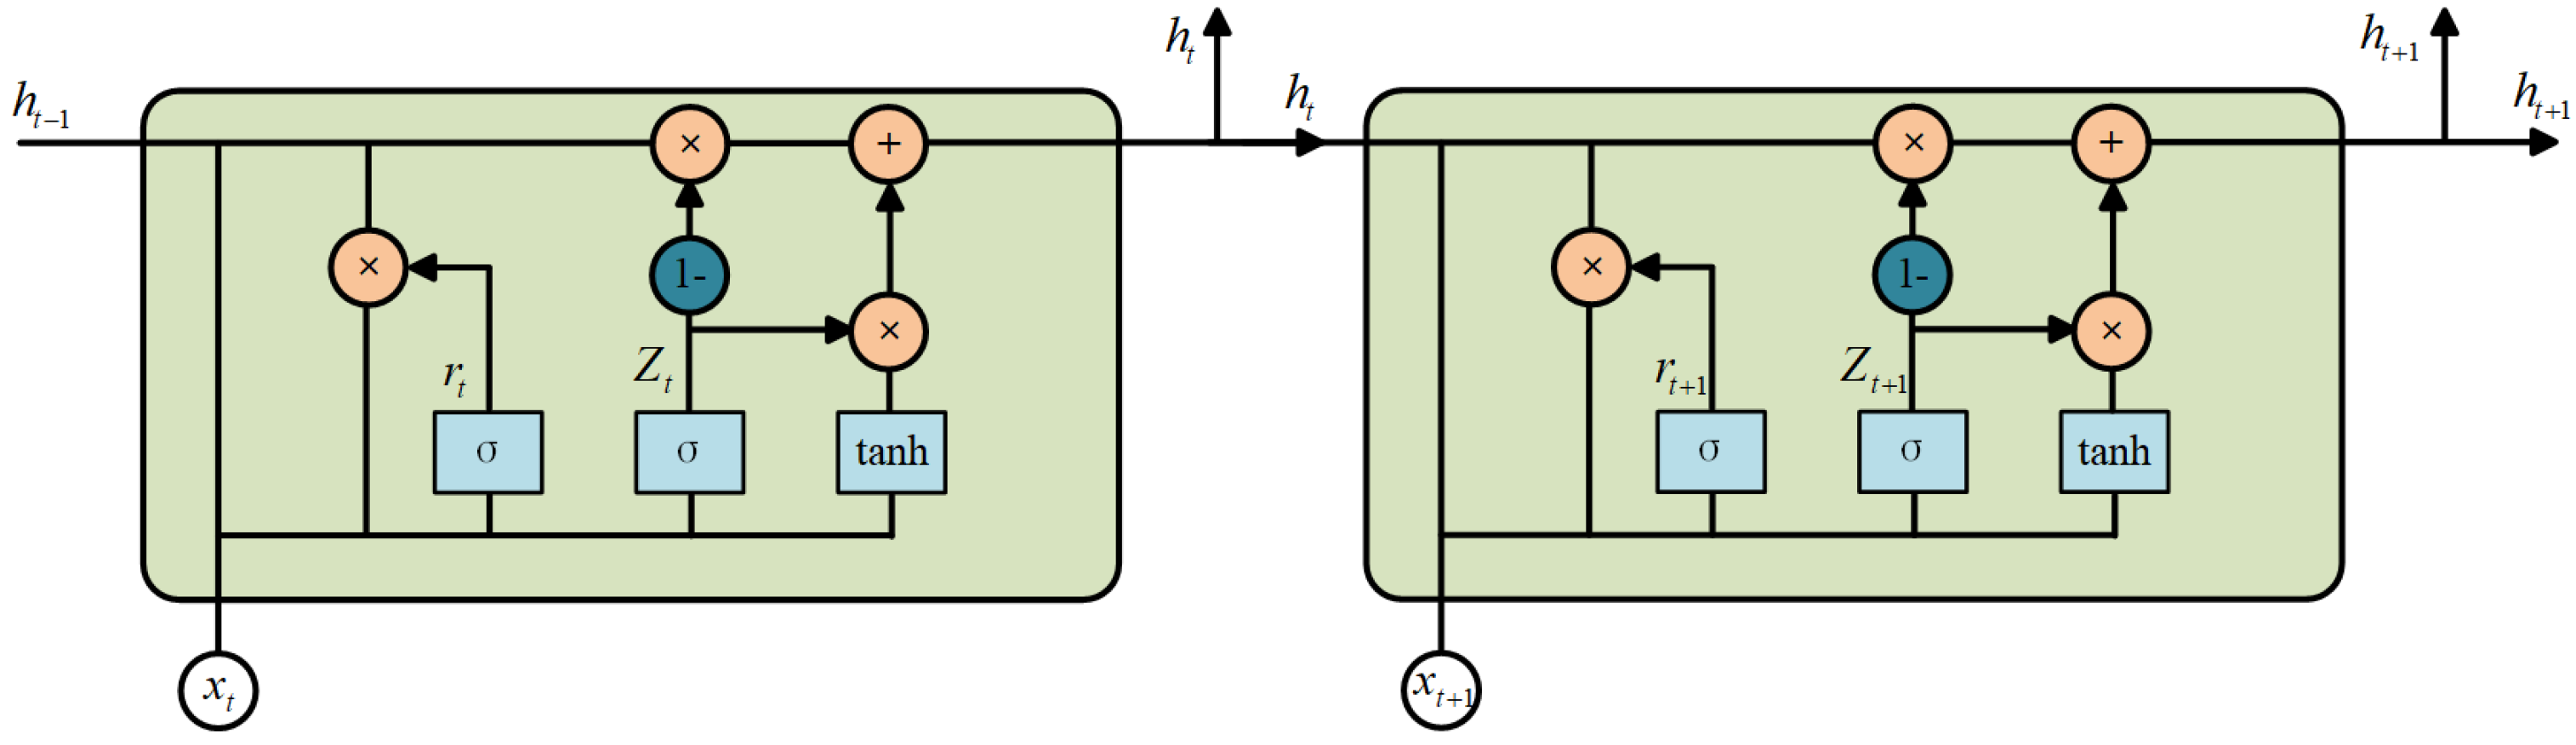
2.1. Gated Recurrent Unit (GRU) Methodology
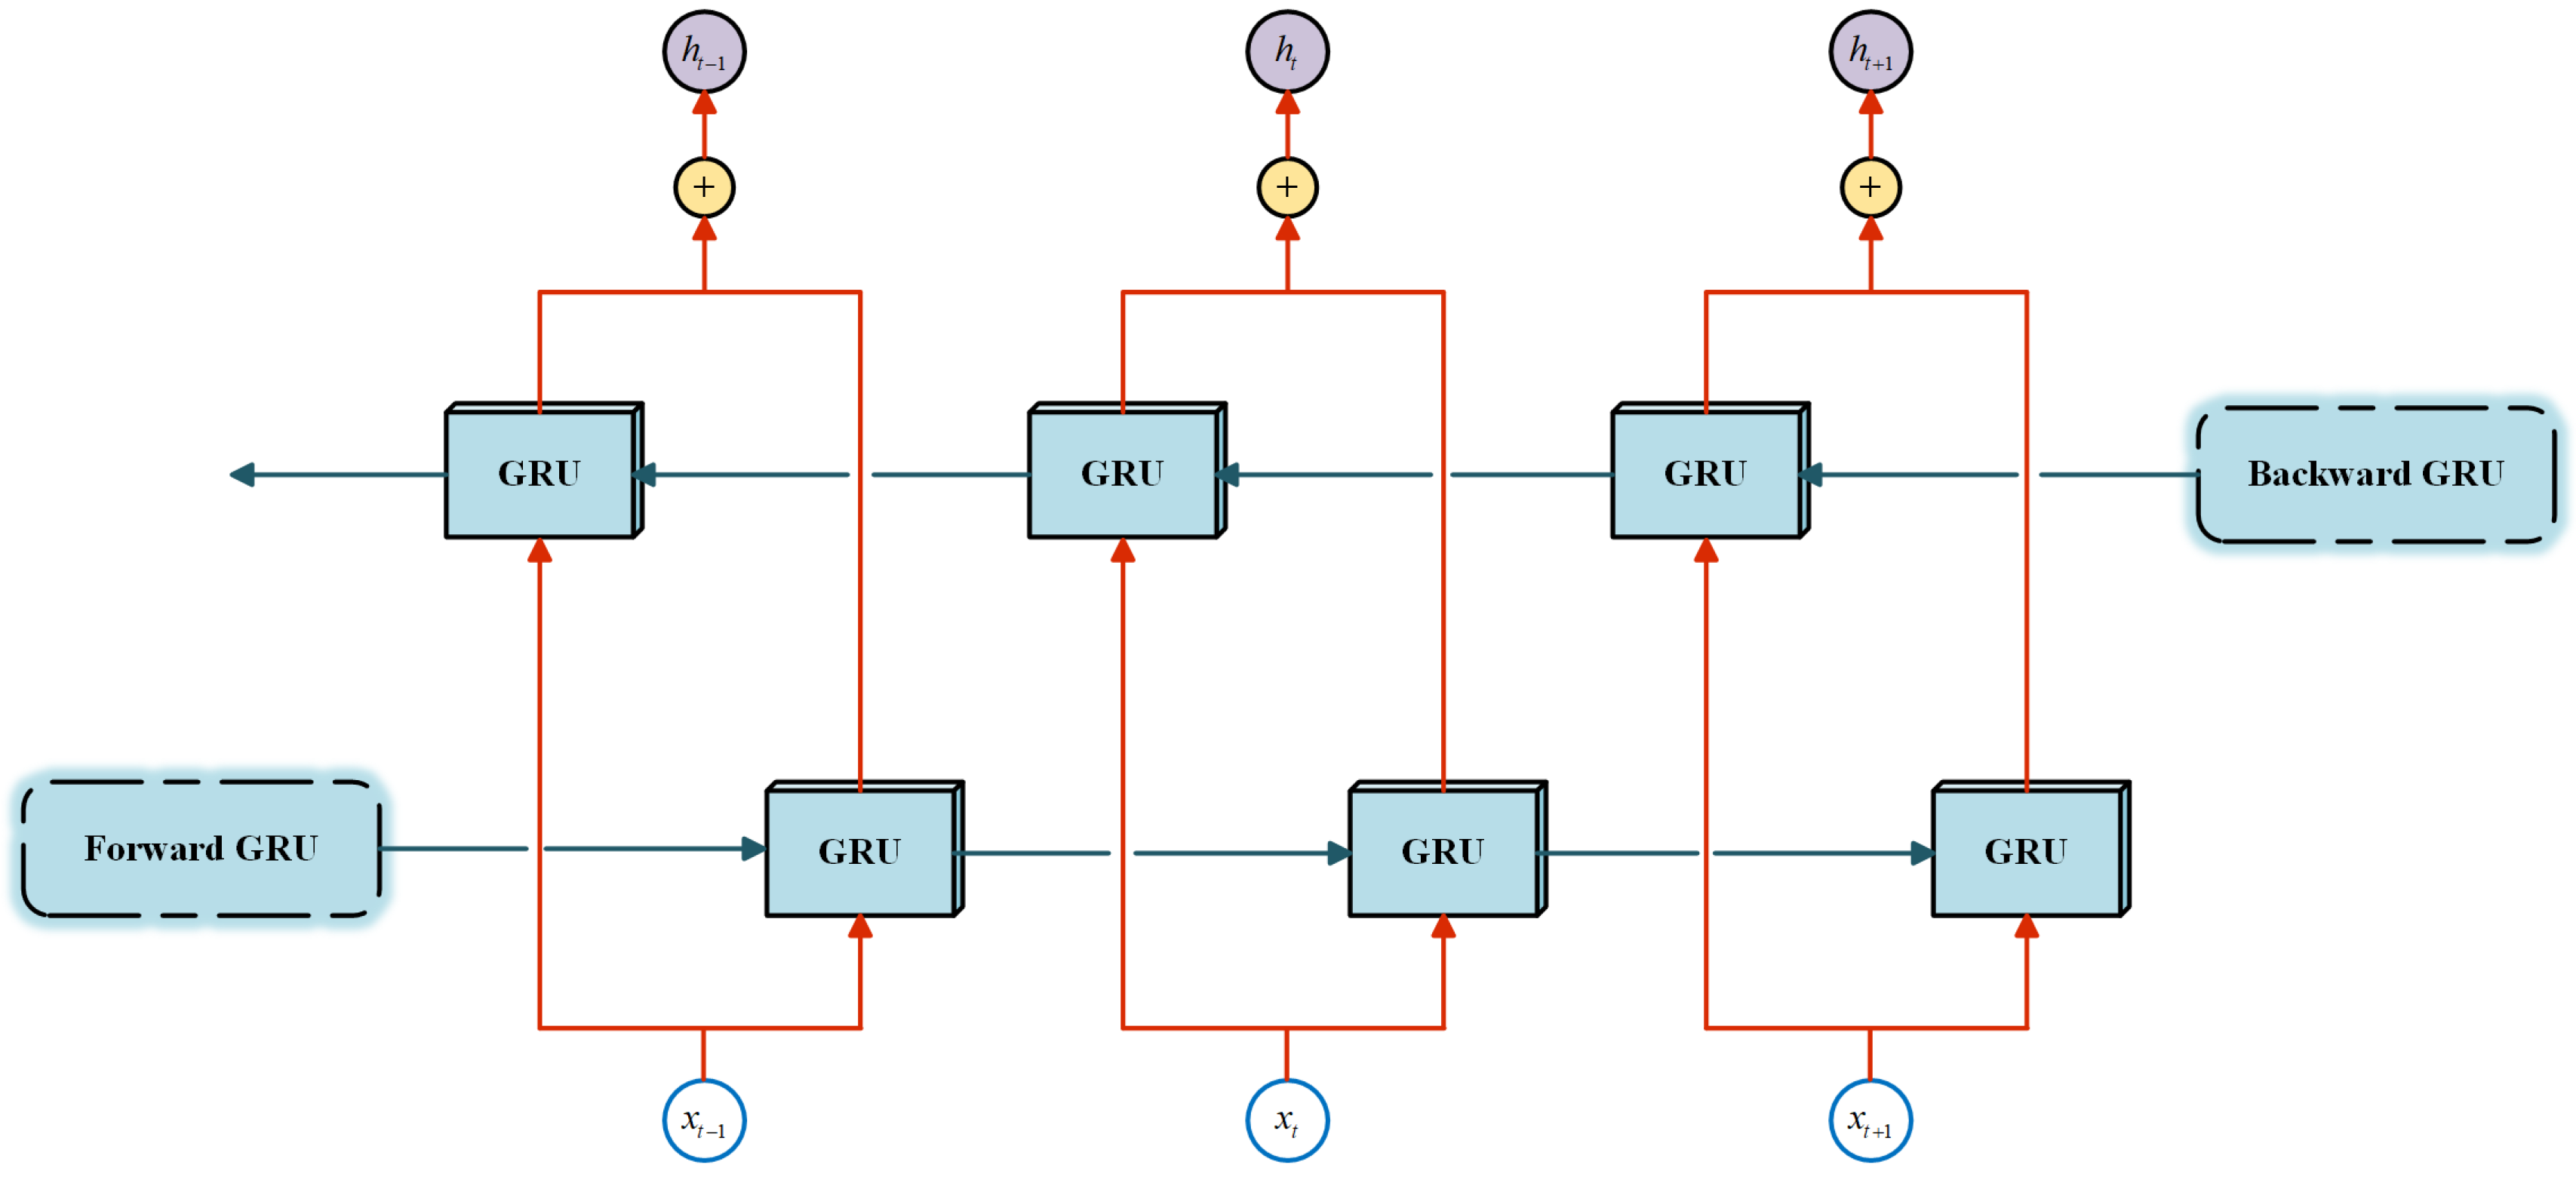
The Gated Recurrent Unit (GRU), recognized as a streamlined variant of the Long Short-Term Memory (LSTM) network, incorporates a dual-gated mechanism consisting of an update gate and a reset gate. This design amalgamates the input and forget gates of the LSTM into a single update gate, simplifying the overall architecture. The structural configuration of the GRU is depicted in Figure 1. The update gate plays a pivotal role in modulating the influence of the previous hidden state h t 1 on the current hidden state h t . A value close to 1 reinforces temporal continuity, while a value nearing 0 shifts the focus towards the current input data. Conversely, the reset gate determines the blend of historical and current input data. A lower value near 0 effectively blocks the passage of extraneous information, thereby facilitating dynamic filtration within the memory system [38,39]. In comparison to LSTM, the GRU enhances computational efficiency by reducing the number of parameters required, yet preserves robust capabilities in sequence modeling [40].
As illustrated in Figure 1, x t represents the input data, and h t denotes the output from the GRU unit. The variables r t and Z t correspond to the reset gate and the update gate, respectively. These gates interact to determine the new hidden state h t from the prior hidden state h t 1 . The update gate merges the current input with the memory of the preceding moment h t 1 , outputting a value Z t that ranges between 0 and 1. The governing equation is
Z t = σ W z h t 1 , x t + b x ,
where in Equation (1), σ denotes the sigmoid activation function, W z is the weight matrix for the update gate, and b z represents the bias term. The reset gate assesses the relevance of h t 1 for the new memory state h t . If the prior memory state h t 1 is deemed irrelevant for the current context, the reset gate can nullify its effect, as expressed by
r t = σ W r h t 1 , x t + b r ,
Based on the output of the update gate, the interim memory state h ˜ t is formulated:
h ˜ t = tanh W h r t h t 1 , x t + b h ,
The final output at the current time step, h t , is then computed as
h t = 1 Z t h t 1 + Z t h ˜ t .

2.2. BiGRU Method

The BiGRU model’s fundamental unit incorporates GRU units that carry out both forward and backward propagation [41]. Specifically, one unit processes the data in chronological order, while the other processes it in reverse. This bidirectional architecture equips the BiGRU model with the capability to simultaneously capture forward-looking and backward-looking information within sequence data. Consequently, the model’s proficiency in recognizing and predicting sequential patterns is significantly enhanced. The architecture of the BiGRU network is illustrated in Figure 2.
The present hidden state of the BiGRU is influenced by the current input x t and is determined by the states h t 1 and h t 1 , which represent the forward and backward hidden states at time t 1 , respectively. The equations governing these states are as follows:
h t = G x t , h t 1 ,
h t = w t h t + v t h t + b t ,
where G ( · ) denotes the nonlinear transformation function applied to the input, encoding the degradation index into the corresponding GRU hidden state. The parameters W t and v t correspond to the weights of the forward and backward hidden states, respectively, at time t, while b t represents the bias associated with the hidden states at the same time.

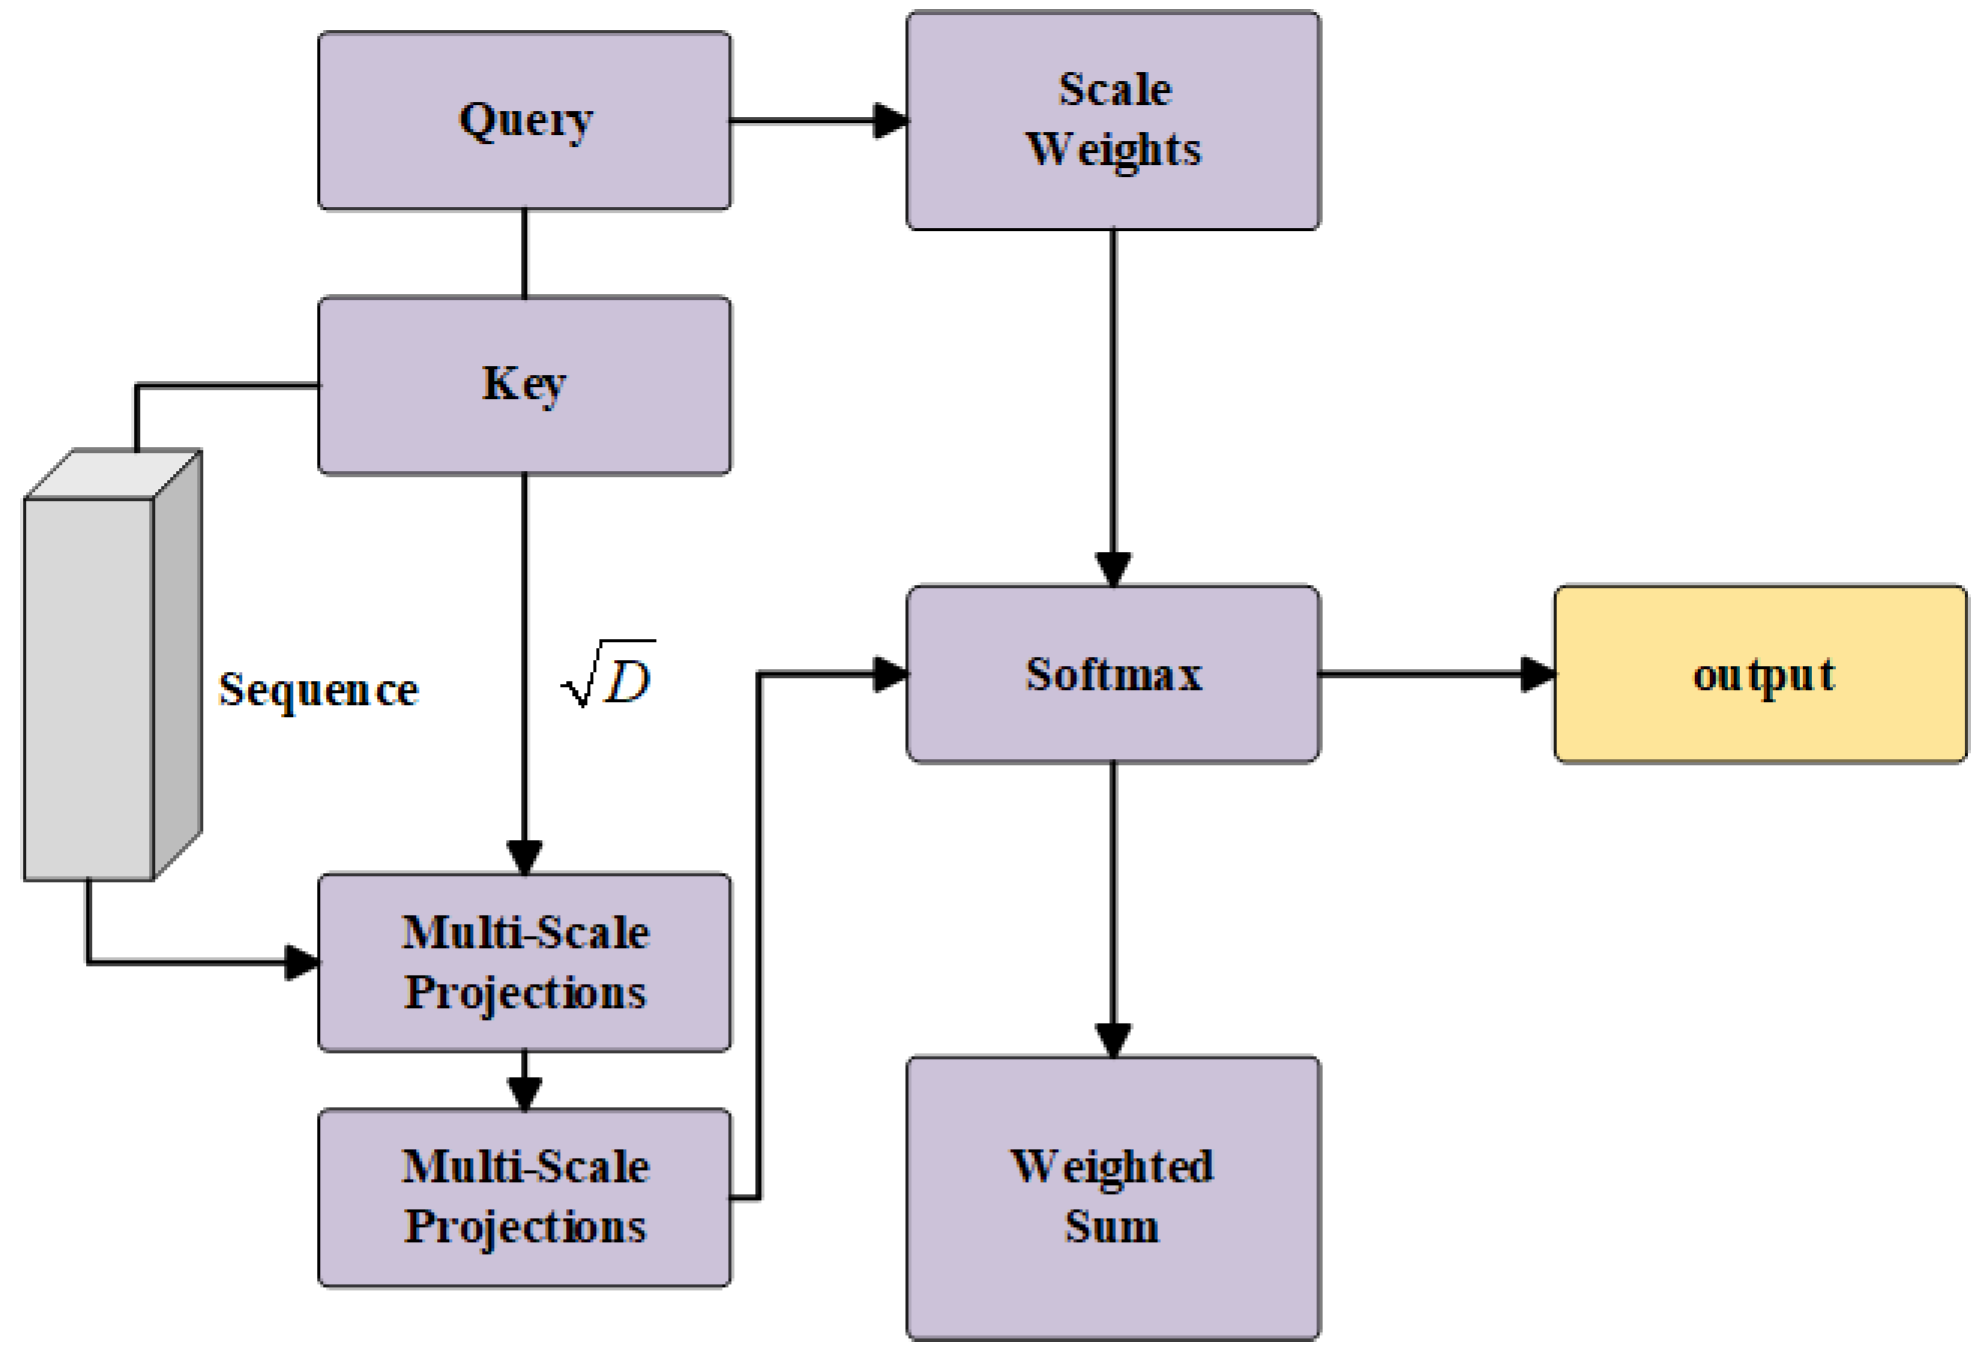
2.3. Multi-Scale Temporal Attention

The MSTA mechanism introduced in this study extracts hierarchical and multi-granular features from time series data, merging both local details and global semantic information. This approach facilitates a more comprehensive and precise modeling of time series data. Through an adaptive weight learning strategy, the MSTA dynamically adjusts the importance of different time scales based on the characteristics of the input data. It also enhances feature representation capabilities through nonlinear transformations, thereby significantly improving the model’s ability to handle and generalize from complex time series patterns. In practical applications such as battery RUL prediction, the MSTA effectively integrates short-term fluctuations and long-term trends, demonstrating superior performance. The structure of the MSTA mechanism is depicted in Figure 3.
Given an input sequence X R B × T × D , where B denotes the batch size, T the sequence length, and D the feature dimension, we describe the mathematical framework of the MSTA as follows: Initially adhering to the standard self-attention paradigm with an emphasis on temporal dynamics, we project the input sequence into query, key, and value representations via learnable linear transformations. Distinctively, our approach employs the final state of the sequence as the query vector to encapsulate forward-looking dependencies:
Q = X T W Q R B × 1 × D ,
K = X W K R B × T × D ,
V = X W V R B × T × D ,
where X T denotes the last time step of the sequence, and W Q , W K , and W V represent the learnable parameter matrices for the query, key, and value projections, respectively.
The fundamental attention score is computed as follows:
A b a s e = softmax Q K D · τ R B × 1 × T ,
where τ is a temperature parameter employed to modify the sharpness of the attention distribution.
For multi-scale feature extraction, we define S distinct temporal scales, and the feature representation for each scale s is expressed as
F s = ϕ s ( X ) R B × T s × D ,
where ϕ s is the feature extraction function for the s-th scale, and T s represents the sequence length at that scale.
For different scales s, the feature extraction methodologies are specified as follows: When T s = 1 , termed as the global view,
F s = ψ s 1 T t = 1 T X ( · , t , · ) .
When T s > 1 , termed as the local view,
F s = ψ s Ω s ( X ) .
Here, ψ s denotes a nonlinear transformation function, and Ω s represents the sliding window aggregation operation at scale s. Specifically, the sequence X is divided into windows of size w s , with a stride of w s 2 , followed by mean aggregation within each window.
For each scale s, we compute its attention weight:
A s = softmax Q ( F s ) D R B × 1 × T s .
The context vector for each scale is
C s = A s F s R B × 1 × D .
Meanwhile, the model learns a scale importance vector α R B × S :
α = softmax ( X T W α ) ,
where W α represents a learnable parameter matrix.
The final multi-scale context vector is yielded through weighted fusion:
C m u l t i = s = 1 S α : , s C s R B × D .
The context vector for the basic attention is formulated as
C b a s e = A b a s e V R B × 1 × D .
The final output is a combination of the basic context and the multi-scale context, transformed by the output projection matrix W O :
C f i n a l = W O ( C b a s e + C m u l t i ) R B × D .

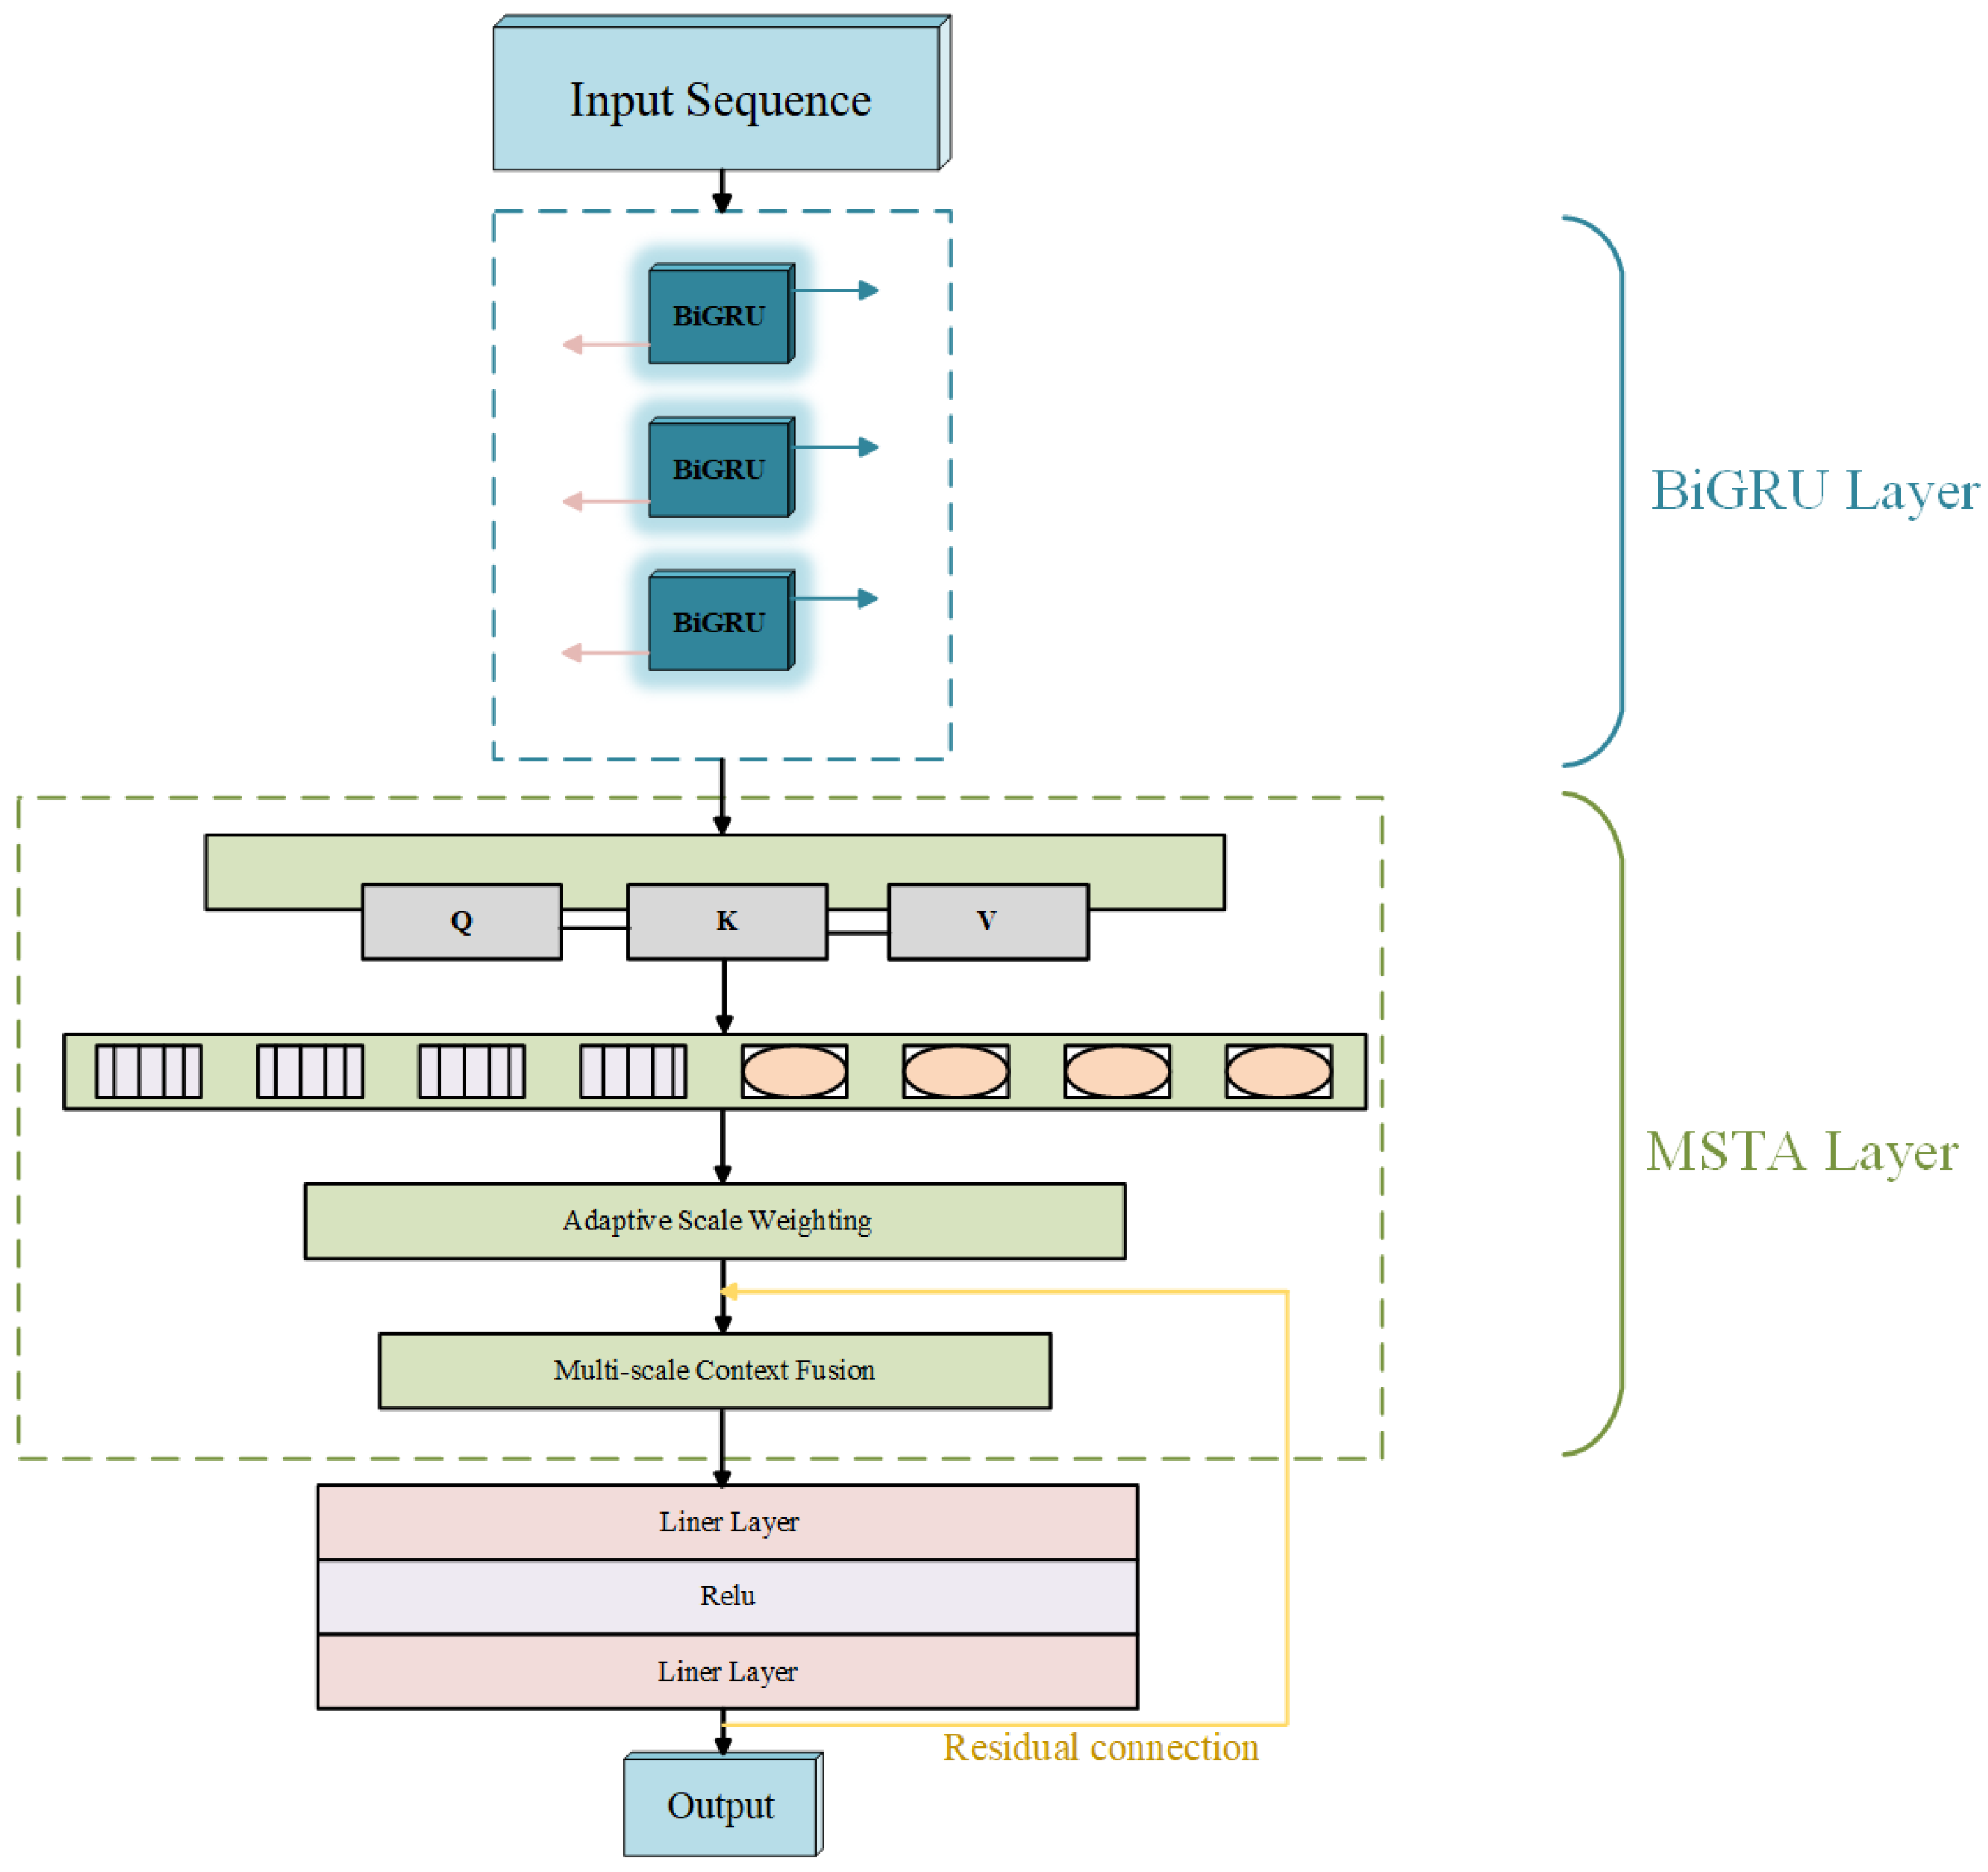
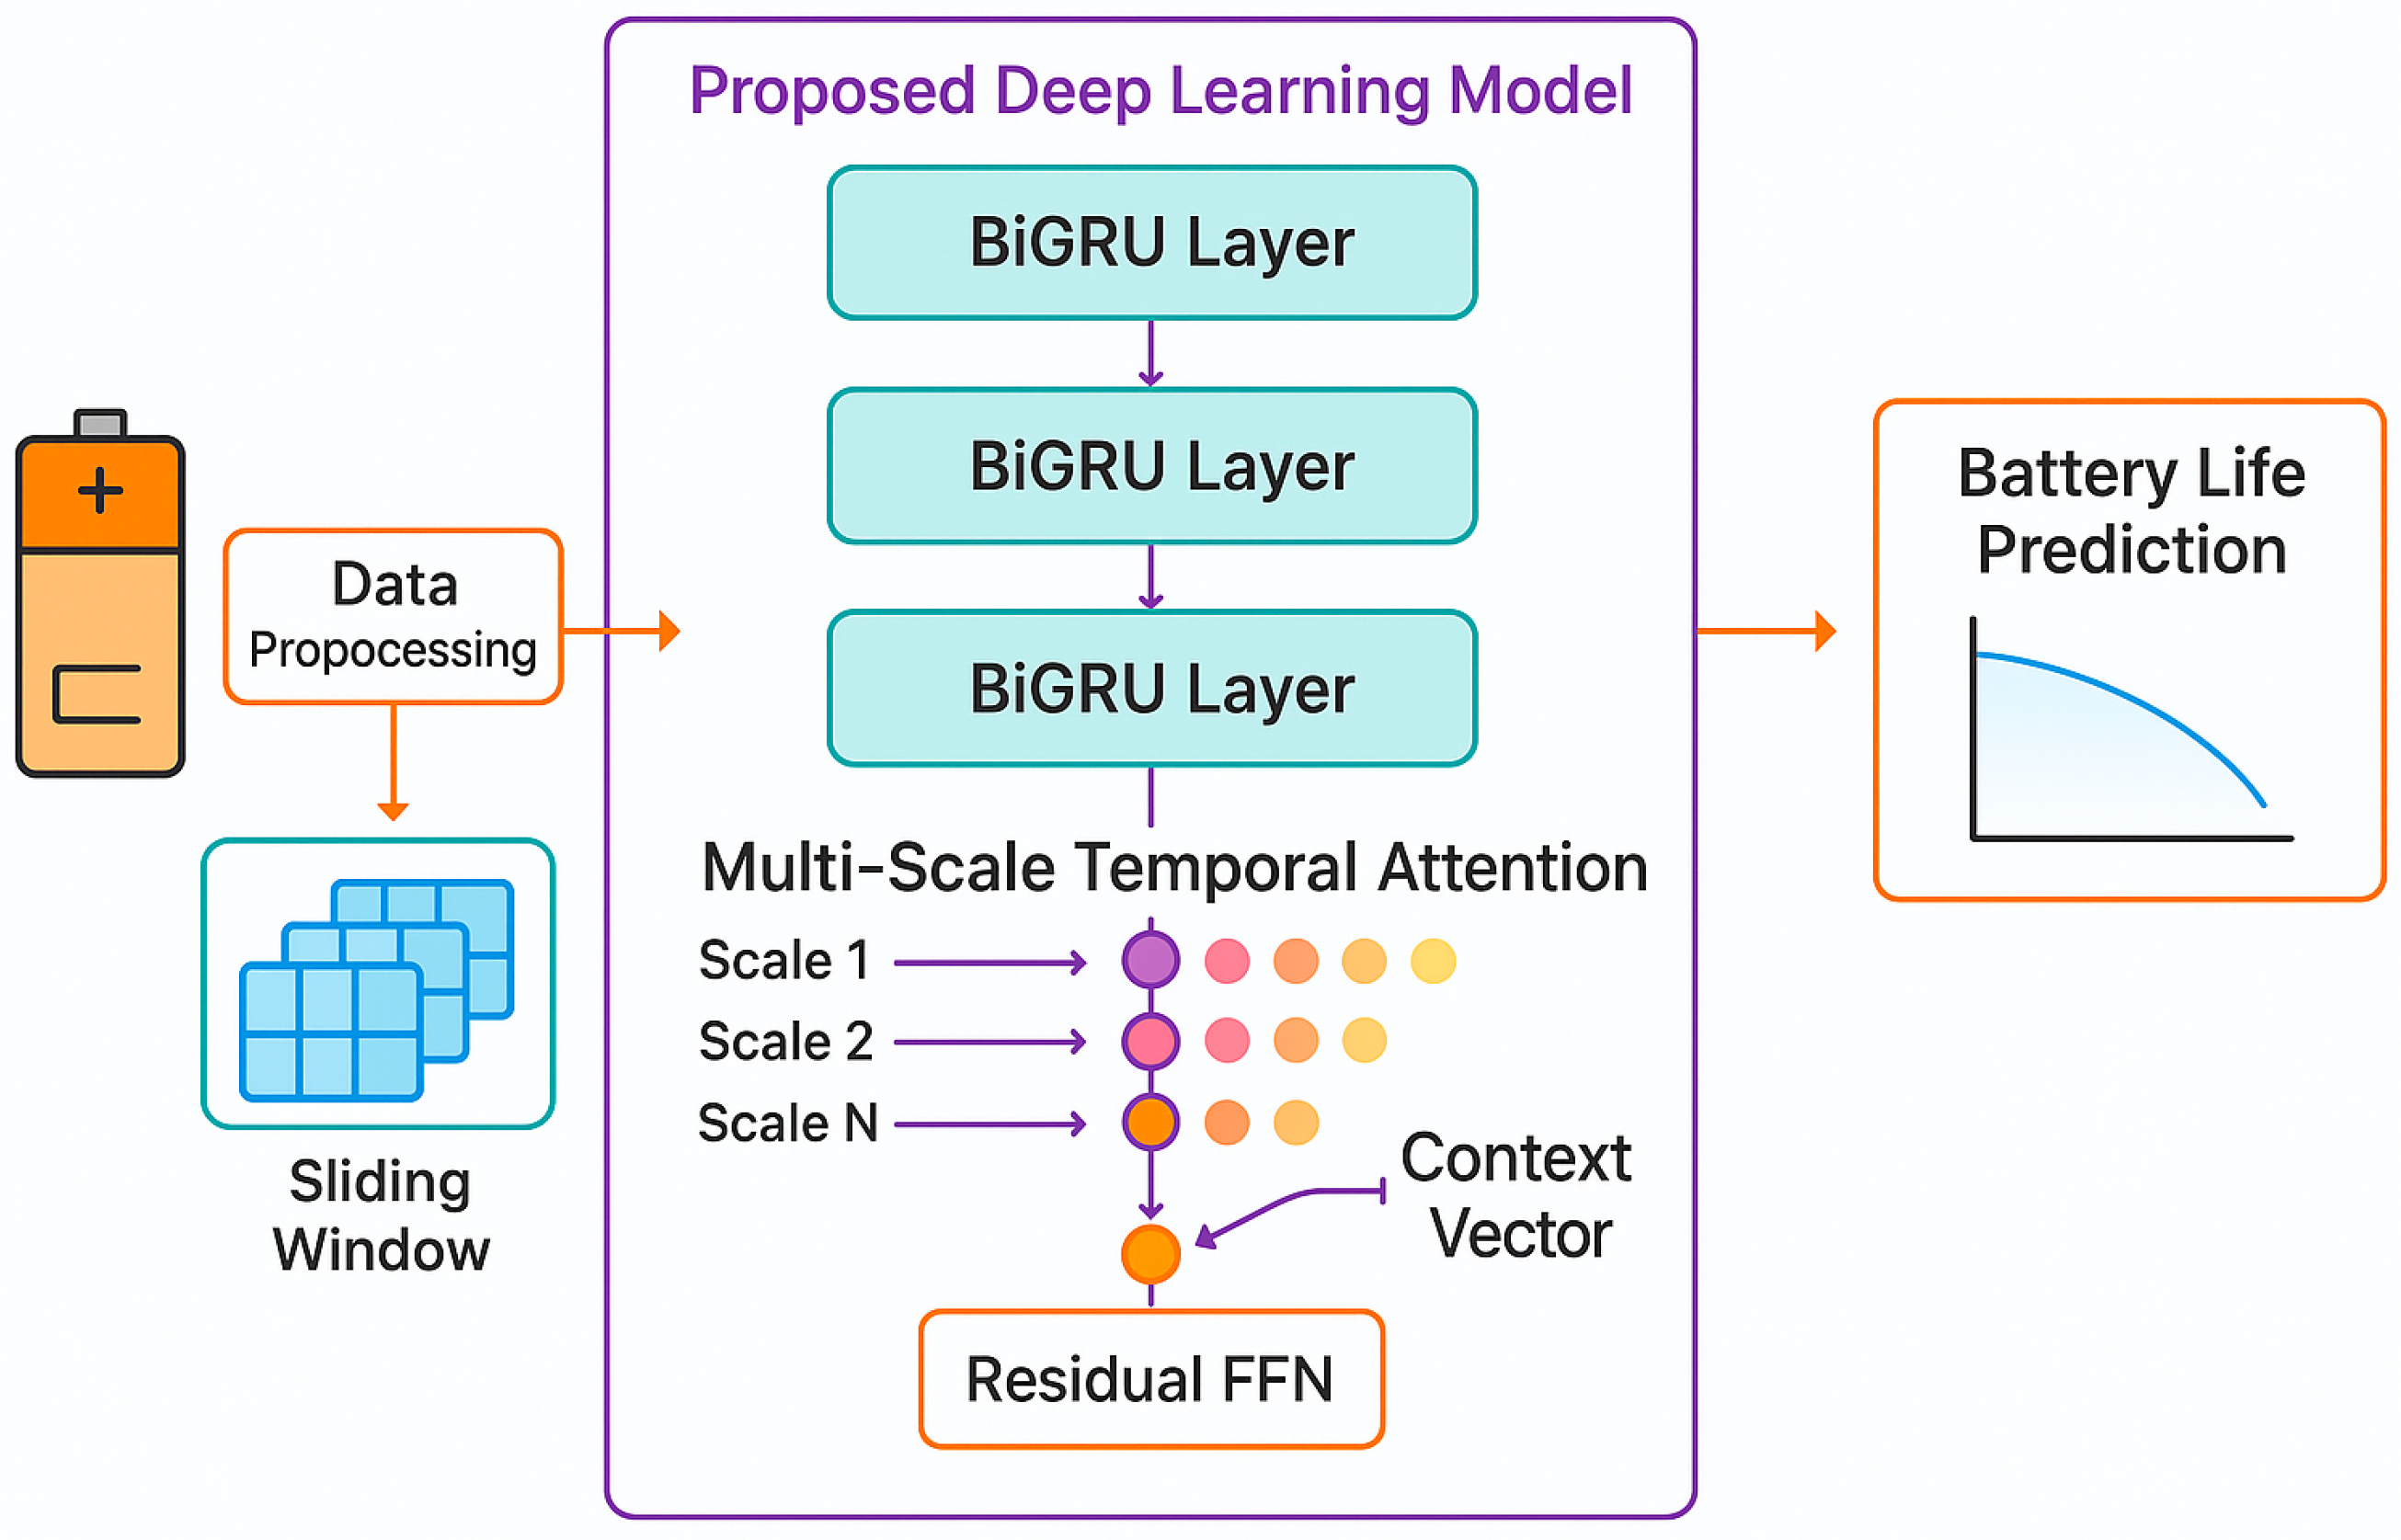
2.4. BiGRU-MSTA Model

The BiGRU-MSTA model, introduced in this study and depicted in Figure 4, is designed to address the challenges associated with modeling multi-scale temporal features in lithium-ion battery remaining life sequence data and to enhance the model’s capability in representing complex temporal patterns. This model integrates a BiGRU with an MSTA mechanism to construct a DL framework that facilitates hierarchical feature extraction and dynamic scale perception.
Initially, the model processes the input sequence through a multi-level BiGRU network, which augments the ability to model long-term dependencies while concurrently capturing short-term features via a bidirectional information transfer mechanism. The BiGRU units at each layer are concatenated; the outputs from both the preceding and the succeeding layers are utilized as inputs, thereby fostering a progressively deepened feature representation.
Subsequent to feature extraction via BiGRU, the hidden states are fed into the MSTA module. Initially, features are projected into the attention space through a linear transformation using matrices Q, K, and V to model the interdependencies within the sequence elements. Building upon this, the MSTA module employs a multi-scale feature extraction approach, leveraging varying window sizes to perform sliding aggregation of sequence features. This approach captures both local, fine-grained patterns and broader contextual information. To enhance the efficacy of scale integration, the MSTA module incorporates an adaptive scale weighting mechanism, dynamically adjusting the contribution of each scale based on the significance of the input features, thereby achieving an adaptive amalgamation of multi-scale information.
Following the MSTA processing, the resultant feature vectors are input into a feedforward neural network for further transformation. This network employs residual connections to mitigate the vanishing gradient issue prevalent in the training of deep networks while preserving the flow of initial features. Ultimately, a linear layer maps the transformed features into the target output space, culminating the prediction task.

3. Results and Discussion: NASA Dataset

The experimental setup included an Intel(R) Core(TM) i5-14400 processor operating at 2.50 GHz (Intel, Mountain View, CA, USA) and an NVIDIA GeForce RTX 4060 graphics card (NVIDIA, Santa Clara, CA, USA). Experiments were conducted within a Python 3.8.20 and Pytorch 2.3.1 environment.

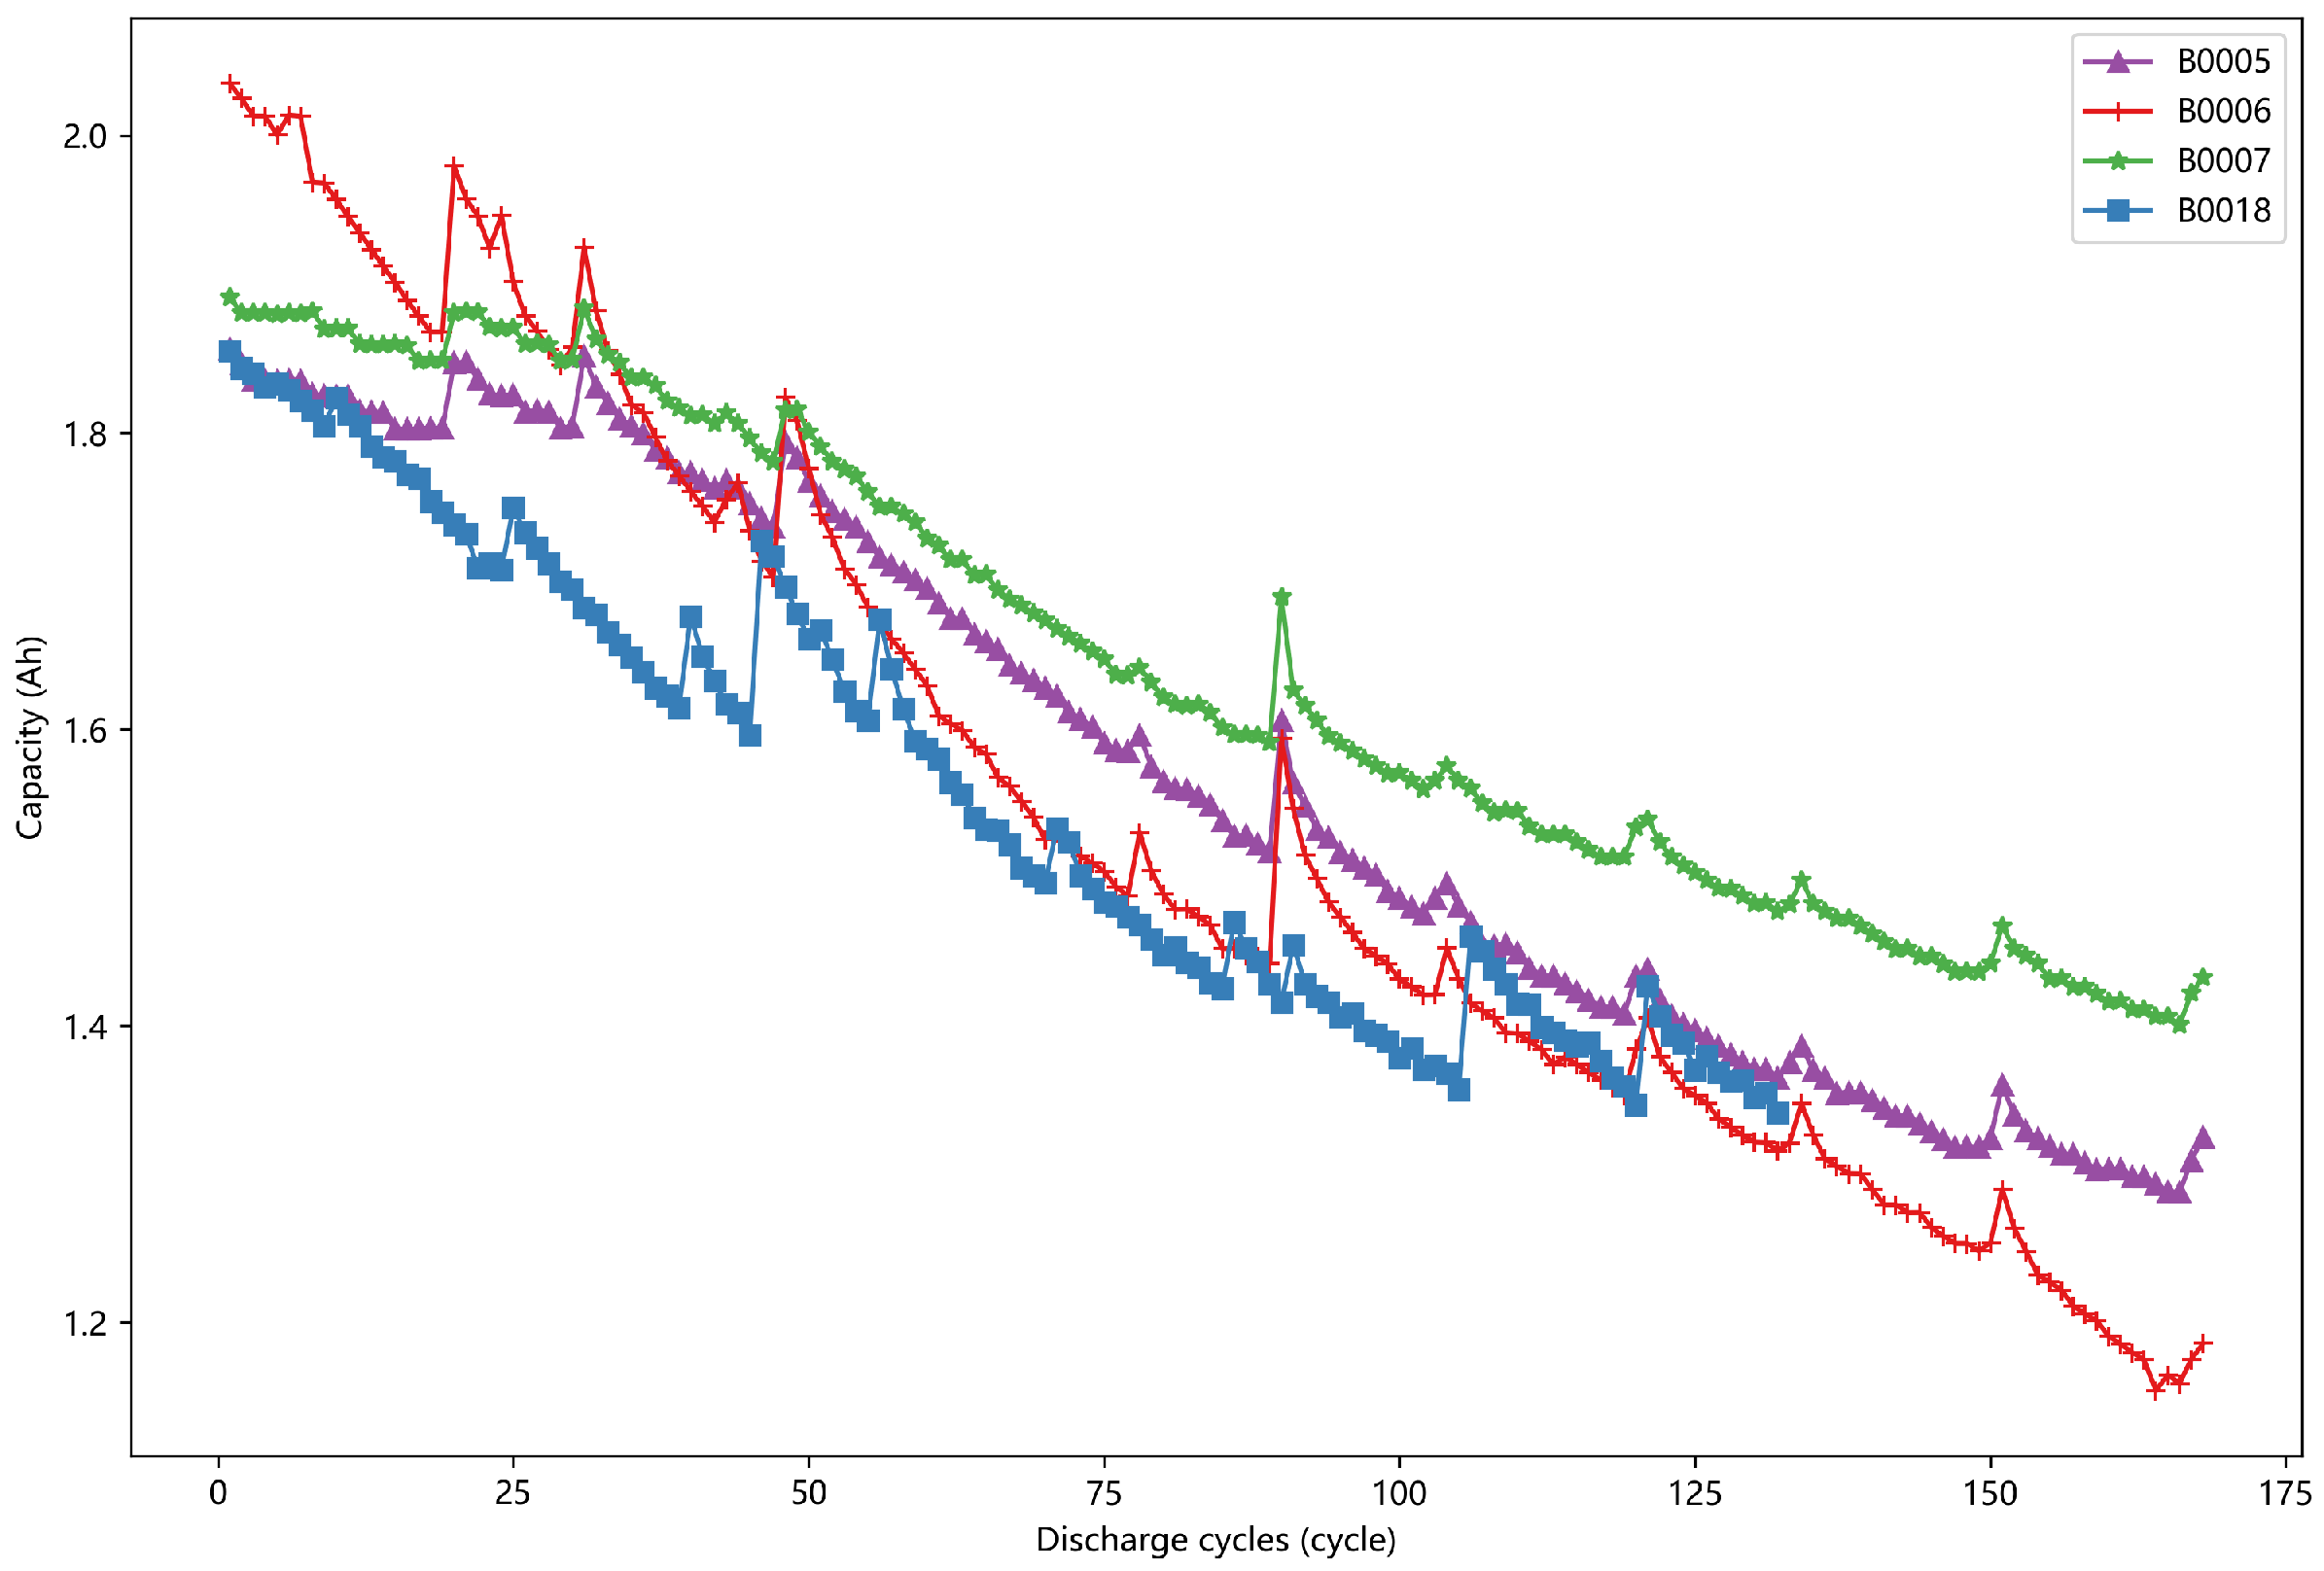
3.1. Dataset Introduction

The dataset employed in this section is derived from a publicly available lithium-ion battery lifespan experiment provided by the National Aeronautics and Space Administration (NASA). Specifically, the experimental data for four batteries, identified as B0005, B0006, B0007, and B0018, were selected for analysis. These data were acquired through cyclic charging and discharging experiments conducted on 18,650 lithium-ion batteries, which possess a rated capacity of 2 Ah, at ambient temperature conditions. The charging protocol involved an initial constant-current charge at 1.5 A, followed by a shift to constant-voltage mode upon reaching the maximum charge cutoff voltage of 4.2 V. This mode was maintained until the charge current decreased to the minimum cutoff threshold of 20 mA. During the discharge phase, the batteries were discharged at a constant current of 2 A until the voltage level fell to the predefined discharge cutoff voltage. Notably, the discharge cutoff voltages for the batteries B0005, B0006, B0007, and B0018 were set at 2.7 V, 2.5 V, 2.2 V, and 2.5 V, respectively. Figure 5 illustrates the capacity degradation curves of the four batteries under study. This visual representation highlights the varying capacity retention trends among the different battery types, underscoring the non-uniform and nonlinear characteristics of the lithium-ion battery capacity sequence.
The dataset was structured using a sliding window technique, where the original life series data were segmented into equal duration intervals. These segments serve as the basis for constructing time series inputs, which utilize historical degradation data to forecast the remaining lifespan of the lithium-ion battery at subsequent intervals. To elucidate the overall life prediction process and the architectural framework of the model, this study includes a system diagram shown in Figure 6. This diagram delineates the workflow starting from raw data acquisition of the battery, followed by sliding window preprocessing, application of BiGRU, MSTA, and a residual feedforward network, culminating in the output of the battery life prediction.

3.2. Evaluation Metrics

To rigorously assess the performance of the proposed predictive model, this study employed five statistical metrics for quantitative analysis: Mean Squared Error (MSE), Root Mean Squared Error (RMSE), Mean Absolute Error (MAE), Mean Absolute Percentage Error (MAPE), and Coefficient of Determination ( R 2 ). Each metric is defined as follows:
MSE = 1 n i = 1 n y i y ^ i 2 ,
RMSE = 1 n i = 1 n y i y ^ i 2 ,
MAE = 1 n i = 1 n y i y ^ i ,
MAPE = 1 n i = 1 n y i y ^ i y i ,
R 2 = 1 i = 1 n y i y ^ i 2 i = 1 n y i y ¯ 2 ,
where y i represents the actual observed value of the lithium-ion battery capacity, y ^ i denotes the predicted capacity by the model, y ¯ is the arithmetic mean of all observed values, and n is the number of data samples. MSE emphasizes larger deviations through squared errors, reflecting the degree of deviation between the predicted values y ^ i and the actual capacities y i . RMSE provides a dimensionally consistent measure allowing for intuitive interpretation of error magnitude. MAE directly quantifies the mean absolute deviation between the predicted and actual capacities, providing robustness against outliers. MAPE expresses the error as a percentage, facilitating comparative analysis across datasets of varying scales. The R 2 metric quantifies the model’s capability to explain variability in the target variable; values closer to 1 indicate a better model fit [12,42].

3.3. Model Parameters

To ensure the reproducibility of results, this study consistently used a fixed random seed of 42 and repeated the experiment 10 times. The final metrics are reported as mean ± standard deviation. for all experiments. The model configuration includes single input and output dimensions, and a three-layer BiGRU architecture with hidden layer dimensions of 16, 32, and 64, respectively. The attention mechanism incorporates a multi-scale design with eight distinct temporal scales, and the temperature parameter is fixed at 1.0 to balance attention distribution across these scales. During training, the Adam optimizer was utilized with an initial learning rate of 0.0003, applying a linear decay strategy. Batch sizes were dynamically adjusted based on available video memory capacity. MSE was employed as the loss function. A total of 300 training epochs were performed, each encompassing full iterations over the dataset, on NVIDIA CUDA-enabled devices. Detailed model parameters are presented in Table 1.

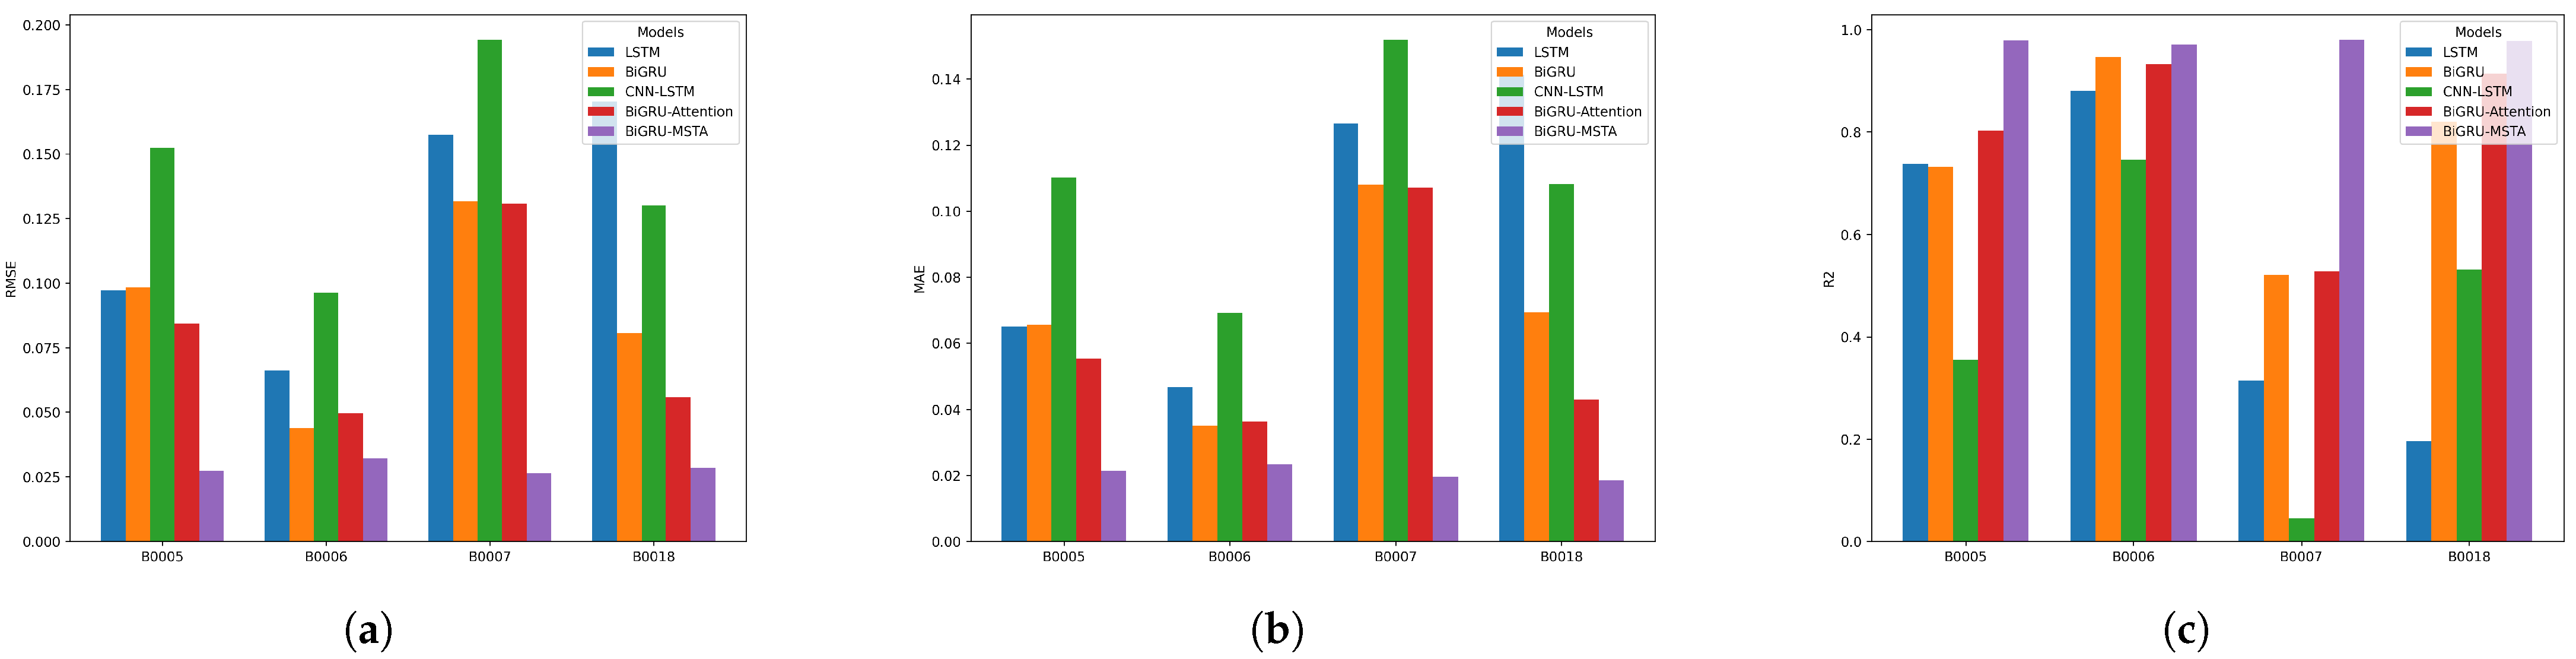
3.4. Comparative Analysis of Results

This section presents a comparative analysis of the performance of the proposed BiGRU-MSTA model against several prevalent Machine Learning models, including LSTM, BiGRU, CNN-LSTM, and BiGRU-Attention, specifically in the context of predicting the remaining service life of lithium-ion batteries. The evaluation involved four distinct battery types (B0005, B0006, B0007, B0018), with data segregated into varying training and testing ratios (3:7, 5:5, 7:3). As depicted in Figure 7, multiple experiments were conducted for each battery type using different training–test partition ratios to thoroughly assess the efficacy of each model under diverse data distribution conditions.
Under a variety of data partitioning scenarios, the BiGRU-MSTA model consistently outperformed the other models, particularly in terms of capturing the attenuation trends in the remaining service life of the batteries, thereby highlighting its distinctive advantages. While the standalone BiGRU model was capable of recognizing the fundamental degradation trends of the batteries, it exhibited notable shortcomings in terms of prediction accuracy and model fit. This was particularly evident at critical junctures of battery capacity decline, where the predictive errors were significantly magnified.
The integration of BiGRU with the MSTA module markedly enhanced the model’s performance. The MSTA component facilitates multi-scale time feature extraction, which empowers the BiGRU framework to simultaneously address short-term fluctuations and long-term degradation patterns. This dual capability significantly augments the predictive precision of the model. Even with relatively restrained volumes of training data, the BiGRU-MSTA model adeptly identifies crucial characteristics during the battery degradation trajectory, circumventing typical overfitting or underfitting issues associated with inadequate data.
In comparison to the alternative models, the BiGRU-MSTA model excels in both accuracy and stability. The LSTM and CNN-LSTM models demonstrate certain limitations in modeling the intricate patterns of battery degradation, particularly in capturing long-term dependencies and nonlinear degradation characteristics, resulting in suboptimal performance. Although the CNN-LSTM model amalgamates the strengths of CNN and LSTM, it falls short in effectively discerning the degradation trends of the remaining battery life, leading to considerable predictive errors during certain stages of battery degradation. While the BiGRU-Attention model shows improvements upon incorporating the attention mechanism, it remains less effective than the BiGRU-MSTA, especially with limited training data and during pivotal decay phases, where the discrepancies are more pronounced.
Table 2 presents the evaluation metrics for the B0005 lithium-ion battery dataset, utilizing a 7:3 partition under various predictive models. Examination of the table reveals that the BiGRU-MSTA model significantly outperforms other models across all evaluation metrics. Specifically, the RMSE for the BiGRU-MSTA model is 0.02 ± 0.0019 and the MAE is 0.0132 ± 0.0010, representing reductions of approximately 60% and 59%, respectively, compared to the BiGRU model. Additionally, the R 2 value for the BiGRU-MSTA model is 0.9905 ± 0.00022, approximately 6.1% higher than that of the LSTM model, which has an R 2 value of 0.9345 ± 0.0045. These results suggest that the MSTA module significantly enhances the model’s capability to discern complex patterns and manage both long-term and short-term dependencies during the battery degradation process.
Table 3 presents the results of the evaluation indicators for the predicted performance of the B0018 lithium-ion battery, split in a 3:7 ratio. Despite the limited number of training samples, the BiGRU-MSTA model demonstrates substantial advantages. It achieved an RMSE of 0.0322 ± 0.0019 and a MAE of 0.0228 ± 0.0011, which are approximately 81% and 84% lower than those of the CNN-LSTM model, respectively, with an RMSE of 0.1752 ± 0.0105 and MAE of 0.1449 ± 0.0085. Moreover, when compared with the BiGRU-Attention model, the BiGRU-MSTA model shows notable improvements: the RMSE decreased by approximately 78%, and the MAE by about 82%. These results underscore that incorporating the MSTA module with BiGRU significantly enhances both the prediction accuracy and the stability of the model under conditions of scarce data. The relatively small standard deviations in the BiGRU-MSTA model indicate that its performance is not only accurate but also highly stable across different trials, further validating its reliability.
As illustrated in Figure 8, the three bar charts clearly demonstrate that the BiGRU-MSTA model significantly outperforms other models in terms of RMSE, MAE, and R 2 values, highlighting its comprehensive advantages across various evaluation metrics. In comparison with models such as CNN-LSTM and BiGRU-Attention, the BiGRU-MSTA model excels, showing substantial reductions in error and improvements in prediction accuracy. This further corroborates the superior performance and effectiveness of the model proposed in this study, as well as the beneficial impact of the MSTA module on the model’s performance.

4. Results and Discussion: CALCE Dataset

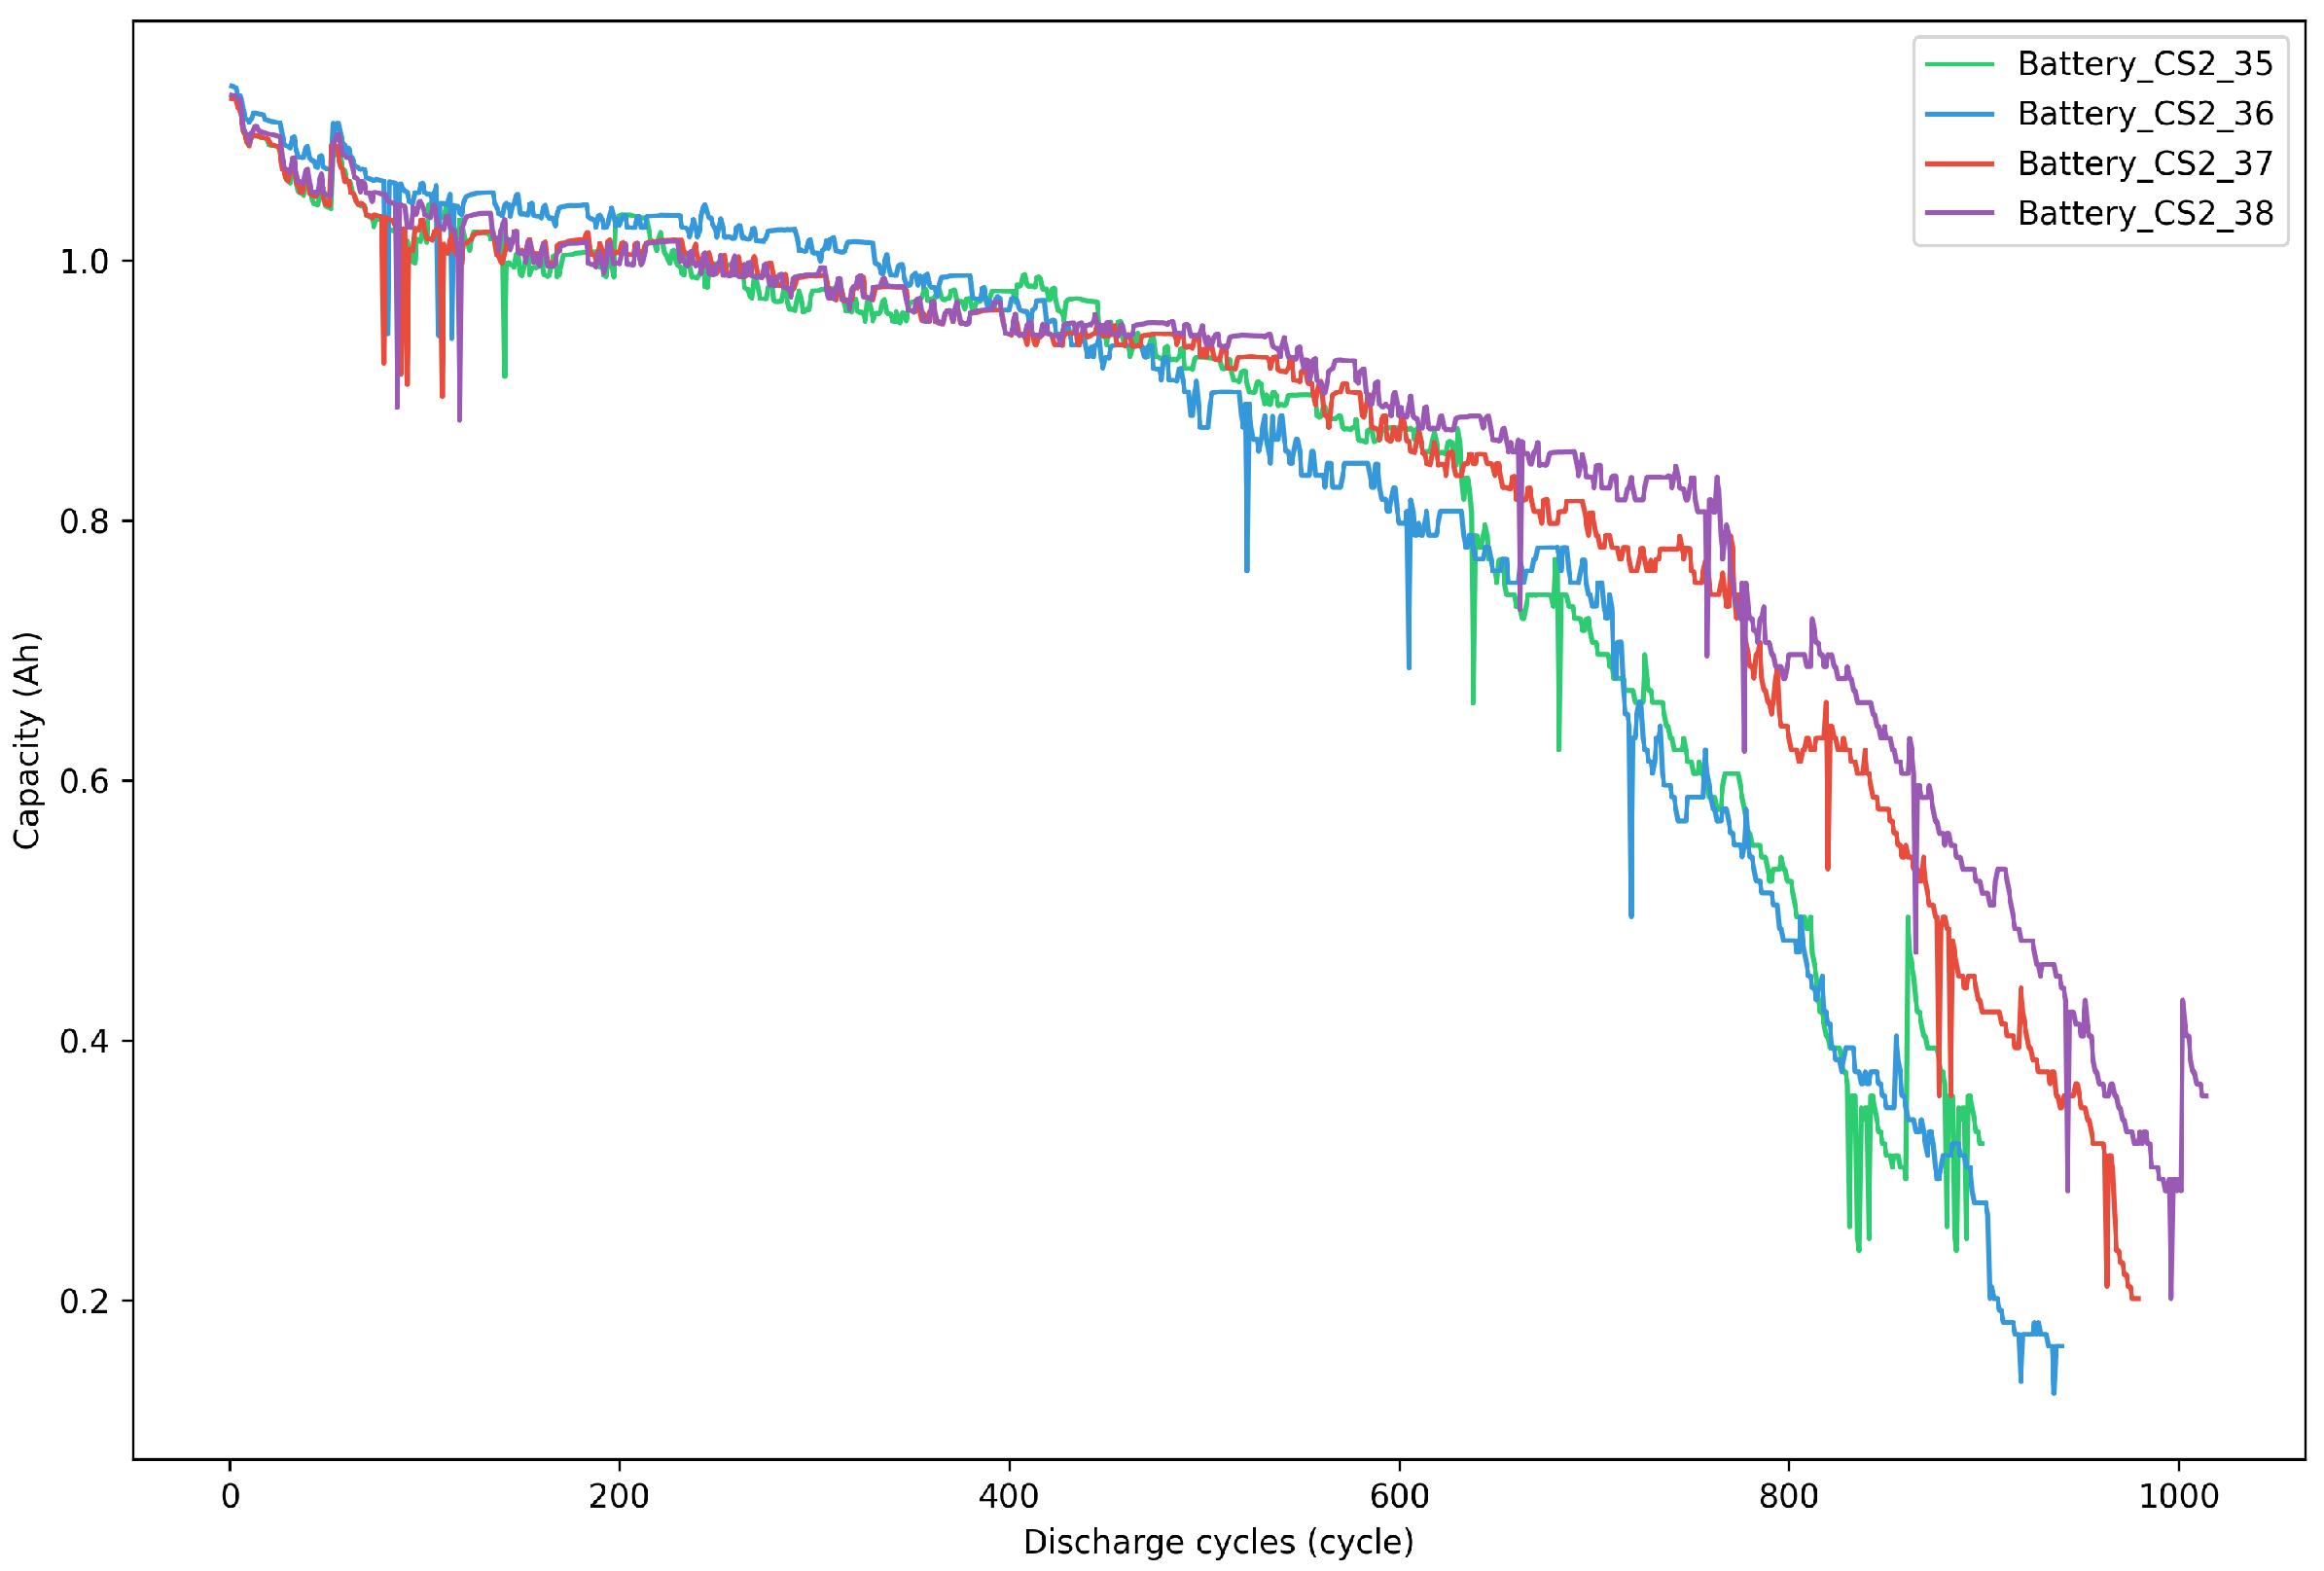
4.1. Dataset Introduction

This experimental section is grounded in the lithium–battery charge–discharge cycle life experimental data from the Center for Advanced Life Cycle Engineering (CALCE) at the University of Maryland. The experimental team at the University of Maryland categorized the experimental data according to time and stored them in a series of Excel files. For the CS2 battery, the working temperature was set at a constant value within the range of 20–25 °C. The experimental process of the CS2 battery can be divided into a charging phase and a discharging phase. During the charging phase, it can be considered as a constant-current charging period. The current was set at 0.55 A, during which the battery voltage increased continuously. When the measured battery voltage reached the cut-off voltage of 4.2 V, the charging mode shifted. The constant-current charging mode transitioned to a constant-voltage charging mode, and the battery voltage remained at 4.2 V. Meanwhile, the current gradually decreased. When the current dropped below 0.5 A, the battery ceased charging.
In the discharging phase, the discharging current was set at 0.55 A. When the measured battery voltage continuously declined to 2.7 V, the battery stopped discharging, marking the end of this cycle experiment.
In this research, four sets of data from the CS2 model battery with a current of 1.1 A were selected, namely CS-35, CS-36, CS-37, and CS-38. The battery data files contain numerous battery parameters, including time points, testing times, cycle counts, currents, voltages, charging capacities, discharging capacities, and internal resistances. The variable employed in this research section is the discharging capacity. The curves of battery capacity versus cycle number for the four batteries in the CALCE dataset are shown in Figure 9.

4.2. MSTA of Different Quantity Scales

In this section, we selected the first 50% of the data from four batteries as the training set and the remaining 50% as the test set. The sliding window size was set to 20. Similarly, each experiment was conducted ten times. We then evaluated the BiGRU-MSTA model with scale numbers of 2, 4, and 8, and the results are shown in Figure 10.
Figure 10 visually shows the capacity prediction curves of the four batteries on the test set. It can be seen that the true capacity decays as the number of cycles increases. Comparing the prediction curves with num_scales of 2, 4, and 8, it is obvious that when num_scales = 8, the prediction curve tracks the true capacity decay trajectory more closely on the test set, especially in the later stage when the capacity decay is faster. In contrast, the predicted curves for num_scales = 2 and num_scales = 4 show larger deviations from the true values, with num_scales = 4 predicting worse than num_scales = 2.
Table 4 quantifies the prediction accuracy at different numbers of scales by RMSE. For all four cells, the model has the lowest RMSE value and standard deviation when num_scales = 8, which is significantly lower than the cases num_scales = 2 and num_scales = 4. For example, for the CS-35 cell, the RMSE of num_scales = 8 is 0.0214, which is much lower than 0.0420 for num_scales = 2 and 0.0656 for num_scales = 4. Similarly, for the other three cells, the RMSE of num_scales = 8 is also the lowest. It is worth noting that the RMSE of num_scales = 4 is the highest among all batteries, indicating that the prediction error of the model is the largest under this setting.
Synthesizing the analysis of the above figures and tables, it can be concluded that under the given experimental settings, increasing the number of scales of Mstas in the BiGRU-MSTA model can effectively improve the accuracy of battery capacity prediction. In particular, when the number of scales is increased to 8, the model can better capture the battery capacity attenuation characteristics of different time scales, so as to achieve lower prediction error and a prediction curve closer to the true capacity on the test set, showing the best prediction performance. This indicates that choosing an appropriate number of scales is crucial to exploit the advantages of the MSTA mechanism.

4.3. Compare with Advanced Models

To comprehensively evaluate the performance of the proposed BiGRU-MSTA model, comparative experiments were conducted with state-of-the-art models in the field of lithium-ion battery capacity degradation prediction in recent years. The comparison models included the classical Transformer [43] model and the LSTM–Transformer [44] model, which integrates LSTM and Transformer. The experiments were performed on the CALCE dataset, using four batteries: CS-35, CS-36, CS-37, and CS-38. The experimental setup is consistent with our model evaluation, using 50% of the data as the training set and the remaining data for testing. The comparison results are depicted in Figure 11.
Table 5 presents the comparison of performance metrics for the BiGRU-MSTA, Transformer, and LSTM–Transformer models when predicting the capacity degradation of the four batteries on the CALCE dataset, including Root Mean Square Error (RMSE), Mean Absolute Percentage Error (MAPE), and the Coefficient of Determination (R2). The analysis results indicate that the BiGRU-MSTA model achieved the best performance across all tested batteries. Specifically, the BiGRU-MSTA model showed significantly lower RMSE and MAPE values, which are metrics measuring prediction error, compared to the Transformer and LSTM–Transformer models, indicating that its prediction results are closer to the true values and have smaller errors. Simultaneously, the BiGRU-MSTA model achieved the highest R2 value, significantly higher than the other two models, suggesting a better fit to the true capacity degradation trend and stronger model explainability. For instance, on the CS-35 battery, the RMSE, MAPE, and R2 for BiGRU-MSTA were 0.0277, 0.0325, and 0.9821, respectively, all superior to Transformer (0.0386, 0.0527, 0.9651) and LSTM–Transformer (0.0294, 0.0402, 0.9797). For the other batteries (CS-36, CS-37, CS-38), the BiGRU-MSTA model also demonstrated similar superiority, consistently maintaining the lowest RMSE and MAPE and the highest R2. These quantitative results align with the visual observation in Figure 11, where the BiGRU-MSTA prediction curve adheres more closely to the true capacity curve, strongly demonstrating the superiority and effectiveness of the BiGRU-MSTA model in the task of lithium-ion battery capacity degradation prediction.

5. Conclusions

To enhance the prediction accuracy of the remaining service life of lithium-ion batteries, this study proposes a novel BiGRU-MSTA model that integrates the BiGRU with the MSTA mechanism. This model adeptly addresses the intrinsic challenges associated with predicting battery degradation by effectively capturing both the short-term fluctuations and long-term trends in battery performance. The MSTA mechanism significantly boosts the model’s capability to extract multi-scale temporal features, thereby better adapting to complex degradation patterns.
Extensive experiments conducted on the NASA battery dataset reveal that our model consistently surpasses existing methods across various evaluation metrics, including traditional BiGRU, LSTM, CNN-LSTM, and BiGRU-Attention models. The results emphasize the superior performance and robustness of the BiGRU-MSTA model, particularly its effectiveness across different training sample sizes and various types of battery data. Experiments on the CALCE dataset demonstrate that as the number of scales in the MSTA mechanism increases, the prediction performance of the model significantly improves. Notably, when 8 scales are utilized, the model achieves its optimal performance. In addition to comparing different scale configurations, we also benchmark the proposed model against state-of-the-art models such as Transformer and LSTM–Transformer. The experimental results further validate the superior capability of the BiGRU-MSTA model in predicting lithium battery capacity degradation data based on charge–discharge cycles, exhibiting higher prediction accuracy and stability. The enhancement in battery life prediction accuracy not only advances the field of battery life prediction but also highlights its practical benefits in battery management systems, including extended battery life, reduced maintenance costs, and improved operational safety. These advantages are crucial for achieving sustainable and efficient energy storage solutions.
Although the proposed model performs well on high-end hardware, several limitations should be acknowledged. First, the current study focuses exclusively on univariate capacity degradation sequences as the primary degradation indicator for lithium-ion batteries. The MSTA mechanism has not yet been extended to multi-channel inputs or other critical degradation indicators such as impedance curves, voltage profiles, or temperature variations. Second, real-time deployment in embedded systems or edge computing environments may face computational resource limitations. Future research will address these limitations through multiple directions. We plan to explore the generalization capability of the MSTA mechanism to multi-dimensional input scenarios, incorporating simultaneous analysis of capacity, voltage, internal resistance, and temperature data to develop comprehensive degradation prediction models. Furthermore, computational efficiency optimization will be prioritized for efficient deployment on low-power devices, including model pruning, quantization, and exploring more lightweight model architectures to improve computational efficiency while maintaining prediction accuracy.

Author Contributions

Conceptualization, L.W. and S.W.; methodology, L.W.; software, S.W.; validation, L.W. and S.W.; formal analysis, L.W.; investigation, L.W. and S.W.; resources, L.W. and S.W.; data curation, L.W. and S.W.; writing—original draft preparation, L.W.; writing—review and editing, S.W.; visualization, L.W. and S.W.; supervision, L.W.; project administration, L.W.; funding acquisition, L.W. All authors have read and agreed to the published version of the manuscript.

Funding

This research was funded by the Natural Science Foundation of Liaoning Province OF FUNDER grant number 2022-KF-14-04.

Data Availability Statement

The data presented in this study are openly available in NASA Intelligent Systems Division at https://www.nasa.gov/intelligent-systems-division (accessed on 7 May 2025).

Conflicts of Interest

The authors declare no conflicts of interest.

References

  1. Sun, B.; He, X.; Zhang, W.; Ruan, H.; Su, X.; Jiang, J. Study of parameters identification method of Li-ion battery model for EV power profile based on transient characteristics data. IEEE Trans. Intell. Transp. Syst. 2020, 22, 661–672. [Google Scholar] [CrossRef]
  2. Li, S.; Fang, H.; Shi, B. Remaining useful life estimation of lithium-ion battery based on interacting multiple model particle filter and support vector regression. Reliab. Eng. Syst. Saf. 2021, 210, 107542. [Google Scholar] [CrossRef]
  3. Sadabadi, K.K.; Jin, X.; Rizzoni, G. Prediction of remaining useful life for a composite electrode lithium ion battery cell using an electrochemical model to estimate the state of health. J. Power Sources 2021, 481, 228861. [Google Scholar] [CrossRef]
  4. Gao, H.; Cui, L.; Dong, Q. Reliability modeling for a two-phase degradation system with a change point based on a Wiener process. Reliab. Eng. Syst. Saf. 2020, 193, 106601. [Google Scholar] [CrossRef]
  5. Liu, K.; Shang, Y.; Ouyang, Q.; Widanage, W.D. A data-driven approach with uncertainty quantification for predicting future capacities and remaining useful life of lithium-ion battery. IEEE Trans. Ind. Electron. 2020, 68, 3170–3180. [Google Scholar] [CrossRef]
  6. Li, D.; Yang, L. Remaining useful life prediction of lithium battery based on sequential CNN–LSTM method. J. Electrochem. Energy Convers. Storage 2021, 18, 041005. [Google Scholar] [CrossRef]
  7. Hu, X.; Yang, X.; Feng, F.; Liu, K.; Lin, X. A particle filter and long short-term memory fusion technique for lithium-ion battery remaining useful life prediction. J. Dyn. Syst. Meas. Control 2021, 143, 061001. [Google Scholar] [CrossRef]
  8. Šeruga, D.; Gosar, A.; Sweeney, C.A.; Jaguemont, J.; Van Mierlo, J.; Nagode, M. Continuous modelling of cyclic ageing for lithium-ion batteries. Energy 2021, 215, 119079. [Google Scholar] [CrossRef]
  9. Yang, R.; Xiong, R.; Ma, S.; Lin, X. Characterization of external short circuit faults in electric vehicle Li-ion battery packs and prediction using artificial neural networks. Appl. Energy 2020, 260, 114253. [Google Scholar] [CrossRef]
  10. Wang, F.K.; Huang, C.Y.; Mamo, T. Ensemble model based on stacked long short-term memory model for cycle life prediction of lithium–ion batteries. Appl. Sci. 2020, 10, 3549. [Google Scholar] [CrossRef]
  11. Wei, Y.; Wu, D. Prediction of state of health and remaining useful life of lithium-ion battery using graph convolutional network with dual attention mechanisms. Reliab. Eng. Syst. Saf. 2023, 230, 108947. [Google Scholar] [CrossRef]
  12. Qian, C.; He, N.; He, L.; Li, H.; Cheng, F. State of health estimation of lithium-ion battery using energy accumulation-based feature extraction and improved relevance vector regression. J. Energy Storage 2023, 68, 107754. [Google Scholar] [CrossRef]
  13. Li, W.; Sengupta, N.; Dechent, P.; Howey, D.; Annaswamy, A.; Sauer, D.U. Online capacity estimation of lithium-ion batteries with deep long short-term memory networks. J. Power Sources 2021, 482, 228863. [Google Scholar] [CrossRef]
  14. Chen, L.; Wang, H.; Liu, B.; Wang, Y.; Ding, Y.; Pan, H. Battery state-of-health estimation based on a metabolic extreme learning machine combining degradation state model and error compensation. Energy 2021, 215, 119078. [Google Scholar] [CrossRef]
  15. Zhang, K.; Peng, Z.; Canfei, S.; Youren, W.; Zewang, C. Remaining useful life prediction of aircraft lithium-ion batteries based on F-distribution particle filter and kernel smoothing algorithm. Chin. J. Aeronaut. 2020, 33, 1517–1531. [Google Scholar] [CrossRef]
  16. Ma, J.; Xu, S.; Shang, P.; Qin, W.; Cheng, Y.; Lu, C.; Su, Y.; Chong, J.; Jin, H.; Lin, Y.; et al. Cycle life test optimization for different Li-ion power battery formulations using a hybrid remaining-useful-life prediction method. Appl. Energy 2020, 262, 114490. [Google Scholar] [CrossRef]
  17. Han, T.; Wang, Z.; Meng, H. End-to-end capacity estimation of Lithium-ion batteries with an enhanced long short-term memory network considering domain adaptation. J. Power Sources 2022, 520, 230823. [Google Scholar] [CrossRef]
  18. Ma, Y.; Shan, C.; Gao, J.; Chen, H. A novel method for state of health estimation of lithium-ion batteries based on improved LSTM and health indicators extraction. Energy 2022, 251, 123973. [Google Scholar] [CrossRef]
  19. Hu, X.; Che, Y.; Lin, X.; Deng, Z. Health prognosis for electric vehicle battery packs: A data-driven approach. IEEE/ASME Trans. Mechatronics 2020, 25, 2622–2632. [Google Scholar] [CrossRef]
  20. Yang, Y.; Zhao, L.; Yu, Q.; Liu, S.; Zhou, G.; Shen, W. State of charge estimation for lithium-ion batteries based on cross-domain transfer learning with feedback mechanism. J. Energy Storage 2023, 70, 108037. [Google Scholar] [CrossRef]
  21. Li, X.; Yuan, C.; Wang, Z. Multi-time-scale framework for prognostic health condition of lithium battery using modified Gaussian process regression and nonlinear regression. J. Power Sources 2020, 467, 228358. [Google Scholar] [CrossRef]
  22. Peng, S.; Sun, Y.; Liu, D.; Yu, Q.; Kan, J.; Pecht, M. State of health estimation of lithium-ion batteries based on multi-health features extraction and improved long short-term memory neural network. Energy 2023, 282, 128956. [Google Scholar] [CrossRef]
  23. Han, S.; Tang, Y.; Rahimian, S.K. A numerically efficient method of solving the full-order pseudo-2-dimensional (P2D) Li-ion cell model. J. Power Sources 2021, 490, 229571. [Google Scholar] [CrossRef]
  24. Wei, Z.; Zhao, J.; Ji, D.; Tseng, K.J. A multi-timescale estimator for battery state of charge and capacity dual estimation based on an online identified model. Appl. Energy 2017, 204, 1264–1274. [Google Scholar] [CrossRef]
  25. Bizeray, A.M.; Kim, J.H.; Duncan, S.R.; Howey, D.A. Identifiability and parameter estimation of the single particle lithium-ion battery model. IEEE Trans. Control Syst. Technol. 2018, 27, 1862–1877. [Google Scholar] [CrossRef]
  26. Xia, B.; Lao, Z.; Zhang, R.; Tian, Y.; Chen, G.; Sun, Z.; Wang, W.; Sun, W.; Lai, Y.; Wang, M.; et al. Online parameter identification and state of charge estimation of lithium-ion batteries based on forgetting factor recursive least squares and nonlinear Kalman filter. Energies 2017, 11, 3. [Google Scholar] [CrossRef]
  27. Sun, R.; Chen, J.; Li, B.; Piao, C. State of health estimation for Lithium-ion batteries based on novel feature extraction and BiGRU-Attention model. Energy 2025, 319, 134756. [Google Scholar] [CrossRef]
  28. Xue, J.; Wei, L.; Sheng, F.; Gao, Y.; Zhang, J. Survival Analysis with Machine Learning for Predicting Li-ion Battery Remaining Useful Life. arXiv 2025, arXiv:2503.13558. [Google Scholar]
  29. Tarar, M.O.; Naqvi, I.H.; Khalid, Z.; Pecht, M. Accurate prediction of remaining useful life for lithium-ion battery using deep neural networks with memory features. Front. Energy Res. 2023, 11, 1059701. [Google Scholar] [CrossRef]
  30. Liu, S.; Chen, Z.; Yuan, L.; Xu, Z.; Jin, L.; Zhang, C. State of health estimation of lithium-ion batteries based on multi-feature extraction and temporal convolutional network. J. Energy Storage 2024, 75, 109658. [Google Scholar] [CrossRef]
  31. Zhang, Z.; Zhang, W.; Yang, K.; Zhang, S. Remaining useful life prediction of lithium-ion batteries based on attention mechanism and bidirectional long short-term memory network. Measurement 2022, 204, 112093. [Google Scholar] [CrossRef]
  32. Suh, S.; Mittal, D.A.; Bello, H.; Zhou, B.; Jha, M.S.; Lukowicz, P. Remaining useful life prediction of Lithium-ion batteries using spatio-temporal multimodal attention networks. Heliyon 2024, 10, e36236. [Google Scholar] [CrossRef]
  33. Chen, D.; Zhou, X. AttMoE: Attention with Mixture of Experts for remaining useful life prediction of lithium-ion batteries. J. Energy Storage 2024, 84, 110780. [Google Scholar] [CrossRef]
  34. Lee, J.; Heo, S.; Lee, J.H. Extracting key temporal and cyclic features from VIT data to predict lithium-ion battery knee points using attention mechanisms. Comput. Chem. Eng. 2025, 193, 108931. [Google Scholar] [CrossRef]
  35. Tran, K.; Huynh, B.; Le, T.; Pham, L.; Nguyen, V.R. HybridoNet-Adapt: A Domain-Adapted Framework for Accurate Lithium-Ion Battery RUL Prediction. arXiv 2025, arXiv:2503.21392. [Google Scholar]
  36. Gao, M.; Fei, Z.; Guo, D.; Xu, Z.; Wang, M. A multi-stage time series processing framework based on attention mechanism for early life prediction of lithium-ion batteries. J. Energy Storage 2024, 84, 110771. [Google Scholar] [CrossRef]
  37. Huang, J.; He, T.; Zhu, W.; Liao, Y.; Zeng, J.; Xu, Q.; Niu, Y. A lithium-ion battery SOH estimation method based on temporal pattern attention mechanism and CNN-LSTM model. Comput. Electr. Eng. 2025, 122, 109930. [Google Scholar] [CrossRef]
  38. Cao, L.; Zhang, H.; Meng, Z.; Wang, X. A parallel GRU with dual-stage attention mechanism model integrating uncertainty quantification for probabilistic RUL prediction of wind turbine bearings. Reliab. Eng. Syst. Saf. 2023, 235, 109197. [Google Scholar] [CrossRef]
  39. Zhang, L.; Wang, B.; Yuan, X.; Liang, P. Remaining useful life prediction via improved CNN, GRU and residual attention mechanism with soft thresholding. IEEE Sens. J. 2022, 22, 15178–15190. [Google Scholar] [CrossRef]
  40. Zhou, J.; Qin, Y.; Luo, J.; Zhu, T. Remaining useful life prediction by distribution contact ratio health indicator and consolidated memory GRU. IEEE Trans. Ind. Inform. 2022, 19, 8472–8483. [Google Scholar] [CrossRef]
  41. Wu, Y.; Cao, P.; Xu, M.; Zhang, Y.; Lian, X.; Yu, C. Adaptive GCN and Bi-GRU-Based Dual Branch for Motor Imagery EEG Decoding. Sensors 2025, 25, 1147. [Google Scholar] [CrossRef] [PubMed]
  42. Jia, C.; Tian, Y.; Shi, Y.; Jia, J.; Wen, J.; Zeng, J. State of health prediction of lithium-ion batteries based on bidirectional gated recurrent unit and transformer. Energy 2023, 285, 129401. [Google Scholar] [CrossRef]
  43. Chen, D.; Hong, W.; Zhou, X. Transformer network for remaining useful life prediction of lithium-ion batteries. IEEE Access 2022, 10, 19621–19628. [Google Scholar] [CrossRef]
  44. Bao, G.; Liu, X.; Zou, B.; Yang, K.; Zhao, J.; Zhang, L.; Chen, M.; Qiao, Y.; Wang, W.; Tan, R.; et al. Collaborative framework of Transformer and LSTM for enhanced state-of-charge estimation in lithium-ion batteries. Energy 2025, 322, 135548. [Google Scholar] [CrossRef]
Figure 1. The architecture of the GRU.
Batteries 11 00223 g001
Figure 2. The architecture of the BiGRU.
Batteries 11 00223 g002
Figure 3. The architecture of the MSTA.
Batteries 11 00223 g003
Figure 4. Hierarchical network structure of BiGRU-MSTA model.
Batteries 11 00223 g004
Figure 5. NASA lithium-ion battery capacity decay data curve.
Batteries 11 00223 g005
Figure 6. Overall workflow of the proposed lithium-ion battery life prediction model.
Batteries 11 00223 g006
Figure 7. The division and comparison of different datasets on different batteries for different models: (a) The training and test sets of lithium-ion battery B0005 are divided in a 3:7 ratio. (b) The training and test sets of lithium-ion battery B0005 are divided in a 5:5 ratio. (c) The training and test sets of lithium-ion battery B0005 are divided in a 7:3 ratio. (d) The training and test sets of lithium-ion battery B0006 are divided in a 3:7 ratio. (e) The training and test sets of lithium-ion battery B0006 are divided in a 5:5 ratio. (f) The training and test sets of lithium-ion battery B0006 are divided in a 3:7 ratio. (g) The training and test sets of lithium-ion battery B0007 are divided in a 3:7 ratio. (h) The training and test sets of lithium-ion battery B0007 are divided in a 5:5 ratio. (i) The training and test sets of lithium-ion battery B0007 are divided in a 7:3 ratio. (j) The training and test sets of lithium-ion battery B0018 are divided in a 3:7 ratio. (k) The training and test sets of lithium-ion battery B0018 are divided in a 5:5 ratio. (l) The training and test sets of lithium-ion battery B0018 are divided in a 7:3 ratio.
Batteries 11 00223 g007
Figure 8. Comparison of the performance of different models on various battery types using three metrics: (a) RMSE, (b) MAE, and (c) R-squared. Each metric is calculated under the condition that the division ratio of four batteries between the training set and the test set is 5:5, specifically for batteries B0005, B0006, B0007, and B0018. The bars in the figure represent the performance of different models for each battery type.
Batteries 11 00223 g008
Figure 9. CALCE lithium-ion battery capacity decay data curve.
Batteries 11 00223 g009
Figure 10. Different lithium batteries were evaluated with the number of scales 2, 4 and 8 under the 50% training set: (a) Battery number CS-35. (b) Battery number CS-36. (c) Battery number CS-37. (d) Battery number CS-38.
Batteries 11 00223 g010
Figure 11. Different lithium batteries are evaluated with BiGRU-MSTA, Transformer, and LSTM–Transformer with 50% of the training set: (a) Battery number CS-35. (b) Battery number CS-36. (c) Battery number CS-37. (d) Battery number CS-38.
Batteries 11 00223 g011
Table 1. Detailed model architecture and training parameters.
CategoryParameters
Model Architecture
  • Type: Bidirectional GRU with Multi-Scale Temporal Attention.
  • GRU layers: 3 (hidden sizes: 16, 32, 64).
  • Attention Mechanism: Multi-scale with 8 temporal scales.
  • Temperature parameter: 1.0.
  • Input dimension: 1.
  • Output dimension: 1.
Training Configuration
  • Random seed: 42.
  • Loss function: Mean Squared Error (MSE).
  • Optimizer: Adam.
  • Learning rate: 0.0003.
  • Training epochs: 300.
  • Device: CUDA.
Table 2. The 7:3 division of evaluation indicators for B0005 lithium-ion batteries with slight data variation and uncertainty measures.
ModelMSERMSEMAEMAPE R 2
LSTM0.0025 ± 0.00020.05 ± 0.00310.0309 ± 0.00210.02210 ± 0.00110.9345 ± 0.0045
BiGRU0.0024 ± 0.00010.0489 ± 0.00320.0322 ± 0.00230.02115 ± 0.00120.9310 ± 0.0047
CNN-LSTM0.0058 ± 0.00050.0762 ± 0.00430.0541 ± 0.00350.03523 ± 0.00260.8320 ± 0.0093
BiGRU-Attention0.0013 ± 0.00020.0361 ± 0.00290.0152 ± 0.00150.00919 ± 0.00080.9795 ± 0.0028
BiGRU-MSTA 0.0004 ± 0.00003 0.02 ± 0.0019 0.0132 ± 0.0010 0.00875 ± 0.0005 0.9905 ± 0.00022
Table 3. The 3:7 division of evaluation indicators for B0018 lithium-ion batteries with uncertainty measures.
ModelMSERMSEMAEMAPE R 2
LSTM0.0216 ± 0.00210.1471 ± 0.00800.1224 ± 0.00620.08329 ± 0.00550.4033 ± 0.0156
BiGRU0.0232 ± 0.00230.1526 ± 0.00850.1269 ± 0.00740.08672 ± 0.00460.3551 ± 0.0174
CNN-LSTM0.0311 ± 0.00320.1752 ± 0.01050.1449 ± 0.00850.09923 ± 0.00670.1548 ± 0.0213
BiGRU-Attention0.0229 ± 0.00240.1517 ± 0.00820.1247 ± 0.00700.08609 ± 0.00430.3634 ± 0.0165
BiGRU-MSTA 0.0010 ± 0.0004 0.0322 ± 0.0019 0.0228 ± 0.0011 0.01516 ± 0.0010 0.9712 ± 0.0005
Table 4. RMSE values for different batteries with 50% training set.
Battery Numbernum_scales = 2num_scales = 4num_scales = 8
CS-350.0420 ± 0.00100.0656 ± 0.0020 0.0214 ± 0.0008
CS-360.0548 ± 0.00120.0868 ± 0.0027 0.0199 ± 0.0010
CS-370.0411 ± 0.00090.0650 ± 0.0009 0.0173 ± 0.0007
CS-380.0397 ± 0.00110.0619 ± 0.0022 0.0197 ± 0.0003
Table 5. Performance comparison of different models.
Battery NumberModelRMSEMAPE R 2
CS-35Transformer0.0386 ± 0.00230.0527 ± 0.00310.9651 ± 0.0015
LSTM–Transformer0.0294 ± 0.00180.0402 ± 0.00250.9797 ± 0.0012
BiGRU-MSTA 0.0277 ± 0.0016 0.0325 ± 0.0019 0.9821 ± 0.0011
CS-36Transformer0.0533 ± 0.00290.1184 ± 0.00420.9472 ± 0.0018
LSTM–Transformer0.0333 ± 0.00210.0684 ± 0.00330.9794 ± 0.0013
BiGRU-MSTA 0.0246 ± 0.0015 0.0454 ± 0.0027 0.9888 ± 0.0009
CS-37Transformer0.0388 ± 0.00240.0577 ± 0.00350.9628 ± 0.0016
LSTM–Transformer0.0269 ± 0.00170.0402 ± 0.00260.9821 ± 0.0012
BiGRU-MSTA 0.0204 ± 0.0013 0.0300 ± 0.0021 0.9897 ± 0.0008
CS-38Transformer0.0370 ± 0.00220.0505 ± 0.00220.9657 ± 0.0017
LSTM–Transformer0.0275 ± 0.00190.0351 ± 0.00240.9809 ± 0.0014
BiGRU-MSTA 0.0243 ± 0.0014 0.0281 ± 0.0002 0.9852 ± 0.0010
Disclaimer/Publisher’s Note: The statements, opinions and data contained in all publications are solely those of the individual author(s) and contributor(s) and not of MDPI and/or the editor(s). MDPI and/or the editor(s) disclaim responsibility for any injury to people or property resulting from any ideas, methods, instructions or products referred to in the content.

