Article

Characterization of Industrial Black Mass from End-of-Life LiFePO4-Graphite Batteries

by
Nanna Bjerre-Christensen
1,†,
Caroline Birksø Eriksen
1,†,
Kristian Oluf Sylvester-Hvid
2 and
Dorthe Bomholdt Ravnsbæk
1,*
1
Center for Sustainable Energy Materials, Department of Chemistry, Aarhus University, Langelandsgade 140, 8000 Aarhus, Denmark
2
Functional Materials, Danish Technological Institute, Gregersensvej 1, 2630 Taastrup, Denmark
*
Author to whom correspondence should be addressed.
These authors contributed equally to this work.
Batteries 2025, 11(6), 210; https://doi.org/10.3390/batteries11060210
Submission received: 4 April 2025 / Revised: 18 May 2025 / Accepted: 19 May 2025 / Published: 26 May 2025

Abstract

:
The use of Li-ion batteries is drastically increasing, especially due to the growing sales of electric vehicles. Simultaneously, there is a shift towards exchanging the traditional Co- and Ni-rich electrode materials with more sustainable alternatives such as LiFePO4. This transition challenges conventional recycling practices, which typically rely on shredding batteries into a substance known as black mass, which is subsequently processed via hydrometallurgical or pyrometallurgical methods to extract valuable elements. These routes may not be economically viable for future sustainable chemistries with lower contents of high-value metal. Hence, new methods for processing the black mass, allowing, e.g., for physical separation and direct recycling, are direly needed. Such developments require that the black mass is thoroughly understood. In this study, we thoroughly characterize a commercially produced Graphite/LFP black mass sample from real battery waste using a suite of analytical techniques. Our findings reveal detailed chemical, morphological, and structural insights and show that the components in the black mass have different micro-size profiles, which may enable simple size separation. Unfortunately, our analysis also reveals that the employed processing of battery waste into black mass leads to the formation of an unknown Fe-containing compound, which may hamper direct recycling routes.

Graphical Abstract

1. Introduction

Since the discovery and commercialization of rechargeable Li-ion batteries, the demand has increased yearly, and it is predicted to increase annually by 27% in the coming years to reach 4700 GWh in 2030 [1]. The amount of battery waste is expected to increase accordingly, reaching up to 8 million tons by 2040 solely from electric vehicles [2]. Presently, the majority of batteries in use and on the market contain expensive critical and strategic raw materials, such as Co and Ni from Li(Ni,Mn,Co)O2 (NMC) and Li(Ni,Co,Al)O2 (NCA) type electrodes, which have large environmental impact from their primary mining [3,4,5], Hence, there are great incentives to recycle Li-ion batteries, which has not only increased research and development activities but also led to political actions [6,7,8,9,10].
Presently, the most common recycling process involves shredding the end-of-life Li-ion batteries. Part of the battery casing, such as plastics and iron, and the Cu- and Al-current collectors are mechanically separated from the shredded feed based on properties such as density and magnetism. After separation, one is left with a powder, termed black mass, containing the active materials from the positive and negative electrodes, battery additives, and residues of the Al and Cu current collector foils [11,12,13,14]. From the black mass, several steps, typically involving hydro- or pyrometallurgy, are needed to extract the valuable materials. This recycling process is designed mainly towards extracting high-value elements such as Co, Ni and Cu [12,15,16], which makes the recycling methods economically feasible.
In recent years, the battery market has shifted towards Co- and Ni-free/-poor low-cost chemistries, such as LiFePO4 (LFP) electrodes, mainly due to the lower price, higher sustainability, and geological abundance of these materials. Forecasts project that by 2030, LFP batteries will hold a market share of >30% of the ~100 billion USD Li-ion battery market [17]. This shift towards sustainable battery chemistries based on low-cost, abundant elements means that the present recycling paradigm becomes economically unfeasible, and new schemes need to be developed.
Several recycling schemes have been proposed for LFP-based batteries, with hydrometallurgy or acidic leaching being the most common [18,19,20,21]. However, other ideas have also been suggested, such as selective retrieval of lithium [22,23,24], and direct regeneration [25,26,27,28]. The latter entails cleaning and potentially repairing the olivine LixFePO4 structure and supplying new Li-ions to restore the LFP [29]. Ideally, this would entail controlled dismantling of the battery and extraction of the individual battery components to avoid cross-contamination. Unfortunately, controlled battery dismantling in the recycling process is still too expensive, time-consuming, and potentially hazardous to be viable on an industrial scale [13]. Hence, shredding end-of-life batteries into black mass may, for years to come, be the most viable waste treatment, and new economically meaningful procedures for utilizing LFP-based black mass are direly needed.
Advancing innovative use of LFP-based black mass requires a comprehensive understanding of the structural and chemical composition of the black mass. Several studies have shown that for NMC/NCA-based battery waste, mechanical shredding followed by sieving enables partial separation of the graphite electrode and the Cu and Al foils, accumulating in the fractions with small and large particle sizes, respectively [30,31,32,33,34]. However, quantitative studies on LFP-based black mass are scarce, and knowledge on morphology, content and separability is lacking. Moreover, previous studies were performed on laboratory-built cells, or “synthetic” black masses prepared from single-electrode scrap [25,26,27,28], which may differ significantly from black mass obtained from large volume treatment of a real battery waste stream.
In this work, we investigate the chemical and morphological nature of LFP–graphite black mass from a commercial recycler using a multifaceted approach that includes spectroscopy, elemental analysis, electron microscopy, and diffraction. By examining fractions separated by grain-size, we establish for the first time a correlation between microstructure and phase composition for a LFP black mass. The obtained insights may not only aid in optimizing recycling processes amid the transition from NMC- and NCA-based to LFP-based chemistries but also guide the development of novel recycling pathways such as direct recycling.

2. Materials and Methods

2.1. Materials

A sample of industrial black mass was received from ACCUREC (Krefeld, Germany) [35]. It was produced via thermal (<600 °C) and mechanical treatment from several identical end-of-life Graphite/LFP battery packs. The black mass will be referred to as BMraw. The BMraw was separated into fractions by manually sieving using a sieve tower (ATECHNIK, Leinburg, Germany) with mesh sizes of 45 μm, 63 μm, 125 μm, 250 μm, 500 μm, 1 mm, 2 mm, and 4 mm. No particles were retrieved by the 2 and 4 mm mesh. The sieved samples will be named BM with the sieve mesh size in subscript, e.g., BM45μm or BM250μm for the samples collected from the 45 μm and 250 μm sieves, respectively.

2.2. Characterization

The BMraw was investigated by X-ray Computed Tomography (XrCT) using a Zeiss Xradia 620 Versa X-ray microscope (Oberkochen, Germany) and analyzed with Dragonfly software version 2022.2 [36]. The sample was filled as-received into a kapton (polyimide, Cole-Parmer, Vernon Hills, IL, USA) tube with an inner diameter of 2 mm. The XrCT was measured using X-rays with energy 60 kV, current of 109 μA, and an exposure time of 3 s for 996 projections/360° with a voxel size of 3.71 × 3.71 × 3.71 μm3.
The sieved fractions were characterized by Powder X-ray Diffraction (PXRD), Scanning Electron Microscopy (SEM) with Energy Dispersive X-ray spectroscopy (EDX), Inductively Coupled Plasma Optical Emission Spectroscopy (ICP-OES), X-ray fluorescence (XRF) spectroscopy and combustion analysis probing the content of C, H, N and S.
PXRD was collected at the P02.1 beamline [37], PETRA III, DESY, Hamburg, Germany using a Perkin Elmer (Shelton, CT, USA) XRD1621 area detector. The PXRDs were obtained with an X-ray wavelength of 0.2073 Å and exposure times of 30 s. The diffractograms were analyzed with Rietveld refinement using the FullProf software (version 2021) [38]. SEM-EDX was measured at the in-house TESCAN CLARA UHR SEM (Brno, Czech Republic) with energy at 15 kV using the Everhart-Thornley detector (Jeol, Sollentuna, Sweden) for analysis mode and the Oxford (Abingdon, UK) Ultim Max 40 mm2 EDS detector with AztecLive Standard Software. ICP-OES was measured using an AMETEK Spectro Arcos (Kleve, Germany) instrument with an acidic matrix consisting of 1% HNO3 in pure water (3 times distilled water). To dissolve the samples for the ICP-OES analysis, approximately 10.5 mg of each fraction was added to 4 mL aqua regia (3:1 HCl:HNO3) and 10 drops of H2O2. The solutions were hereafter kept at 200 °C for 2 days in a 23 mL autoclave. The oxidative environment of the solution completely dissolved the black mass. However, the stainless-steel autoclave was found to show signs of corrosion after this process. XRF spectroscopy was performed on a Rigaku (Tokyo, Japan) NEW CG spectrometer with three measurements per sample. The combustion analysis was performed with an Elementar Vario MACRO cube CHNS-O analyzer (Santa Clara, CA, USA) with sulfanilamide as standard for calibration and four replications per sample. The BM<45μm sample was not analyzed by combustion analysis as the amount of this fraction was too small.

3. Results

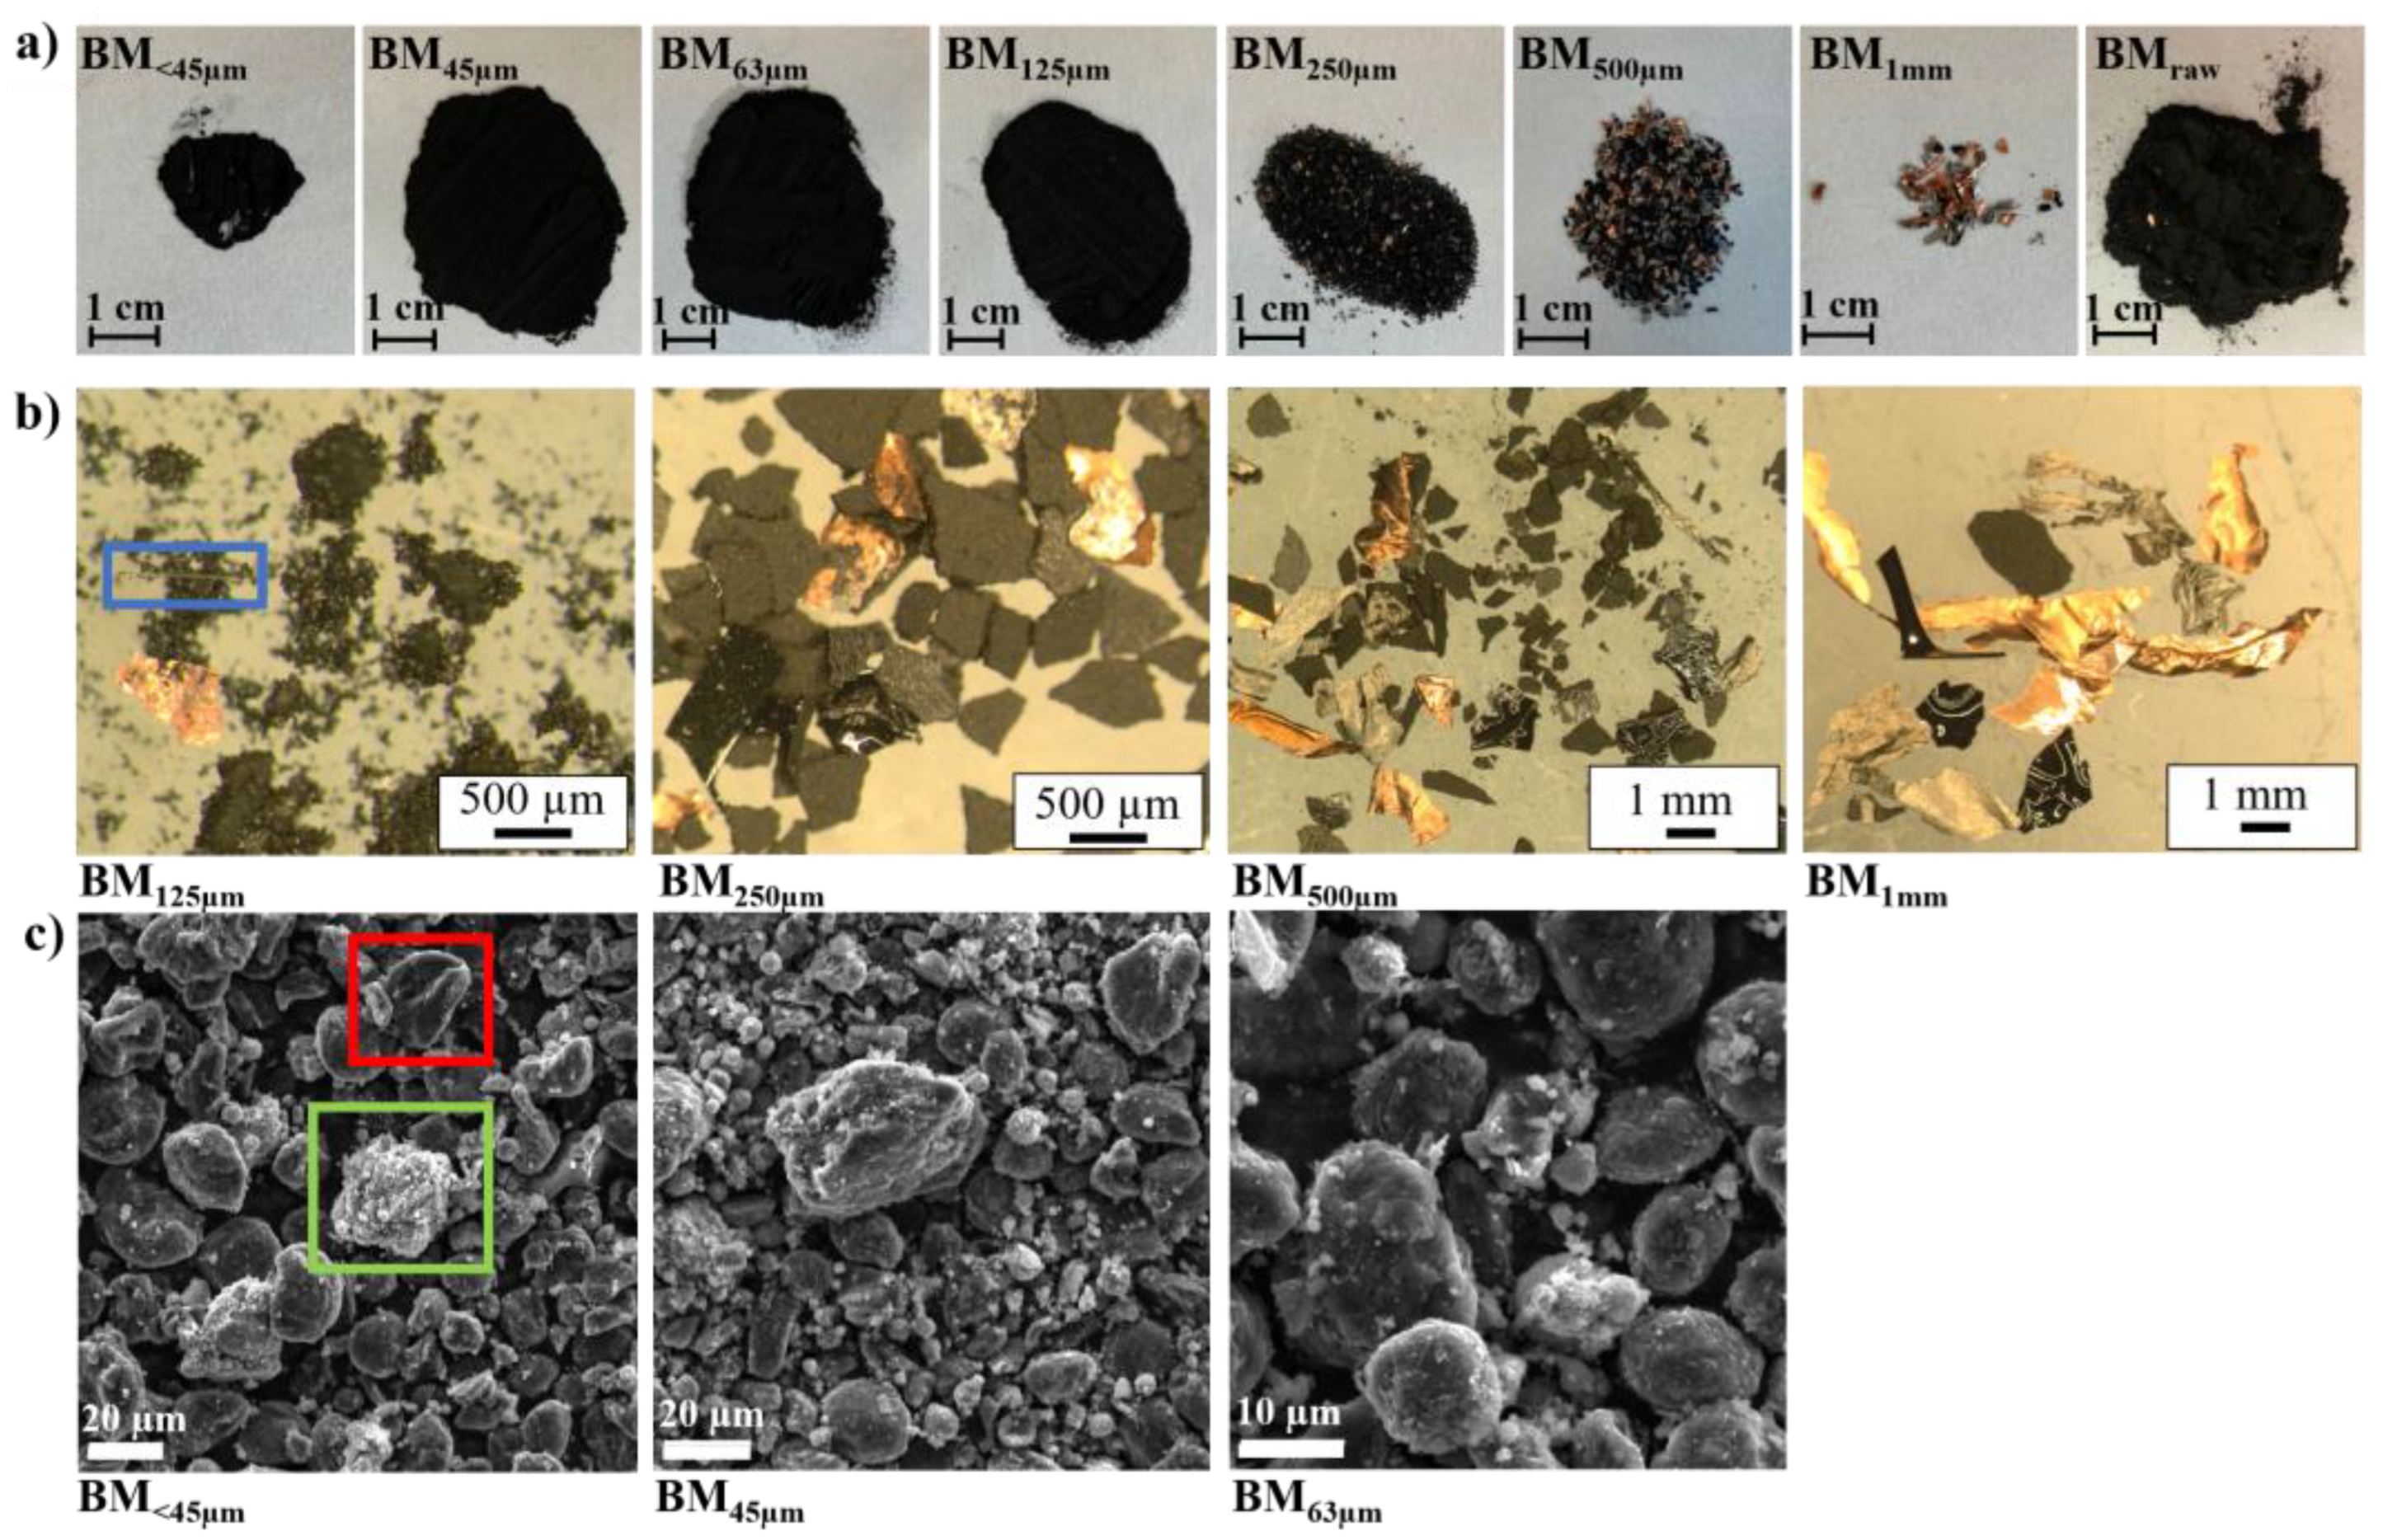
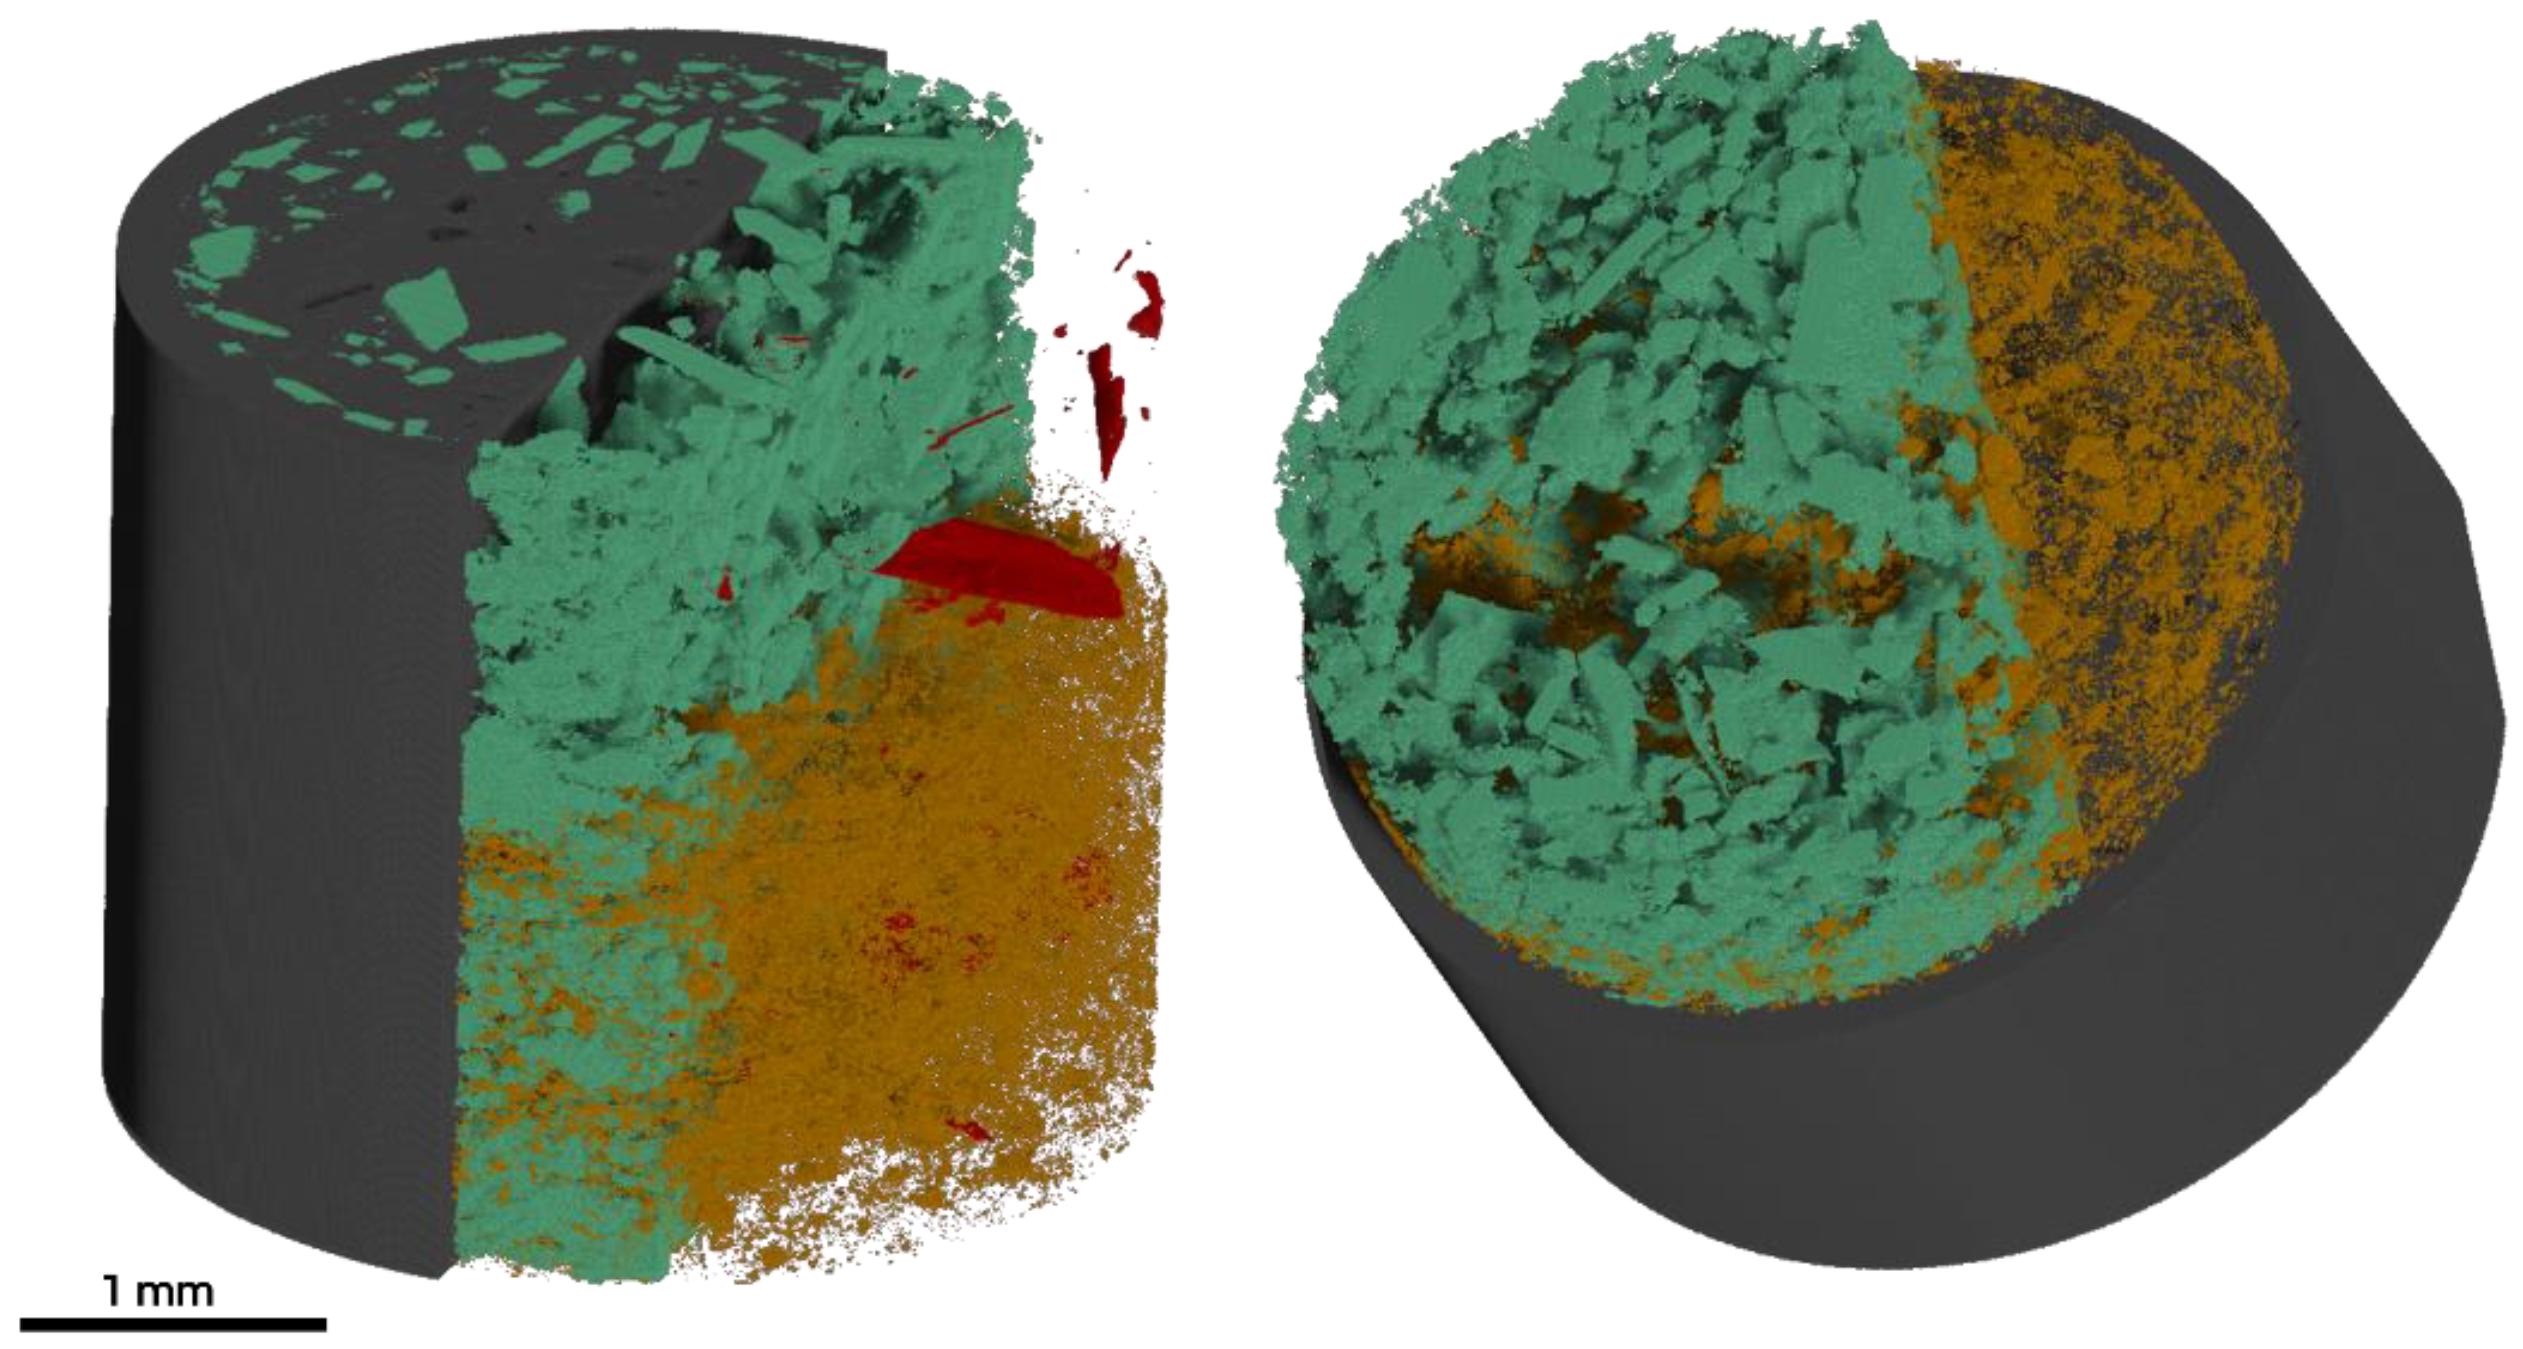
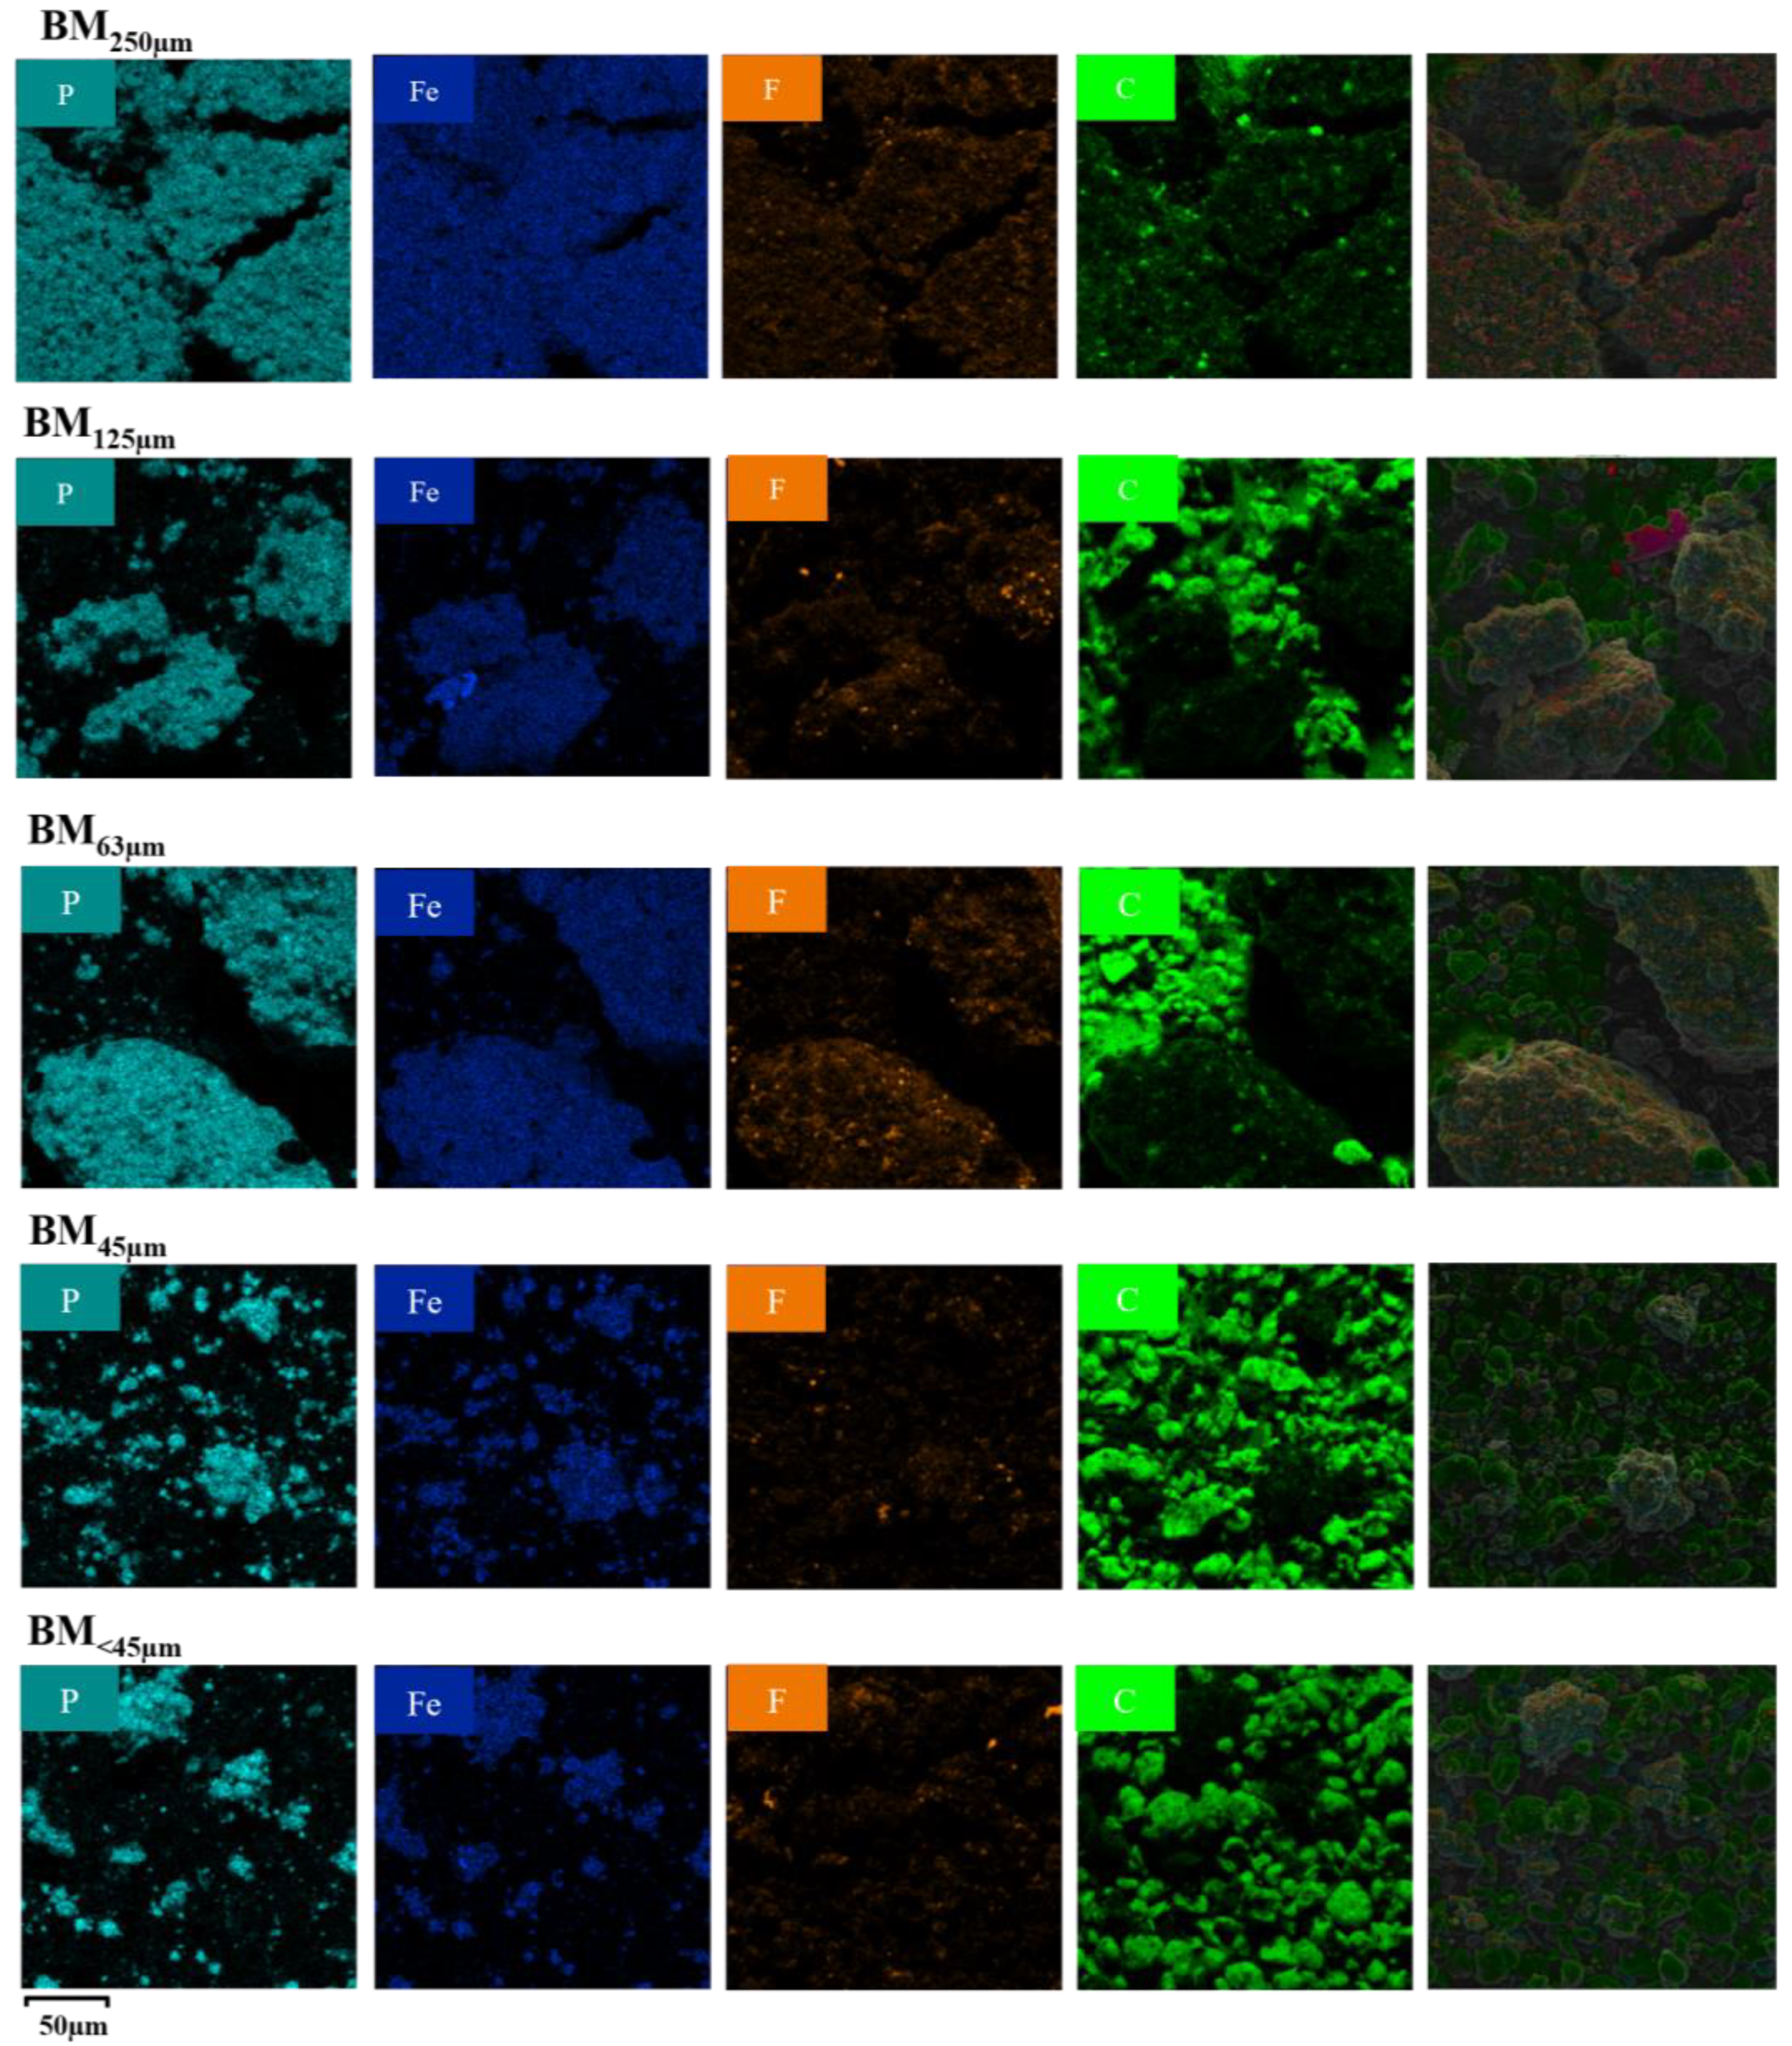
3.1. Visual and Morphological Characteristics

The as-obtained black mass, BMraw, visually consists of a black powder with metallic (Al- and Cu-colored) pieces (Figure 1a). Firstly, XrCT was employed as a non-destructive probe delivering three-dimensional information [39] about the BMraw on the spatial distribution of the constituents inside the bulk of the BM sample, and the true particle-size envelope that cannot be captured by conventional 2-D imaging or sieve analysis alone. Based on differences in size and electron density, the XrCT data for the BMraw were separated digitally into four segments. First, 2D reconstructions with and without segmentations were created (see Supplementary Information Figure S1), and from these, a 3D image was subsequently created (Figure 2). The gray segment represents the part of the BMraw with low electron density interpreted as carbon-containing components, e.g., graphite, separator, binder, and the Kapton tube. The yellow and green segments have a higher but similar electron density but are distinguished by size. The segments are believed to be Al-foil and LFP electrode pieces. Finally, the most electron-dense areas are segmented in red. Since the red colored segments have a significantly higher energy density than the other segments (LFP, Al, and carbon-containing materials), they are believed to be Cu-foil pieces. As expected, the different materials are randomly distributed throughout the tube.
Distinguishing between components of similar electron density is not possible, and information on material-specific size distributions is thus limited. However, it is observed that the electron-dense materials assigned to the foils and LFP species cover an extensive size range, indicating that sieving is insufficient for the complete separation of the components. Still, the XrCT results indicate that fractioning the BMraw by size through simple sieving might separate the components to some extent, and previous work [30,40] has indicated that graphite would mainly be found as a fine powder. In contrast, Cu and Al foil pieces have larger sizes. The BMraw was therefore sieved in a sieve-tower with mesh size ranging from 45 μm to 1 mm. Six of seven fractions obtained from the sieving are denoted BMmesh size, i.e., the particles in each fraction are larger than the mesh size (as they did not pass through it) but smaller than the mesh of the larger size (which they did pass through), i.e., the size of the particle in BM500μm are between 1 mm and 500 μm. The seventh fraction is denoted BM<45μm, meaning that the particle sizes herein are smaller than 45 μm (as they pass through the 45 μm mesh). Images of the seven fractions obtained from sieving are shown in Figure 1a. From this, it appears that the foils are concentrated in the larger fractions, namely BM250μm, BM500μm, and BM1mm. In contrast, the finer fractions consist visually solely of black powders with no visible metallic pieces. The amount (by mass) in the sieved fractions approximately follows a normal distribution around the BM125μm fraction with a mass% of 60 (Figure 3b and Table S1).
Samples of the four larger fractions, BM125μm, BM250μm, BM500μm and BM1mm, were further investigated visually using an optical microscope, as seen in Figure 1b. Generally, four different phases are distinguished: Cu foil, Al foil, and two types of black flakes (one shiny and one matt). The BM1mm primarily consists of metal foils, but both types of black flakes are also present. For the BM500μm sample, a larger fraction of black flakes is observed compared to the metal foils. This tendency continues for the next two sizes. In the BM250μm sample, the ratio of matt flakes to other components seems to have increased compared to the larger sizes. In the BM125μm sample, smaller particles are found to adhere to each other or to larger flakes. Additionally, pieces of wire are present in some samples as seen in the microscope picture of the BM125μm sample (blue square).
The morphology of the finer fractions was further examined with SEM as seen in Figure 1c. SEM images for all fractions can be found in the SI (Figure S2). The LFP (green square) and graphite (red square) particles are marked. The markings are based on results from EDX, which are described in more detail in the following section. From the SEM images, it seems that the graphite particles are generally smaller than the LFP particles and appear more uniform.
Despite sieving, some degree of polydispersity is observed. This is especially visible in the BM45μm fraction; however, it is a general trend. Polydispersity could be a consequence of non-spherical particles, in which case the orientation of the particle during sieving can influence which size fraction it lands in. Otherwise, agglomeration of fine particles can falsely land them in the coarser fractions, where they, during post-sieving treatment and characterizations, may de-agglomerate, e.g., during SEM sample preparation.

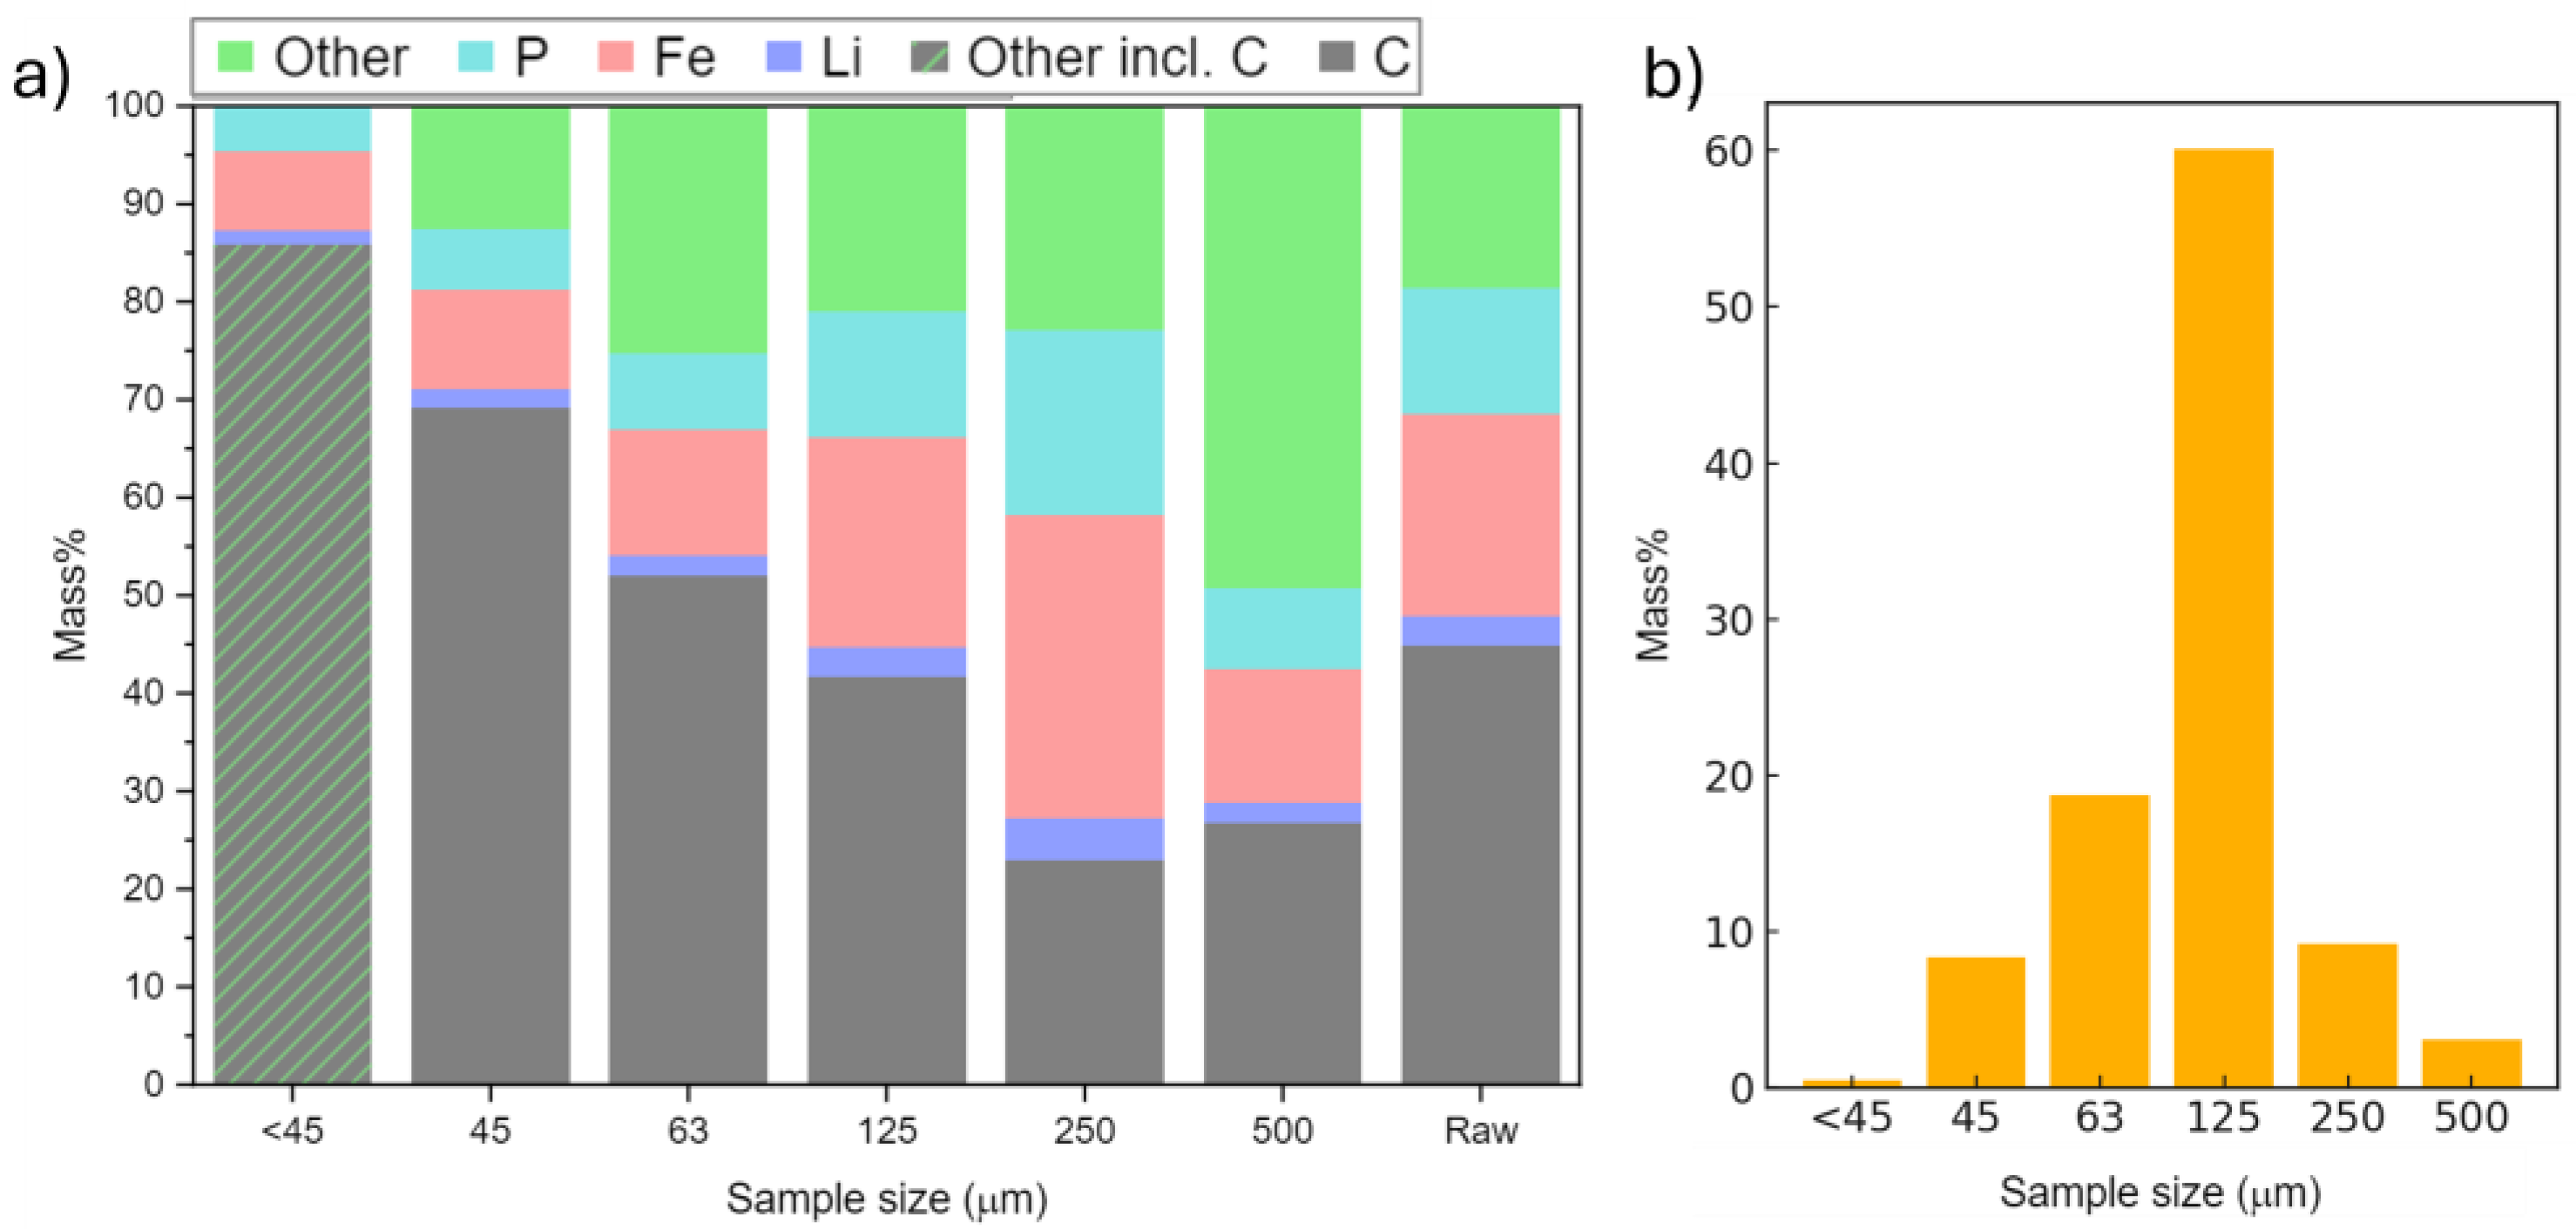
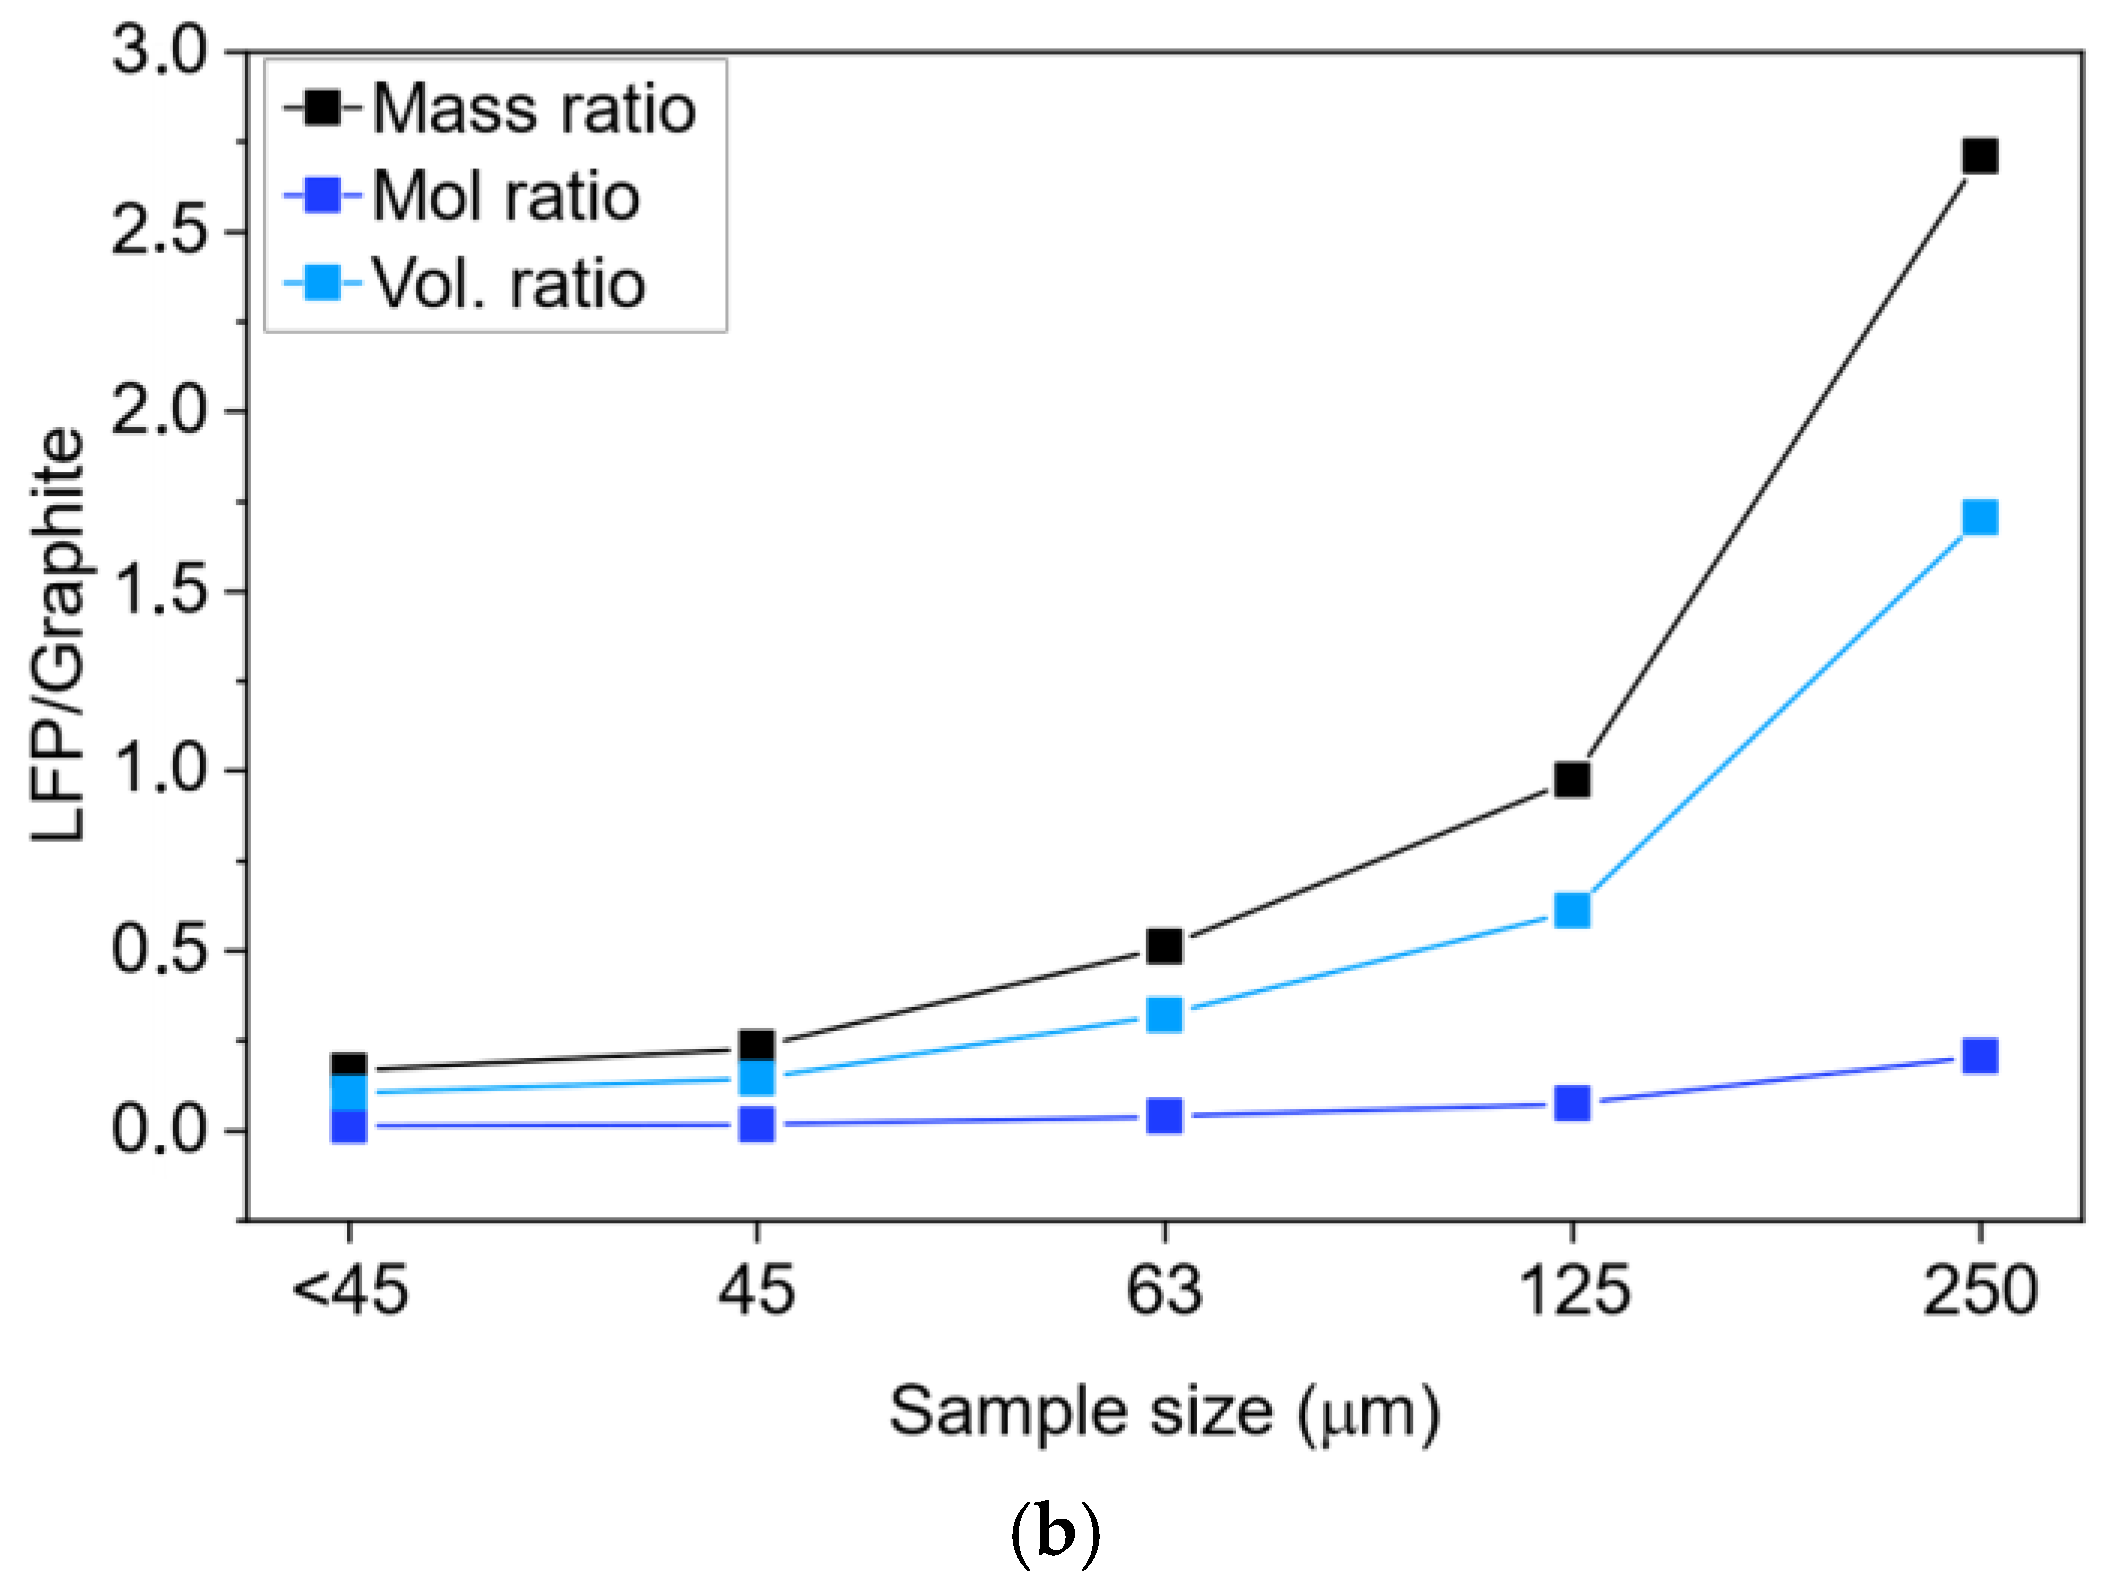
3.2. Compositional Analysis

The elemental content for each fraction in the range <45–500 μm and BMraw was investigated using XRF, ICP-OES and combustion analysis. Since quantitative results obtained by XRF may be influenced by the particle size and morphology, which vary a lot across the fractions, the technique is mainly used to detect the presence of elements and not determine quantities. A table of measured atom% for each element detected by XRF can be found in the SI (Table S2). As expected, Fe, P, Al, and Cu are present in all samples. As indicated by the visual inspection, the amounts of Al and Cu are significantly higher for BM250μm and BM500μm compared to the finer fractions and BMraw. Traces of Si, Zr and Rh were also detected.
Quantitative elemental contents were obtained from ICP-OES, calibrated to detect 12 elements (Li, Na, P, S, Ti, V, Cr, Mn, Fe, Co, and Ni). To also determine the carbon content in the samples, combustion analysis, which detects C, H, N and S, was conducted for the BMraw and BM45μm–BM500μm. The results from the analysis are summarized in Figure 3a, which shows the mass% (colored bars) of the Li, C, P, and Fe, while the remaining elements, e.g., Al and Cu, are shown jointly (denoted “Other” in Figure 3). Furthermore, the mass distribution of the sieved BM in the different size fractions is shown in mass% in Figure 3b (See also Table S1). The full results of the ICP-OES and combustion analysis with uncertainties are listed in the SI (Table S3). The analysis reveals a clear trend of increasing carbon content with a decrease in particle size, with BM250μm holding the minimum carbon content of <25 mass%. BM500μm has a slightly higher carbon content. This may be attributed to this sample having higher amounts of Cu-foil, which the graphite electrode may still adhere to after shredding. Another trend is that the LFP content increases with increasing particle size up to BM250μm, which contains ~55 mass% LFP, assuming that all Fe is from LFP. BM500μm contains less LFP, which again makes sense as this sample is dominated by Cu and Al foil as seen in Figure 1b. Combining this information with the mass% obtained for each size fraction reveals that BM125μm and BM250μm are those of highest interest in terms of LFP retrieval.
The mass ratio of Fe:P:Li is 1.00:0.62:0.19 in BMraw. In comparison, it is 1.00:0.56:0.12 for pure LFP. Hence, assuming again that all Fe stems from LFP, there is additional Li and P present in the black mass besides that originating from LFP. This is anticipated as the traditional electrolytes contain LiPF6 and likely also stabilizing agents like lithium bis(oxalate)borate (LiBOB). Across the sieved fractions, the amount of Li relative to that of Fe, is slightly higher in the fractions with small particle sizes, wherein the amount of graphite is higher. This is in line with the fact that some of the active Li may be contained in the graphite (i.e., as LixC) or in the solid electrolyte interface (SEI), which mainly forms on the graphite electrode.
The content of crystalline phases in the BM<45μm–BM250μm fractions was analyzed using PXRD. The Rietveld refinement profiles of the PXRD data are shown in Figure 4a (see also Figure S3). It reveals diffraction from graphite [41] and LFP [42], and except for BM<45μm, also Cu and Al. Furthermore, an unidentified compound with significant peaks at ~2.1 Å−1, was observed in all samples. This phase is likely formed during thermal treatment of the BM. Based on the diffracted intensities, the amount of the unidentified phase follows the same trend as LFP, i.e., it may be a phase forming from the LFP. No FePO4 [43] was detected in any of the fractions, i.e., the black mass was likely produced entirely from discharged batteries. The Rietveld refinements show that the crystalline structure of LFP is well preserved and corresponds to literature reports of stoichiometric LFP. Furthermore, from Rietveld refinement, the mass% of each crystalline phase was determined, and from this, the molar% and volume% were calculated based on the theoretical molar masses and densities of graphite and LFP. Based on these numbers, the ratio of LFP/graphite was calculated and plotted in Figure 4b. The estimated mass ratio of each phase, including Al and Cu, are shown in the SI (Figure S4). The PXRD analysis agrees with the elemental analysis as the amount of graphite increases with decreasing particle size, while the amount of LFP increases with increasing particle size. It is important to note that PXRD only probes the crystalline phases, and any non-crystalline content is, therefore, not included in these observations.
Finally, to evaluate the spatial distribution of phases, we collected SEM-EDX maps for all fractions. The maps for P, Fe, F and C are shown in Figure 5, while those for O, Al and Si are shown in the SI (Figure S5). For all fractions, carbon is generally spatially separated from the areas rich in Fe and P, i.e., LFP particles. Hence, the graphite from the negative electrode does not smear onto the LFP particles. This is especially evident for the BM63μm sample where there is a large difference in the average size of the carbon and LFP particles. Still, some carbon is seen within/on the LFP particles, which is suspected to mostly stem from conductive carbon additives in the LFP electrode. Regarding morphology, particles consisting of carbon appear to have a smoother surface compared to the LFP particles, which show a rougher surface common for LFP, which often consists of agglomerates of several smaller particles/crystallites. In BM125μm, a Fe-rich particle is observed in a low P- and O-content area. Hence, this particle may be the unidentified phase observed by PXRD, which was found in the highest amount in BM125μm.
SEM-EDX also reveals minor fluorine contents. Fluorine is not detected by any other employed technique or as part of a crystalline compound in PXRD. Most of the fluorine from fluorinated binders (polyvinylidene fluoride (PVDF) or polytetrafluoroethylene (PTFE)) and LiPF6 from the electrolyte may be lost by decomposition during the thermal treatment during the processing of the black mass. However, it is also likely that species like LiF may remain as a residue from these processes. The fluorine is mainly detected in the LFP particles and not in the carbon particles, which may result from the fluorinated binders being used in the positive electrode, while non-fluorinated binders are often used for the negative graphite electrode [44].
For the larger fractions, i.e., BM125μm–BM250μm, Al and Cu are also detected, which aligns with the observations made from visual inspection (Figure 1a). However, for the smaller fractions, i.e., BM<45μm–BM63μm, neither Al nor Cu is detected by SEM-EDX. Traces of silicon are seen in most samples. From the SEM-EDX images, the fibers observed in the optical microscope (Figure 1b) seem to consist of a silicon oxide material. They probably are traces of glass fibers from printed circuit boards, constituting part of the battery management system (BMS) of the shredded batteries.

4. Conclusions

This study reports a comprehensive characterization of a commercially produced graphite/LFP BM sample derived from an actual LFP battery waste stream. Analysis of sieved BM samples confirmed that, as for NMC/NCA-based BM, the graphite accumulates in the fine fractions, while Cu and Al accumulate in the coarser fractions. Interestingly, we found that LFP accumulates in the medium grained fraction, i.e., BM125μm and BM250μm, which accounts for >69 wt% of the total sieved BM mass. Thus, the study reveals a quantitative link between mesh size, crystalline phase content and total element inventory. Importantly, powder X-ray diffraction confirmed that the LFP structure remains largely intact. However, an Fe-rich, hitherto unknown phase likely formed during industrial thermal–mechanical pre-treatment, was also identified.
These results suggest that optimizing the morphology of the black mass could further improve the separability of its constituents. The morphology may potentially be optimized by tuning the balance between shear-dominated and high-impact shredding and by introducing step-wise fragmentation, e.g., initial fragmentation of a coarsely shredded BM followed by fragmentation of the obtained fine-grained fractions, or initial fragmentation prior to binder decomposition by heat treatment, which may leave more LFP attached to the Al foil. Implementing such measures may yield a black mass in which the LFP/graphite mass ratio in the 63–250 μm fractions exceeds the 1.5 value achieved here, moving the material closer to direct-recycling applications and reducing the environmental footprint of the overall process.

Supplementary Materials

The following supporting information can be downloaded at: https://www.mdpi.com/article/10.3390/batteries11060210/s1, Figure S1: Slices of XrCT; Table S1: Mass distribution in grams and in mass% along with observations from submerging a sample of each fraction into water; Figure S2: SEM images of all the sieved LFP black mass fractions with sizes ranging from <45 μm to 250 μm; Table S2: Estimated atom% based on XRF-measurement for sizes ranging <45–500 μm and BMraw; Table S3: Estimated mass% of Fe, P, Li, S, Ni, and Cr from ICP measurements and C, H, N, and S based on CHNS measurements made with triplicates for sizes ranging from 45 to 500 μm and BMraw; Figure S3: Rietveld refinement of PXRD and the phases detected for each sample; Figure S4: Estimated mass ratios for the crystalline phases Graphite, LFP, Al, and Cu based on the Rietveld refinements shown in Figure S3; Figure S5: (a) SEM-EDX image of BM<45μm, BM45μm and BM63μm fractions, showing maps for all detected elements; (b) SEM-EDX image of BM125μm and BM250μm fractions, showing maps for all detected elements.

Author Contributions

Conceptualization, all; methodology, N.B.-C., C.B.E. and D.B.R.; validation, all; formal analysis, N.B.-C. and C.B.E.; investigation, N.B.-C. and C.B.E.; resources, K.O.S.-H. and D.B.R.; writing—original draft preparation, N.B.-C., C.B.E. and D.B.R.; writing—review and editing, all; visualization, N.B.-C. and C.B.E.; supervision, D.B.R.; project administration, D.B.R.; funding acquisition, D.B.R. All authors have read and agreed to the published version of the manuscript.

Funding

The authors thank the following for funding this research: The Elite Research Award program (Grant no. 2083-00061B), the Novo Nordic Foundation (Grant No. NNF20OC0062068), and the Danish National Research Foundation (grant no. DNRF189) through the Center for Sustainable Energy Materials (CENSEMAT). The Carlsberg Foundation (Grant no: CF20-0364) and the Aarhus University Centre for Integrated Materials Research are acknowledged for funding the Tescan Clara SEM used in this work. Use of the Novo Nordisk Foundation research infrastructure AXIA (grant NNF19OC0055801) for the CT measurements is gratefully acknowledged. The authors acknowledge DESY (Hamburg, Germany), a member of the Helmholtz Association HGF, for providing experimental facilities at PETRA III. Finally, we also acknowledge DanScatt for funding travel costs related to the synchrotron experiments.

Data Availability Statement

The raw data supporting the conclusions of this article will be made available by the authors on request.

Acknowledgments

We thank ACCUREC for supplying the black mass investigated in this study. We thank Zhangqi Wang for valuable scientific inputs and Rebekka Klemmt for instructions and clever guidance in use of the SEM.

Conflicts of Interest

The authors declare no conflicts of interest.

References

  1. Fleischmann, J.M.H.; Horetsky, E.; Ibrahim, D.; Jautelat, S.; Linder, M.; Schaufuss, P.; Torscht, L.; van de Rijt, A. Battery 2030: Resilient, Sustainable, and Circular. 2023. Available online: https://www.mckinsey.com/industries/automotive-and-assembly/our-insights/battery-2030-resilient-sustainable-and-circular#/ (accessed on 25 March 2025).
  2. Stone, M. As Electric Vehicles Take Off, We’ll Need to Recycle Their Batteries National Geographics, 2021. Available online: https://www.nationalgeographic.com/environment/article/electric-vehicles-take-off-recycling-ev-batteries (accessed on 25 March 2025).
  3. Tarascon, J.M.; Armand, M. Issues and challenges facing rechargeable lithium batteries. Nature 2001, 414, 359–367. [Google Scholar] [CrossRef] [PubMed]
  4. Singh, N.; Galande, C.; Miranda, A.; Mathkar, A.; Gao, W.; Reddy, A.L.M.; Vlad, A.; Ajayan, P.M. Paintable Battery. Sci. Rep. 2012, 2, 481. [Google Scholar] [CrossRef] [PubMed]
  5. Wang, W.; Jiang, B.; Xiong, W.; Sun, H.; Lin, Z.; Hu, L.; Tu, J.; Hou, J.; Zhu, H.; Jiao, S. A new cathode material for super-valent battery based on aluminium ion intercalation and deintercalation. Sci. Rep. 2013, 3, 3383. [Google Scholar] [CrossRef]
  6. Circular Economy: New Law on More Sustainable, Circular and Safe Batteries Enters Into Force. 2023. Available online: https://environment.ec.europa.eu/news/new-law-more-sustainable-circular-and-safe-batteries-enters-force-2023-08-17_en (accessed on 25 March 2025).
  7. Office, V.T. Battery Policies and Incentives Search 2023. Available online: https://www.energy.gov/eere/vehicles/battery-policies-and-incentives-search#/ (accessed on 25 March 2025).
  8. Nemko. Compulsory Chinese Certification of Li-ion Batteries & Related Product. 2023. Available online: https://www.nemko.com/blog/compulsory-chinese-certification-of-lithium-ion-batteries-and-related-products (accessed on 25 March 2025).
  9. Government Notifies Battery Waste Management Rules. 2022. Available online: https://pib.gov.in/PressReleasePage.aspx?PRID=1854433 (accessed on 25 March 2025).
  10. Law No. 12305 Brazilian National Policy on Solid Waste (Batteries). Iea. Available online: https://www.iea.org/policies/15805-law-no-12305-brazilian-national-policy-on-solid-waste-batteries (accessed on 25 March 2025).
  11. Wang, X.-T.; Gu, Z.-Y.; Ang, E.H.; Zhao, X.-X.; Wu, X.-L.; Liu, Y. Prospects for managing end-of-life lithium-ion batteries: Present and future. Interdiscip. Mater. 2022, 1, 417–433. [Google Scholar] [CrossRef]
  12. Hazotte, C.; Leclerc, N.; Diliberto, S.; Meux, E.; Lapicque, F. End-of-life nickel-cadmium accumulators: Characterization of electrode materials and industrial Black Mass. Environ. Technol. 2015, 36, 796–805. [Google Scholar] [CrossRef]
  13. Thompson, D.; Hyde, C.; Hartley, J.M.; Abbott, A.P.; Anderson, P.A.; Harper, G.D.J. To shred or not to shred: A comparative techno-economic assessment of lithium ion battery hydrometallurgical recycling retaining value and improving circularity in LIB supply chains. Resour. Conserv. Recycl. 2021, 175, 105741. [Google Scholar] [CrossRef]
  14. Gaines, L. Lithium-ion battery recycling processes: Research towards a sustainable course. Sustain. Mater. Technol. 2018, 17, e00068. [Google Scholar] [CrossRef]
  15. Zhao, Y.; Pohl, O.; Bhatt, A.I.; Collis, G.E.; Mahon, P.J.; Rüther, T.; Hollenkamp, A.F.A. A Review on Battery Market Trends, Second-Life Reuse, and Recycling. Sustain. Chem. 2021, 2, 167–205. [Google Scholar] [CrossRef]
  16. Romo, L.A.; López-Fernández, A.; García-Díaz, I.; Fernández, P.; Urbieta, A.; López, F.A. From spent alkaline batteries to ZnxMn3−xO4 by a hydrometallurgical route: Synthesis and characterization. RSC Adv. 2018, 8, 33496–33505. [Google Scholar] [CrossRef]
  17. Meskers, C.; Caffarey, M.; Van Camp, M. Circular Cities, E-Mobility and the Metals Industry—A World in Transition. In REWAS 2019; Gaustad, G., Fleuriault, C., Gökelma, M., Howarter, J.A., Kirchain, R., Ma, K., Meskers, C., Neelameggham, N.R., Olivetti, E., Powell, A.C., et al., Eds.; Springer International Publishing: Cham, Switzerland, 2019; pp. 313–318. [Google Scholar]
  18. Yadav, P.; Jie, C.J.; Tan, S.; Srinivasan, M.J. Recycling of cathode from spent lithium iron phosphate batteries. Hazard. Mater. 2020, 399, 123068. [Google Scholar] [CrossRef]
  19. Li, H.; Xing, S.; Liu, Y.; Li, F.; Guo, H.; Kuang, G. Recovery of Lithium, Iron, and Phosphorus from Spent LiFePO4 Batteries Using Stoichiometric Sulfuric Acid Leaching System. ACS Sustain. Chem. Eng. 2017, 5, 8017–8024. [Google Scholar] [CrossRef]
  20. Du, M.; Guo, J.-Z.; Zheng, S.-H.; Liu, Y.; Yang, J.-L.; Zhang, K.-Y.; Gu, Z.-Y.; Wang, X.-T.; Wu, X.-L. Direct reuse of LiFePO4 cathode materials from spent lithium-ion batteries: Extracting Li from brine. Chin. Chem. Lett. 2023, 34, 107706. [Google Scholar] [CrossRef]
  21. Ding, Y.; Fu, J.; Zhang, S.; He, X.; Zhao, B.; Ren, J.; Zhong, J.; Liu, Z. Advances in recycling LiFePO4 from spent lithium batteries: A critical review. Sep. Purif. Technol. 2024, 338, 126551. [Google Scholar] [CrossRef]
  22. Dolotko, O.; Gehrke, N.; Malliaridou, T.; Sieweck, R.; Herrmann, L.; Hunzinger, B.; Knapp, M.; Ehrenberg, H. Universal and efficient extraction of lithium for lithium-ion battery recycling using mechanochemistry. Commun. Chem. 2023, 6, 49. [Google Scholar] [CrossRef]
  23. Zhang, J.; Hu, J.; Liu, Y.; Jing, Q.; Yang, C.; Chen, Y.; Wang, C. Synergistic Recovery of Valuable Metals from Spent Nickel–Metal Hydride Batteries and Lithium-Ion Batteries. ACS Sustain. Chem. Eng. 2019, 7, 5626–5631. [Google Scholar] [CrossRef]
  24. Liu, K.; Tan, Q.; Liu, L.; Li, J. Acid-Free and Selective Extraction of Lithium from Spent Lithium Iron Phosphate Batteries via a Mechanochemically Induced Isomorphic Substitution. Environ. Sci. Technol. 2019, 53, 9781–9788. [Google Scholar] [CrossRef]
  25. Xu, P.; Dai, Q.; Gao, H.; Liu, H.; Zhang, M.; Li, M.; Chen, Y.; An, K.; Meng, Y.S.; Liu, P.; et al. Efficient Direct Recycling of Lithium-Ion Battery Cathodes by Targeted Healing. Joule 2020, 4, 2609–2626. [Google Scholar] [CrossRef]
  26. Fan, M.; Meng, Q.; Chang, X.; Gu, C.-F.; Meng, X.-H.; Yin, Y.-X.; Li, H.; Wan, L.-J.; Guo, Y.-G. In Situ Electrochemical Regeneration of Degraded LiFePO4 Electrode with Functionalized Prelithiation Separator. Adv. Energy Mater. 2022, 12, 2103630. [Google Scholar] [CrossRef]
  27. Jing, Q.; Zhang, J.; Liu, Y.; Zhang, W.; Chen, Y.; Wang, C. Direct Regeneration of Spent LiFePO4 Cathode Material by a Green and Efficient One-Step Hydrothermal Method. ACS Sustain. Chem. Eng. 2020, 8, 17622–17628. [Google Scholar] [CrossRef]
  28. Feng, C.; Cao, Y.; Song, L.; Zhao, B.; Yang, Q.; Zhang, Y.; Wei, X.; Zhou, G.; Song, Y. Direct Regeneration of Industrial LiFePO4 Black Mass Through A Glycerol-Enabled Granule Reconstruction Strategy. Angew. Chem. Int. Ed. 2025, 64, e202418198. [Google Scholar] [CrossRef]
  29. Wang, Y.; An, N.; Wen, L.; Wang, L.; Jiang, X.; Hou, F.; Yin, Y.; Liang, J.J. Recent progress on the recycling technology of Li-ion batteries. Energy Chem. 2021, 55, 391–419. [Google Scholar] [CrossRef]
  30. Mousa, E.; Hu, X.; Ånnhagen, L.; Ye, G.; Cornelio, A.; Fahimi, A.; Bontempi, E.; Frontera, P.; Badenhorst, C.; Santos, A.C.; et al. Characterization and Thermal Treatment of the Black Mass from Spent Lithium-Ion Batteries. Sustainability 2023, 15, 15. [Google Scholar] [CrossRef]
  31. Babanejad, S.; Ahmed, H.; Andersson, C.; Samuelsson, C.; Lennartsson, A.; Hall, B.; Arnerlöf, L.J. High-Temperature Behavior of Spent Li-Ion Battery Black Mass in Inert Atmosphere. Sustain. Metall. 2022, 8, 566–581. [Google Scholar] [CrossRef]
  32. Donnelly, L.; Pirrie, D.; Power, M.; Corfe, I.; Kuva, J.; Lukkari, S.; Lahaye, Y.; Liu, X.; Dehaine, Q.; Jolis, E.M.; et al. The Recycling of End-of-Life Lithium-Ion Batteries and the Phase Characterisation of Black Mass. Recycling 2023, 8, 59. [Google Scholar] [CrossRef]
  33. Peschel, C.; van Wickeren, S.; Preibisch, Y.; Naber, V.; Werner, D.; Frankenstein, L.; Horsthemke, F.; Peuker, U.; Winter, M.; Nowak, S. Comprehensive Characterization of Shredded Lithium-Ion Battery Recycling Material. Chem. Eur. J. 2022, 28, e202200485. [Google Scholar] [CrossRef]
  34. Wilke, C.; Werner, D.M.; Kaas, A.; Peuker, U.A. Influence of the Crusher Settings and a Thermal Pre-Treatment on the Properties of the Fine Fraction (Black Mass) from Me-chanical Lithium-Ion Battery Recycling. Batteries 2023, 9, 514. [Google Scholar] [CrossRef]
  35. GmbH, A.R. Accurec Battery Recycling. Available online: https://accurec.de/?lang=en (accessed on 17 May 2025).
  36. Dragonfly; Comet Technologies Canada Inc., Montreal, Canada: Software. Available online: https://www.theobjects.com/dragonfly (accessed on 20 August 2024).
  37. Dippel, A.-C.; Liermann, H.-P.; Delitz, J.T.; Walter, P.; Schulte-Schrepping, H.; Seeck, O.H.; Franz, H.J. Beamline P02.1 at PETRA III for high-resolution and high-energy powder diffraction. Synchrotron Radiat. 2015, 22, 675–687. [Google Scholar] [CrossRef]
  38. Juan Rodriguez-Carvajal, T.R. Recent advances in magnetic structure determination by neutron powder diffraction. Phys. B Condens. Matter. 1993, 192, 55–69. [Google Scholar] [CrossRef]
  39. Withers, P.J.; Bouman, C.; Carmignato, S.; Cnudde, V.; Grimaldi, D.; Hagen, C.K.; Maire, E.; Manley, M.; Du Plessis, A.; Stock, S.R. X-ray computed tomography. Nat. Rev. Methods Primers 2021, 1, 18. [Google Scholar] [CrossRef]
  40. Vanderbruggen, A.; Gugala, E.; Blannin, R.; Bachmann, K.; Serna-Guerrero, R.; Rudolph, M. Automated mineralogy as a novel approach for the compositional and textural characterization of spent lithium-ion batteries. Miner. Eng. 2021, 169, 106924. [Google Scholar] [CrossRef]
  41. Trucano, P.; Chen, R. Structure of Graphite by Neutron Diffraction. Nature 1975, 258, 136–137. [Google Scholar] [CrossRef]
  42. Janssen, Y.; Santhanagopalan, D.; Qian, D.; Chi, M.; Wang, X.; Hoffmann, C.; Meng, Y.S.; Khalifah, P.G. Reciprocal Salt Flux Growth of LiFePO4 Single Crystals with Controlled Defect Concentrations. Chem. Mater. 2013, 25, 4574–4584. [Google Scholar] [CrossRef]
  43. Andersson, A.S.; Kalska, B.; Häggström, L.; Thomas, J.O. Lithium extraction/insertion in LiFePO4: An X-ray diffraction and Mössbauer spectroscopy study. Solid State Ion. 2000, 130, 41–52. [Google Scholar] [CrossRef]
  44. Zou, F.; Manthiram, A. A Review of the Design of Advanced Binders for High-Performance Batteries. Adv. Energy Mater. 2020, 10, 2002508. [Google Scholar] [CrossRef]
Figure 1. (a) Pictures of seven sieved black mass fractions and BMraw, (b) optical microscope pictures of samples BM125μm, BM250μm, BM500μm, and BM1mm, (c) SEM images of BM<45μm, BM45μm and BM63μm. The blue square marks a piece of wire, the red square indicates a graphite particle, the green square indicates an LFP particle (based on EDX as described in a later section).
Batteries 11 00210 g001
Figure 2. Reconstructed 3D images of BMraw from XrCT measurements. The colors are based on the absorption of the different features, which are divided into four segments: lowest density, i.e., carbon-containing features (gray), medium density, i.e., LFP and Al-foil, divided into small (yellow) and large pieces (green), and high density, i.e., Cu foil (red). For illustrative purposes, the gray, green and yellow segments are only shown in part of the image to make all segments visible.
Batteries 11 00210 g002
Figure 3. (a) The elemental content of the size fractions deduced from ICP-OES and combustion analysis. The Fe, P, and Li contents are obtained from ICP-OES, while the C content is derived from combustion analysis. The category denoted “Other” includes all other detected elements besides Li, Fe, P and C (e.g., Al and Cu). Note that the combustion analysis, thus the C content, was not performed for BM<45μm due to the limited sample amount. Therefore, C is included in the “other” fraction. (b) The mass distribution of the different size fractions obtained through sieving of BMraw.
Batteries 11 00210 g003
Figure 4. (a) Rietveld refinement of PXRD patterns for the black mass fractions and Bragg peak positions for the refined structured. (b) Phase ratio of (LFP + FP):graphite given as mass, molar and volume ratio across sample sizes <45–250 μm. The mass ratio and corresponding uncertainties are extracted from Rietveld refinements of the corresponding diffractograms. From this molar and volume ratios are calculated based on the molar masses and densities of the stochiometric compounds.
Batteries 11 00210 g004aBatteries 11 00210 g004b
Figure 5. SEM-EDX elemental maps of the BM fractions. From left to right, the columns show the distribution of P, Fe, F, and C, while the right-most column shows overlays of all EDX maps for the given fraction.
Batteries 11 00210 g005
Disclaimer/Publisher’s Note: The statements, opinions and data contained in all publications are solely those of the individual author(s) and contributor(s) and not of MDPI and/or the editor(s). MDPI and/or the editor(s) disclaim responsibility for any injury to people or property resulting from any ideas, methods, instructions or products referred to in the content.

