
Comprehensive Study of the Gas Volume and Composition Generated by 5 Ah Nickel Manganese Cobalt Oxide (NMC) Li-Ion Pouch Cells Through Different Failure Mechanisms at Varying States of Charge

 , , ,
, , ,
Abstract
1. Introduction
1.1. Gas Volumes
1.2. Gas Composition
1.2.1. External Heat
1.2.2. Overcharge and Nail Penetration
1.2.3. Multiple Abuse Methods
2. Materials and Methods
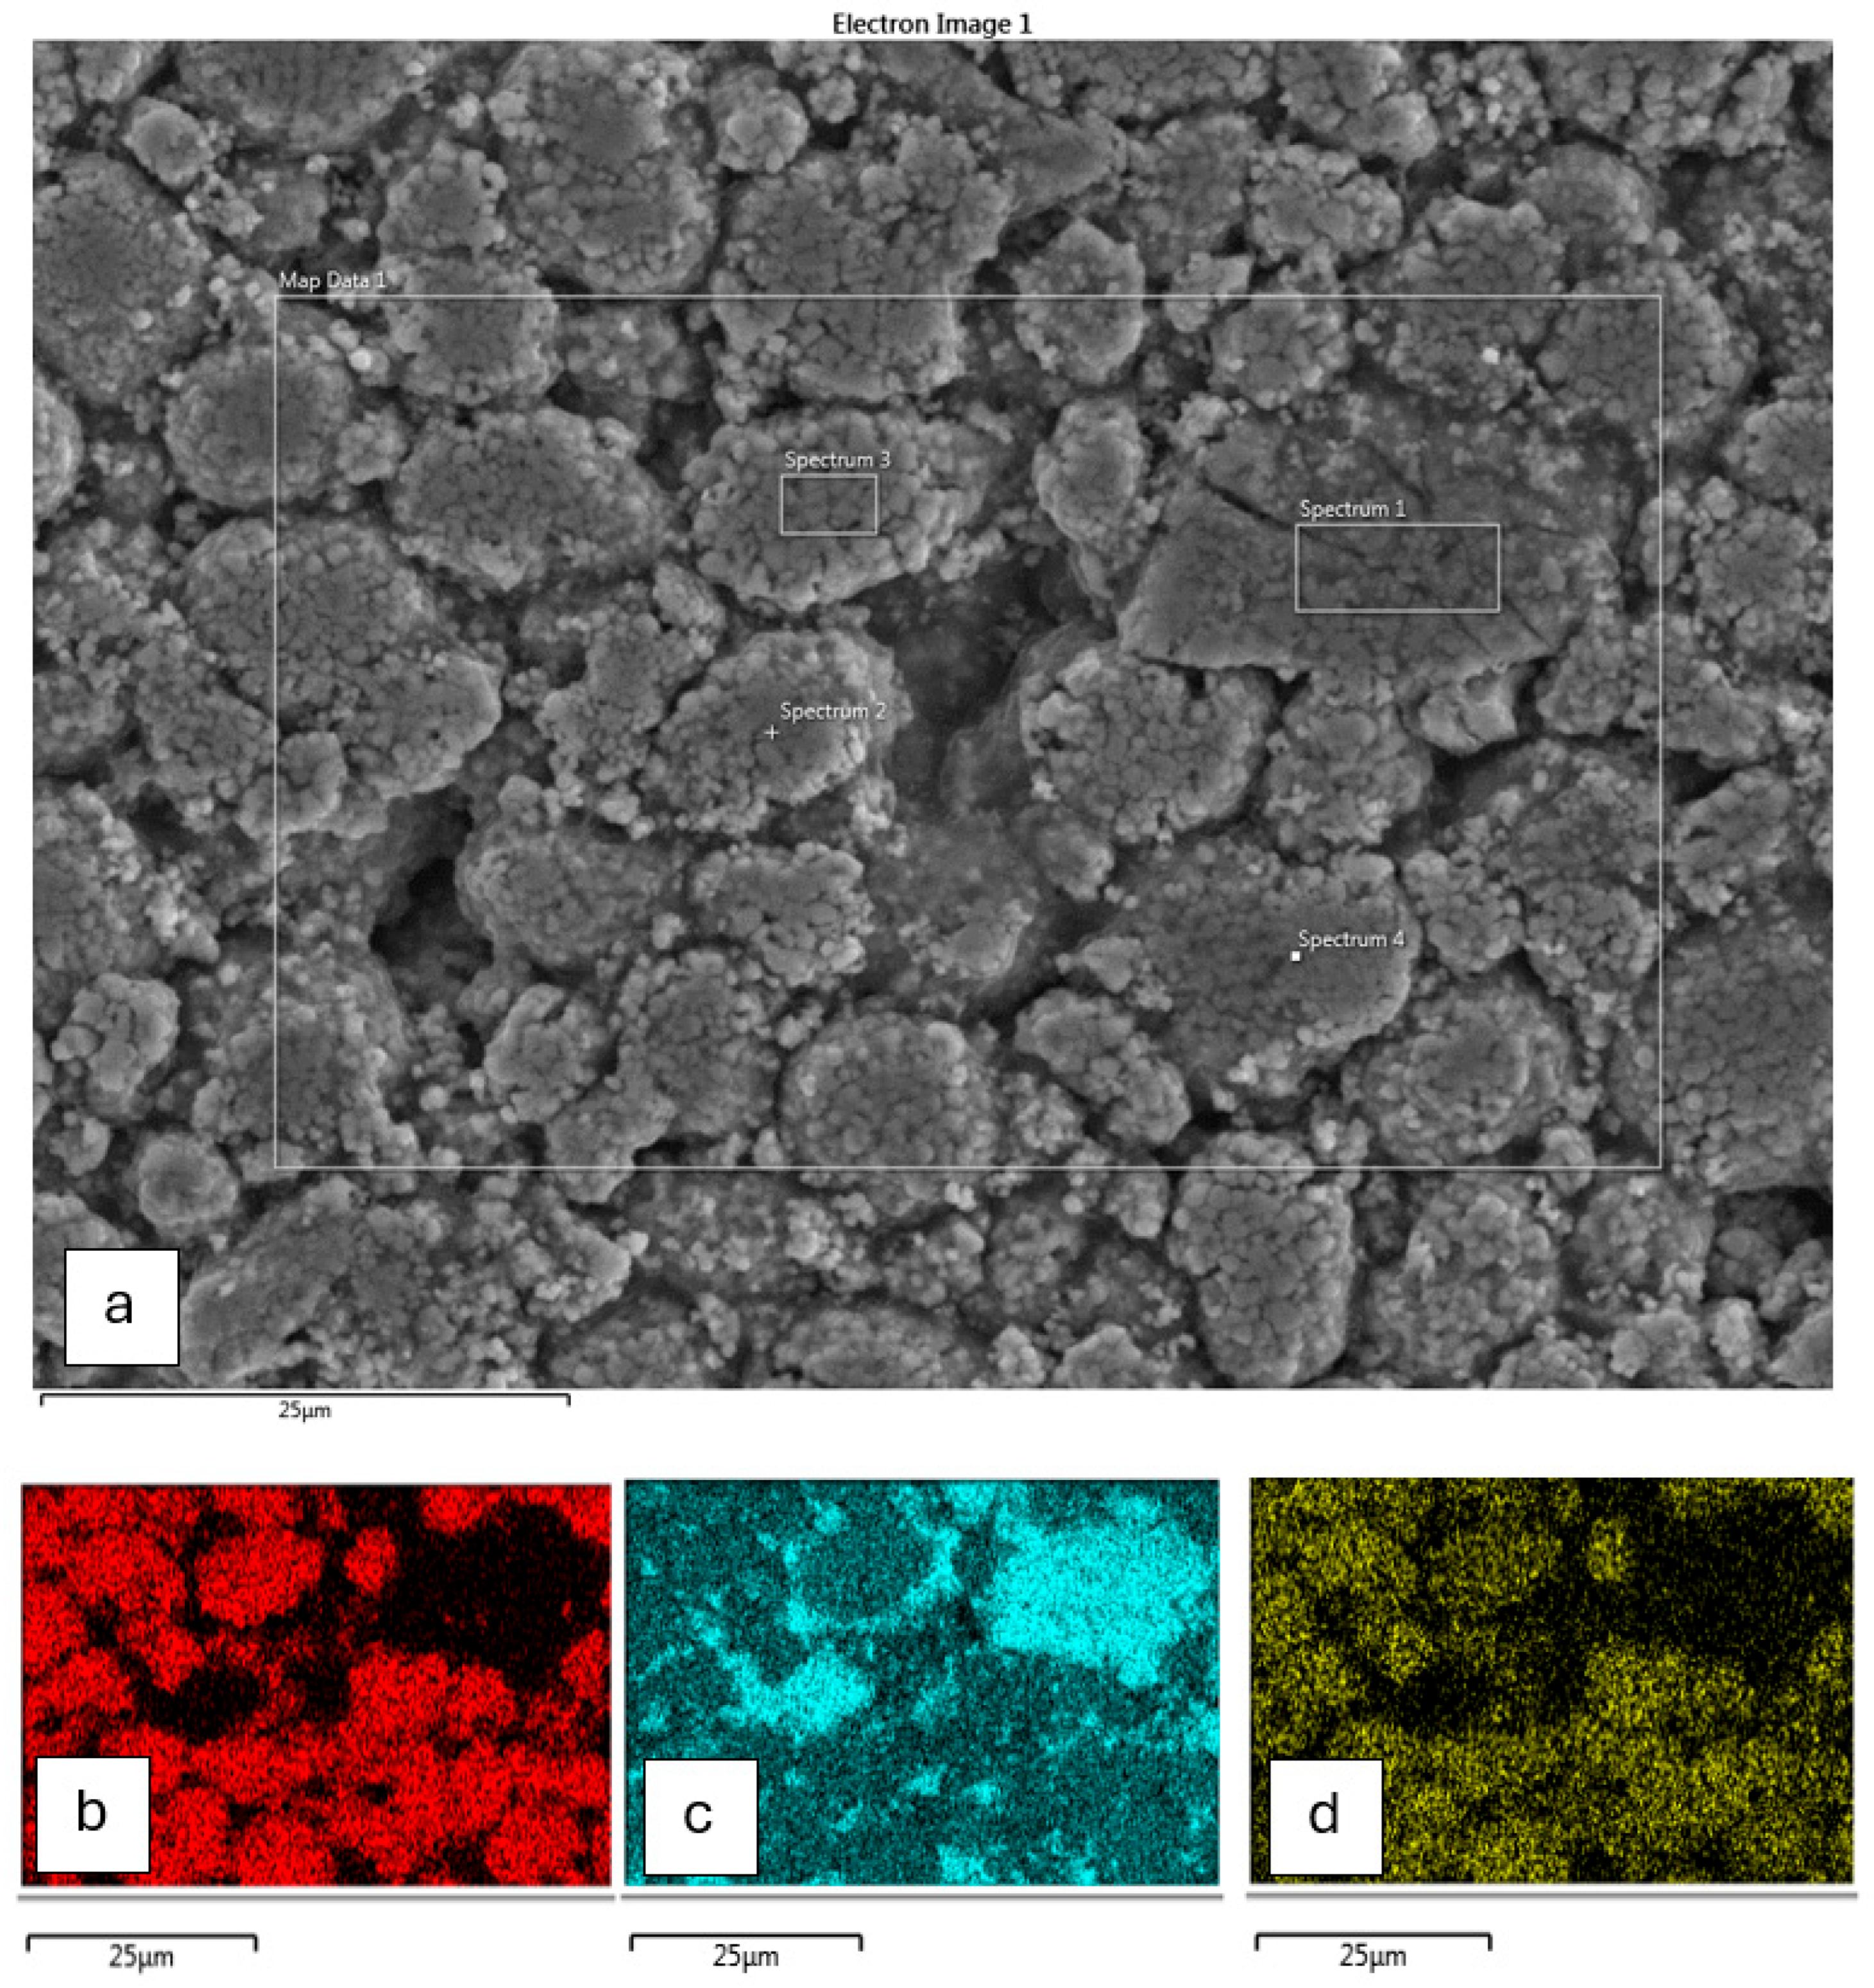
2.1. Cell Characterisation
Cathode Chemistry
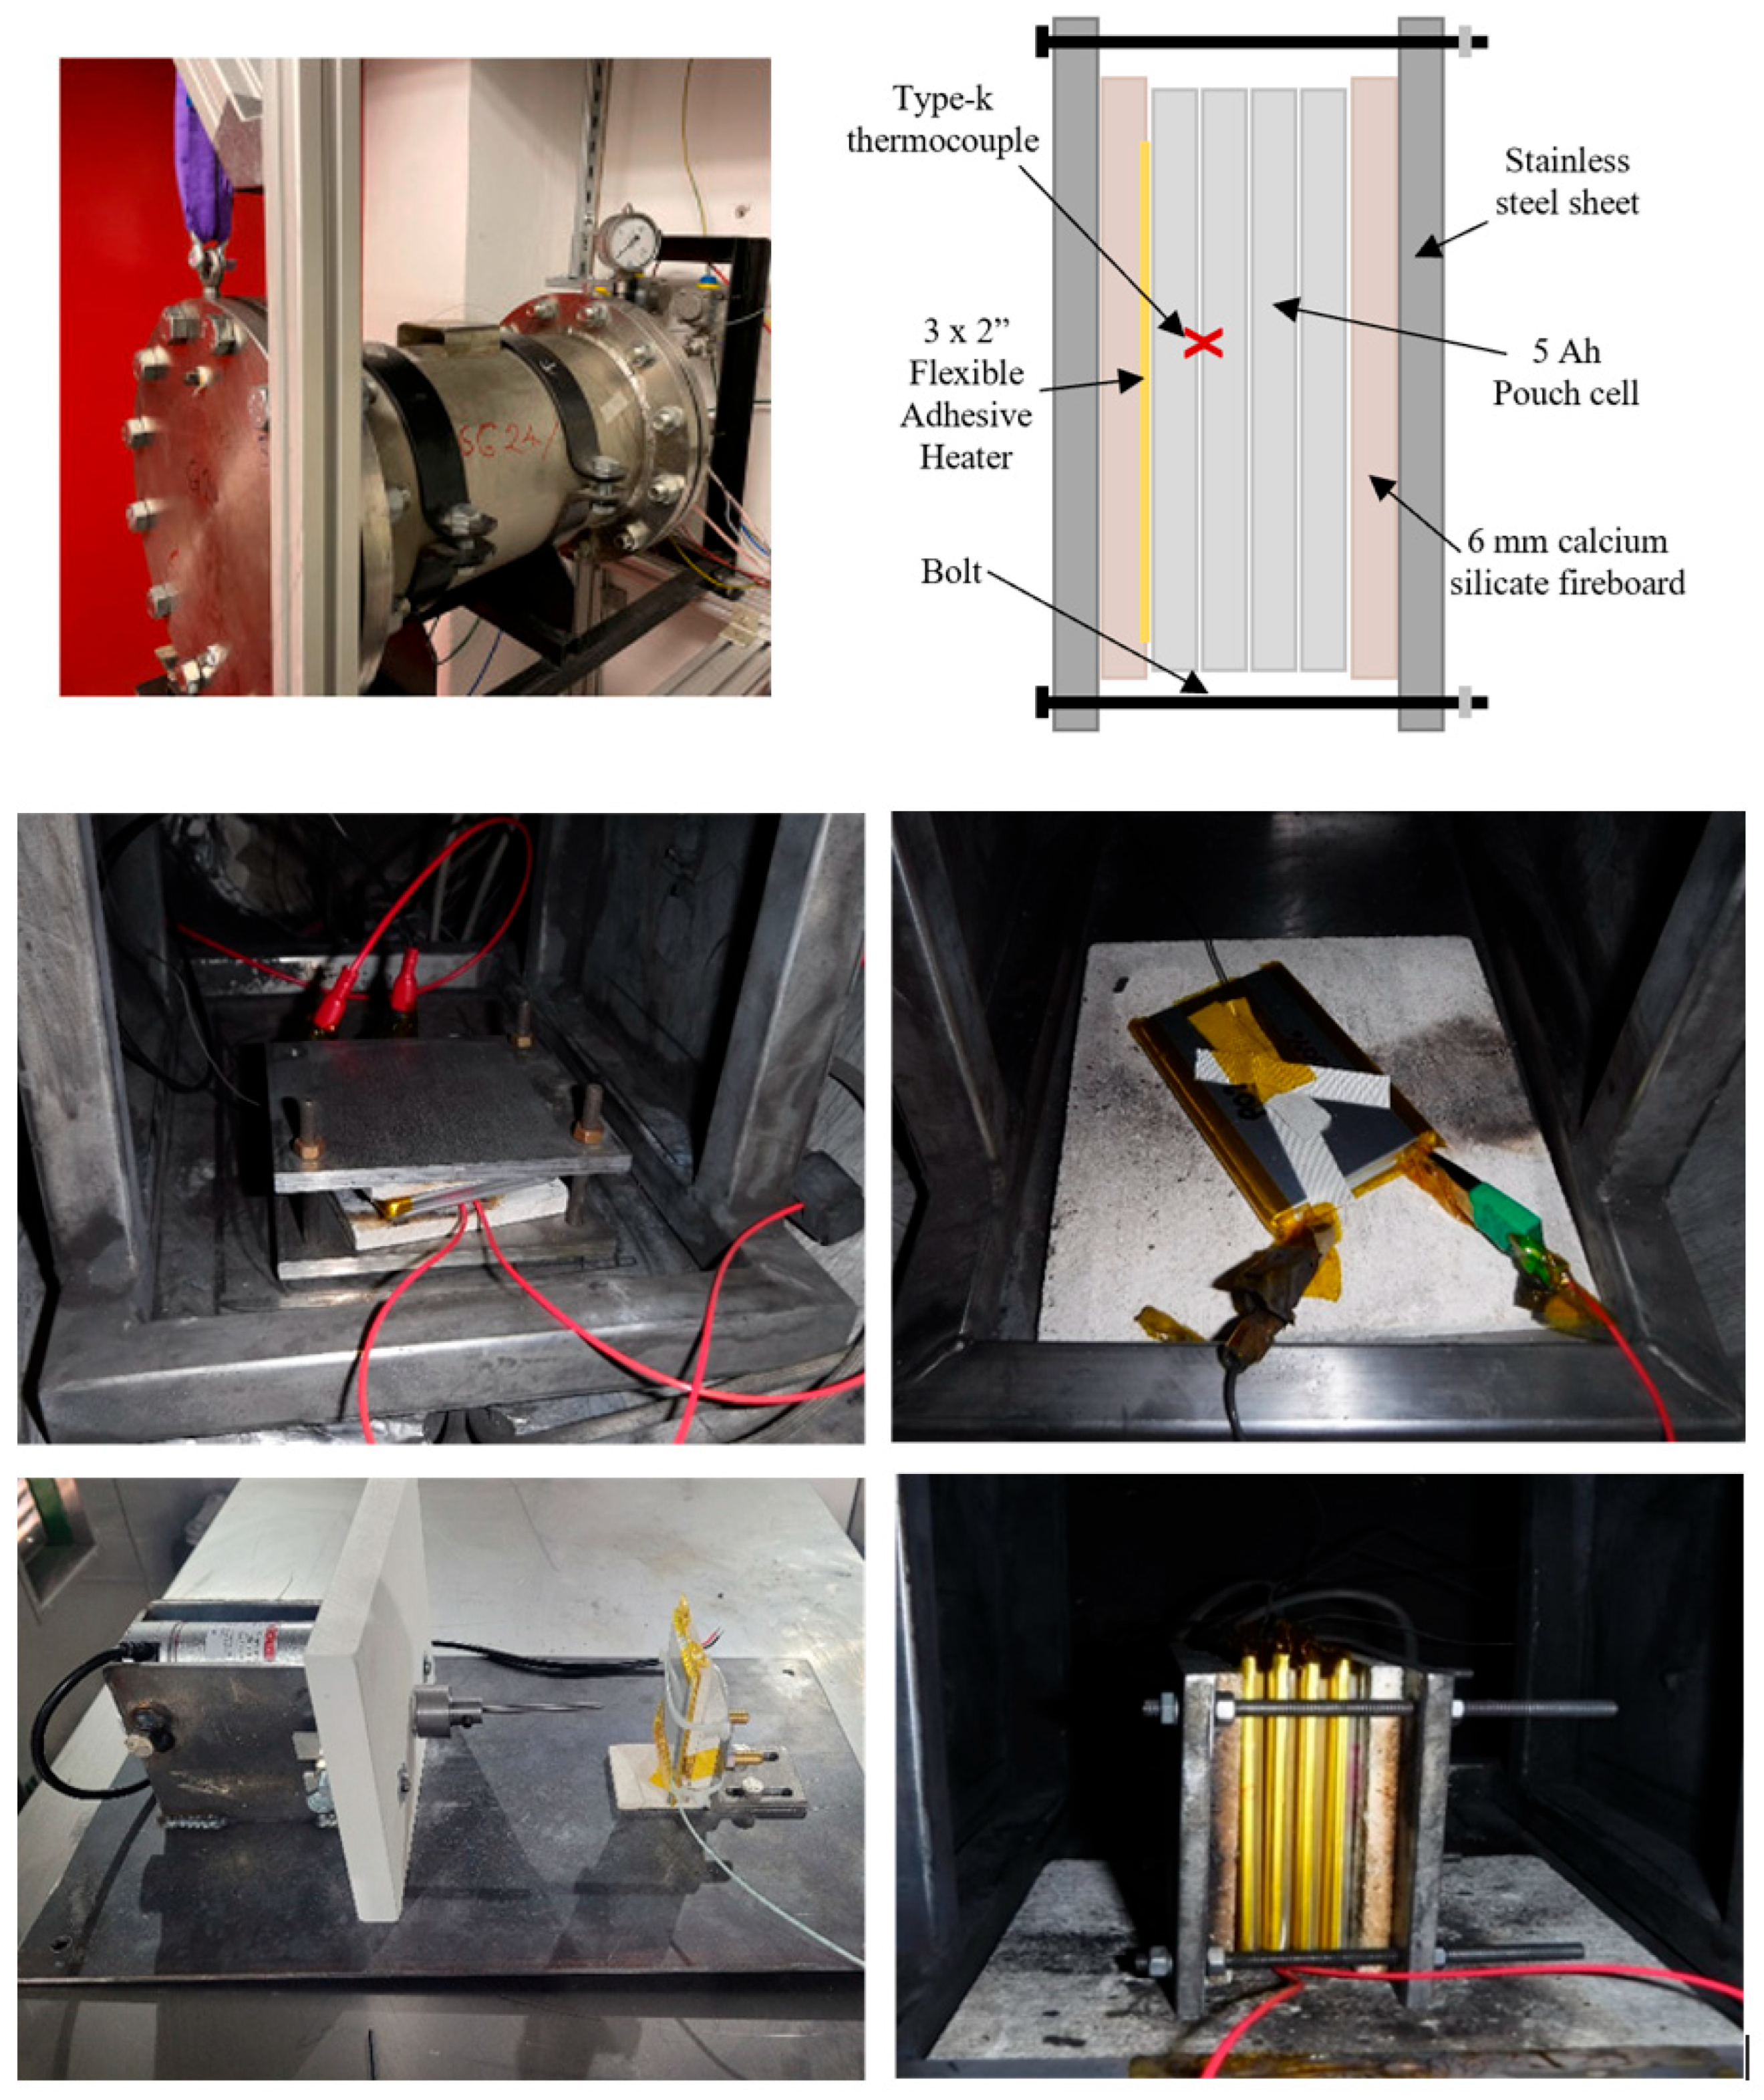
2.2. Test Method
2.2.1. External Heat
2.2.2. Overcharge
2.2.3. Nail Penetration
2.3. Gas Volume Calculation
2.4. Gas Composition Analysis
3. Results and Discussion
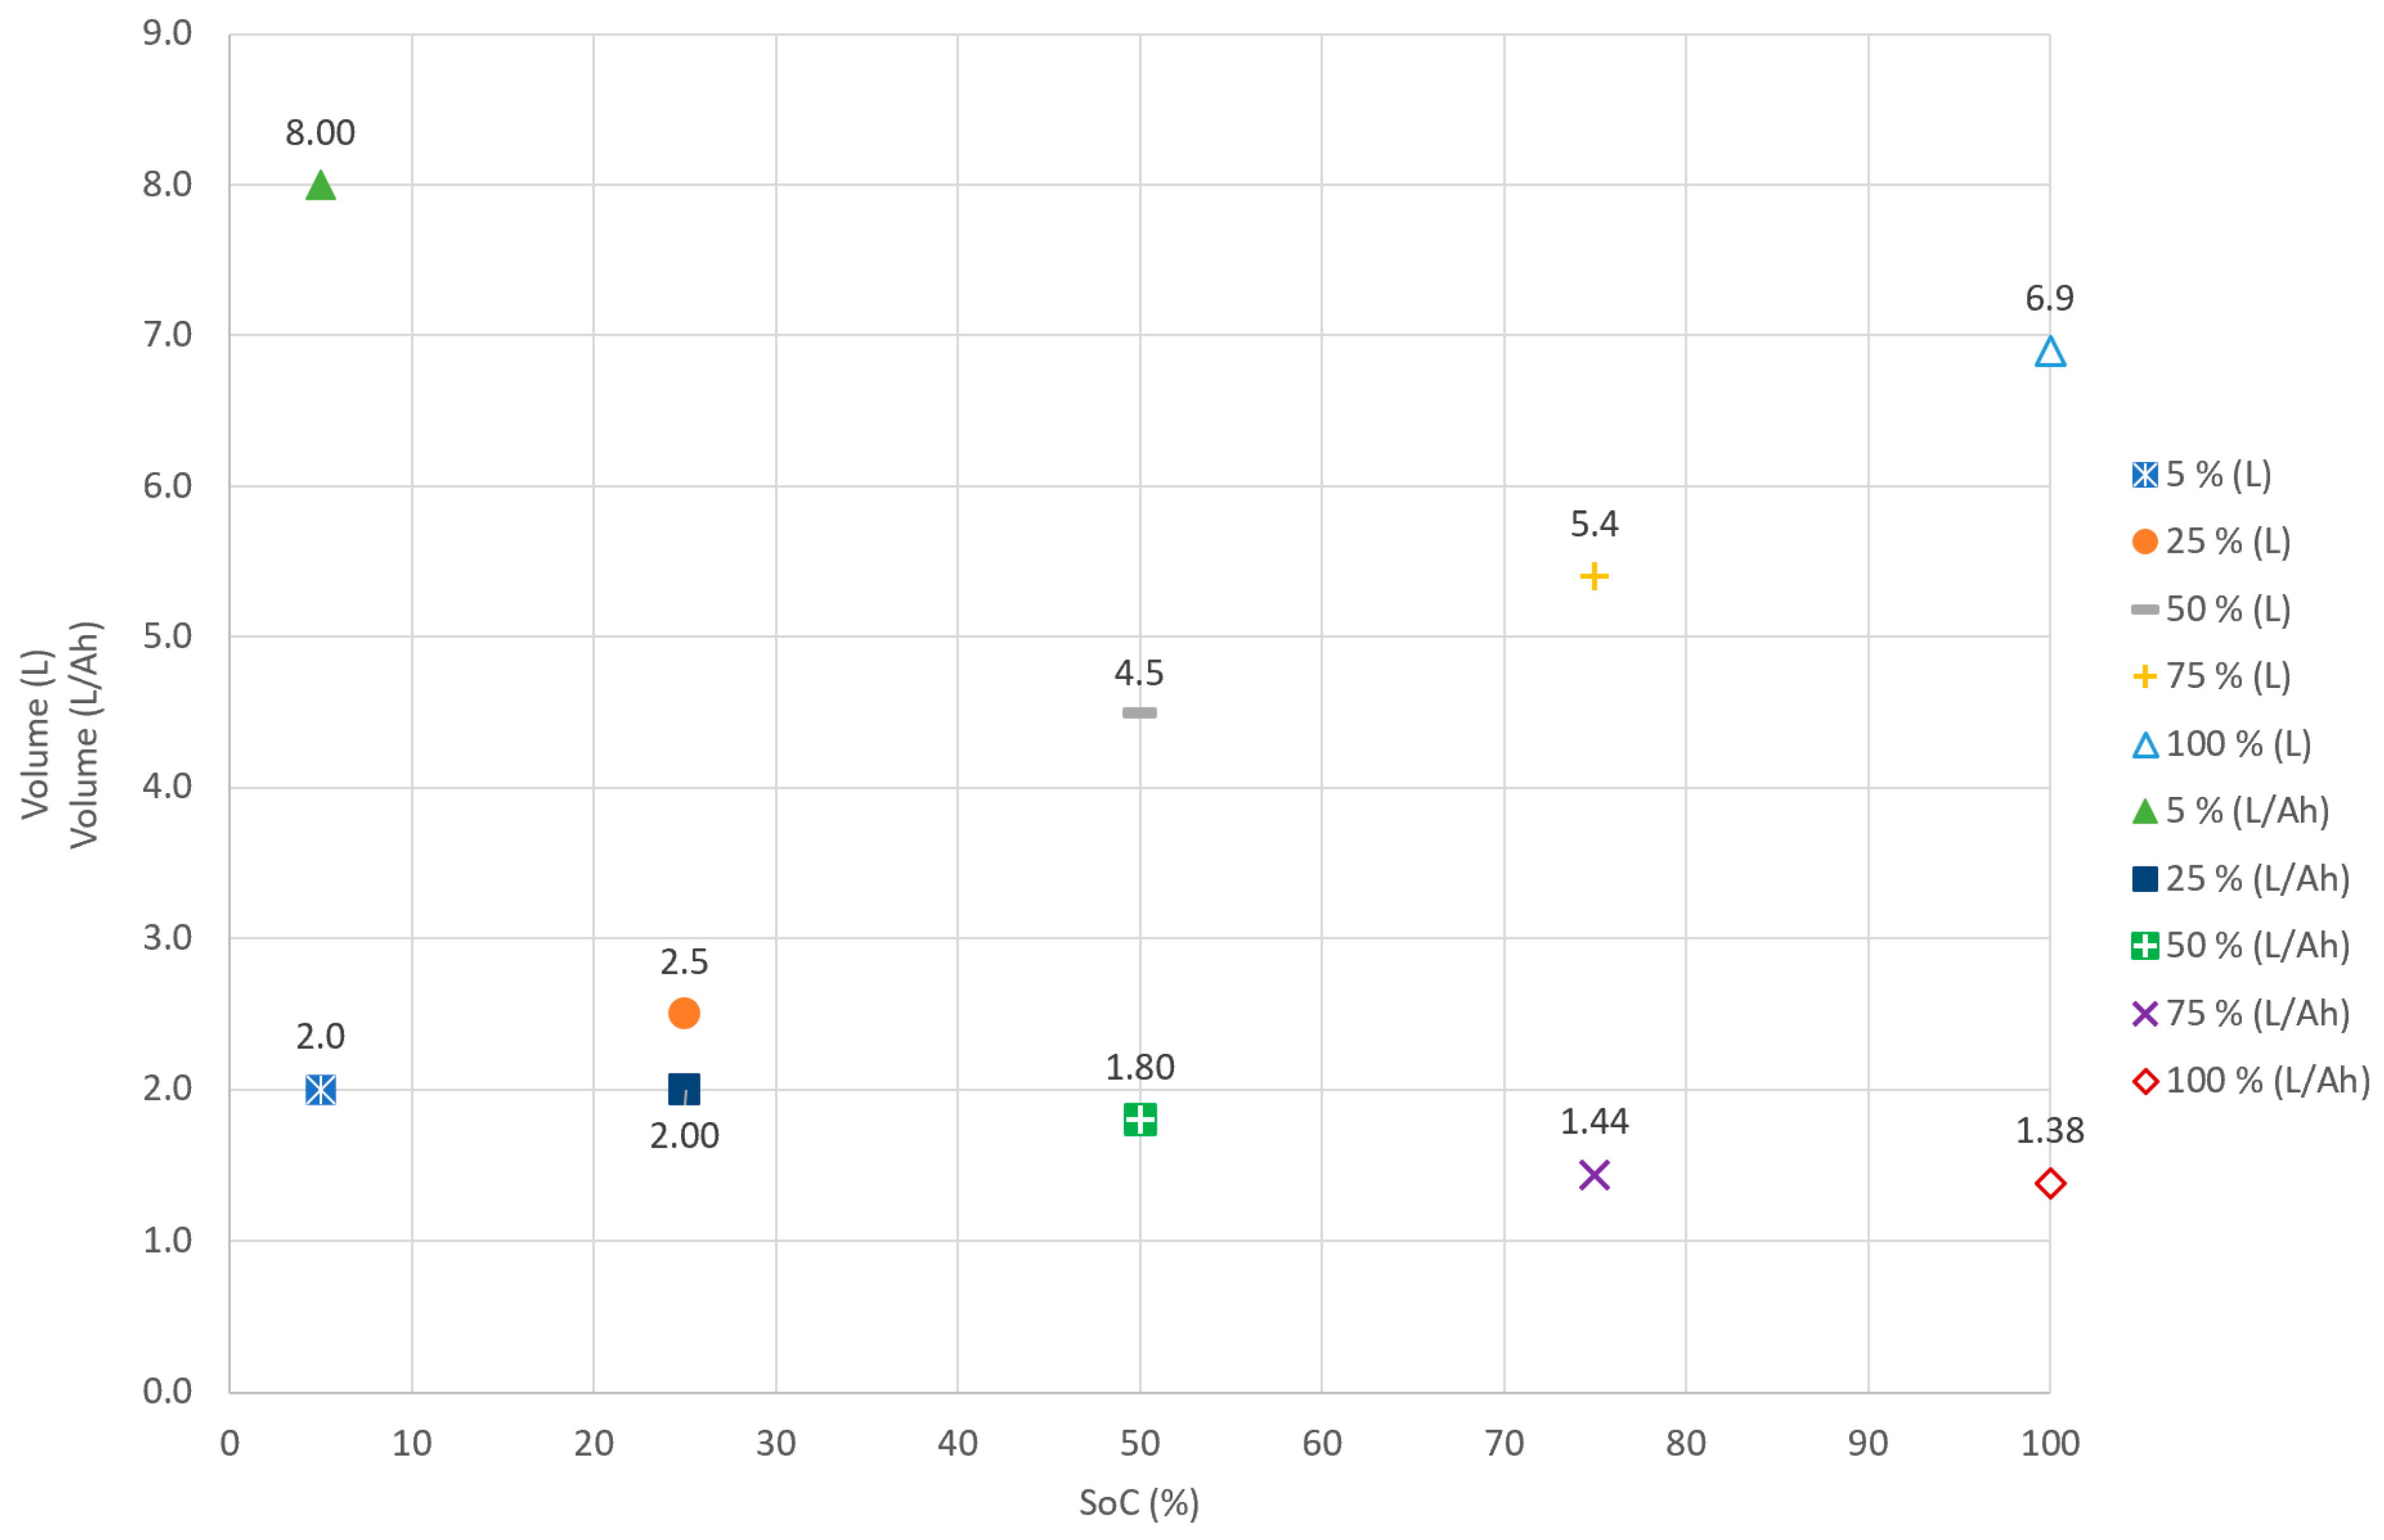
3.1. External Heat Gas Volume and Composition
3.1.1. SoC at 100%
3.1.2. SoC at 75%, 50%, 25%, and 5%
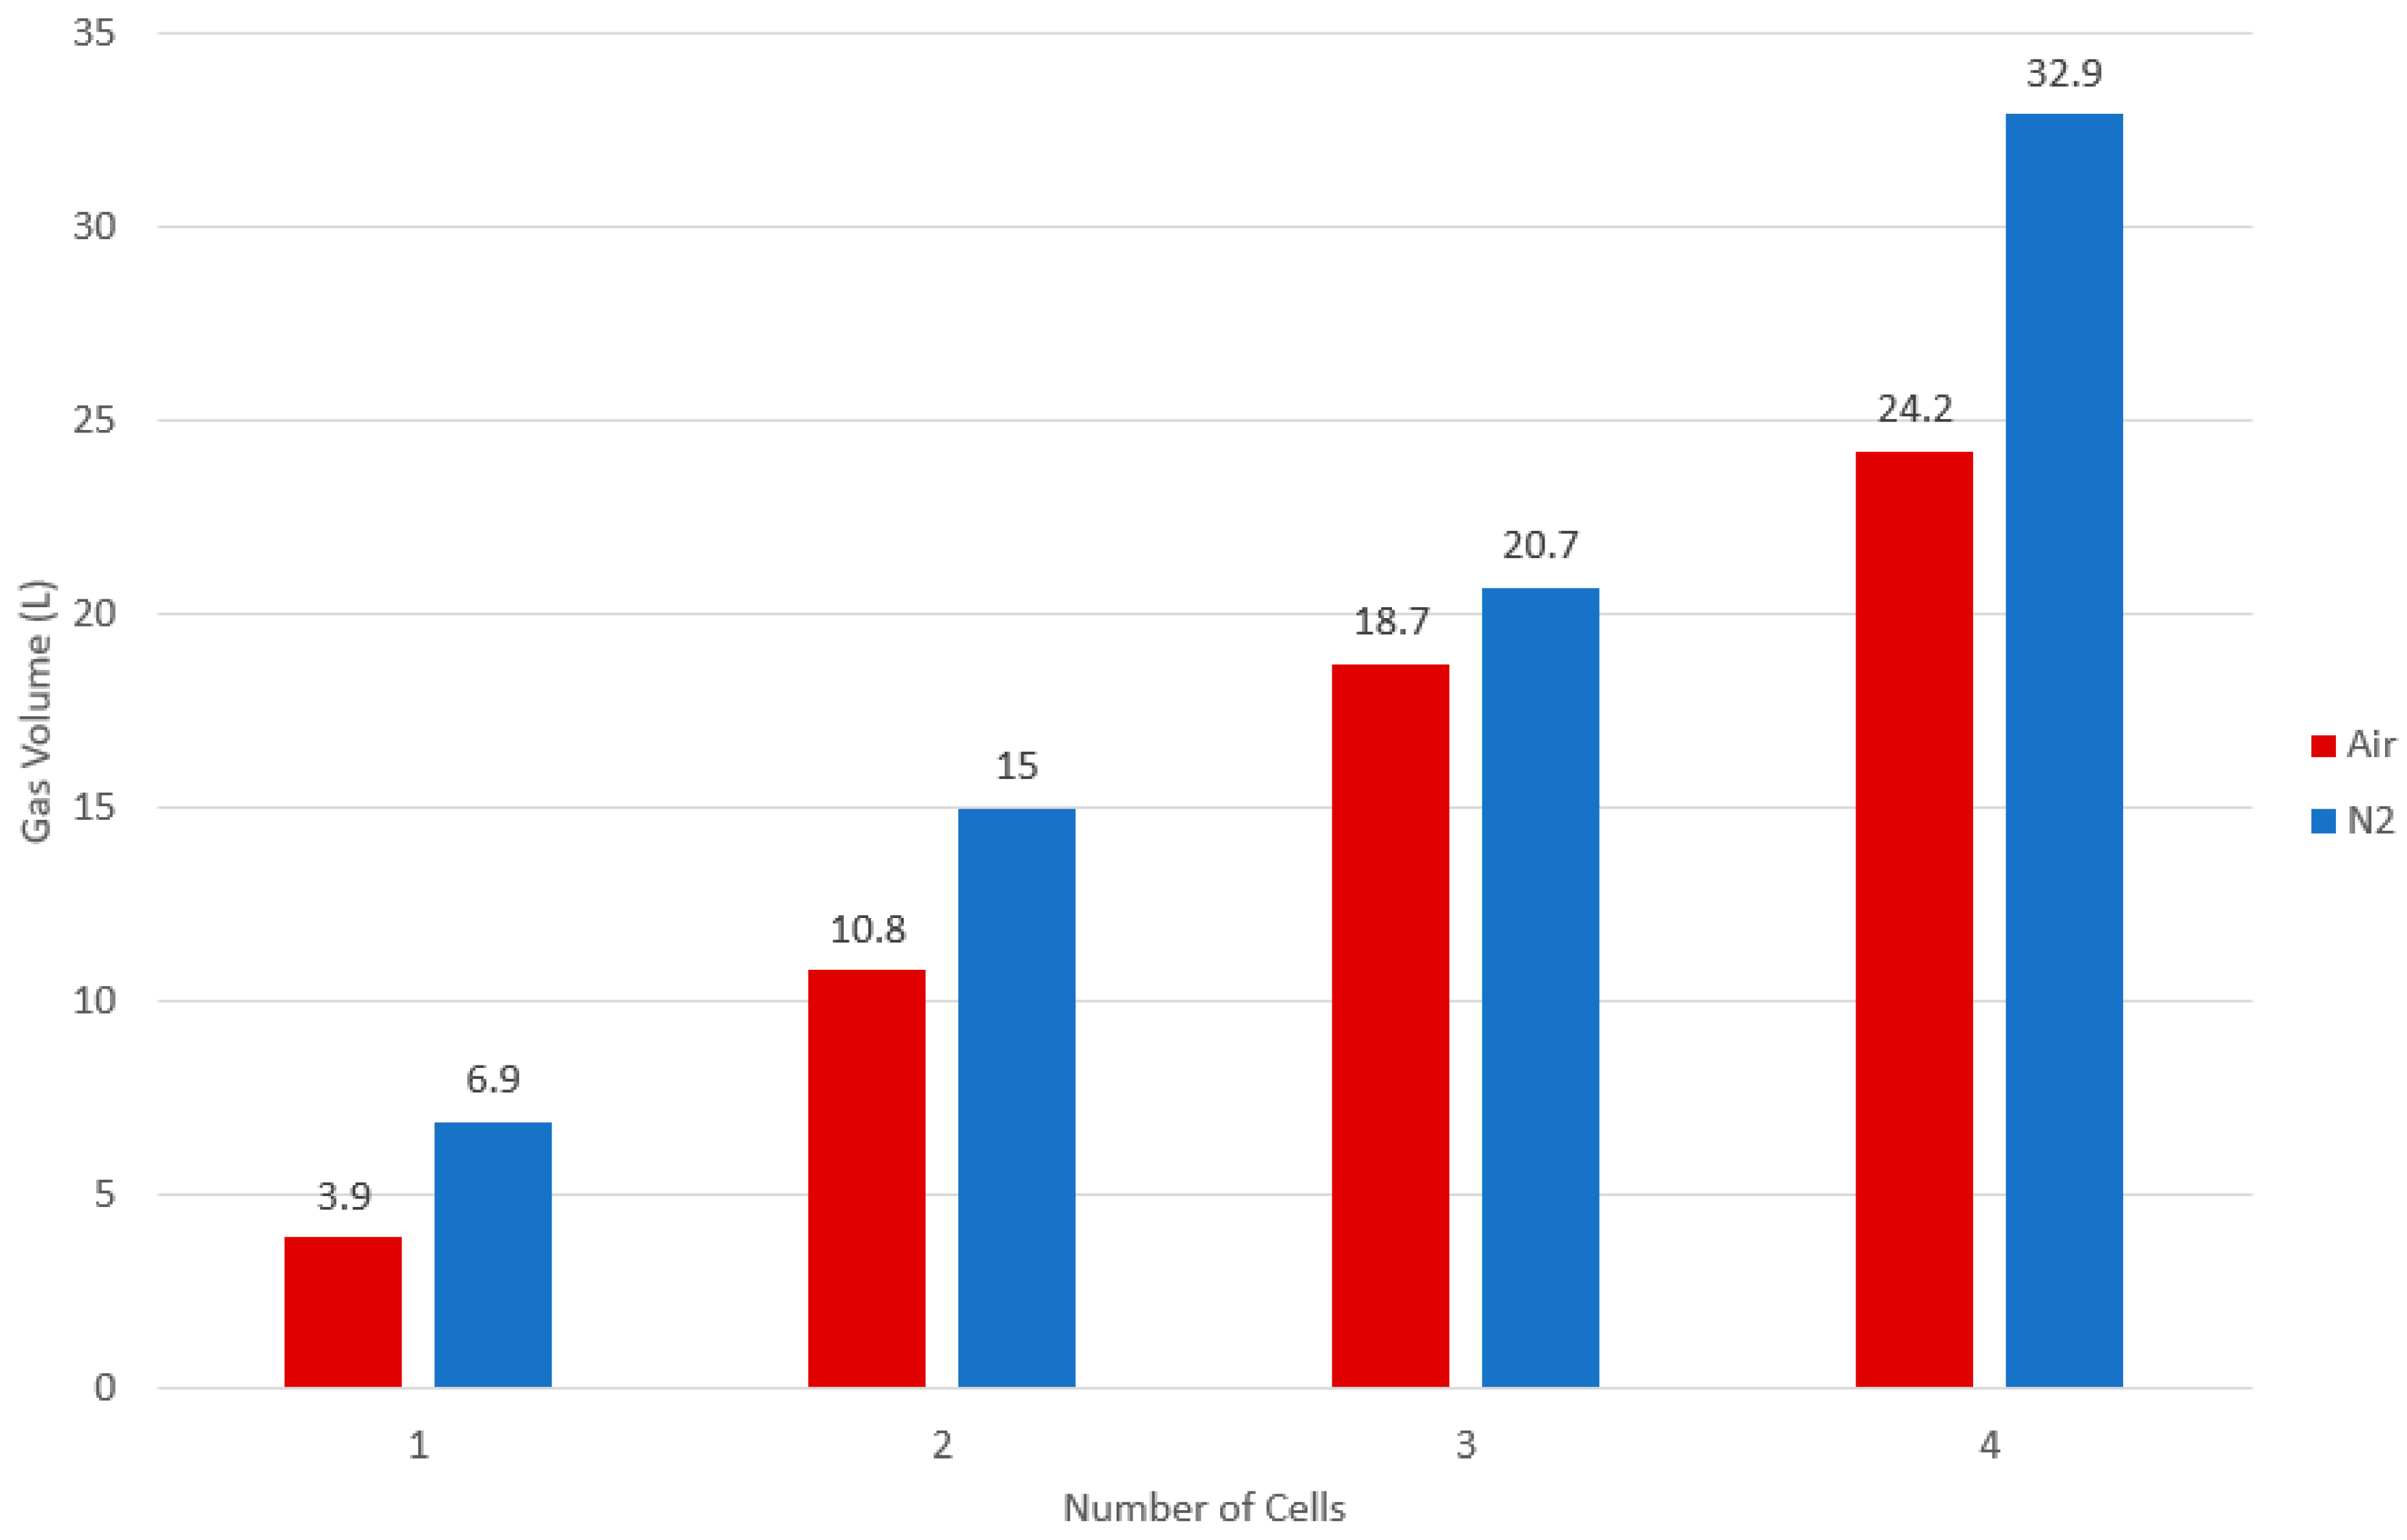
3.2. Cell Block Tests
3.2.1. Temperature Measurement
3.2.2. Pressure Measurement
3.2.3. Gas Volume
3.3. Overcharge Test Results
3.3.1. State of Charge at Failure
3.3.2. Gas Volume and Composition
3.4. Nail Penetration Test Gas Volume and Composition
3.4.1. SoC at 100%
3.4.2. SoC at 50% and 75%
4. Conclusions
Supplementary Materials
Author Contributions
Funding
Data Availability Statement
Acknowledgments
Conflicts of Interest
Abbreviations
| LiB | Li-ion battery |
| EV | Electric vehicle |
| BESS | Battery energy storage system |
| SoC | State of charge |
| TR | Thermal runaway |
| NMC | Nickel manganese cobalt oxide |
| IR | Internal resistance |
| ACIR | Alternating current internal resistance |
| CCCV | Constant current constant voltage |
| CC | Constant current |
| ICP-AES | Inductively coupled plasma atomic emission spectroscopy |
| XRF | X-ray fluorescence |
| SEM-EDS | Scanning electron microscopy–energy-dispersive spectroscopy |
| LMO | Lithium manganese oxide |
| SATP | Standard atmosphere temperature and pressure |
References
- Sasse, T.; Rutter, J.; Shepheard, M.; Norris, E. Net Zero: How Government Can Meet Its Climate Change Target; Institute for Government: London, UK, 2020. [Google Scholar]
- Gopinadh, S.V.; Anoopkumar, V.; Ansari, M.J.N.; Srivastava, D.; John, B.; Samridh, A.; Vijayakumar, P.S.; Mercy, T.D. Lithium-ion Pouch Cells: An Overview. In Energy Harvesting and Storage; Springer: Berlin/Heidelberg, Germany, 2022; pp. 209–224. [Google Scholar]
- Feng, X.; Ouyang, M.; Liu, X.; Lu, L.; Xia, Y.; He, X. Thermal runaway mechanism of lithium ion battery for electric vehicles: A review. Energy Storage Mater. 2018, 10, 246–267. [Google Scholar] [CrossRef]
- Yuan, L.; Dubaniewicz, T.; Zlochower, I.; Thomas, R.; Rayyan, N. Experimental study on thermal runaway and vented gases of lithium-ion cells. Process Saf. Environ. Prot. 2020, 144, 186–192. [Google Scholar] [CrossRef]
- Kim, J.; Mallarapu, A.; Finegan, D.P.; Santhanagopalan, S. Modeling cell venting and gas-phase reactions in 18650 lithium ion batteries during thermal runaway. J. Power Sources 2021, 489, 229496. [Google Scholar] [CrossRef]
- Mikolajczak, C.; Kahn, M.; White, K.; Long, R.T. Lithium-ion Battery Failures. In Lithium-ion Batteries Hazard and Use Assessment; Springer: Berlin/Heidelberg, Germany, 2012; pp. 43–70. [Google Scholar]
- Howard, G.; Buston, J.; Gill, J. Experimental understanding of gas volumes and forces generated due to swelling during lithium-ion pouch cell failure. In Proceedings of the Hazards 31, Virtual, 16–18 November 2021. [Google Scholar]
- Dubaniewicz, T.H.; Barone, T.L.; Brown, C.B.; Thomas, R.A. Comparison of thermal runaway pressures within sealed enclosures for nickel manganese cobalt and iron phosphate cathode lithium-ion cells. J. Loss Prev. Process Ind. 2022, 76, 104739. [Google Scholar] [CrossRef]
- Koch, S.; Fill, A.; Birke, K.P. Comprehensive gas analysis on large scale automotive lithium-ion cells in thermal runaway. J. Power Sources 2018, 398, 106–112. [Google Scholar] [CrossRef]
- Wei, N.; Li, M. Experimental study of thermal runaway process of 256Ah prismatic nickel-rich battery. Front. Energy Res. 2023, 11, 1230429. [Google Scholar] [CrossRef]
- Yan, H.; Ezekoye, O.A. State of charge effects on active material elemental composition changes between pre-thermal-runaway and post-failure states for 8-1-1 nickel-manganese-cobalt 18650 cells. J. Power Sources 2023, 63, 106974. [Google Scholar] [CrossRef]
- Sturk, D.; Rosell, L.; Blomqvist, P.; Tidblad, A.A. Analysis of Li-Ion Battery Gases Vented in an Inert Atmosphere Thermal Test Chamber. Batteries 2019, 5, 61. [Google Scholar] [CrossRef]
- Essl, C.; Golubkov, A.W.; Fuchs, A. Comparing Different Thermal Runaway Triggers for Two Automotive Lithium-Ion Battery Cell Types. J. Electrochem. Soc. 2020, 167, 130542. [Google Scholar] [CrossRef]
- Willstrand, O.; Pushp, M.; Andersson, P.; Brandell, D. Impact of different Li-ion cell test conditions on thermal runaway characteristics and gas release measurements. J. Energy Storage 2023, 68, 107785. [Google Scholar] [CrossRef]
- Zou, K.; Lu, S.; Chen, X.; Gao, E.; Cao, Y.; Bi, Y. Thermal and gas characteristics of large-format LiNi0.8Co0.1Mn0.1O2 pouch power cell during thermal runaway. J. Energy Storage 2021, 39, 102609. [Google Scholar] [CrossRef]
- Yuan, Q.; Zhao, F.; Wang, W.; Zhao, Y.; Liang, Z.; Yan, D. Overcharge failure investigation of lithium-ion batteries. Electrochim. Acta 2015, 178, 682–688. [Google Scholar] [CrossRef]
- Cai, T.; Valecha, P.; Tran, V.; Engle, B.; Stefanopoulou, A.; Siegel, J. Detection of Li-ion battery failure and venting with Carbon Dioxide sensors. eTransportation 2021, 7, 100100. [Google Scholar] [CrossRef]
- Koch, S.; Birke, K.P.; Kuhn, R. Fast Thermal Runaway Detection for Lithium-Ion Cells in Large Scale Traction Batteries. Batteries 2018, 4, 16. [Google Scholar] [CrossRef]
- Nedjalkov, A.; Meyer, J.; Köhring, M.; Doering, A.; Angelmahr, M.; Dahle, S.; Sander, A.; Fischer, A.; Schade, W. Toxic Gas Emissions from Damaged Lithium Ion Batteries—Analysis and Safety Enhancement Solution. Batteries 2016, 2, 5. [Google Scholar] [CrossRef]
- Hoelle, S.; Scharner, S.; Asanin, S.; Hinrichsen, O. Analysis on Thermal Runaway Behavior of Prismatic Lithium-Ion Batteries with Autoclave Calorimetry. J. Electrochem. Soc. 2021, 168, 120515. [Google Scholar] [CrossRef]
- Xu, C.; Fan, Z.; Zhang, M.; Wang, P.; Wang, H.; Jin, C.; Peng, Y.; Jiang, F.; Feng, X.; Ouyang, M. A comparative study of the venting gas of lithium-ion batteries during thermal runaway triggered by various methods. Cell Rep. Phys. Sci. 2023, 4, 101705. [Google Scholar] [CrossRef]
- ISO15202-2:2012; Workplace Air—Determination of Metals and Metalloids in Airborne Particulate Matter by Inductively Coupled Plasma Atomic Emission Spectrometry Part 2: Sample Preparation. ISO: Geneva, Switzerland, 2012.
- ISO 15202-3:2004; Workplace Air—Determination of Metals and Metalloids in Airborne Particulate Matter by Inductively Coupled Plasma Atomic Emission Spectrometry Part 3: Analysis. ISO: Geneva, Switzerland, 2004.
- Baird, A.R.; Archibald, E.J.; Marr, K.C.; Ezekoye, O.A. Explosion hazards from lithium-ion battery vent gas. J. Power Sources 2020, 446, 227257. [Google Scholar] [CrossRef]
- Abbott, K.C.; Buston, J.E.; Gill, J.; Goddard, S.L.; Howard, D.; Howard, G.; Read, E.; Williams, R.C. Comprehensive gas analysis of a 21700 Li(Ni0.8Co0.1Mn0.1O2) cell using mass spectrometry. J. Power Sources 2022, 539, 231585. [Google Scholar] [CrossRef]
- Said, A.O.; Lee, C.; Stoliarov, S.I.; Marshal, A.W. Comprehensive analysis of dynamics and hazards associated with cascading failure in 18650 lithium ion cell arrays. Appl. Energy 2019, 248, 415–428. [Google Scholar] [CrossRef]
- Archibald, E.; Kennedy, R.; Marr, K.; Jeevarajan, J.; Ezekoye, O. Characterization of Thermally Induced Runaway in Pouch Cells for Propagation. Fire Technol. 2020, 56, 2467–2490. [Google Scholar] [CrossRef]
- Laruelle, S.; Forestier, C.; Lecocq, A.; Zantman, A.; Grugeon, S.; Sannier, L.; Marlair, G. Study of the Role of LiNi1/3Mn1/3Co1/3O2/Graphite Li-Ion Pouch Cells Confinement, Electrolyte Composition and Separator Coating on Thermal Runaway and Off-Gas Toxicit. J. Electrochem. Soc. 2020, 167, 090513. [Google Scholar] [CrossRef]
- Mao, B.; Chen, H.; Cui, Z.; Wu, T.; Wang, Q. Failure mechanism of the lithium ion battery during nail penetration. Int. J. Heat Mass Transf. 2018, 122, 1103–1115. [Google Scholar] [CrossRef]


| Cell Characterisation | Charging Routine Parameters | ||
|---|---|---|---|
| Nominal capacity (Ah) | 5 | Lower discharge voltage (V) | 2.75 |
| Nominal cell voltage (V) | 3.65 | Upper charge voltage (V) | 4.2 |
| Actual capacity (Ah) | 4.8 * | Cut-off current (A) | 0.5 |
| Cell chemistry | NMC | Charge rate (CCCV) (A) | 1.0 |
| Internal resistance (mΩ) | 32 * | Discharge rate (CC) (A) | 1.0 |
| Dimensions (mm) | 60 × 90 × 5 | ||
| Weight (g) | 76 | ||
| Element | ICP-AES (%wt.) | XRF (%wt.) |
|---|---|---|
| Ni | 45.7 | 48.0 |
| Co | 11.7 | 11.6 |
| Mn | 42.6 | 39.7 |
| Other | - | 0.7 |
| Overcharge Rate (A) | Cell Constrained? | Atmosphere | Number of Tests | Number of Tests with Gas Samples |
|---|---|---|---|---|
| 5 (1 C) | Yes | Air | 3 | 2 |
| 5 (1 C) | Yes | N2 | 3 | 2 |
| 5 (1 C) | No | Air | 3 | 0 |
| 5 (1 C) | No | N2 | 3 | 1 |
| 2.5 (0.5 C) | Yes | N2 | 2 | 2 |
| 10 (2 C) | Yes | N2 | 2 | 2 |
| Atmosphere | Average Net Gas Volume Increase (L) | Average Volume/Ah Stored (L/Ah) | Average v/v% Gas Composition | |||||||
|---|---|---|---|---|---|---|---|---|---|---|
| H2 | CO2 | CO | C2H6 | C2H4 | C3H8 | C3H6 | CH4 | |||
| Air | 3.9 | 0.78 | 6.1 | 40.9 | 47.1 | 0.3 | 2.2 | 0.7 | 0.3 | 2.4 |
| N2 | 6.9 | 1.37 | 24.9 | 19.9 | 34.3 | 3.3 | 8.4 | 2.5 | 1.4 | 5.6 |
| SoC (%) | Average v/v% Gas Composition | |||||||
|---|---|---|---|---|---|---|---|---|
| H2 | CO2 | CO | C2H6 | C2H4 | C3H8 | C3H6 | CH4 | |
| 5 | 7.5 | 66.4 | 4.0 | 2.6 | 5.2 | 7.6 | 1.7 | 5.3 |
| 25 | 14.9 | 61.1 | 2.1 | 1.5 | 5.5 | 9.1 | 2.5 | 3.5 |
| 50 | 30.7 | 42.7 | 10.0 | 1.0 | 3.9 | 5.4 | 2.2 | 4.3 |
| 75 | 25.2 | 47.7 | 8.1 | 2.6 | 5.1 | 4.7 | 2.7 | 4.1 |
| 100 | 24.9 | 19.9 | 34.3 | 3.3 | 8.4 | 2.5 | 1.4 | 5.6 |
| Test Number | Charging Rate/Test Setupp | Gas Volume Increase (L) | Failure SoC (%) | Charge Stored at Failure (Ah) | Volume/Ah Stored at Failure (L) |
|---|---|---|---|---|---|
| 15 | 5 A air constrained | 7.0 | 149 | 7.46 | 0.94 |
| 16 | 5.9 | 148 | 7.40 | 0.80 | |
| 17 | 6.3 | 143 | 7.15 | 0.88 | |
| 18 | 5 A N2 constrained | 11.1 | 148 | 7.40 | 1.50 |
| 19 | 11.6 | 147 | 7.32 | 1.58 | |
| 20 | 11.1 | 150 | 7.48 | 1.48 | |
| 21 | 2.5 A N2 constrained | 11.5 | 137 | 6.83 | 1.68 |
| 22 | 12.3 | - | - | - | |
| 23 | 10 A N2 constrained | 10.7 | 187 | 9.35 | 1.14 |
| 24 | 11.9 | 192 | 9.60 | 1.24 | |
| 25 | 5 A air unconstrained | 4.5 | 149 | 7.45 | 0.60 |
| 26 | 4.6 | 143 | 7.15 | 0.64 | |
| 27 | 4.3 | 142 | 7.10 | 0.61 | |
| 28 | 5 A N2 unconstrained | 11.6 | 122 | 6.10 | 1.90 |
| 29 | 11.3 | 143 | 7.15 | 1.58 | |
| 30 | 11.9 | 142 | 7.10 | 1.68 |
| Atmosphere Test Setup | Average Net Gas Volume Increase (L) | Average v/v% Gas Composition | |||||||
|---|---|---|---|---|---|---|---|---|---|
| H2 | CO2 | CO | C2H6 | C2H4 | C3H8 | C3H6 | CH4 | ||
| 5 A Air constrained | 6.4 | 8.3 | 38.5 | 46.2 | 1.3 | 2.5 | 0.5 | 0.4 | 2.6 |
| 5 A N2 constrained | 11.3 | 25.0 | 19.2 | 33.8 | 3.7 | 9.7 | 2.6 | 1.4 | 4.8 |
| 2.5 A N2 constrained | 11.9 | 26.9 | 35.0 | 16.4 | 3.3 | 10.4 | 3.2 | 1.6 | 3.5 |
| 10 A N2 constrained | 11.3 | 23.8 | 31.3 | 14.7 | 4.6 | 15.3 | 3.5 | 2.6 | 4.6 |
| 5 A N2 unconstrained | 11.6 | 25.6 | 18.4 | 28.8 | 4.1 | 13.7 | 1.4 | 1.3 | 6.8 |
| Atmopshere | Average Net Gas Volume Increase (L) | Average Volume/Ah Stored (L) | Average v/v % Gas Composition | |||||||
|---|---|---|---|---|---|---|---|---|---|---|
| H2 | CO2 | CO | C2H6 | C2H4 | C3H8 | C3H6 | CH4 | |||
| Air | 8.9 | 1.78 | 16.8 | 52.6 | 6.5 | 3.8 | 11.5 | 3.6 | 2.0 | 3.3 |
| N2 | 10.7 | 2.14 | 24.2 | 43.8 | 6.8 | 3.6 | 12.7 | 3.4 | 2.0 | 2.7 |
Disclaimer/Publisher’s Note: The statements, opinions and data contained in all publications are solely those of the individual author(s) and contributor(s) and not of MDPI and/or the editor(s). MDPI and/or the editor(s) disclaim responsibility for any injury to people or property resulting from any ideas, methods, instructions or products referred to in the content. |
© 2025 by the authors. Licensee MDPI, Basel, Switzerland. This article is an open access article distributed under the terms and conditions of the Creative Commons Attribution (CC BY) license (https://creativecommons.org/licenses/by/4.0/).
Share and Cite
Howard, G.E.; Abbott, K.C.; Buston, J.E.H.; Gill, J.; Goddard, S.L.; Howard, D. Comprehensive Study of the Gas Volume and Composition Generated by 5 Ah Nickel Manganese Cobalt Oxide (NMC) Li-Ion Pouch Cells Through Different Failure Mechanisms at Varying States of Charge. Batteries 2025, 11, 197. https://doi.org/10.3390/batteries11050197
Howard GE, Abbott KC, Buston JEH, Gill J, Goddard SL, Howard D. Comprehensive Study of the Gas Volume and Composition Generated by 5 Ah Nickel Manganese Cobalt Oxide (NMC) Li-Ion Pouch Cells Through Different Failure Mechanisms at Varying States of Charge. Batteries. 2025; 11(5):197. https://doi.org/10.3390/batteries11050197
Chicago/Turabian StyleHoward, Gemma E., Katie C. Abbott, Jonathan E. H. Buston, Jason Gill, Steven L. Goddard, and Daniel Howard. 2025. "Comprehensive Study of the Gas Volume and Composition Generated by 5 Ah Nickel Manganese Cobalt Oxide (NMC) Li-Ion Pouch Cells Through Different Failure Mechanisms at Varying States of Charge" Batteries 11, no. 5: 197. https://doi.org/10.3390/batteries11050197
APA StyleHoward, G. E., Abbott, K. C., Buston, J. E. H., Gill, J., Goddard, S. L., & Howard, D. (2025). Comprehensive Study of the Gas Volume and Composition Generated by 5 Ah Nickel Manganese Cobalt Oxide (NMC) Li-Ion Pouch Cells Through Different Failure Mechanisms at Varying States of Charge. Batteries, 11(5), 197. https://doi.org/10.3390/batteries11050197