Article

Investigation of Thermal Runaway in Prismatic Batteries with Dual-Parallel Jelly-Roll Architecture Under Thermal Abuse Conditions

1
Tianjin Fire Research Institute of M.E.M., Jinnan Road 110, Tianjin 300381, China
2
Fire Protection Engineering Academy, China People’s Police University, Xichang Road 220, Langfang 065000, China
*
Author to whom correspondence should be addressed.
Batteries 2025, 11(5), 196; https://doi.org/10.3390/batteries11050196
Submission received: 6 March 2025 / Revised: 29 April 2025 / Accepted: 12 May 2025 / Published: 16 May 2025

Abstract

:
In response to the increasingly serious global warming crisis, new energy batteries have progressively replaced highly polluting primary energy sources. Lithium-ion batteries (LIBs) are widely implemented due to their high safety and energy density. Although LIBs exhibit enhanced safety features, significant fire risks persist during thermal runaway (TR) events occurring in charging/discharging processes. To elucidate dual-parallel jelly-roll architecture TR characteristics of LIBs under varied operational conditions, this study integrates theoretical analysis with experimental methods, conducting thermal abuse tests under four distinct working conditions: open circuit, constant-current charging, constant-voltage charging, and discharging. The results demonstrate substantial differences in TR characteristics across operational conditions. A thermodynamic equilibrium-based triggering model proved capable of qualitatively evaluating TR risk levels under these conditions. Furthermore, the established TR triggering model reveals that the intensified Joule heating and polarization effects during constant-current charging account for its elevated fire risk compared to other states. These findings provide operational guidelines for optimizing safety strategies in energy storage power stations.

1. Introduction

The global energy storage installed capacity surpassed 1200 GWh in 2024 [1], marking vigorous development in the battery industry. While the safety characteristics of high-energy-density batteries have garnered widespread attention, current research predominantly focuses on improving the intrinsic thermal stability of materials [2,3,4], yet largely overlooks the regulatory mechanisms of geometric configurations on critical thermal runaway parameters (triggering thresholds and propagation rates). Battery structure plays a decisive role in thermal safety performance, particularly demonstrating significant structural sensitivity in energy transfer during internal thermal runaway [5]. Synchronized thermal–electrochemical mapping experiments confirm that structural configurations exert substantially greater influence on thermal runaway propagation patterns than electrochemical attributes [6,7]. Conventional thermal runaway models oversimplify batteries as homogeneous entities [8,9], failing to characterize the anisotropic heat transfer characteristics inherent to wound structures [10]. These theoretical limitations are further exacerbated by the complexity of interfacial contact dynamics [11].
Batteries can be categorized into four geometric topologies, single-layer jelly-roll, dual-parallel jelly-roll architecture, multi-tab segmented winding, and shaped winding topology, with their structural characteristics detailed in Table 1. Batteries employing the dual-parallel jelly-roll architecture, leveraging their spatial efficiency and scalable manufacturing features [2,12], have emerged as the preferred solution for grid-scale energy storage systems.
The triggering of thermal runaway in single cells exhibits strong interdependence with transient thermal coupling between jelly-roll structures [13,14]. Therefore, a large number of scholars have begun to study the TR of lithium-ion batteries, and the common causes of TR include mechanical abuse [6,8], electrical abuse [2,14], and thermal abuse [10]. Mechanical abuse is generally caused by needle puncture or impact to make the battery exhibit TR behavior. Previous studies have extensively investigated the depth [11], speed, and position of needle puncture; electrical abuse involves overcharging and overdischarging of the battery, and some scholars have conducted in-depth research on charging rate, overcharging time, etc., in this regard. Battery capacity and charge state have also been found to have a great impact on the internal short circuit of the battery [7]. Thermal abuse is triggered by high temperature causing uncontrollable chain reactions in the battery. Some scholars have also studied the influence of factors such as the heating power [15] and heating position [1,16] of the heating plate on TR characteristics. In daily life, TR often occurs during charging and discharging stages. At this time, the state of charge (SOC) inside the battery is mostly around 75%, not reaching the level of overcharging [5,17]. The charging stage can be divided into constant-voltage charging and constant-current charging. The TR characteristics in different stages may be different, so the hazards exhibited by TR will also vary. In this study, we will conduct qualitative theoretical analysis to evaluate the TR risk levels under different working conditions. We will conduct thermal abuse experiments on four different working states: open circuit, constant-voltage charging, constant-current charging, and discharging. By simulating the situation where TR occurs in the battery under actual working conditions, this study will deeply explore the TR characteristics of lithium-ion battery cells under different working conditions.

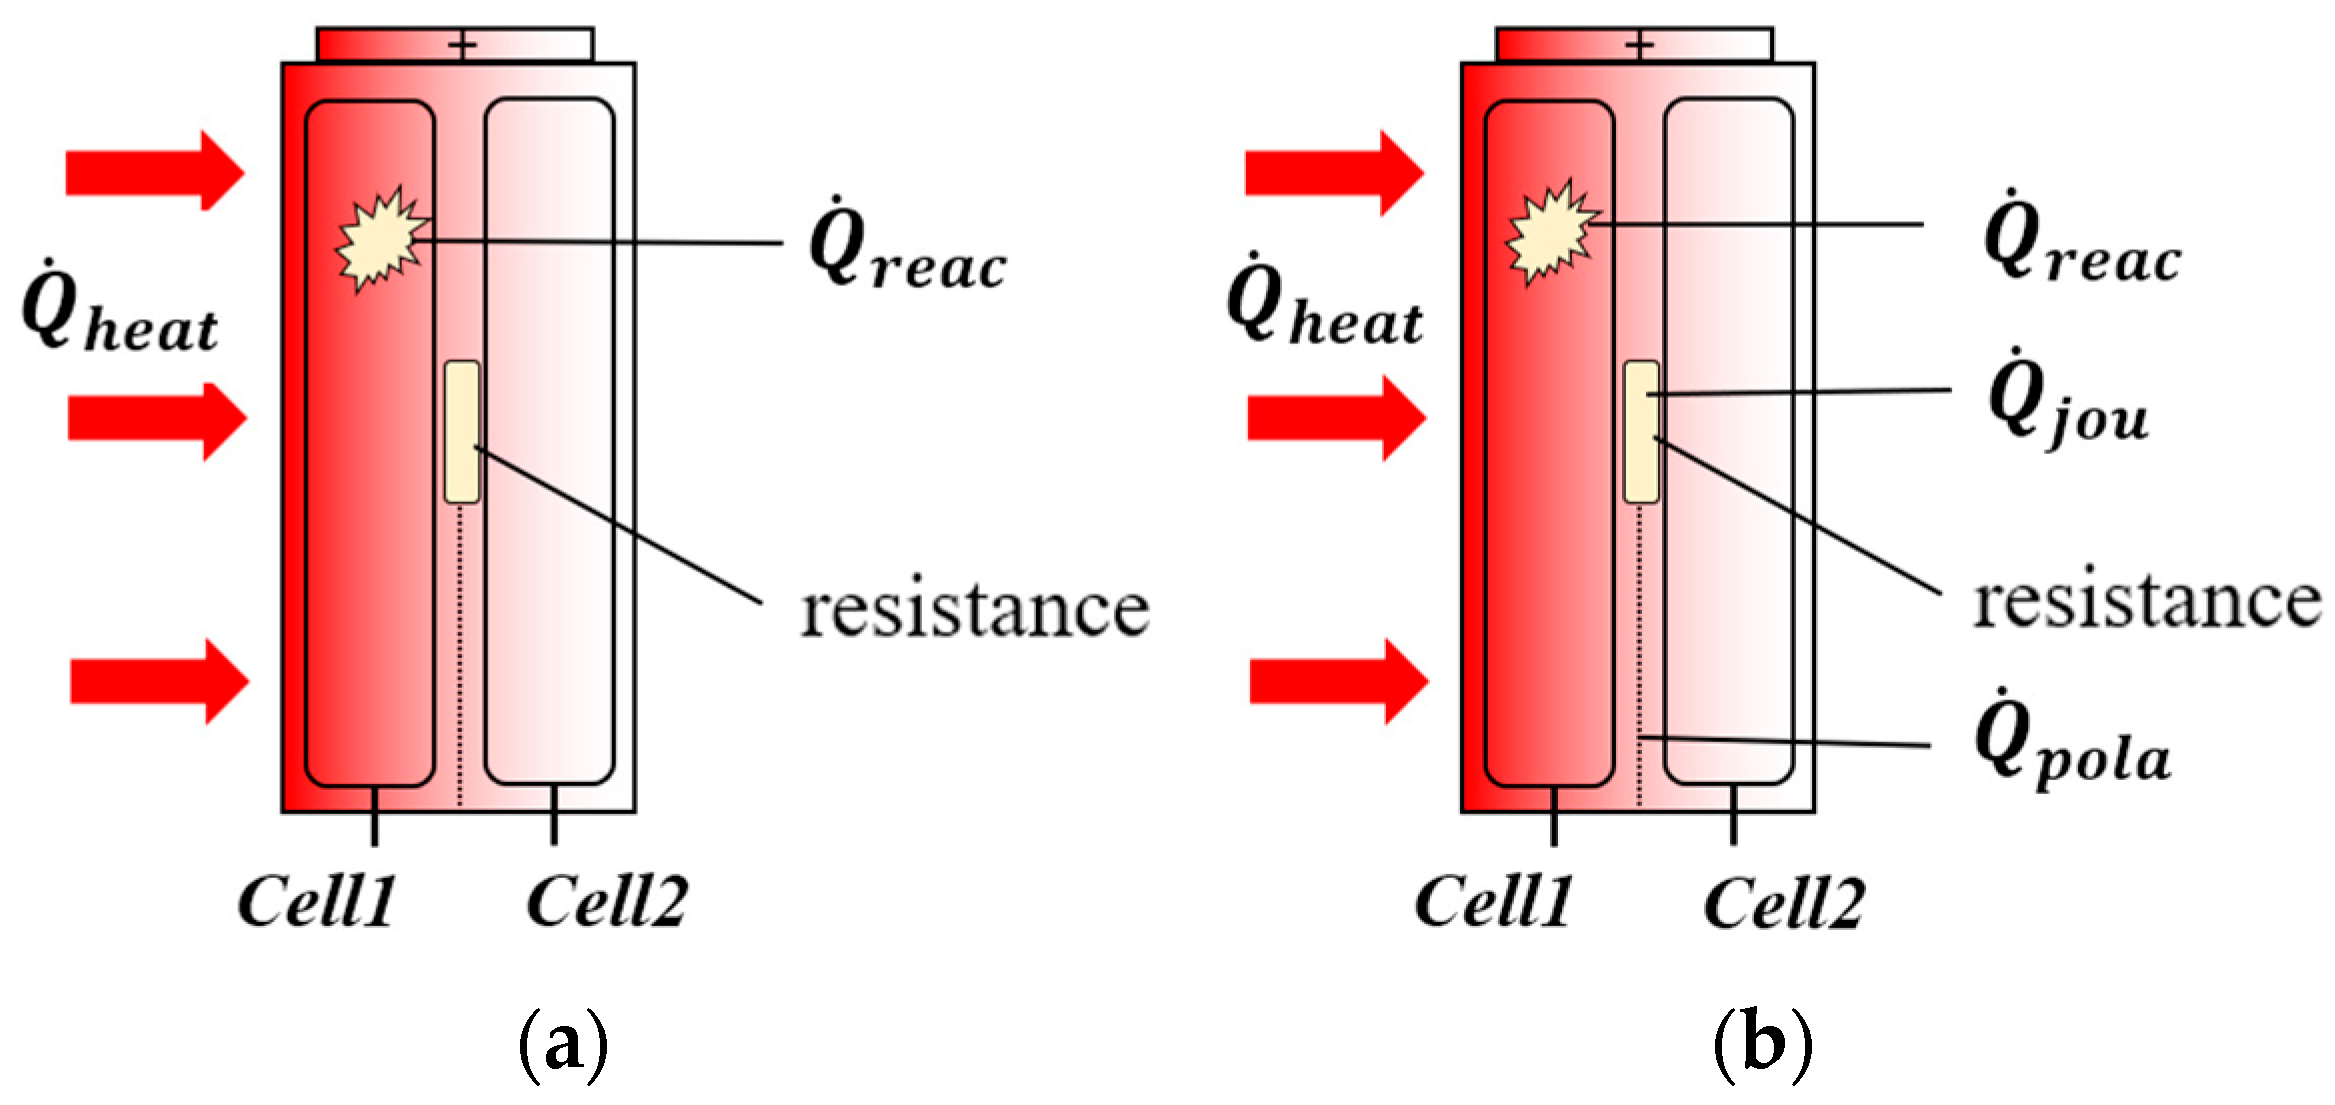
2. TR Triggering Model

2.1. Mathematical Characterization of Trigger Conditions for TR

In this model, all heat sources are represented in terms of power (W) to ensure dimensional consistency between energy accumulation in the heat balance equation and the input/output power.
In order to clearly explain the heat change of a lithium-ion battery under different working conditions, the heat production and heat dissipation factors of a lithium-ion battery under the conditions of an open circuit and operating state (charge and discharge state) were analyzed, respectively, and the heat production paths under different working conditions were analyzed. On this basis, the TR mathematical representation model under different working conditions is established via the heat balance equation. The open state refers to the physical state when the battery is not connected to an external circuit and is neither charged nor discharged. Currently, the internal battery is in electrochemical dynamic equilibrium, and the electrochemical reaction is slow and usually does not release obvious heat and gas. Therefore, the TR of the lithium-ion battery in the open state is mainly triggered by the external heating plate. The heat flux of the heating plate is expressed by q , and the heat transferred through contact with the battery surface is expressed by Q ˙ h e a t , as shown in Equation (1).
Q ˙ h e a t = q A
where q is the heat flow density, expressed in kJ/m2; A is the contact area, expressed in m2.
In addition, with the increase in heating time, the internal temperature of the battery rises, triggering chemical reactions such as the decomposition of the SEI film and the electrolyte, further generating heat and providing conditions for the thermal runaway of the lithium-ion battery. These reactions produce heat, expressed by Q ˙ r e c a , as shown in Equation (2).
Q ˙ r e a c = n i H i d δ d t
where n i is the number of moles of the substance produced by the reaction, expressed in mol; H i is the enthalpy change of the reaction, expressed in kJ/mol. d δ d t is the reaction rate, in units of mol/s.
Therefore, under the open-circuit state of the lithium-ion battery, heat sources include the heating plate’s heat transfer Q ˙ h e a t which is produced as a result of the heat of the chemical reaction Q ˙ r e a c (see Figure 1a). Unlike the open-circuit state, the internal chemical reactions of LFP cells in the working state are more complex and produce more heat. Therefore, in the working state, in addition to the above heat sources, due to the internal current, the battery itself will also generate Joule heat and polarization heat, which are represented by Q ˙ j o u and Q ˙ p o l a , respectively (see Figure 1b).
The magnitude of Joule heat and polarization heat is determined by the current, and their expressions are shown in Equation (3) and Equation (4), respectively.
Q ˙ j o u = I 1 2 R i n t
Q ˙ p o l a = I 2 η
Among them, I 1 is the working current of the battery, R i n t is battery internal resistance, I 2 is the effective current electrochemical reaction, and η is the polarization potential.
Therefore, according to the analysis, the heat sources of the lithium-ion battery open-circuit state and charge–discharge state can be expressed by Equation (5) and Equation (6), respectively.
Q ˙ i n , o p e n = Q ˙ h e a t + Q ˙ r e a c
Q ˙ i n , o p e r = Q ˙ h e a t + Q ˙ r e a c + Q ˙ j o u + Q ˙ p o l a
Because the LFP battery is at room temperature, when the temperature of the battery rises, a temperature difference between the inside and outside of the battery will occur, and the battery will begin to lose heat in the form of heat conduction ( Q ˙ c o n d ), thermal convection ( Q ˙ c o n v ), and thermal radiation ( Q ˙ r a d ). The calculation of heat conduction is shown in Equation (7).
Q ˙ c o n d = k A e n v i d T d x
where k indicates the thermal conductivity of the battery, with the unit being W∙m−1∙k−1. A e n v i represents the area of heat conduction, with the unit being m2; d T d x represents the temperature gradient, expressed in K/m.
The heat convection of the battery is expressed by Equation (8).
Q ˙ c o n v = h A e n v i ( T s u r T a m b )
where h is the convective heat transfer coefficient, with the unit being W∙m−2·k−1; A e n v i is the convection heat transfer area, with the unit being m2; T s u r is the battery surface temperature, with the unit being K; T a m b is the ambient temperature, with the unit being K.
The thermal radiation of the battery is shown in Equation (9):
Q ˙ r a d = ϵ σ A e n v i ( T s u r 4 T a m b 4 )
where ϵ is the surface emissivity; σ is the Stefan–Boltzmann constant.
Under different working conditions, the heat dissipation path of lithium-ion batteries is the same, and heat is lost to the external environment through heat transfer ( Q ˙ c o n d ), heat convection ( Q ˙ c o n v ), and heat radiation ( Q ˙ r a d ); so, the heat loss of lithium-ion batteries can be expressed by Equation (10).
Q ˙ l o s s = Q ˙ c o n d + Q ˙ c o n v + Q ˙ r a d
Assuming that the battery and the environment are in a closed system, the heat balance equation is established for the battery in the open state and the battery in the charge and discharge state, as shown in (11) and (12), respectively.
m C p d T d t = Q ˙ h e a t + Q ˙ r e a c Q ˙ c o n d Q ˙ c o n v Q ˙ r a d
m C p d T d t = Q ˙ h e a t + Q ˙ r e a c + Q ˙ j o u + Q ˙ p o l a Q ˙ c o n d Q ˙ c o n v Q ˙ r a d
In Equations (10) and (11), m is the mass of the battery, and the unit is kg; C p is the specific heat capacity of the battery, and the unit is J·kg−1·K−1; d T d t indicates the battery temperature change rate with time, and the unit is K/s.
By substituting Equations (1), (2), and (7)–(9) into Equation (11), the heat balance equation of the battery in the open state can be obtained, as shown in Equation (13).
m C p d T d t = q A + n i H i d δ d t + k A e n v i d T d x h A e n v i ( T s u r T a m b ) ϵ σ A e n v i ( T s u r 4 T a m b 4 )
Substituting Equations (1)–(4) and (7)–(9) into Equation (12) yields the thermal balance equation of the battery under both charging and discharging states, as presented in Equation (14).
m C p d T d t = q A + n i H i d δ d t + I 1 2 R i n t + I 2 η + k A e n v i d T d x h A e n v i ( T s u r T a m b ) ϵ σ A e n v i ( T s u r 4 T a m b 4 )
The thermal balance equation in Equation (14) is formulated as a lumped parameter model that neglects spatial heat conduction terms. Since this approach is evidently invalid under real operating conditions, the battery’s thermal balance equations for both charging and discharging states are therefore modified to incorporate a distributed parameter framework, as shown in Equation (15).
m C p d T d t = d d x k x d T d x + d d y ( k y d T d y ) + d d z k z d T d z + q A + n i H i d δ d t + I 1 2 R i n t + I 2 η + k A e n v i d T d x h A e n v i ( T s u r T a m b ) ϵ σ A e n v i ( T s u r 4 T a m b 4 )

2.2. Prediction of TR Behavior

2.2.1. TR Trigger Time

The triggering time of TR is determined by the competitive relationship between the heat production rate Q ˙ i n and the heat dissipation rate Q ˙ l o s s . When the heat generation rate is greater than the heat dissipation rate and the temperature change rate d T d t is greater than 0, the system enters the TR critical state. Therefore, the TR critical state in the open state and the charge and discharge state can be expressed by the inequalities in (16) and (17), respectively.
q A + n i H i d δ d t > m C p d T d t k A e n v i d T d x + h A e n v i ( T s u r T a m b ) + ϵ σ A e n v i ( T s u r 4 T a m b 4 )
q A + n i H i d δ d t + I 1 2 R i n t + I 2 η > m C p d T d t k A e n v i d T d x + h A e n v i ( T s u r T a m b ) + ϵ σ A e n v i ( T s u r 4 T a m b 4 )
The difference in TR trigger time can be judged by the heat production rate of the battery under different working conditions. According to the analysis of Equations (16) and (17), only heating plate heat and self-discharge heat are generated in the open state of the battery, and the rate is significantly lower than that in the charge and discharge state, so the TR trigger time is the longest. In the charging process, the Joule heat and electrochemical polarization heat production rate of the constant-current charging state are higher than those of the constant-voltage charging state where the current gradually decays due to the continuous high current level; so, the constant-current charging state is more likely to trigger TR. In the discharge state, due to the transfer of part of the energy to the load, the overall heat production rate is lower than that in the charging state, but due to the internal Joule heat and polarization heat accumulation, the TR triggering time will be shorter than that in the open state. In summary, the TR trigger time of each state is ordered from fast to slow as follows: constant-current charging, constant-voltage charging, discharge, and open circuit.

2.2.2. Loss of Quality Due to Thermal Runaway Mass

According to the law of mass conservation during battery thermal runaway, the gaseous products are assumed to fully dissipate into the atmosphere following the activation of the pressure relief valve, while the solid particulates are partially ejected when the gas erupts and partially retained within the cell, resulting in the mass variation described by Equation (18).
m = ( α i n i M i g a s ) + ( β j n j M j s o l i d )
where   m is the drop in mass of the reaction, expressed in kg. α i is the escape ratio of the i-th gaseous product ( 0 α 1 ), β j is escape ratio of the j-th solid product ( 0 β 1 ), and M is the molar mass, with the unit being g/mol. n is the reaction stoichiometric number, and the unit is mol.
In chemical reactions, the change in enthalpy ( H ) is usually related to the mass of the reactants. A reaction can be related by the molar enthalpy ( H ) of the reaction (change in heat produced per mole) to the mass of the substances involved in the reaction, and they are related as follows:
H = H r e c n × m
where H r e c is the molar enthalpy, expressed in kJ; n is the amount of substance, expressed in mol.
Equation (19) is substituted into Equations (16) and (17), and Equations (20) and (21) under the open state and charge and discharge state are obtained, respectively. Since the heat dissipation rate of the battery under different working states is the same, the heat dissipation rate is expressed by Q l o s s .
m > m C p d T d t + Q l o s s q A H r e c
m > m C p d T d t + Q l o s s q A I 1 2 R i n t I 2 η H r e c
According to Equations (21) and (22), in the state of charge and discharge, the smaller the value on the right side of the inequality sign, the easier it is for the battery to achieve the trigger condition of thermal runaway, so the charge and discharge state will lose more mass than in the open state. Similarly, since the current in the later stage of the constant-voltage charging state gradually decreases, while the current in the constant-current charging state remains consistently high, it can be seen from Formula (21) that the mass loss of the battery in the constant-voltage charging state is smaller than that in the constant-current charging state. The heat production rate of the discharge state is still less than that of the state charging. Therefore, the quality loss caused by battery TR under different working conditions is predicted from large to small as follows: constant-current charging, constant-voltage charging, discharge, and open circuit.

2.2.3. Battery Cell TR Interval

We can divide both sides of Equations (13) and (15) by m C p to find the relationship between temperature gradient and heat, as shown in Equations (22) and (23).
d T d t = q A + n H Q l o s s m C p
d T d t = q A + n H + I 1 2 R i n t + I 2 η Q l o s s m C p
Since there is no internal current in the open state, the heat production rate is the lowest, the temperature rise is the slowest, and the propagation time is the longest. In the condition of constant current due to the current (I) remaining high, the Joule heat Q j o u and polarization heat Q p o l a are the largest, the heat output rate is the highest, the rise in temperature is the fastest, resulting in the shortest travel time. In the discharge state, part of the energy inside the battery is transferred to the load, so compared with constant-voltage charging and constant-current charging, the TR propagation interval between the battery cells in the discharge state is longer, but it is still shorter than in the open state. Therefore, the TR propagation time interval between internal cells under different working conditions is predicted from long to short as follows: open-circuit state, discharge state, constant-voltage charging state, and constant-current charging state.

3. Experimental Designs

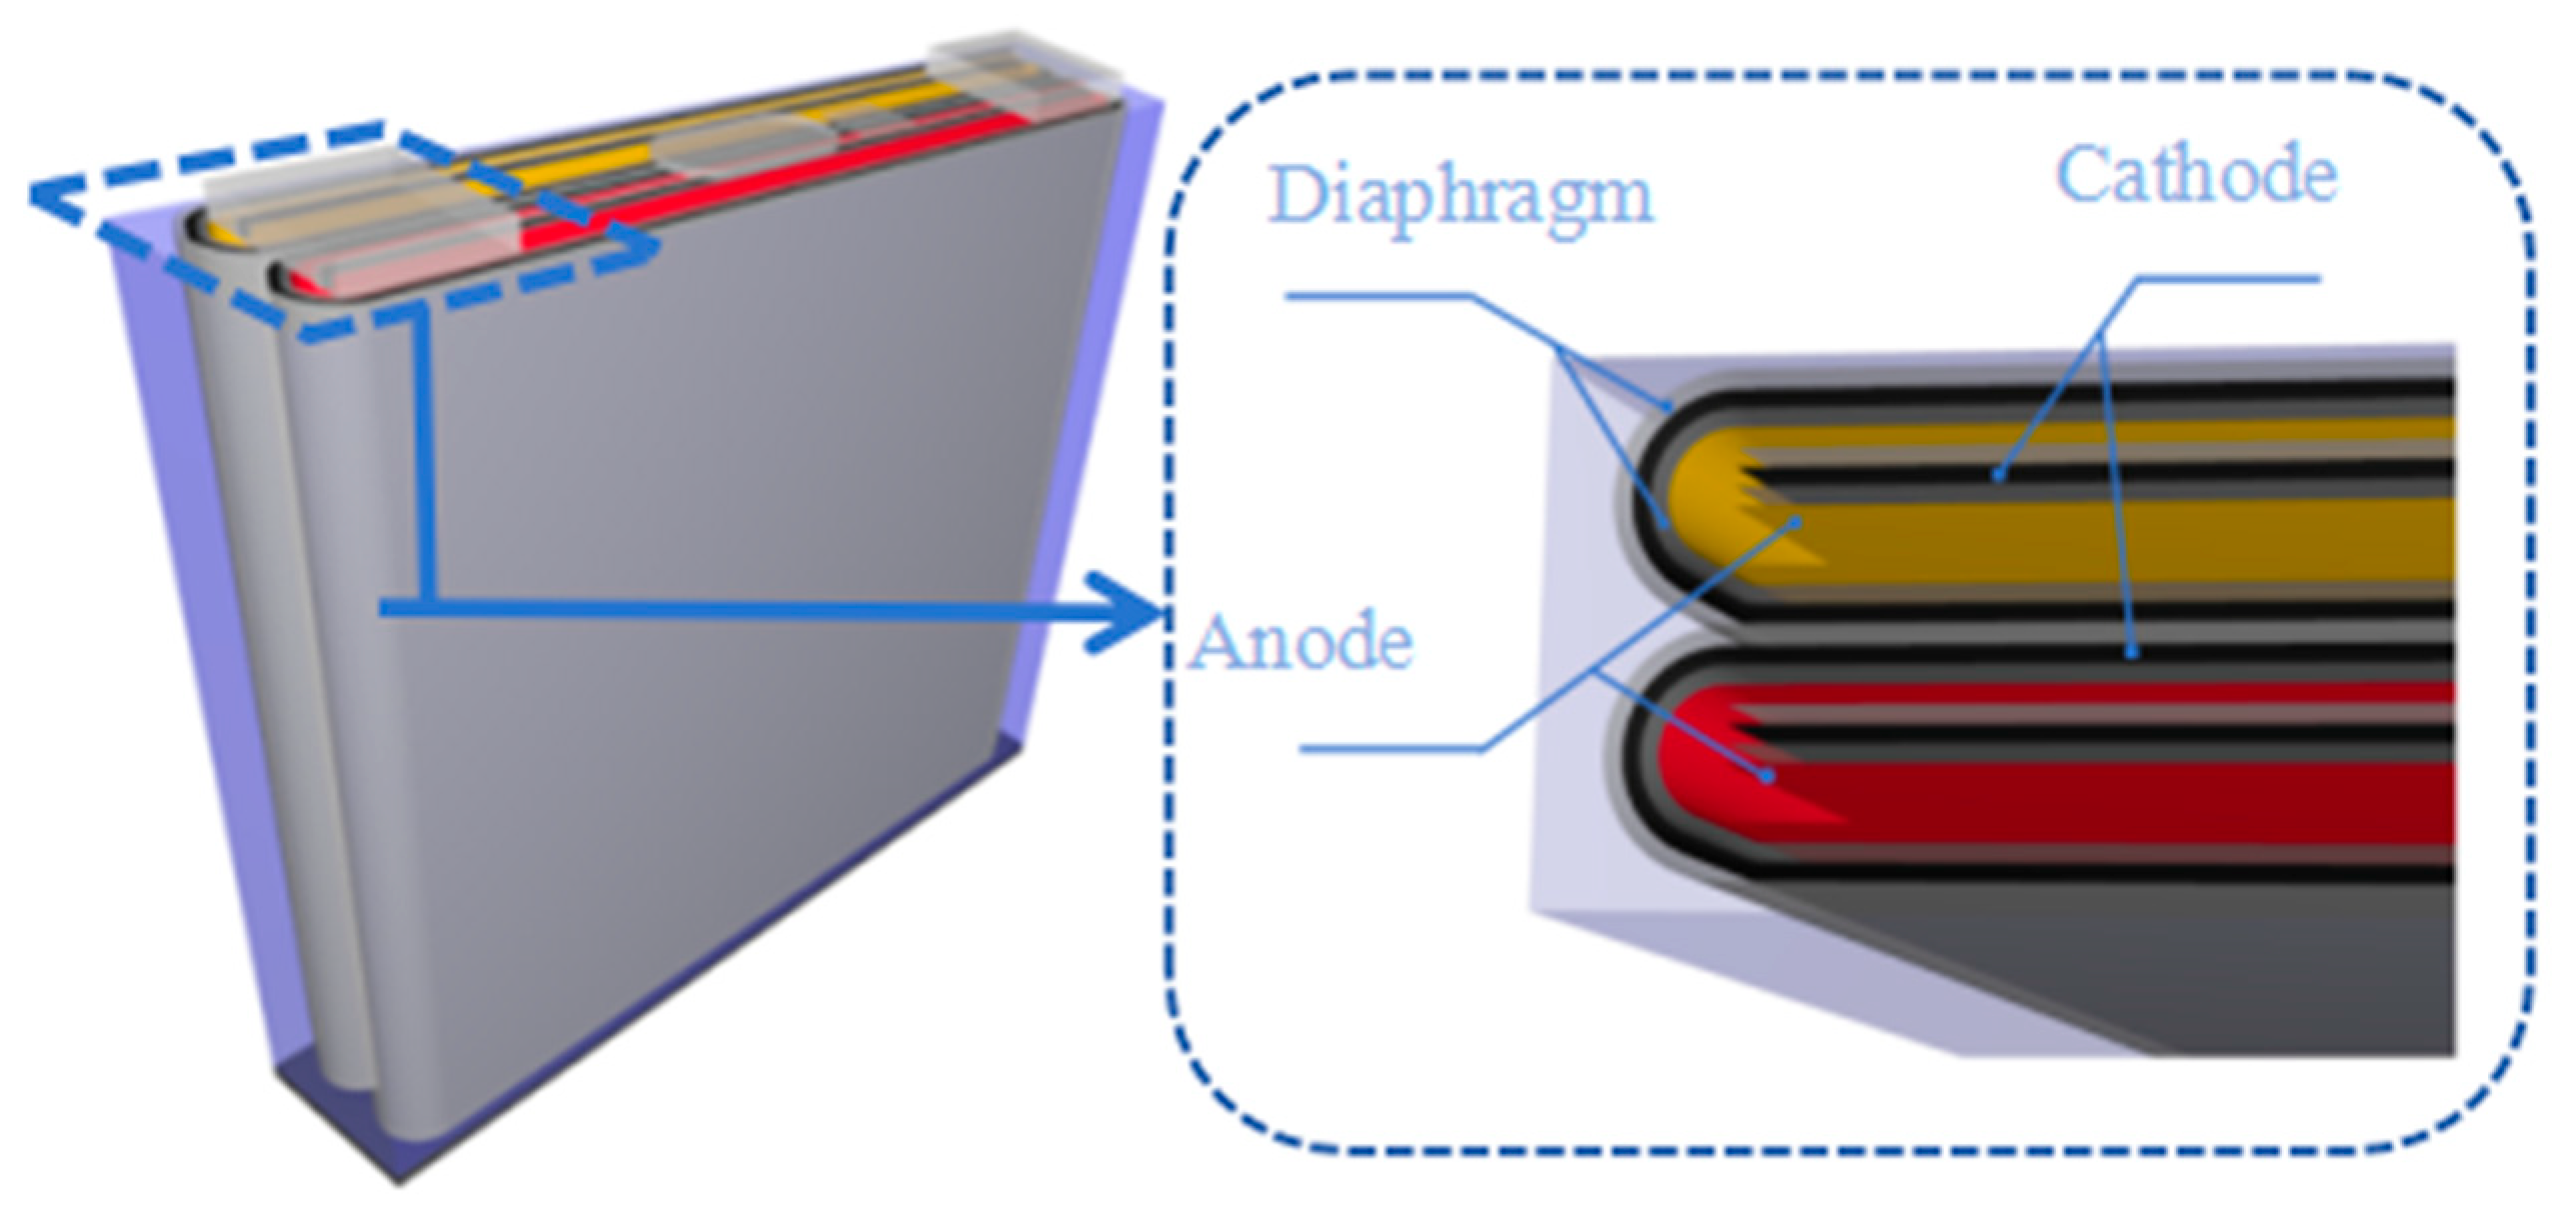
3.1. Battery Information

The commercial prismatic lithium iron phosphate (LFP) battery with dual-parallel jelly-roll configuration was selected for experimentation (as shown in Figure 2). Through comparative analyses of mass loss and temperature evolution under varying operating conditions, this study elucidates the influence of the double-wound structure on thermal runaway propagation.
The experimental battery is a 50 Ah square aluminum-cased lithium iron phosphate battery (model LF50F) of EVE brand; the positive electrode material of the battery is LFP, and the negative electrode material is graphite. The size of the battery is 148 mm × 127 mm × 27 mm, and the battery consists of two electrode cores connected in parallel, with the cores made of positive and negative materials and the diaphragm created via a winding process. The battery shell is a square aluminum shell; except for the electrode lugs, the battery is wrapped by a layer of blue aluminum–plastic film. The basic parameters of the experimental battery are shown in Table 2. In order to reduce the effect of material combustion, the blue aluminum film was peeled off during the experiment.
The inside of the battery is composed of two electrode coil cores in parallel (as shown in Figure 2). The coil core is made of positive and negative electrode materials, and the diaphragm is made via a winding process. The battery shell is a square aluminum shell; except for the pole ear, the battery is wrapped with a layer of blue aluminum–plastic film; in order to reduce the temperature error, the film was stripped during the experiment.
Before the experiment, the battery was charged to 100% state of charge (SOC) stated at a 0.5 C charging rate and then discharged to 0% SOC at a 0.5 C discharging rate to complete a charge and discharge cycle. This process was repeated twice to verify the stability of the battery. In this study, LFP batteries with 75% SOC were selected for the TR experiment, because they are more representative in practical applications (batteries usually operate in the medium SOC range of 30–80%). Compared with extreme SOC, LFP materials under 75% SOC have higher stability, i.e., the structure of the delithiated state is smooth, the side reaction is controllable, the experimental risk is lower, and the thermal runaway characteristics and safety boundary under actual conditions can be accurately evaluated.

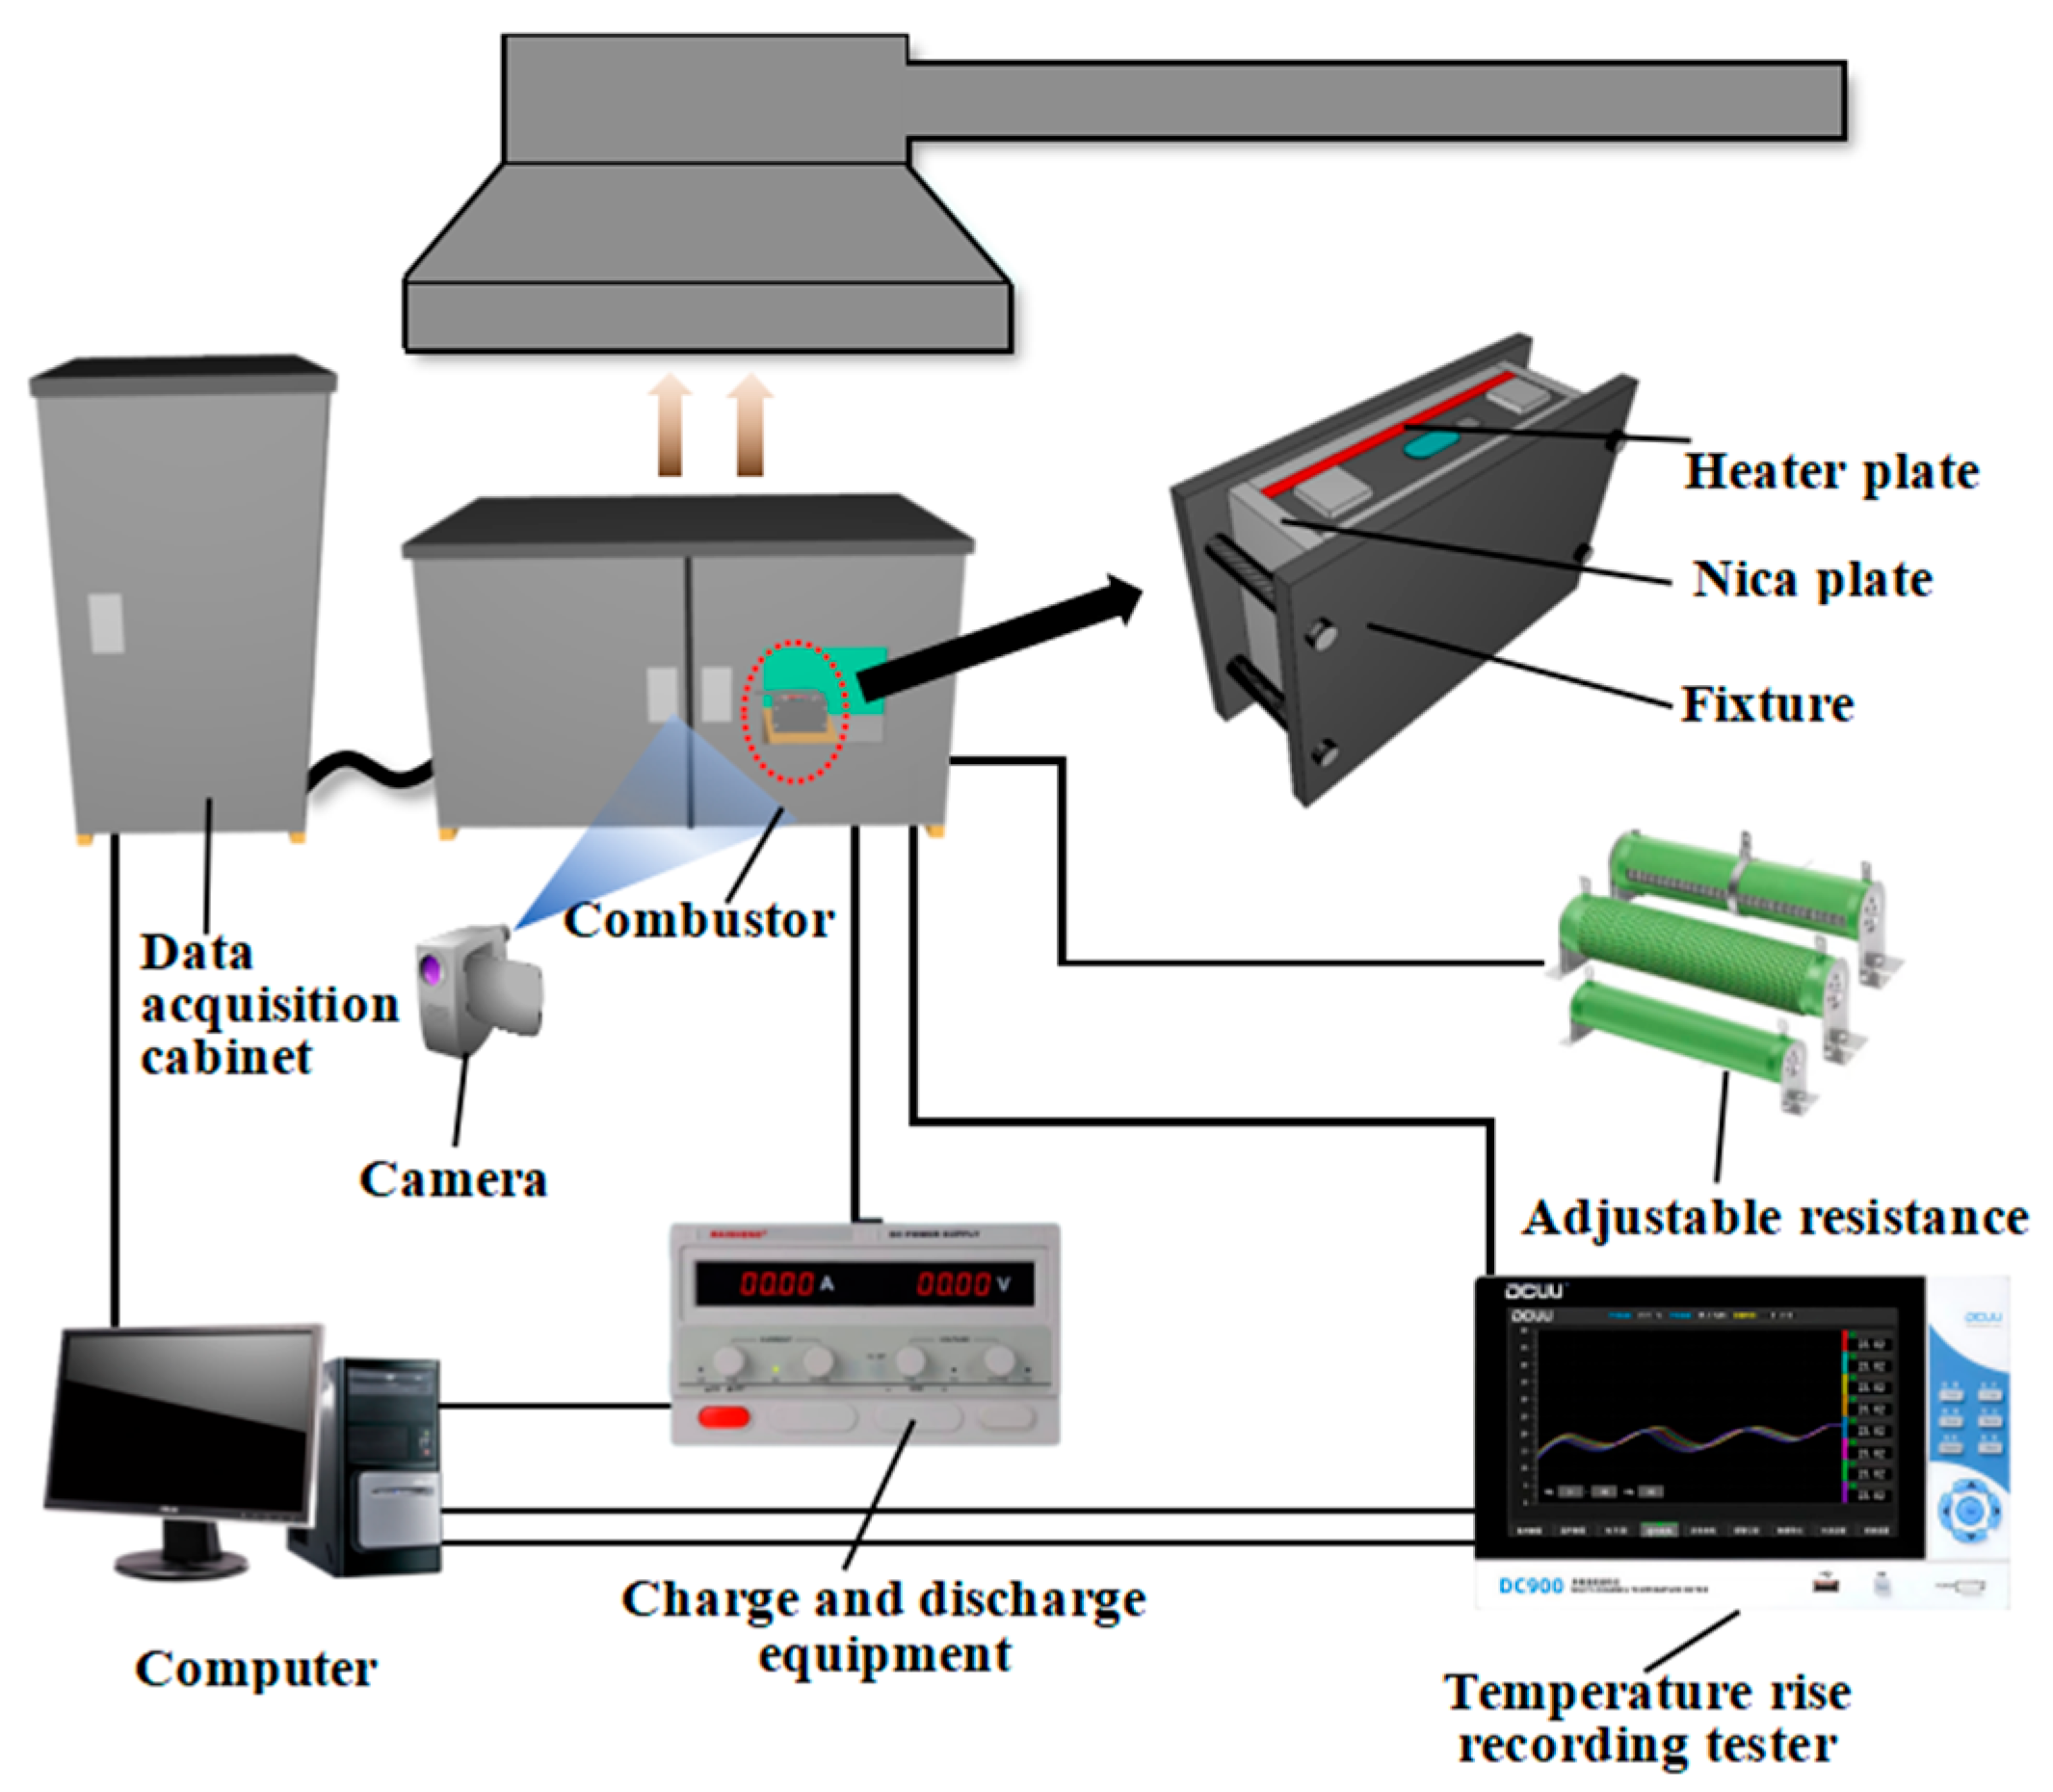
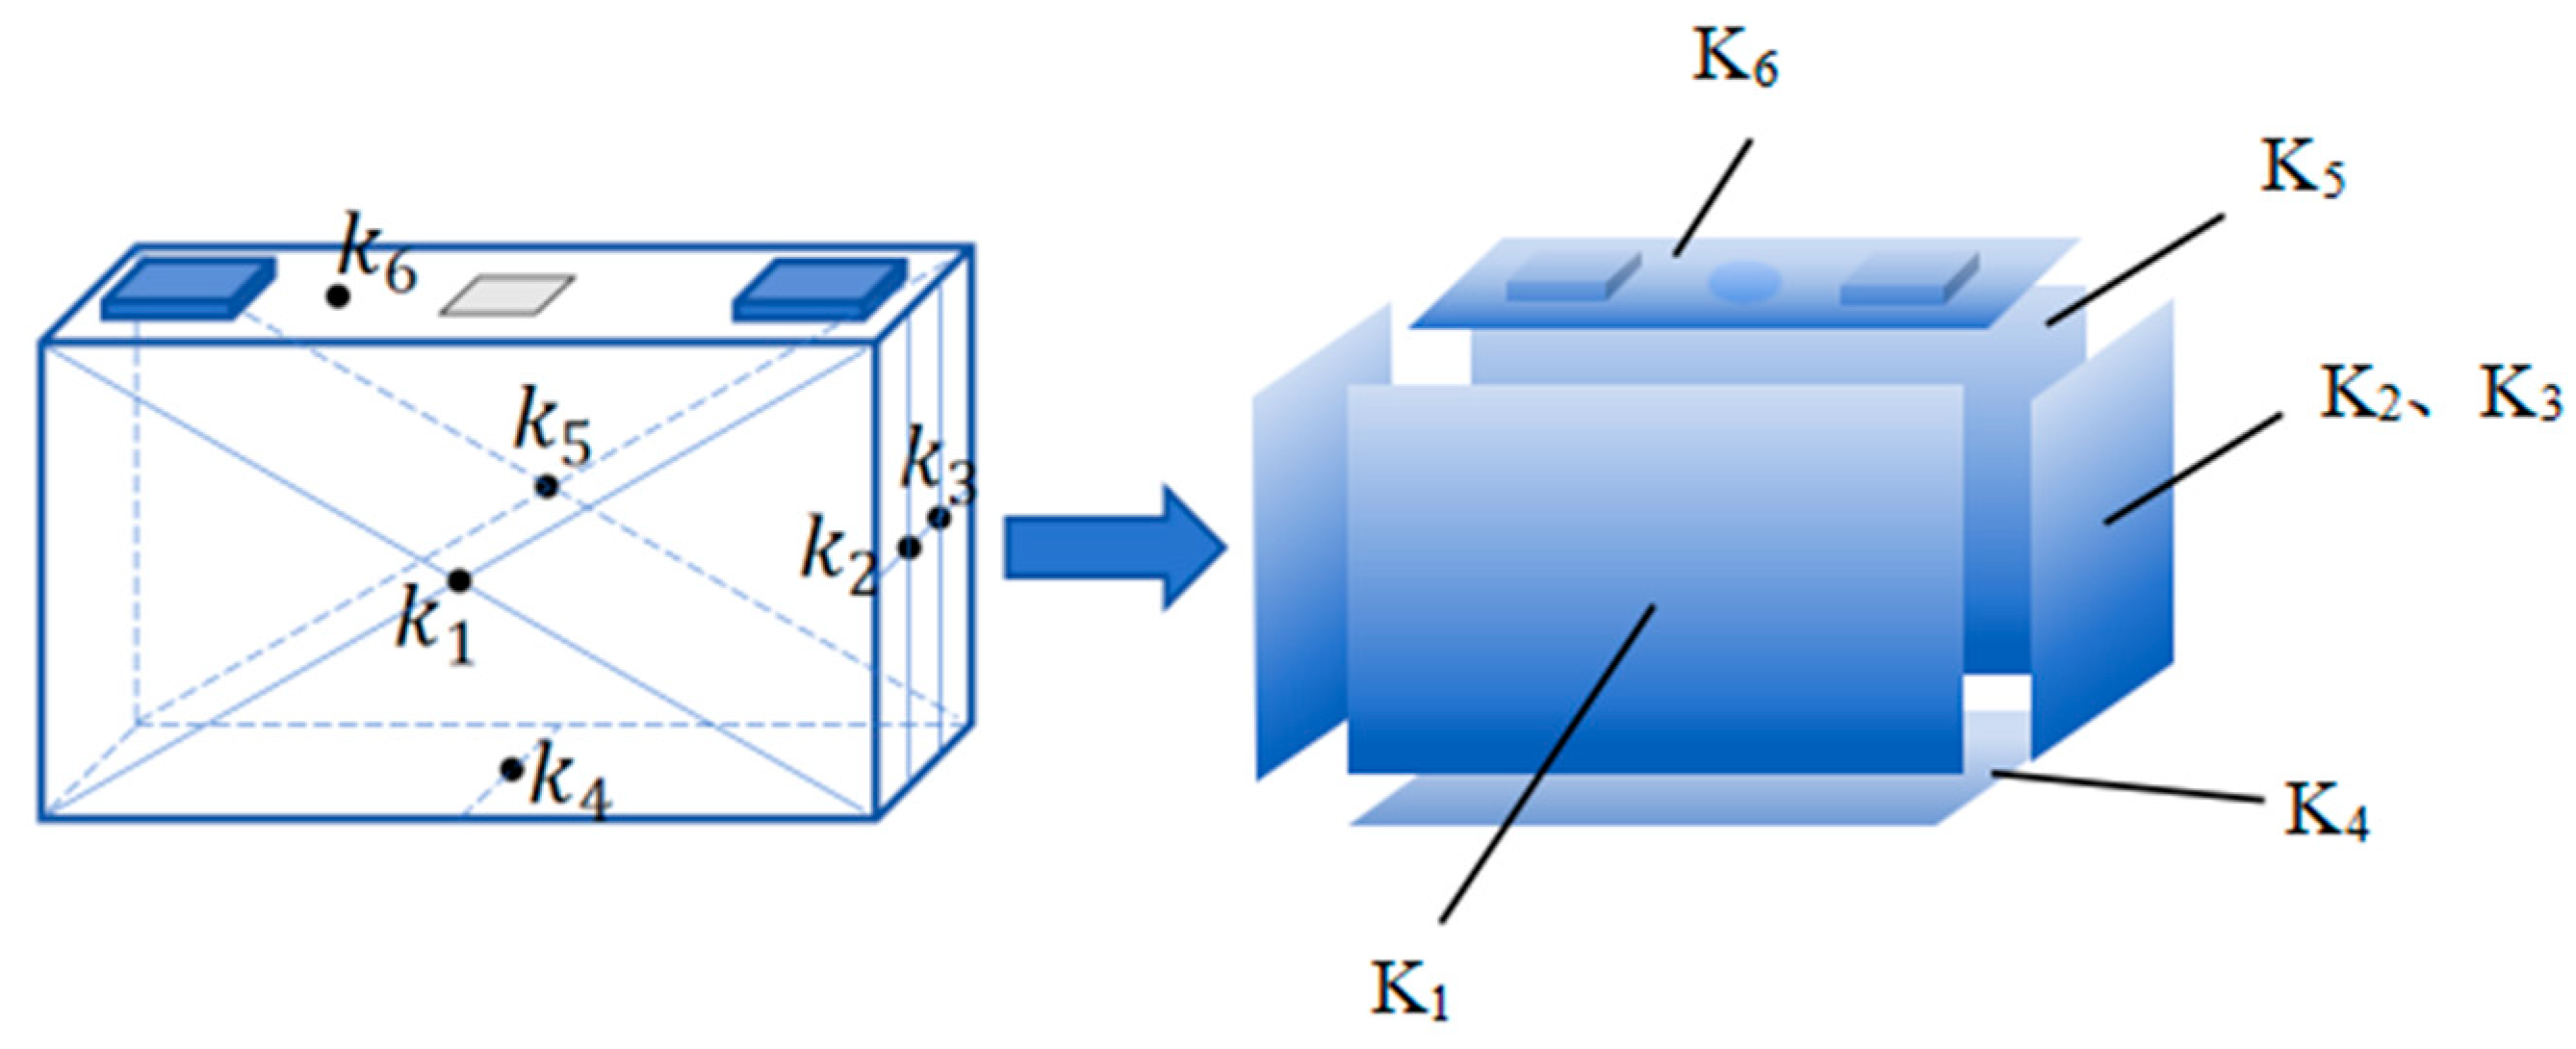
3.2. Experimental Setup

The experimental platform is shown in Figure 3. The experimental platform consists of a battery combustion chamber, a regulated and adjustable charging and discharging device, a temperature acquisition device, a high-speed data acquisition cabinet, an adjustable corrugated resistor, a video camera, and a smoke collection device. The combustion chamber is equipped with an observation window, and the material is explosion-proof glass. The smoke collection device is 2.0 m × 1.8 m in size, installed 2 m above the battery combustion chamber, which effectively exhausts the smoke to the outdoor.
The LFP cell was placed in the combustion chamber with a heating sheet attached to the front surface, wrapped with mica sheets, and secured with stainless steel clamps. The camera records the thermal runaway phenomenon through the observation window, the combustion chamber has a smoke exhaust function, and the ambient temperature is 25 °C. The cell surface is arranged with K-type thermocouples (0~1000 °C), which are located at the center of the front surface (K1), the center of the rear surface (K5), the three equal points on the side (K2, K3), the center of the bottom surface (K4) and the top near the safety valve (K6). The specific arrangement diagram of the thermocouple is shown in Figure 4.
Temperature data were collected by using a DC900 32-way temperature rise recorder. In the experiments, a bellows-type resistor (0–20 Ω) was used to simulate discharge. An MP158C high-power adjustable DC-regulated power supply was used to charge the battery at constant current or constant voltage to simulate different charging processes. The constant-current charging current was 25 A and the constant-voltage charging voltage was 3.65 V. The ceramic heating pads provided a heat flow density of 10 W/cm2. The experiment was set up with 4 groups of conditions, and each group was repeated 3 times, with the opening of the safety exhaust valve as the starting point of thermal runaway, at which time the heating was stopped. The experimental conditions are shown in Table 3 as follows.

4. Results and Discussion

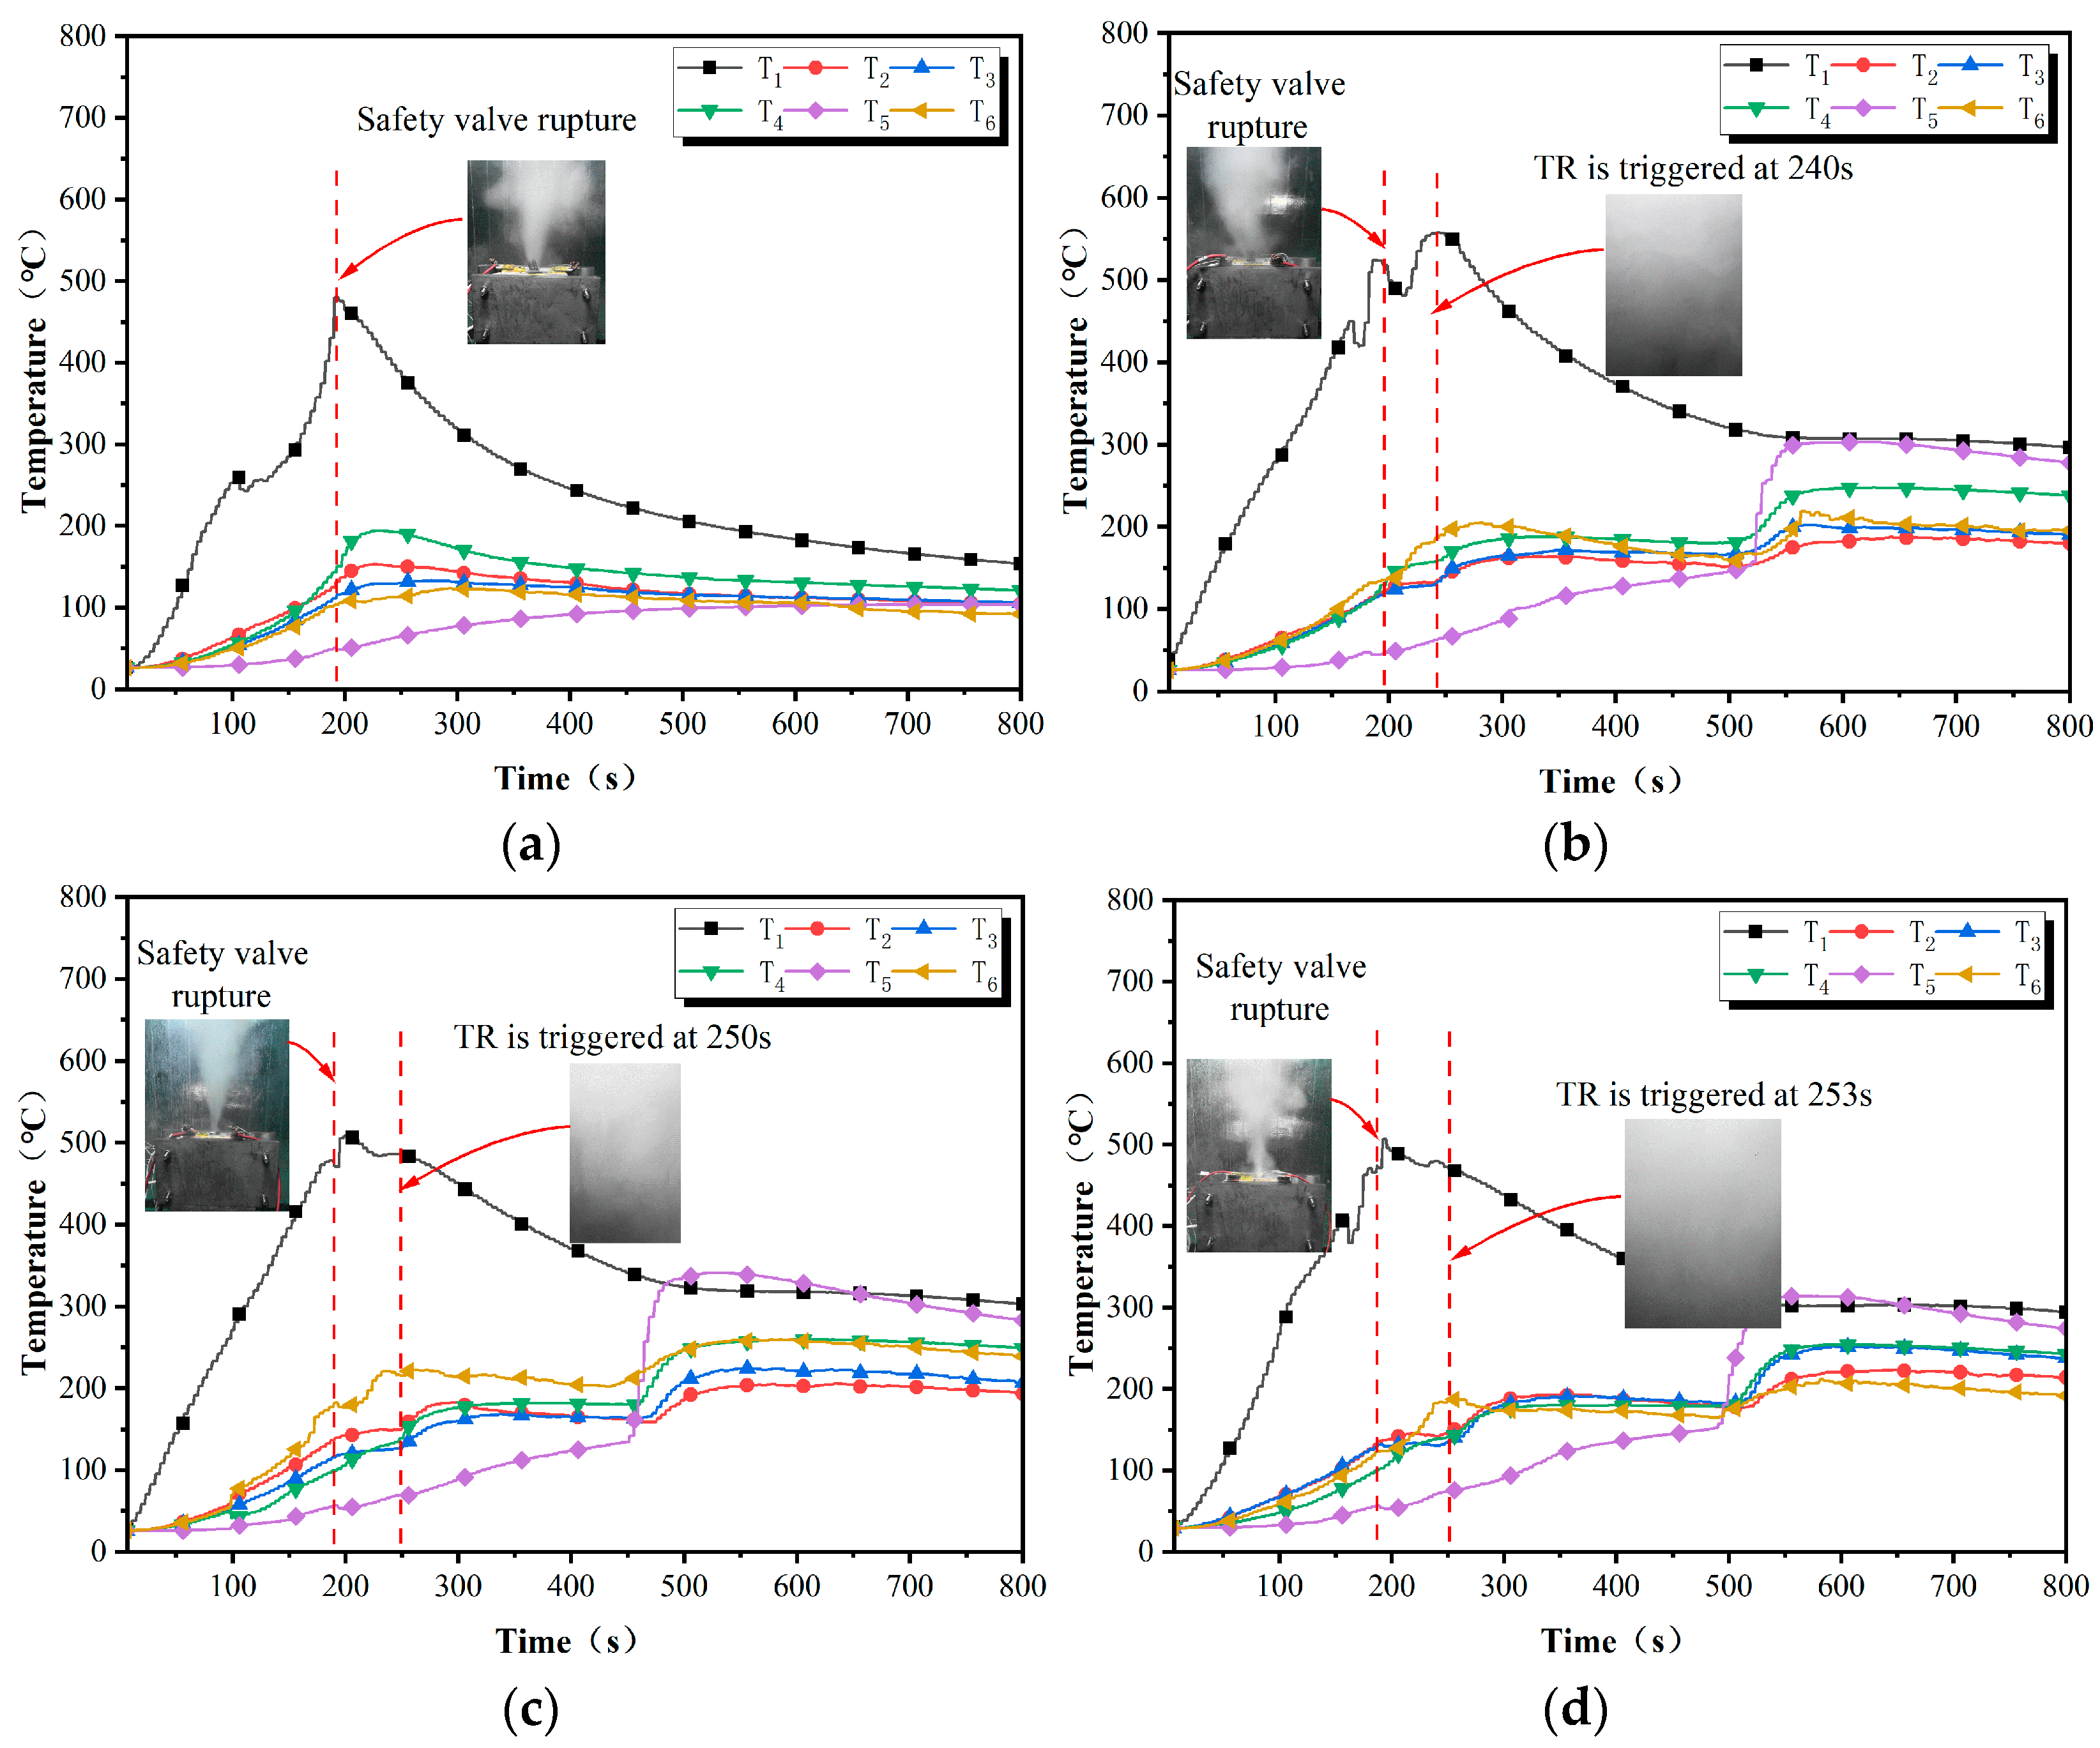
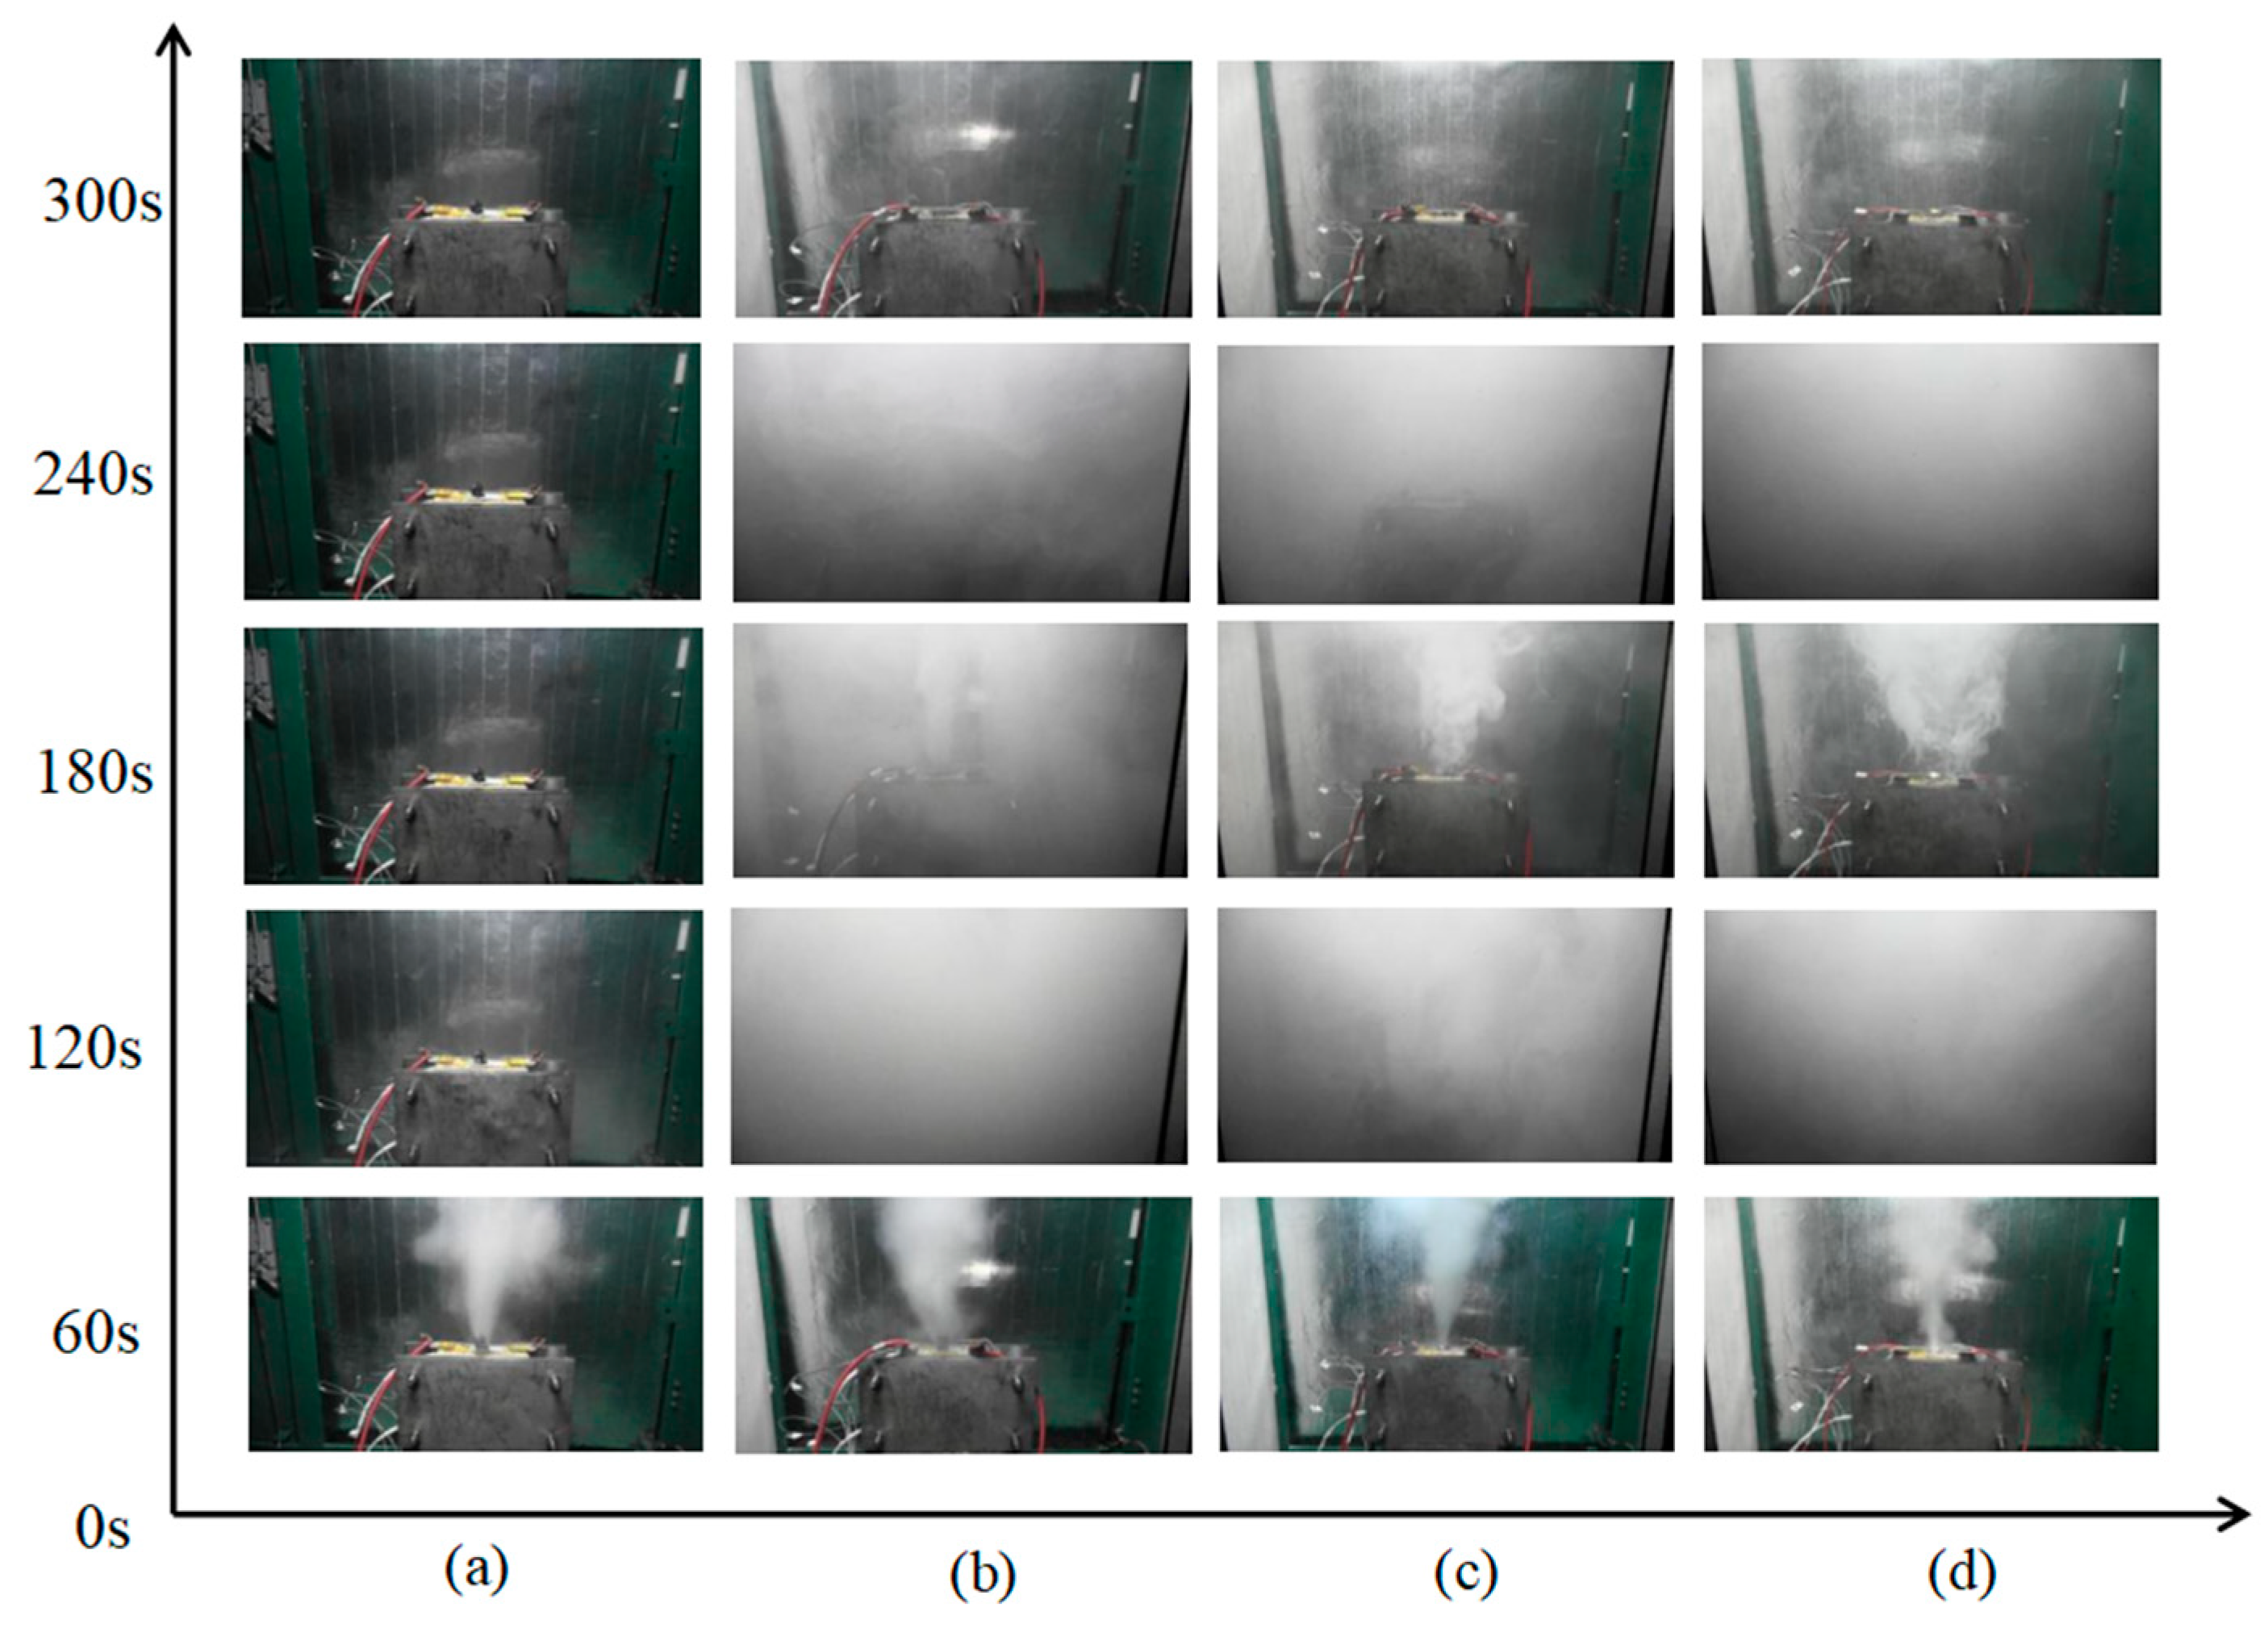
4.1. TR Trigger Time

The time experienced from the activation of the heating plate to the TR of the battery is called the TR trigger time. TR experiments were carried out on LFP batteries in open-circuit, constant-current charge, constant-voltage charge, and discharge states. The TR trigger time under different working states is shown in Figure 5. The X axis of the image represents time, the Y axis represents the temperature, and T1~T6 are the real-time temperature curves of the thermocouple K1~K6, respectively. During the experiment, the battery in the open state only exhibited behavior of safety valve rupture without the TR phenomenon. The battery TR trigger time is 240 s in the constant-current state, 250 s in the constant-voltage charging state, and 253 s in the discharge state.
The experimental data show that the TR trigger time of the battery in the charge and discharge state is earlier than that in open state. At the same time, the TR trigger time in the constant-current charging state is 4% earlier than that in the constant-voltage charging state. The TR trigger time in the discharge state is later than that in the charging state. The order of TR trigger time can be obtained from slow to fast as follows: open state, discharge state, constant-voltage charging state, and constant-current charging state. This is the same as the theoretically derived TR trigger time ordering.

4.2. Loss of Quality Due to Thermal Runaway

The degree of chemical reaction of LFP batteries varies significantly under different operating conditions. In the open state, lithium-ion migration is stagnant, chemical reaction activity is low, TR is mainly determined by external heating and material thermal conductivity, and the risk is limited by environmental conditions and material properties. While in the charging and discharging state, the de-embedding movement of lithium ions is enhanced, the chemical reaction is active, and the heat generated is superimposed with the external heat, resulting in a significant increase in temperature, further aggravating chemical reaction activity, promoting the propagation of TR, and causing the heat energy to be rapidly transmitted between the cores, which increases the risk of thermal runaway of the overall system. Screenshots of the state of LFP batteries in different operating conditions 5 min after the safety valve was opened were comparatively analyzed in the experiment, as shown in Figure 6.
The reaction of the battery in the open state is weakened or stopped in about 60 s, and there is no smoke. LFP batteries have strong TR in the charge and discharge state, emitting a hissing sound and a lot of smoke when safely vented. At 180 s, first-cell TR, which is close to the heating sheet, ends, and smoke production is reduced, but the remaining heat inside the battery spreads to the second cell and triggers TR; after 240 s, the smoke fills the combustion chamber again until the reaction stops. Before TR, the weight of the battery is about 1043.5 g, and after TR, the weight of each state is 917.8 g under the open circuit, 868.1 g under discharging, 863.3 g under constant-current charging, and 866.0 g under constant-voltage charging. Quality loss is shown in Figure 7.
The mass loss under different working conditions is in descending order as follows: constant-current charging, constant-voltage charging, discharging, and open state. The internal chemical reaction of the battery in the charging and discharging state is more intense, more smoke is ejected, and the mass loss is greater. This is consistent with the results of the theoretical analysis.

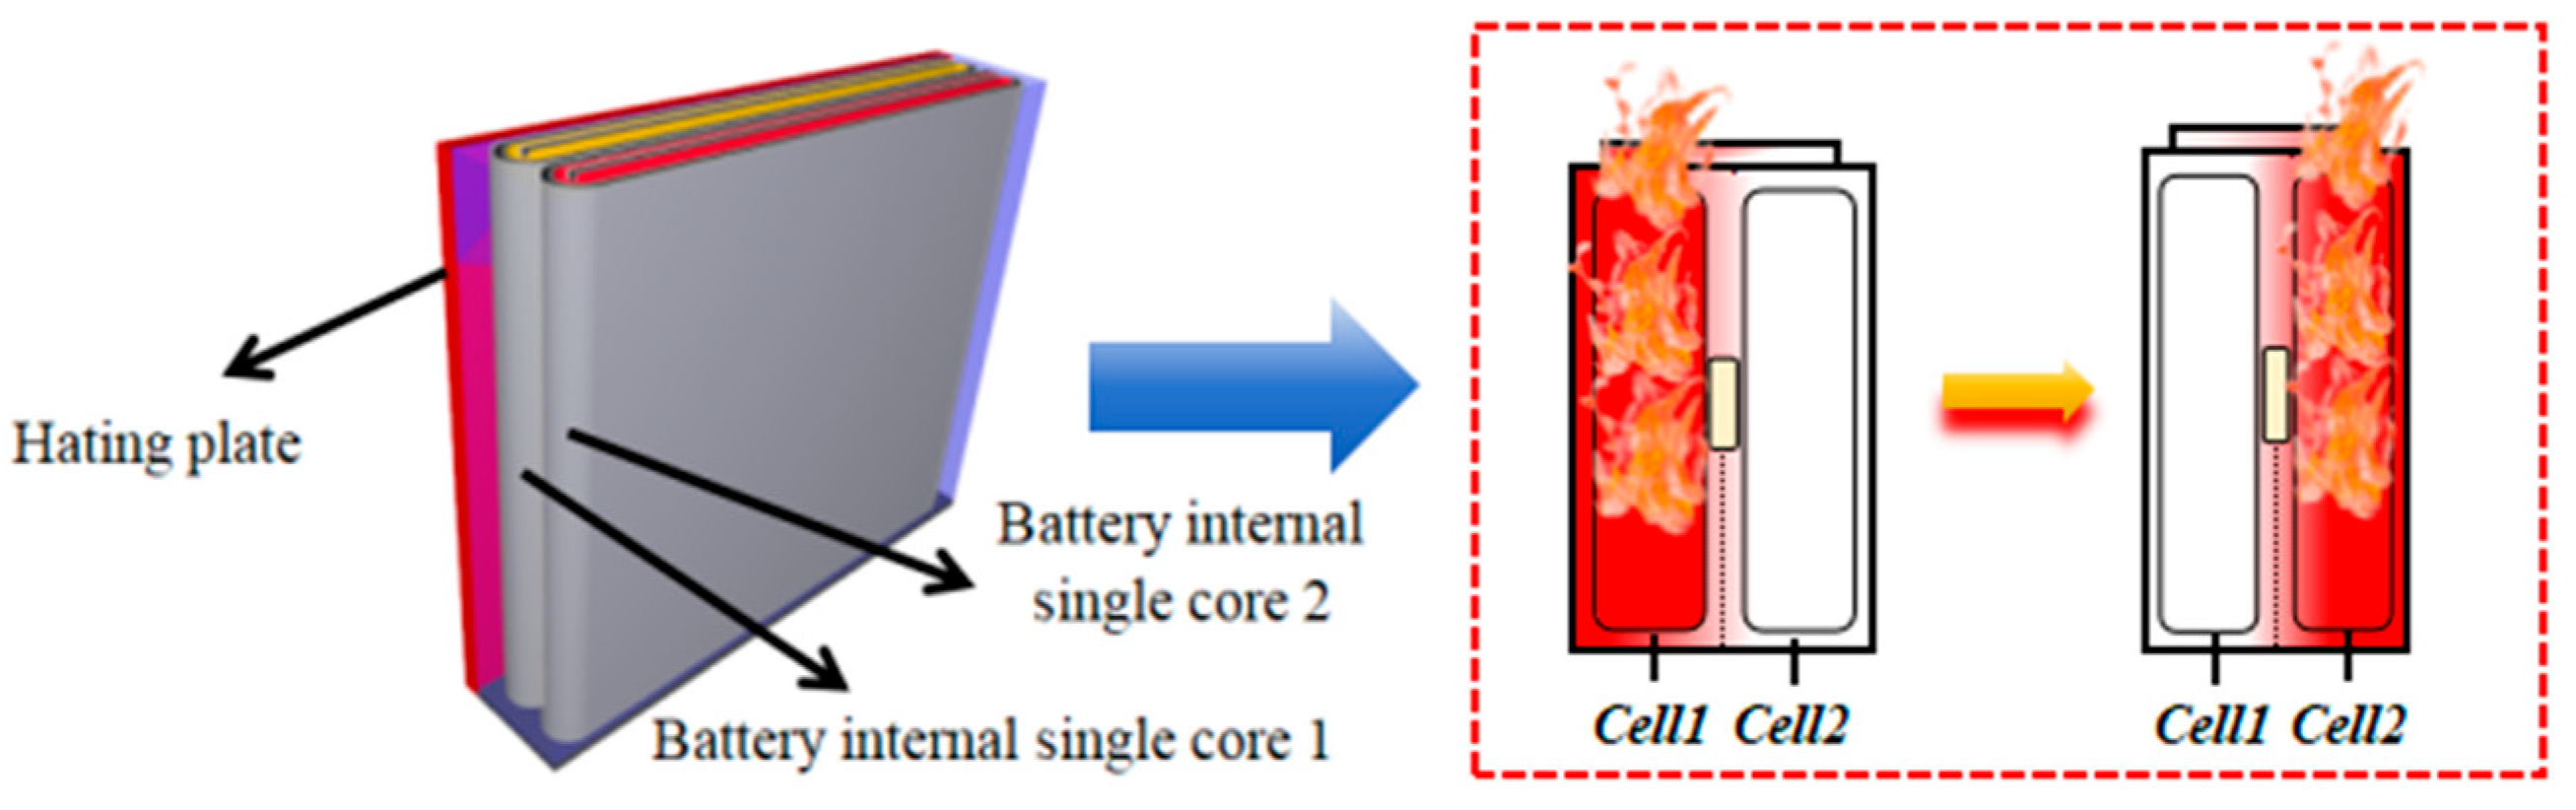
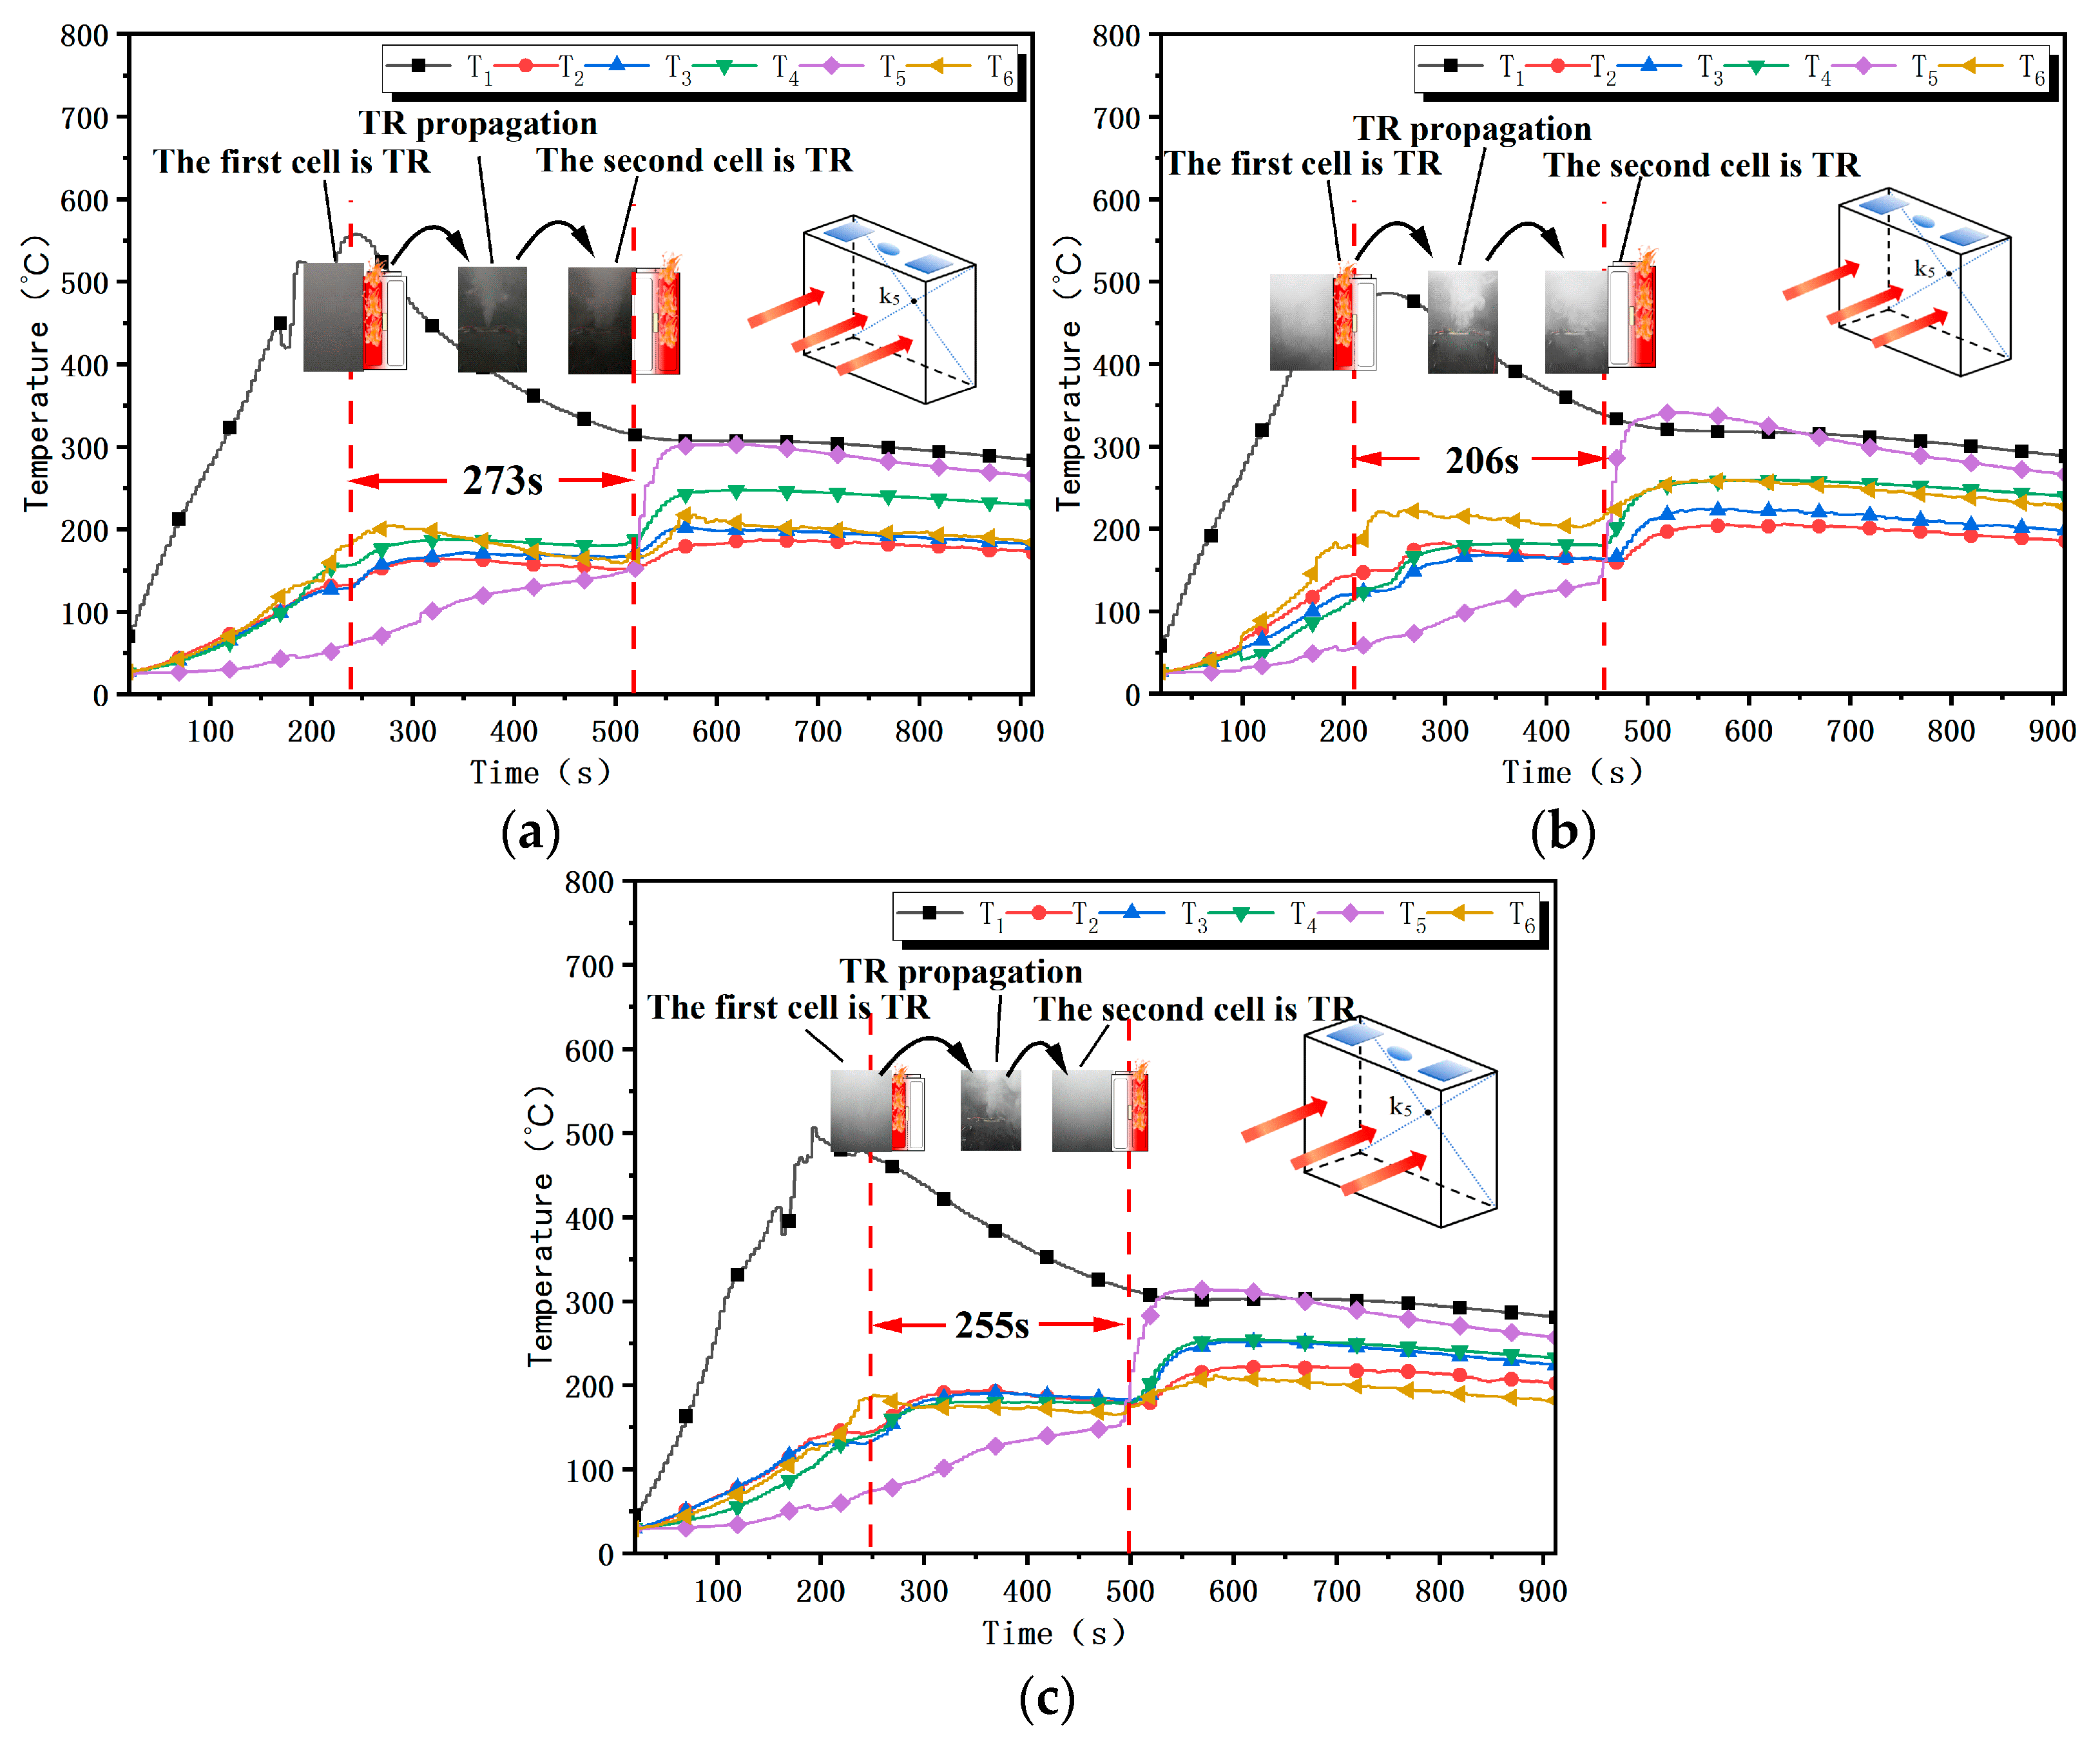
4.3. Battery Cell TR Interval

There are generally multiple cells inside a single battery, and the TR trigger time interval of a battery cell is a key parameter which not only reflects the heat transfer efficiency and thermal response characteristics inside the material but also determines the potential diffusion of TR from the monomer to the component level. At the same time, a shorter thermal runaway trigger time difference means a higher risk of TR, which may lead to cascade failure. Therefore, it is very important to study the propagation time of intercellular TR under different working conditions. The internal structure of the battery used in this experiment is shown in Figure 2. The heating surface is located on the large surface of the battery, and the conducted heat first passes through the nearest cell and then propagates from the nearest cell to other cells; so, a single LFP battery will have multiple TR phenomena, as shown in Figure 8.
There are generally multiple single cells inside the battery, and the TR trigger time interval of the battery cell is a key parameter, which not only reflects the internal heat transfer efficiency and the thermal response characteristics of the material but also determines the potential energy of thermal runaway from the monomer to the module level. At the same time, a shorter thermal runaway trigger time difference means a higher risk of thermal runaway, which may trigger cascade failures. Thermal runaway propagation in LFP batteries is affected by the heating position, and different surface heat will lead to differences in propagation speed and intensity [11]. When the front surface is heated, thermal runaway is more sequential, and the temperature “double-peak” phenomenon is more obvious [6]. In the experiment, there are two parallel cells inside the battery, and each cell is wound as follows: “diaphragm→negative electrode→diaphragm→positive electrode”. When the front surface is heated, the heat is first transferred to the first cell, and then to the second cell, resulting in two sequential thermal runaway processes.
The time intervals at which TR occurred sequentially in the two cells inside the LFP battery are shown in Figure 9. In the open state, the safety valve on the top of the LFP battery popped open at about 195 s, but no TR phenomenon occurred. In contrast, the LFP battery in the charging and discharging state had a second TR phenomenon, and the two cells inside the battery were in TR sequence. In the discharge state, the time interval between the two cells for TR is about 273 s. In the constant-current charging and constant-voltage charging states, the time interval between the two cells for TR is 206 s and 255 s, respectively. TR propagation between the cells inside the battery in the constant-current charging state was much faster, which is due to the current being maintained at a constant level and the Joule heat produced by the internal resistance of the battery being higher, which may cause the temperature of the cells to rise faster. If TR occurs in one cell, the surrounding cells may already be at a higher temperature and reach the critical point faster, and the propagation speed may be faster. Therefore, the fire hazard of the battery in the open state is smaller than in the charging and discharging state; TR in the constant-current charging state spreads faster, and the fire hazard is also larger.
In the open state, only safe exhaust behavior occurs in the battery. After the safe exhaust, due to the release of heat inside the battery, the residual temperature does not trigger TR behavior of the battery. Heat accumulation in the battery in the open state is less than heat accumulation in the battery in the charge and discharge state, i.e., the internal TR propagation time is shorter in the charge and discharge state. The experiment shows that the TR propagation time of the internal battery is the fastest in the constant-current charge state, followed by the constant-voltage charging state, and finally the discharge state. Therefore, the propagation time of internal TR from fast to slow is ordered as follows: constant-current charge state, constant-voltage charge state, discharge state, and open state. This is consistent with the results of the theoretical analysis

5. Conclusions and Prospects

Heat accumulation in the battery in the open state is almost completely dependent on the heating plate heat, and the internal electrochemical reaction is very weak in the initial heating period, while in the charge and discharge state, the internal chemical reaction of the battery is more active in the initial heating period, and the TR propagation time is faster in the interior, with a high fire risk. This paper mainly draws the following conclusions:
(1) Joule heat and polarization heat play a very important role in the battery’s TR and have a great impact on the TR characteristics of the LFP cells. The TR trigger time of the battery in the charge and discharge state is less than the TR time of the battery in the open-circuit state. The quality loss of the battery in the charge and discharge state is greater than the mass loss of the battery under the open-circuit condition. The TR interval at the internal core of the battery is less than under the open-circuit state.
(2) Constant-current charging conditions generate more heat than constant-voltage charging and discharging conditions. The experimental results confirm the correctness of the analysis. Compared with the LFP battery in the open state, the TR trigger time of the battery in the charge and discharge state is earlier, the battery quality loss is greater, and the TR propagation time in the battery is shorter. The TR trigger time of the battery in the constant-current charging state is 4% earlier than that in the constant-voltage charging state. The mass loss of the battery in the constant-current charging state is 2% higher than that in the constant-voltage charging state. The TR interval of the internal battery cell in the constant-current charging state is 25% earlier than that in the constant-voltage charging state.
(3) Based on the heat conduction equation and chemical reaction kinetics equation, the heat balance equation of a lithium battery under heat abuse conditions is constructed. From the perspective of theoretical analysis, it is proved that the battery has a higher fire risk under constant-current charging, constant-voltage charging, and discharge conditions compared with the open state because more heat is generated inside the battery under heat abuse conditions. The additional heat comes from the internal resistance of the Joule heat generated by the battery and the internal chemical reaction heat.
This study reveals the relative ordering rule of TR characteristic parameters through theoretical deduction and does not carry out absolute numerical prediction of TR characteristic parameters. Although this paper does not pursue numerical prediction, numerical prediction of TR characteristic parameters can be taken as a research direction in the future. At the same time, the theoretical model in this paper only qualitatively analyzes the TR characteristics of LFP batteries, and the types of batteries studied are relatively simple. Thermal runaway experiments can be carried out using different types of batteries in the future.

Author Contributions

Conceptualization, J.L.; methodology, D.L.; formal analysis, X.L.; investigation, D.L.; resources, Q.L.; data curation, D.L.; writing—original draft preparation, D.L.; writing—review and editing, J.L.; visualization, T.S.; supervision, Q.L.; project administration, Q.L.; funding acquisition, Q.L. All authors have read and agreed to the published version of the manuscript.

Funding

This work was supported by the Key Projects of the 2024 Open Topics Program at Tianjin Key Laboratory of Fire Safety Technology [grant number 2024TKLFST03], and the APC was funded by China People’s Police University.

Data Availability Statement

Data are contained within the article.

Conflicts of Interest

The authors declare no conflict of interest.

References

  1. Huang, Z.; Li, X.; Wang, Q.; Duan, Q.; Li, Y.; Li, L.; Wang, Q. Experimental investigation on thermal runaway propagation of large format lithium ion battery modules with two cathodes. Int. J. Heat Mass Transfer. 2021, 172, 121077. [Google Scholar] [CrossRef]
  2. Zhu, X.; Wang, Z.; Wang, Y.; Wang, H.; Wang, C.; Tong, L.; Yi, M. Overcharge investigation of large format lithium-ion pouch cells with Li (Ni0.6Co0.2Mn0.2) O2 cathode for electric vehicles: Thermal runaway features and safety management method. Energy 2019, 169, 868–880. [Google Scholar] [CrossRef]
  3. Jiang, Z.; Li, H.; Qu, Z.; Zhang, J. Recent progress in lithium-ion battery thermal management for a wide range of temperature and abuse conditions. Int. J. Hydro. Energy 2022, 47, 9428–9459. [Google Scholar] [CrossRef]
  4. Larsson, F.; Mellander, B.E. Abuse by External Heating, Overcharging and Short Circuiting of Commercial Lithium-Ion Battery Cells. J. Electrochem. Soc. 2014, 161, A1611. [Google Scholar] [CrossRef]
  5. Zhou, Z.; Ju, X.; Zhou, X.; Yang, L.; Cao, B. A comprehensive study on the impact of heating position on thermal runaway of prismatic lithium-ion batteries. J. Power Sources 2022, 520, 230919. [Google Scholar] [CrossRef]
  6. Chen, M.; Liu, J.; Dongxu, O.; Cao, S.; Wang, Z.; Wang, J. A Simplified Analysis to Predict the Fire Hazard of Primary Lithium Battery. Appl. Sci. 2018, 8, 2329. [Google Scholar] [CrossRef]
  7. Maleki, H.; Howard, J. Internal short circuit in Li-ion cells. J. Power Sources 2009, 191, 568–574. [Google Scholar] [CrossRef]
  8. Hu, J.; Tang, X.; Zhu, X.; Liu, T.; Wang, X. Suppression of thermal runaway induced by thermal abuse in large-capacity lithium-ion batteries with water mist. Energy 2024, 286, 129669. [Google Scholar] [CrossRef]
  9. Spotnitz, R.; Franklin, J. Abuse behavior of high-power, lithium-ion cells. J. Power Sources 2003, 113, 81–100. [Google Scholar] [CrossRef]
  10. Huang, Z.; Liu, J.; Zhai, H.; Wang, Q. Experimental investigation on the characteristics of thermal runaway and its propagation of large-format lithium ion batteries under overcharging and overheating conditions. Energy 2021, 233, 121103. [Google Scholar] [CrossRef]
  11. Finegan, D.; Tjaden, B.; Heenan, T.; Jervis, R.; Michiel, M.; Alexander, R.; Gareth, H.; Dan, J.; Paul, R. Tracking Internal Temperature and Structural Dynamics during Nail Penetration of Lithium-Ion Cells. J. Electrochem. Soc. 2017, 164, A3285. [Google Scholar] [CrossRef]
  12. Ping, P.; Wang, Q.; Huang, P.; Sun, J.; Chen, C. Thermal behavior analysis of lithium-ion battery at elevated temperature using deconvolution method. Appl. Energy 2014, 129, 261–273. [Google Scholar] [CrossRef]
  13. Dai, Y.; Panahi, A. Thermal runaway process in lithium-ion batteries: A review. Next Energy 2025, 6, 100186. [Google Scholar] [CrossRef]
  14. Jiang, F.; Liu, K.; Wang, Z.; Tong, X.; Guo, L. Theoretical analysis of lithium-ion battery failure characteristics under different states of charge. Fire Mater. 2018, 42, 680–686. [Google Scholar] [CrossRef]
  15. Huang, Z.; Duan, Q.; Li, J.; Yang, F.; Sun, J.; Wang, Q. Experimental and numerical investigation of heating power effect on thermal runaway propagation within large-format lithium iron phosphate battery. J. Energy Storage 2025, 109, 115098. [Google Scholar] [CrossRef]
  16. Huang, Z.; Yu, Y.; Duan, Q.; Qin, P.; Sun, J.; Wang, Q. Heating position effect on internal thermal runaway propagation in large-format lithium iron phosphate battery. Appl. Energy 2022, 325, 119778. [Google Scholar] [CrossRef]
  17. Hu, J.; Wei, Z.; He, H. An Online Adaptive Internal Short Circuit Detection Method of Lithium-Ion Battery. Automot. Innov. 2021, 4, 93–102. [Google Scholar] [CrossRef]
Figure 1. Heat source. (a) Open state; (b) operating state.
Batteries 11 00196 g001
Figure 2. Battery internal structure diagram.
Batteries 11 00196 g002
Figure 3. Schematic diagram of experimental platform.
Batteries 11 00196 g003
Figure 4. Thermocouple arrangement layout diagram.
Batteries 11 00196 g004
Figure 5. TR trigger time: (a) open condition; (b) constant-current charging state; (c) constant-voltage charging state; (d) discharge state.
Batteries 11 00196 g005
Figure 6. Smoke release from LFP battery: (a) TR of LFP battery in open state; (b) TR of LFP battery in constant-voltage charging state; (c) TR of LFP battery in constant-current charging state; (d) TR of LFP battery in discharging state.
Batteries 11 00196 g006
Figure 7. The quality loss and the residual mass.
Batteries 11 00196 g007
Figure 8. TR propagation of the cell inside the battery.
Batteries 11 00196 g008
Figure 9. TR time interval of internal battery cells: (a) discharge state; (b) constant-current charging state; (c) constant-voltage charging state.
Batteries 11 00196 g009
Table 1. Lithium-ion battery types (classification by geometric topology).
TypeStructural CharacteristicsTypical Applications
Single-layer jelly-rollAxially spirally wound single continuous electrode separator tape with non-interconnected layers (parallel/series-free)Cylindrical Cell
Dual-parallel jelly-roll architectureDual independent electrode tape with parallel winding and bipolar tab symmetric distribution enabling current path parallelizationHigh-Power Prismatic Battery (Power Battery)
Multi-tab segmented windingMulti-tab segmented welding on monolithic electrode tape with distributed current collection for internal resistance minimizationFast-Charging Pouch Cell
Shaped winding topologyAsymmetric winding path (e.g., elliptical/polygonal) for optimized electrode active material distributionCustomized Energy Storage Battery for Aerospace Applications
Table 2. Battery basic parameters.
ParameterValue
Cathode materialLiFePO4 (LFP)
Anode materialC
Rated capacity50.0 Ah
Operating voltage3.2 V~3.6 V
Operating temperature−20 °C~65 °C
Battery size148 mm × 127 mm × 27 mm
Mass1035 ± 100 g
Table 3. Experimental conditions.
Serial NumberBattery StatusHeating Position
1Constant-current chargingFront surface
2Constant-voltage charging
3Discharged state
4Open state
Disclaimer/Publisher’s Note: The statements, opinions and data contained in all publications are solely those of the individual author(s) and contributor(s) and not of MDPI and/or the editor(s). MDPI and/or the editor(s) disclaim responsibility for any injury to people or property resulting from any ideas, methods, instructions or products referred to in the content.

