Article

Thermal Drying in the Recycling Process of Lithium-Ion Batteries—Kinetics and Selectivity Aspects for the Evaporation of Electrolyte–Solvent Mixtures

Karlsruhe Institute of Technology (KIT), Thin Film Technology (TFT), P.O. Box 3640, 76021 Karlsruhe, Germany
*
Author to whom correspondence should be addressed.
Batteries 2025, 11(12), 436; https://doi.org/10.3390/batteries11120436
Submission received: 18 July 2025 / Revised: 26 August 2025 / Accepted: 30 August 2025 / Published: 25 November 2025
(This article belongs to the Special Issue Sustainable Materials and Recycling Processes for Battery Production)

Abstract

The removal of the electrolyte solvents in an early-stage thermal drying step is crucial for safe and efficient recycling processes for end-of-life lithium-ion batteries. A comprehensive understanding of the governing influences on the solvent volatilization during the drying step enables optimized processes. The initial phase of this process is of particular interest because, due to the high spatial accessibility of the solvent, drying is determined by the mass transport in the surrounding gas phase, which can be precisely controlled through the process boundary conditions. In this study, the evaporation of representative binary and ternary electrolyte–solvent mixtures containing linear and cyclic organic carbonates is investigated under defined boundary conditions. The evaporation kinetics and selectivity are assessed by time-discrete measurement of the amount of solvent and its composition during the evaporation experiments. At the conditions applied, the vapor pressure of the solvents governs the evaporation selectivity, with the evaporation kinetics dictated by the mass transport of the solvent vapor in the gas phase. Hence, the evaporation of highly mobile but low volatile solvents, such as ethylene carbonate (EC), is the constraining aspect within this process. Moreover, molecular interactions within mixtures can further hinder the volatilization of EC. The developed simulation model describes the evaporation behavior with high accuracy and thus allows the prediction of minimum drying times. It establishes a solid foundation for designing and scaling the drying processes of end-of-life batteries, which involve complex material interactions.

Graphical Abstract

1. Introduction

As an essential means of energy storage for a large variety of applications, primarily electromobility and stationary power storage, lithium-ion batteries (LIBs) recently experienced a tremendous rise in production in the international market, which is expected to further accelerate in the next decades [1,2]. Considering the criticality and scarcity of some LIB materials, efficient recycling strategies for end-of-life (EoL) batteries are crucial for closed material recirculation, which is required for a sustainable battery market [1]. The schematic structure of a LIB cell, with the respective materials of its electrodes and the separator, is visualized in Figure 1. A LIB cell is an assembly of various functional units, which results in complex waste that requires sophisticated recycling strategies. The aim is to maximize the overall recycling efficiency and to meet material-purity demands on the production side [1,3]. Mechanical direct recycling is an approach which pursues a function-conserving recovery of electrode coating materials and, thus, the possibility of their re-use without effortful resynthesis. However, this technology is under development and not yet implemented on a large scale. A currently widespread approach combines mechanical separation steps and hydrometallurgical treatment [4,5].
Figure 2 shows a simplified flow diagram for this process with the main material flows. The batteries are discharged and disassembled to at least the module level, followed by shredding, which physically separates the active material, conductor and separator foils into individual streams [6]. When the cell is crushed, the liquid electrolyte, which accounts for around 10 to 20 wt% on the cell level and consists of conductive salt (≈20 wt% of the liquid phase) and a solvent mixture, is released. In the electrolyte, the conductive salt dissociates into solvated ions and ion pairs through interactions with the solvent molecules. The electrolyte fills the pores of the electrodes and the separator and covers their surfaces to provide an efficient Li-ion transport between the electrodes.
Among the large variety of electrolyte solvents used, the most common solvents are dimethyl carbonate (DMC), diethyl carbonate (DEC) and ethyl methyl carbonate (EMC) as linear carbonates, as well as ethylene carbonate (EC) and propylene carbonate (PC) as cyclic carbonates. Common electrolyte–solvent mixtures consist, for example, of EMC and EC in a mass ratio of 7:3, DMC and EC in a mass ratio of 1:1, or DMC, EMC and DEC in a mass ratio of 1:1:1 [7,8,9,10,11]. Some of the electrolyte is consumed during the formation of electrode–electrolyte interphases, namely the solid electrolyte interphase (SEI) on the anode and the cathode electrolyte interphase (CEI) on the cathode. The SEI forms through the reductive decomposition of solvents, salts, and additives, with a preferential reduction of EC, while the CEI forms via oxidative electrolyte reactions at high voltages, where linear carbonates are more susceptible to decomposition. The electrolyte is also partially chemically altered during cycling over the cell lifetime [12,13,14,15,16]. However, our own gravimetric and spectrometric measurements during drying suggest that most solvents remain largely unchanged and are still present in the cell. Electrolyte components and their decomposition products can significantly impair the recycling process at multiple stages. Hazardous components that form flammable and explosive vapor–air mixtures pose serious risks to the environment and to worker safety, and their corrosiveness requires resistant materials and increases maintenance costs [17,18,19,20,21,22,23,24,25,26,27,28]. During sieving, the residues act as unintended binding agents, causing particle agglomeration and reducing separation efficiency. In flotation, the altered wettability of the electrode material’s surface caused by electrolyte solvents hinders separation performance. In hydrometallurgical leaching, electrolyte residues are major contaminants that decrease metal recovery and promote adverse side reactions [29,30,31].
Targeted and channeled removal of the electrolyte components in early-stage thermal treatment prevents safety issues, mitigates the environmental impact, enhances material handling and increases the efficiency of downstream process steps. In a two-step thermal treatment, first, the drying step at a lower temperature aims to remove (and recover) the organic solvents and their decomposition products, while the subsequent pyrolysis step at elevated temperatures aims to decompose binder materials and potential residual solvents. The drying of the comminuted material is performed in inert gas atmosphere or under vacuum [5,32,33,34]. Low temperatures are set to avoid the decomposition of the conductive salt and the melting of the separator, as well as the formation of adverse compounds [9,11,35].
Figure 3 illustrates the individual mass transfer mechanisms taking place in a porous, sorbing material, such as electrodes and separators. If the surface of the material to be dried is covered with solvent, the drying is determined solely by the mass transport in the surrounding external gas phase. If this resistance is not limiting, the mass transport in the porous network becomes dominant as soon as the liquid level recedes to the interior. From this point on, the drying also depends on structural properties of the material, such as porosity and pore-size distribution. Mass transfer in the polymeric materials comes into effect after pore emptying and governs the drying to low residual solvent loadings.
In addition to mass transport kinetics, drying is also governed by the thermodynamic equilibria at phase boundaries. Within the electrolyte, both solvent–solvent and solvent–salt interactions determine the vapor–liquid equilibrium, while solvent–solid interactions are described by the sorption equilibrium.
The removal and recovery of electrolyte components from crushed batteries by means of low-temperature thermal treatment has been the subject of some studies to date.
The vapor–liquid equilibria of common solvent mixtures and their phase transitions during drying have been comprehensively investigated in several studies [36,37,38]. Stehmann et al. [35,39] conducted simulations to predict the component-specific decrease of the solvent amount during evaporation of electrolyte–solvent mixtures at different temperatures under low total pressures and carrier gas flow rates. Accompanying pilot-scale drying experiments of shredded cells at 120 °C (reduced pressure, no carrier gas flow) showed an expected insufficient removal of high boiling compounds, such as EC. Due to the assumption of thermodynamic equilibrium in the simulation, only a tendential suitability for reproducing the experimental measurements could be confirmed. Werner et al. [40] and Zachmann et al. [41] investigated the electrolyte–solvent removal during the thermal drying of manually opened (different disassembly levels) and comminuted EoL-LIB cells containing DMC, EMC, DEC and EC. The experiments were performed at ambient pressure, over a wide temperature range from room temperature to 150 °C, and in some cases using nitrogen as purge gas. These studies provide valuable insight into the influence of drying conditions on the electrolyte–solvent volatilization for model solvent mixtures and from commercial LIB cells. However, comprehensive investigations regarding optimum drying parameters for efficient removal of the electrolyte solvents are demanded. The governing influences for heat and mass transfer (gas-phase flow-field and gas-phase composition) linked to the applied boundary conditions have not been considered to the required extent.
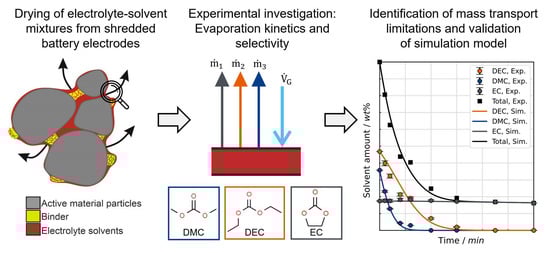
This study focuses on the drying behavior of representative electrolyte–solvent mixtures, with special consideration of the defined process boundary conditions (temperatures, carrier gas flow, geometry). The investigation centers on the initial drying phase, when internal resistances—such as diffusion in the porous network of the electrodes and their electrode–electrolyte interphases and in the polymers—can be neglected (see Figure 2). Consequently, the drying behavior, characterized by the kinetics and selectivity of evaporation, is solely influenced by the heat and mass transfer in the external gas phase and the thermodynamic phase equilibrium at the vapor–liquid boundary. Due to the low concentration of conductive salt, its influence on the vapor pressure of the solvents is disregarded. The experimental results and findings of this study demonstrate how drying boundary conditions affect the evaporation of individual components. By deliberately simplifying the complex material system, individual influences can be analyzed in isolation. To transfer these results to other dryers, the study presents a simulation model that predicts the evaporation behavior of electrolyte–solvent mixtures based solely on dryer-specific parameters. After validation, the simulation model enables the calculation of minimum required drying times.

2. Materials and Methods

2.1. Materials

Dimethyl carbonate (Solvagreen, ≥99.8%, Carl Roth, Karlsruhe, Germany) and Diethyl carbonate (Solvagreen, ≥99.9%, Carl Roth, Karlsruhe, Germany) were chosen as low boiling solvents, with boiling temperatures of 90 °C and 126 °C (1 bar), respectively. This is contrasted by the ethylene carbonate (for synthesis, EMD Millipore Corp., Billerica, MA, USA), which is of a solid state at ambient conditions (melting temperature 36.4 °C) and boils at 244 °C (at ambient pressure). In the following, the abbreviations of the solvent names given in Table 1 are used.

2.2. Experimental Setup

For the evaporation experiments, a binary and a ternary mixture were prepared, as shown in Figure 4. The solvent mixture was filled into a double-jacket sample vessel (Neubert-Glas, Geratal, Germany), as illustrated in Figure 5, and temperature-controlled to T L . To prevent evaporation in advance, the vessel outlet was covered during the heat-up phase. Dry nitrogen was used as carrier gas for the convective overflow of the liquid–solvent mixture inside the vessel.
A mass-flow controller (MKS Inc., Andover, MA, USA) and a heat exchanger (LAUDA Scientific, Lauda-Königshofen, Germany) were used to set the gas throughput ( V ˙ G ) and the gas temperature ( T G ). Prior to the start and over the course of the evaporation experiment, it was periodically verified that both parameters had reached their target value and were constant. To provide approximately isothermal evaporation conditions, the solvent mixture and the carrier gas were adjusted to the same temperature.
At the beginning of the experiment, the upper part of the vessel, with the integrated nozzle (Neubert-Glas, Geratal, Germany) as the carrier gas inlet in the form of an impinging jet, and the gas outlet opening were connected to the vessel, initiating the evaporation [42,43]. The resulting decrease in the mass of the solvent mixture and the change of its composition were measured time-discrete using a balance and Raman spectroscopy, respectively.
Two different sets of boundary conditions were applied, referred to as “lower drying rate” (LDR) and “higher drying rate” (HDR). Because access to industrially applied process parameters is highly limited, and their variability is assumed to be broad, technically conceivable boundary conditions were selected for the experimental investigations, with the primary focus of clearly revealing their influence on the kinetics and selectivity of the drying process. Furthermore, while the lower temperature is set high enough to ensure sufficient vapor pressures, the upper temperature is limited to minimize undesired reactions. Table 2 shows the corresponding test parameters together with the resulting quantity ( β D E C , G · A P h ), here referred to as “mass transfer number”. This parameter is obtained from the measured evaporation mass flow of pure DEC at LDR and HDR. Its determination is described in more detail in Appendix B, together with the underlying experimental data. Since the surface area cannot be precisely determined due to the surface deformation caused by the impinging carrier gas flow, the mass transfer coefficient is not determinable in isolation. For this reason, the product of both values is introduced to assess the mass transfer. The mass transfer number incorporates two key quantities in process design for technical dryers and thus provides for the transferability of the following results between the different types of convective dryers with matching mass transfer numbers (for the respective component).
Compared to LDR, the evaporation process at HDR is intensified through targeted variation of the gas-side kinetics and phase equilibrium: The increased carrier gas flow (factor 4) and the higher temperature lead to enhanced mass transport of the solvents and elevated partial pressures of the solvents. The increased carrier gas flow also lowers the solvent concentration in the gas phase, which prevents the undesirable solidification of EC in the experimental apparatus.
For the spectroscopic determination of the composition, a small amount of solvent mixture (compared to the total amount) was collected from the liquid phase. The caused solvent loss from sampling was considered and compensated for in the analysis of the experimental data. The sample was analyzed using the Inverse Micro Raman Spectroscopy (IMRS) measurement method introduced by Schabel. The mixture’s composition is determined by superimposing the pure substances’ respective spectra using a weighted sum while minimizing the squared errors between the calculated and measured spectra. This approach enables the precise determination of mass fractions in binary and ternary electrolyte–solvent mixtures. To reduce variation, the sample quantity was divided, and the analysis and evaluation were carried out three times, with an average value finally being formed from the results. Additionally, to consider the influence of calibration on calculated compositions in spectrometric measurements, the data evaluation was carried out using two calibrations, which mapped the minimum and maximum mass fractions of individual components in the mixture.
The total duration of the experiment was adjusted depending on the monitored/prevailing evaporation rate, reaching from 60 to 120 min. As Quarz et al. demonstrated in a comparable experimental setup, the drying-induced composition changes remain consistent irrespective of drying time and initial film height, assuming negligible film-side resistances [44]. Therefore, the findings with regard to selectivity are transferable to industrial drying processes with liquid film heights in the micrometer range.

3. Mathematical Description

The evaporation (phase transition: liquid ↔ gas) of solvent mixtures can be described by coupling the mass transport kinetics in the gas phase and liquid phase under inclusion of the thermodynamic phase equilibrium at the liquid–gas boundary layer. The solvent evaporation flux from the liquid surface into the bulk gas phase is calculated for the case of unidirectional diffusion using the logarithmic Stefan approach. It is derived from the Maxwell–Stefan equation for mass transport in multi-component systems by formally assuming that all binary diffusion coefficients are equal. The steady-state molar flow N ˙ i of the evaporating species from the liquid–gas phase boundary into the gas phase (index g) is given by the following:
N ˙ i = r ˙ ~ i   ×   A P h   ×   ρ ~ G   ×   β i , G   ×   l n r ˙ ~ i y ~ i P h r ˙ ~ i y ~ i
A P h denotes the boundary surface area for the mass transfer from gas/vapor to the liquid phase, and ρ ~ G is the molar density of the gas phase. The relative molar flux r ˙ ~ i introduced by E. U. Schlünder represents the composition of the evaporation flow as the ratio of the evaporation flow of a single component N ˙ i to the total evaporation flow N ˙ T o t a l :
r ˙ ~ i = N ˙ i i N ˙ i = N ˙ i N ˙ T o t a l
Equation (1) takes into account the additional convective mass flux, which describes the unselective drag flows of one solvent species by the evaporation of another, leading to an increased total evaporation flow [45]. In contrast, this mathematically simplified solution neglects the influence of the diffusion of one component in another. The binary mass transfer numbers of the solvent species in the carrier gas ( β i , G   ×   A P h ) of species i in the gas phase G are directly interconnected via their respective diffusion coefficients D i , G . Their calculation on the basis of characterization experiments with pure DEC is explained in more detail in Appendix B. The driving gradient for evaporation is the molar fraction of species i between the phase boundary y ~ i P h and in the ambiance y ~ i . The Raoult–Dalton law is used to calculate the thermodynamic phase equilibrium at the liquid–gas interface. The activity of component i in the mixture is taken into account with a concentration-dependent activity coefficient determined from vapor–liquid equilibrium data, if available (see Section 4.1 and Appendix A). y ~ i P h is then calculated as the ratio of the saturation vapor pressure of component i at the respective temperature ( T L ) and the total pressure. y ~ i is the ratio of the evaporation flow of component i and the total gas flow, which comprises the cumulated evaporation flows of all species and the carrier gas flow. The stirred liquid phase is assumed to be ideally mixed. To enable the calculation with temperature-independent material properties, the experiments are conducted at isothermal conditions (constant temperature) [46].
The evaporation flux of a given species is then used to calculate the amount of this substance in the liquid–solvent mixture over time:
d N L , i d t = N ˙ i
Based on this, the composition of the liquid phase is determined as follows:
x ~ i = N L , i N L , T o t a l = N L , i i N L , i
Finally, the conversion to masses and mass fractions is carried out using the molar masses of the respective species. The simulation provides the time-resolved solvent amount and the corresponding mass fractions of the individual components. These two quantities are the basis for the display of the results.

4. Results and Discussion

4.1. Analysis of Thermodynamic and Diffusion Properties

Figure 6 depicts the saturation vapor pressures and the binary diffusion coefficients in nitrogen (carrier gas) for the temperatures applied in the experiments, 30 °C and 60 °C (correlations compare Section 3). As can be seen in the equations and plots (see Appendix A), the vapor pressure exhibits a considerably stronger increase with temperature than the diffusion coefficient in the gas phase. The plot displays the exceptionally low vapor pressure of EC for both temperatures. At 30 °C, the ratio of the vapor pressures of DMC and EC is around 2400, then it decreases to around 810 at 60 °C. The ratio of the vapor pressures of DEC and EC is around 100 and 160 at 30 °C and 60 °C, respectively. Therefore, the liquid–gas phase transition of EC is significantly unfavored towards DMC and DEC. While this aspect is apparently crucial for the selectivity of evaporation of the mixture, it should still be noted that EC shows a slight preference in terms of mass transport in the carrier gas flow compared to the other solvents, as can be seen from the diffusion coefficients in the gas phase. The increased mobility of EC is explained by the lower molar weight and molecule size. For both temperatures, 30 and 60 °C, the diffusion coefficient of EC is 1.15 times and 1.41 times that of DMC and DEC, respectively.
However, the influence of the mutual interactions of the species involved in the mixture on the thermodynamic phase equilibrium can be crucial when describing the vapor–liquid equilibria of such electrolyte–solvent mixtures. According to the literature, binary mixtures of linear carbonates DMC, DEC and EMC exhibit near-ideal behavior due to their similar chemical structures and physical properties. However, stronger molecular interactions occur in mixtures of linear and cyclic carbonates, such as EC or PC [36]. The vapor–liquid equilibria in Figure 7 demonstrate that both binary mixtures DMC/EC and DEC/EC exhibit nearly ideal thermodynamic behavior, with minor deviations: DEC is slightly less volatile than expected in an ideal mixture with EC, resulting in a lower proportion in the gas phase relative to its liquid-phase molar fraction. Conversely, DMC shows marginally increased volatility, leading to an elevated gas-phase proportion. In summary, the liquid-to-gas phase transition of the high-boiling EC is affected when mixed with these substances.
In total, the evaporation of EC is substantially disadvantaged regarding the thermodynamic properties, so that its slightly more favorable diffusion properties are presumably insignificant. Against this background, the selectivity of the evaporation of a solvent mixture containing these components is expected to be controlled by the respective vapor pressures of each component. In the next step, it is investigated whether the mathematical approach explained in Section 3 is suitable for describing the evaporation of the multicomponent mixture in a time- and component-resolved manner under the assumptions made.

4.2. Evaporation of the Binary Mixture

Initially, the binary solvent mixture of 57.3 wt% (50 mol%) DEC and 42.7 wt% (50 mol%) EC was investigated. Figure 8 shows the experimental data compared with the results of the simulation for the evaporation of the DEC/EC mixture at the LDR and HDR conditions. The change of the mass fractions is plotted as a function of the amount of solvent remaining in the sample vessel relative to the start.
The two experiments show a significant increase in the evaporation rate for the HDR conditions in comparison to the LDR conditions, as indicated by the remaining solvent amount after the same drying time of 60 min. The respective final measurement point corresponds to 60 min drying time. At the HDR conditions, approximately 59 wt% of the solvent mixture has evaporated after 60 min, leading to a remainder of 41 wt%. In contrast, around 92 wt% of the initial solvent amount is left under the LDR conditions after 60 min.
This acceleration for the HDR conditions is explained through intensified mass transfer ( β i , g , Equation (1)) and increased concentration gradients between the vapor–liquid boundary layer and the surrounding gas phase ( y ~ i , P h y ~ i , , Equation (1)). The higher temperature results in enhanced solvent vapor pressure at the vapor–liquid boundary layer and raised diffusion kinetics of the vapor molecules through the surrounding gas phase. The enlarged mass flow of the carrier gas provides for a thinner concentration boundary layer thickness and greater dilution of the evaporated solvent in the gas phase, thus intensifying the evaporation rate. For both drying conditions, EC steadily enriches (and DEC depletes) at an approximately constant rate with decreasing solvent amount. With regard to evaporation selectivity, there is practically no difference between the two drying curves. This means that the volatilization of DEC is greatly preferred compared to EC, with the selectivity being independent of the drying conditions. The experiments follow the expectations in terms of evaporation kinetics and selectivity. For the present solvent mixture and the selected conditions, the evaporation selectivity is controlled by the vapor pressure as the governing thermodynamic property. The mass transport kinetics of the individual species in the gas phase determine the overall evaporation rate.
In the simulation for the binary mixture, the molecular interactions between the two solvents in the mixture are taken into account by concentration-dependent activity coefficients [18]. The calculated curve and the measurement points align throughout their entire course. This observation shows that the employed simulation approach with the material system properties used can reproduce the evaporation selectivity for this binary solvent mixture for the adjusted boundary conditions.
An assessment of the predictive accuracy of the simulation regarding evaporation kinetics is conducted in Figure 9. In these plots, the measured solvent amount per component at certain points in time is visualized along with the calculated solvent amount of both solvents DEC and EC. They show the decreasing solvent amount over time—broken down by components for the LDR and HDR conditions, respectively. Consequently, these figures allow the assessment of simulative reproduction of the evaporation kinetics for different drying conditions.
At the LDR conditions, at the end of the experiment after 120 min, 86 wt% of the initial solvent is left, as opposed to 84 wt% as predicted by the simulation. In the case of the HDR conditions, the calculated share of 42 wt% of the initial solvent remaining after 60 min is according to the experiment. For both experiments, the simulation is in agreement with the measured values, accurately predicting not only the total solvent amount but also the kinetics of both components individually. The slightly larger deviation observed for the LDR conditions can be attributed to the higher uncertainty of spectrometric composition measurements in nearly equimolar mixtures.
The course (ascent/slope) of the curve from the simulation is in accordance with the experimental data points for both experiments. Especially noticeable is the low evaporated amount of EC, which also means that DEC represents almost the total evaporation flow. A conclusion follows that the low-evaporating component EC is indeed the substance within this solvent mixture that limits the initial drying process (evaporation from a free liquid surface) of electrolytes during LIB recycling.

4.3. Evaporation of the Ternary Mixture

In the next step, the evaporation of a ternary mixture was investigated. The low boiling solvent DMC is included as the third electrolyte solvent with an initial mass fraction in the mixture of 35.7 wt% (40 mol%), while DEC and EC account for 46.8 wt% (40 mol%) and 17.5 wt% (20 mol%), respectively. The experiment was conducted using HDR drying conditions. Figure 10 illustrates the evaporation of the ternary mixture at the selected conditions, comparing the experimental and simulation results.
The experiment shows a continuous enrichment of EC. When the remaining solvent consists of nearly pure EC, the overall solvent amount is around 16 wt% of the initial amount. From this, it can be deduced that only 8 wt% of the EC initially present has evaporated when both DMC and DEC are volatilized. This observation emphasizes the low volatility of EC and, thus, its key role in thermal drying processes within LIB recycling processes. Even at these drying conditions with extraordinarily high mass transfer numbers compared to technical dryers, the evaporation rate of EC is low. Furthermore, the plot shows a steady depletion of DMC, while the share of DEC in the mixture first increases, then passes through a maximum of 55 wt%, then decreases again. The experimental data are in accordance with the expectations based on the comparison of the partial vapor pressure of the individual solvents, whereupon DMC is volatilized first, closely followed by DEC and eventually EC. As in the case of the investigated binary mixture, the evaporation selectivity of this ternary mixture is thermodynamically controlled by the vapor pressures of the initial solvents. The evaporation behavior of the ternary mixture was not investigated at the LDR conditions.
The calculation is based on the assumption of thermodynamically ideal mixtures due to the unavailability of ternary vapor–liquid equilibrium (VLE) data. As shown in Figure 10, the change in solvent composition with decreasing solvent amount predicted by the simulation is in agreement with the experimental data. Although the simulation neglects intermolecular interactions, this agreement can be explained by the fact that the mixture predominantly consists of linear carbonates throughout the experiment, which exhibit only weak interactions. As the EC mass fraction increases, the stronger interactions between the linear carbonates and EC gradually become more significant. However, this effect only becomes relevant in the final stage of the experiment, meaning it cannot be captured by the experimental measurement with the required level of detail.
Figure 11 depicts the evaporation kinetics. The measured solvent amount per component is compared to the calculated solvent amount of DMC, DEC and EC taken from the simulation.
The minor deviations for the decrease in solvent amount for each component can be attributed to the neglection of the molecular interactions between the species in the mixture. Overall, the simulation can also reproduce the evaporation behavior of the ternary mixture.
The experiments on the initial drying, which is controlled by the thermodynamics at the free liquid surface and the mass transfer kinetics in the surrounding external gas phase, confirm the expectations that the high-boiling electrolyte solvent EC has significantly lower drying rates than the low boiling DMC and DEC. This means that there is practically a transition from the initial multi-component evaporation to pure-substance evaporation, where EC is clearly the crucial component. The presented simulation model can predict the kinetics and selectivity of the evaporation of multicomponent electrolyte–solvent mixtures from a free surface. Provided that the necessary thermodynamic and gas-kinetic properties of the substances are available, the simulation model can be flexibly applied to predict the drying behavior across a wide range of electrolyte mixtures, as well as other solvent mixtures.

5. Conclusions

This study provides a comprehensive investigation of the initial drying behavior of electrolyte–solvent mixtures under defined process boundary conditions, such as temperature, carrier gas flow and geometry. Focusing on the early drying phase, when the solvent-wetted surface of comminuted battery material is directly exposed to the surrounding gas phase, mass transport resistances within the porous network of electrodes and polymers and sorptive interactions between solvent and solid are negligible. Solvent evaporation is solely governed by gas-phase heat and mass transfer and the thermodynamic phase equilibrium at the vapor–liquid interface.
The experimental results demonstrate that evaporation selectivity is governed by the vapor pressure of the individual solvents, while the drying kinetics are determined by the vapor pressure and the mass transport of the solvent in the gas phase. Low volatility of ethylene carbonate (EC) is the limiting factor in low-temperature thermal treatment. Drying under vacuum or, even further, enhanced carrier gas flow are effective approaches to address the exceedingly low vapor pressures of such solvents, maintaining low temperatures to prevent substantial adverse reactions.
A simulation model for the mathematical description of the solvent-mixture evaporation (at constant temperature) was developed and experimentally validated for the binary and ternary mixtures. It describes the drying behavior (kinetics and selectivity) of the solvent mixtures using the mass transport approach for the gas phase coupled with the thermodynamic phase equilibrium at the vapor–liquid boundary. The simulation reproduces the selectivity and kinetics of the solvent evaporation measured in the experiments in good accordance. Minor deviations in the ternary case are attributed to the assumption of an ideal mixture and are expected to be reduced by incorporating the corresponding non-ideal phase equilibria. The validated simulation model is applicable for calculating minimum required drying times relying only on boundary conditions derived from dryer-specific parameters. Although it is limited to pure solvent evaporation from a free solvent surface, it provides a solid foundation for developing an extended framework that can accurately design and scale real drying processes of EoL batteries with complex material interactions.
To increase the applicability of this simulation model for a reliable prediction of the electrolyte–solvent removal throughout the entire drying process, it needs to be expanded in the following steps. Since the majority of solvent fills the pores of the electrodes and separator, with decreasing solvent content, structural influences are gradually enhanced, and molecular interactions in the electrolyte are altered. As the drying progresses, additional mass transport resistances in the porous and absorbing materials in the battery cell come into play, and the steadily increasing concentration of conductive salt affects the electrolyte solvents’ vapor–liquid equilibrium.
As the simulation model is based exclusively on boundary conditions derived from dryer-specific parameters, it is applicable for determining minimum required drying times across a wide range of dryers and process conditions. Ongoing and future experimental investigations aim to quantify the influences of structural and sorptive mass transport resistance, as well as the solvent/salt interactions in the electrolyte on drying. Significantly reduced drying rates towards low residual solvent loadings were observed in drying experiments with electrodes and separators. Since mass transport within polymers is significantly slower than in the gas phase, the presence of absorbed electrolyte solvent in the polymer components (specifically the binders in the electrodes and the polymer-based commercial separators) is likely. In this case, the release of EC could be strongly favored over DMC and DEC due to its smaller molecule size and, thus, higher mobility. Determining the diffusion coefficients and sorption equilibria of solvents in absorbing materials allows for describing effective drying kinetics.
Overall, this study lays the foundation for a physics-based, holistic simulation framework that can predict electrolyte–solvent evaporation across various dryer configurations and process boundary conditions. Such a model is essential for optimizing thermal drying in the mechanical–hydrometallurgical recycling process of liquid electrolyte batteries.

Author Contributions

Conceptualization, L.L., T.H., P.S. and W.S.; methodology, L.L. and T.H.; software, L.L. and T.H.; validation, L.L., T.H. and P.S.; formal analysis, L.L. and P.S.; investigation, L.L.; resources, P.S. and W.S.; data curation, L.L., P.S. and W.S.; writing—original draft preparation, L.L.; writing—review and editing, L.L., T.H., P.S. and W.S.; visualization, L.L.; supervision, P.S. and W.S.; project administration, L.L., P.S. and W.S.; funding acquisition, P.S. and W.S. All authors have read and agreed to the published version of the manuscript.

Funding

This research was funded by the Federal Ministry of Education, Research and Technology, (BMFTR), grant number 03XP0354C.

Data Availability Statement

The data that support the findings of this study are available from the corresponding author upon reasonable request.

Conflicts of Interest

The authors declare no conflicts of interest.

Appendix A. Calculation of Saturation Vapor Pressure and Binary Diffusion Coefficients

For the calculation of the saturation vapor pressures p i , the correlations with their respective coefficients are obtained from [33] for DMC and DEC and from [47] for EC. For the binary DEC/EC mixture, the molecular interactions between the species are considered by incorporation of activity coefficients γ i . Based on the vapor–liquid equilibrium measured in [36], using the least-squares method, concentration-dependent activity coefficients are calculated for DEC and EC:
l n γ D E C = C 1 + 2 C 2 C 1 x D E C x E C 2
l n γ E C = C 2 + 2 C 1 C 2 x E C x D E C 2
The resulting equation is based on the Margules activity model with the coefficients
C 1 = 1.4090
C 2 = 1.6949
Since no vapor-liquid-equilibrium dataset is available for the ternary mixture, the activity coefficients are set to unity ( γ D M C = 1 , γ D E C = 1 , γ E C = 1 ).
The binary diffusion coefficients in the gas phase D i , G are calculated using the Fuller equation, which requires the molar mass and diffusion volumes of the respective two molecules; in this work, each solvent is diffusing in nitrogen. The diffusion volumes are determined according to [48]. Table A1 lists both quantities.
Table A1. Molar mass and diffusion volume of the individual molecules.
MoleculeMolar Mass
/ g / m o l
Diffusion Volume
/-
N22818.5
DMC9079.89
DEC118120.93
EC8856.97
Both the saturation vapor pressure and the binary diffusion coefficient are temperature-dependent, but to different extents. Figure A1 plots the ratio of vapor pressure to diffusion coefficient to compare their temperature dependencies. The increasing trend of the curves with temperature indicates that vapor pressure depends more strongly on temperature than diffusion coefficient does.
Figure A1. Ratio of the saturation vapor pressure p i * to the binary diffusion coefficient D i , G for the components DMC, DEC and EC on a logarithmic scale as a function of temperature.
Batteries 11 00436 g0a1

Appendix B. Determination of Binary Mass Transfer Numbers

By measuring the evaporation mass flow of pure DEC ( M ˙ D E C ) for both boundary conditions over a time span of 15 (HDR) and 20 (LDR) minutes, the binary mass transfer number for DEC ( β D E C , G × A P h ) is determined after rearranging Equation (1). Using the molar mass of the evaporating species M ~ D E C , the mass flow is converted to a molar flow: N ˙ D E C   =   M ˙ D E C / M ~ D E C . Since there is a single component evaporating, r ˙ i ~   =   1 applies. The ambience gas phase is assumed to consist of pure N 2 due to the high dilution of DEC vapor ( y ~ D E C   =   0 ). The individual calculation parameters are listed in Table A2.
Binary mass transfer numbers for the individual solvent species i in the carrier gas are then calculated based on the measurement for DEC using the Sherwood correlation and the binary diffusion coefficients:
β i , G   ×   A P h = D D E C , G D i , G n 1   ×   β D E C , G   ×   A P h
For turbulent flow, the exponent n is 0.42.
Table A2. Calculation parameters for the determination of the mass transfer number of DEC at the LDR and HDR boundary conditions on the basis of the measured evaporation mass flow of DEC.
ParameterUnitLDRHDR
M ˙ D E C k g / s 4.72   ×   10 6 1.05   ×   10 4
N ˙ D E C m o l / s 4.00   ×   10 5 8.90   ×   10 4
ρ ~ G m o l / m 3 40.3 36.6
y ~ D E C P h - 0.0193 0.0911
β D E C , G   ×   A P h m 3 / s 0.51   ×   10 4 2.55   ×   10 4

References

  1. Pinegar, H.; Smith, Y.R. Recycling of End-of-Life Lithium Ion Batteries, Part I: Commercial Processes. J. Sustain. Metall. 2019, 5, 402–416. [Google Scholar] [CrossRef]
  2. Windisch-Kern, S.; Gerold, E.; Nigl, T.; Jandric, A.; Altendorfer, M.; Rutrecht, B.; Scherhaufer, S.; Raupenstrauch, H.; Pomberger, R.; Antrekowitsch, H.; et al. Recycling Chains for Lithium-Ion Batteries: A Critical Examination of Current Challenges, Opportunities and Process Dependencies. Waste Manag. 2022, 138, 125–139. [Google Scholar] [CrossRef]
  3. Islam, M.T.; Iyer-Raniga, U. Lithium-Ion Battery Recycling in the Circular Economy: A Review. Recycling 2022, 7, 33. [Google Scholar] [CrossRef]
  4. Velázquez-Martínez, O.; Valio, J.; Santasalo-Aarnio, A.; Reuter, M.; Serna-Guerrero, R. A Critical Review of Lithium-Ion Battery Recycling Processes from a Circular Economy Perspective. Batteries 2019, 5, 68. [Google Scholar] [CrossRef]
  5. Neumann, J.; Petranikova, M.; Meeus, M.; Gamarra, J.D.; Younesi, R.; Winter, M.; Nowak, S. Recycling of Lithium-Ion Batteries—Current State of the Art, Circular Economy, and Next Generation Recycling. Adv. Energy Mater. 2022, 12, 2102917. [Google Scholar] [CrossRef]
  6. Doose, S.; Mayer, J.K.; Michalowski, P.; Kwade, A. Challenges in Ecofriendly Battery Recycling and Closed Material Cycles: A Perspective on Future Lithium Battery Generations. Metals 2021, 11, 291. [Google Scholar] [CrossRef]
  7. Jow, T.R.; Xu, K.; Borodin, O.; Ue, M. Electrolytes for Lithium and Lithium-Ion Batteries; Springer: New York, NY, USA, 2014; Volume 58, ISBN 978-1-4939-0301-6. [Google Scholar]
  8. Schmuch, R.; Wagner, R.; Hörpel, G.; Placke, T.; Winter, M. Performance and Cost of Materials for Lithium-Based Rechargeable Automotive Batteries. Nat. Energy 2018, 3, 267–278. [Google Scholar] [CrossRef]
  9. Kwade, A.; Diekmann, J. Recycling of Lithium-Ion Batteries: The LithoRec Way the LithoRec Way; Springer International Publishing: Cham, Switzerland, 2018; ISBN 978-3-319-70571-2. [Google Scholar]
  10. Liu, Y.-K.; Zhao, C.-Z.; Du, J.; Zhang, X.-Q.; Chen, A.-B.; Zhang, Q. Research Progresses of Liquid Electrolytes in Lithium-Ion Batteries. Small 2023, 19, 2205315. [Google Scholar] [CrossRef]
  11. Diekmann, J.; Hanisch, C.; Froböse, L.; Schälicke, G.; Loellhoeffel, T.; Fölster, A.-S.; Kwade, A. Ecological Recycling of Lithium-Ion Batteries from Electric Vehicles with Focus on Mechanical Processes. J. Electrochem. Soc. 2017, 164, 6184–6191. [Google Scholar] [CrossRef]
  12. Mansir, I.B.; Okonkwo, P.C. Component Degradation in Lithium-Ion Batteries and Their Sustainability: A Concise Overview. Sustainability 2025, 17, 1000. [Google Scholar] [CrossRef]
  13. Rufino Júnior, C.A.; Sanseverino, E.R.; Gallo, P.; Amaral, M.M.; Koch, D.; Kotak, Y.; Diel, S.; Walter, G.; Schweiger, H.-G.; Zanin, H. Unraveling the Degradation Mechanisms of Lithium-Ion Batteries. Energies 2024, 17, 3372. [Google Scholar] [CrossRef]
  14. Henschel, J.; Horsthemke, F.; Stenzel, Y.P.; Evertz, M.; Girod, S.; Lürenbaum, C.; Kösters, K.; Wiemers-Meyer, S.; Winter, M.; Nowak, S. Lithium Ion Battery Electrolyte Degradation of Field-Tested Electric Vehicle Battery Cells—A Comprehensive Analytical Study. J. Power Sources 2020, 447, 227370. [Google Scholar] [CrossRef]
  15. Galushkin, N.E.; Yazvinskaya, N.N.; Galushkin, D.N. Mechanism of Gases Generation during Lithium-Ion Batteries Cycling. J. Electrochem. Soc. 2019, 166, A897–A908. [Google Scholar] [CrossRef]
  16. Schultz, C.; Vedder, S.; Streipert, B.; Winter, M.; Nowak, S. Quantitative Investigation of the Decomposition of Organic Lithium Ion Battery Electrolytes with LC-MS/MS. RSC Adv. 2017, 7, 27853–27862. [Google Scholar] [CrossRef]
  17. Yang, H.; Zhuang, G.V.; Ross, P.N. Thermal Stability of LiPF6 Salt and Li-Ion Battery Electrolytes Containing LiPF6. J. Power Sources 2006, 161, 573–579. [Google Scholar] [CrossRef]
  18. Lux, S.F.; Lucas, I.T.; Pollak, E.; Passerini, S.; Winter, M.; Kostecki, R. The Mechanism of HF Formation in LiPF6 Based Organic Carbonate Electrolytes. Electrochem. Commun. 2012, 14, 47–50. [Google Scholar] [CrossRef]
  19. Terborg, L.; Weber, S.; Blaske, F.; Passerini, S.; Winter, M.; Karst, U.; Nowak, S. Investigation of Thermal Aging and Hydrolysis Mechanisms in Commercial Lithium Ion Battery Electrolyte. J. Power Sources 2013, 242, 832–837. [Google Scholar] [CrossRef]
  20. Handel, P.; Fauler, G.; Kapper, K.; Schmuck, M.; Stangl, C.; Fischer, R.; Uhlig, F.; Koller, S. Thermal Aging of Electrolytes Used in Lithium-Ion Batteries—An Investigation of the Impact of Protic Impurities and Different Housing Materials. J. Power Sources 2014, 267, 255–259. [Google Scholar] [CrossRef]
  21. Andersson, P.; Blomqvist, P.; Lorén, A.; Larsson, F. Using Fourier Transform Infrared Spectroscopy to Determine Toxic Gases in Fires with Lithium-ion Batteries. Fire Mater. 2016, 40, 999–1015. [Google Scholar] [CrossRef]
  22. Lebedeva, N.P.; Persio, F.D.; Kosmidou, T.; Dams, D.; Pfrang, A.; Kersys, A.; Boon-Brett, L. Amount of Free Liquid Electrolyte in Commercial Large Format Prismatic Li-Ion Battery Cells. J. Electrochem. Soc. 2019, 166, A779–A786. [Google Scholar] [CrossRef]
  23. Bertilsson, S.; Larsson, F.; Furlani, M.; Albinsson, I.; Mellander, B.-E. Lithium-Ion Battery Electrolyte Emissions Analyzed by Coupled Thermogravimetric/Fourier-Transform Infrared Spectroscopy. J. Power Sources 2017, 365, 446–455. [Google Scholar] [CrossRef]
  24. Diaz, F.; Wang, Y.; Weyhe, R.; Friedrich, B. Gas Generation Measurement and Evaluation during Mechanical Processing and Thermal Treatment of Spent Li-Ion Batteries. Waste Manag. 2019, 84, 102–111. [Google Scholar] [CrossRef]
  25. Arshad, F.; Li, L.; Amin, K.; Fan, E.; Manurkar, N.; Ahmad, A.; Yang, J.; Wu, F.; Chen, R. A Comprehensive Review of the Advancement in Recycling the Anode and Electrolyte from Spent Lithium Ion Batteries. ACS Sustain. Chem. Eng. 2020, 8, 13527–13554. [Google Scholar] [CrossRef]
  26. Xiao, J.; Zhou, T.; Shen, R.; Xu, Z. Migration and Transformation Mechanism of Toxic Electrolytes During Mechanical Treatment of Spent Lithium-Ion Batteries. ACS Sustain. Chem. Eng. 2023, 11, 4707–4715. [Google Scholar] [CrossRef]
  27. Xu, R.; Lei, S.; Wang, T.; Yi, C.; Sun, W.; Yang, Y. Lithium Recovery and Solvent Reuse from Electrolyte of Spent Lithium-Ion Battery. Waste Manag. 2023, 167, 135–140. [Google Scholar] [CrossRef]
  28. Eshetu, G.G.; Grugeon, S.; Laruelle, S.; Boyanov, S.; Lecocq, A.; Bertrand, J.-P.; Marlair, G. In-Depth Safety-Focused Analysis of Solvents Used in Electrolytes for Large Scale Lithium Ion Batteries. Phys. Chem. Chem. Phys. 2013, 15, 9145–9155. [Google Scholar] [CrossRef] [PubMed]
  29. Zheng, X.; Zhu, Z.; Lin, X.; Zhang, Y.; He, Y.; Cao, H.; Sun, Z. A Mini-Review on Metal Recycling from Spent Lithium Ion Batteries. Engineering 2018, 4, 361–370. [Google Scholar] [CrossRef]
  30. Zhang, G.; Ding, L.; Yuan, X.; He, Y.; Wang, H.; He, J. Recycling of Electrode Materials from Spent Lithium-Ion Battery by Pyrolysis-Assisted Flotation. J. Environ. Chem. Eng. 2021, 9, 106777. [Google Scholar] [CrossRef]
  31. Park, J.; Park, S.; Beak, M.; Jeong, S.; Kwon, K. Impacts of Residual Electrolyte Components of Spent Lithium-Ion Batteries on the Physical/Electrochemical Properties of Resynthesized Cathode Active Materials. J. Clean. Prod. 2022, 379, 134570. [Google Scholar] [CrossRef]
  32. Diekmann, J.; Hanisch, C.; Loellhoeffel, T.; Schalicke, G.; Kwade, A. Ecologically Friendly Recycling of Lithium-Ion Batteries—The LithoRec Process. ECS Trans. 2016, 73, 1. [Google Scholar] [CrossRef]
  33. Zhang, R.; Shi, X.; Esan, O.C.; An, L. Organic Electrolytes Recycling From Spent Lithium-Ion Batteries. Glob. Chall. 2022, 6, 2200050. [Google Scholar] [CrossRef]
  34. Kaya, M. State-of-the-Art Lithium-Ion Battery Recycling Technologies. Circ. Econ. 2022, 1, 100015. [Google Scholar] [CrossRef]
  35. Stehmann, F.; Bradtmöller, C.; Scholl, S. Separation of the Electrolyte—Thermal Drying. In Recycling of Lithium-Ion Batteries; Springer: Cham, Switzerland, 2018; pp. 139–153. [Google Scholar]
  36. Nagl, R.; Fan, Z.; Nobis, C.; Kiefer, C.; Fischer, A.; Zhang, T.; Zeiner, T.; Fischlschweiger, M. Study of Isobaric Vapor–Liquid Equilibria of Diethyl Carbonate + Ethylene Carbonate for Lithium-Ion Battery Electrolyte Solvent Recycling. J. Mol. Liq. 2023, 386, 122449. [Google Scholar] [CrossRef]
  37. Fang, Y.-J.; Qian, J.-M. Isobaric Vapor−Liquid Equilibria of Binary Mixtures Containing the Carbonate Group −OCOO−. J. Chem. Eng. Data 2005, 50, 340–343. [Google Scholar] [CrossRef]
  38. Hu, C.-C.; Chiu, P.-H.; Wang, S.-J.; Cheng, S.-H. Isobaric Vapor–Liquid Equilibria for Binary Systems of Diethyl Carbonate + Propylene Carbonate, Diethyl Carbonate + Propylene Glycol, and Ethanol + Propylene Carbonate at 101.3 kPa. J. Chem. Eng. Data 2015, 60, 1487–1494. [Google Scholar] [CrossRef]
  39. Stehmann, F.; Prziwara, P.; Bradtmöller, C.; Schoenitz, M.; Scholl, S. Adsorption Equilibria of Dimethyl Carbonate and Ethyl Methyl Carbonate onto Activated Carbon. Chem. Ing. Tech. 2016, 88, 327–335. [Google Scholar] [CrossRef]
  40. Werner, D.M.; Mütze, T.; Peuker, U.A. Influence of Cell Opening Methods on Organic Solvent Removal during Pretreatment in Lithium-Ion Battery Recycling. Waste Manag. Res. 2022, 40, 1015–1026. [Google Scholar] [CrossRef] [PubMed]
  41. Zachmann, N.; Petranikova, M.; Ebin, B. Electrolyte Recovery from Spent Lithium-Ion Batteries Using a Low Temperature Thermal Treatment Process. J. Ind. Eng. Chem. 2023, 118, 351–361. [Google Scholar] [CrossRef]
  42. Riede, T.; Schlünder, E.-U. Selective Evaporation of a Binary Mixture into Dry or Humified Air. Chem. Eng. Process. 1990, 27, 83–93. [Google Scholar] [CrossRef]
  43. Riede, T.; Schlünder, E.U. Selective Evaporation of a Ternary Mixture Containing One Nonvolatile Component with Regard to Drying Processes. Chem. Eng. Process. 1990, 28, 151–163. [Google Scholar] [CrossRef]
  44. Quarz, P.; Zimmerer, N.; Scharfer, P.; Schabel, W. About Drying Phenomena of Fuel Cell and Electrolyzer CCM Inks: Selectivity of the Evaporation of 1-propanol/Water Mixtures. Fuel Cells 2024, 24, 108–121. [Google Scholar] [CrossRef]
  45. Taylor, R.; Krishna, R. Multicomponent Mass Transfer; Wiley Series in Chemical Engineering; John Wiley & Sons, Inc.: New York, NY, USA, 1993; ISBN 0-471-57417-1. [Google Scholar]
  46. Siebel, D.K. Zur Mehrkomponentendiffusion in Polymer-Lösemittel-Systemen: Untersuchungen Im Kontext Der Polymerfilmtrocknung Mittels Inverser Mikro-Raman-Spektroskopie; Verlag Dr. Hut: Karlsruhe, Germany, 2017. [Google Scholar]
  47. Yaws, C.L. Handbook of Chemical Compound Data for Process Safety: Comprehensive Safety and Health-Related Data for Hydrocarbons and Organic Chemicals: Selected Data for Inorganic Chemicals; Gulf Publishing Company: Houston, TX, USA, 1997; ISBN 0-88415-381-9. [Google Scholar]
  48. Kleiber, M.; Joh, R. D1 Berechnungsmethoden für Stoffeigenschaften. In VDI-Wärmeatlas; Springer Vieweg: Berlin/Heidelberg, Germany, 2013; Volumes 137–174, ISBN 978-3-642-19980-6. [Google Scholar] [CrossRef]
Figure 1. Materials and structure of a lithium-ion battery cell with the thickness and porosity of the electrodes (anode and cathode) and the separator. The porous network in the cell is filled with liquid electrolyte, accounting for approx. 25 vol.% of the electrolyte solvent on the cell level (without current collectors and casing).
Batteries 11 00436 g001
Figure 2. Flow diagram for a process combining mechanical and hydrometallurgical steps. The drying step takes place at an early stage, directly after shredding, with the solvents being released in both steps. The organic residues are decomposed in the downstream pyrolysis stage.
Batteries 11 00436 g002
Figure 3. Illustration of the mass transport mechanisms occurring during drying using the example of an anode material agglomerate. Three resistances can influence the drying process: (1) mass transfer in the external gas phase, (2) mass transfer in the porous gas phase between the particles and (3) desorption/mass transfer in the absorbing materials, e.g., the polymeric binder.
Batteries 11 00436 g003
Figure 4. Composition of investigated electrolyte–solvent mixtures. (a) Binary: DEC and EC. (b) Ternary: DMC, DEC and EC.
Batteries 11 00436 g004
Figure 5. Illustration of the experimental setup with a focus on the phase boundary: The binary (top) and ternary (bottom) solvent mixture (red), respectively, is temperature-controlled to T L and mixed with a magnetic stirrer. The carrier gas flow (light blue) (conditioned flow rate V ˙ G and temperature T G ) flows onto the liquid surface and leaves the system together with the evaporated solvent. The evaporation mass flow rates m ˙ i depend on the molar fractions of the respective components in the gas phase at the phase boundary y ~ i P h . For an ideally mixed liquid phase, ( x ~ i P h   =   x ~ i ) , y ~ i P h can be calculated from the bulk composition of the liquid mixture ( x ~ i ) by means of the vapor–liquid equilibrium (VLE). Raman spectroscopy is used to determine the mixture’s composition ( x ~ i ) from samples collected at specific points in time. The spectra of the mixture at the beginning of the experiments are depicted on the right.
Batteries 11 00436 g005
Figure 6. Saturation vapor pressure and diffusion coefficients of pure electrolyte solvents (DMC, DEC and EC) at 30 and 60 °C. (a) Vapor pressure and boiling temperatures T b : DMC, with a boiling point at 90 °C, has a high vapor pressure, and EC, with a boiling temperature of 244 °C, shows a very low vapor pressure at 30 and 60 °C. (b) Calculated diffusion coefficients of DMC and EC in nitrogen: On the contrary, due to its low molecular weight and size, EC has the highest diffusion coefficient in the gas phase and is, therefore, the solvent species with the fastest diffusion kinetics in the gas phase. This indicates that kinetically or thermodynamically dominated processes can be quite different.
Batteries 11 00436 g006
Figure 7. Vapor–liquid equilibrium of (a) DEC/EC and (b) DMC/EC at 1013 mbar. Experimental data are obtained from Nagl et al. [36] for DEC/EC and from Fang et al. [37] for DMC/EC. Squares represent the saturated liquid curve (SL), while triangles represent the saturated vapor curve (SV). The molar fraction in the liquid phase x ~ i (represented by the SL) corresponds to the molar fraction in the gas phase y ~ i (represented by the SV) at the same temperature. Based on the VLE, equations for concentration-dependent activity coefficients are derived for DEC and EC (see Appendix A). The calculated saturated liquid and saturated vapor curves are plotted as dashed and dotted lines, respectively. The deviation between the fitted and the ideal saturation curves serves as an indicator of the non-ideal behavior of the mixtures. The differences in the boiling temperatures given in Figure 7a are due to discrepancies between the solvent datasheets and the empirical vapor pressure correlations used for the calculations.
Batteries 11 00436 g007
Figure 8. Comparison of the experiment and the simulation for the evaporation of the binary mixture consisting of DEC and EC at (a) LDR ( β D E C , G · A P h = 0.51 × 10 4   m 3   s 1 , T = 30   ° C ) and (b) HDR conditions ( β D E C , G · A P h = 2.55   ×   10 4   m 3   s 1 , T = 60   ° C ) . The error bars represent the spread of the calculated compositions resulting from the different calibrations used to evaluate the spectral data.
Batteries 11 00436 g008
Figure 9. Measured and calculated solvent amount over time at (a) LDR ( β D E C , G · A P h = 0.51   ×   10 4   m 3   s 1 , T = 30   ° C ) and (b) HDR conditions ( β D E C , G · A P h = 2.55   ×   10 4   m 3   s 1 , T = 60   ° C ) , broken down for the two solvents EC and DEC. Note the different time scales on the x-axis since the time scales are chosen differently for the two cases. The error bars represent the spread of the calculated compositions resulting from the different calibrations used to evaluate the spectral data.
Batteries 11 00436 g009
Figure 10. Comparison of the experiment and the simulation for the evaporation of the ternary mixture consisting of DMC, DEC and EC at the HDR conditions ( β D E C , G · A P h = 2.55   ×   10 4   m 3   s 1 , T = 60   ° C ). The error bars represent the spread of the calculated compositions resulting from the different calibrations used to evaluate the spectral data.
Batteries 11 00436 g010
Figure 11. Comparison of the simulation and the experiment for the evaporation kinetics of the ternary mixture consisting of DMC, DEC and EC at the HDR conditions ( β D E C , G · A P h = 2.55   ×   10 4   m 3   s 1 , T = 60   ° C ) . The measured and calculated solvent amounts are broken down for the three solvents over time. The error bars represent the spread of the calculated compositions resulting from the different calibrations used to evaluate the spectral data.
Batteries 11 00436 g011
Table 1. Solvents with abbreviations and boiling temperatures at 1 bar.
SolventAbbreviation T b / ° C (1 bar)
Dimethyl carbonateDMC90
Diethyl carbonateDEC126
Ethylene carbonateEC244
Table 2. Boundary conditions applied for the drying experiments. Two sets of conditions, referred to as “higher drying rate” (HDR) and “lower drying rate” (LDR), are used. They differ in mass transfer number ( β D E C , G · A P h ) and the temperatures of the solvent mixture and the carrier gas. At HDR, the mass transfer of DEC into the carrier gas is about 5 times as intense as for LDR.
Drying Condition
β D E C , G · A P h / m 3   s 1
T L / ° C
T G / ° C
Higher drying rate (HDR)2.55 × 10−46060
Lower drying rate (LDR)0.51 × 10−43030
Disclaimer/Publisher’s Note: The statements, opinions and data contained in all publications are solely those of the individual author(s) and contributor(s) and not of MDPI and/or the editor(s). MDPI and/or the editor(s) disclaim responsibility for any injury to people or property resulting from any ideas, methods, instructions or products referred to in the content.

