Article

Research on External Short Circuit Fault Evaluation Method for Li-Ion Batteries Based on Impedance Spectrum Feature Extraction

1
Institute of Advanced Technology, University of Science and Technology of China, Hefei 230031, China
2
Department of Automation, University of Science and Technology of China, Hefei 230027, China
*
Author to whom correspondence should be addressed.
Batteries 2025, 11(12), 437; https://doi.org/10.3390/batteries11120437
Submission received: 28 October 2025 / Revised: 19 November 2025 / Accepted: 23 November 2025 / Published: 25 November 2025
(This article belongs to the Special Issue Control, Modelling, and Management of Batteries)

Abstract

Accurate evaluation of the severity of external short-circuit (ESC) faults in li-ion batteries is critical to ensuring the safety and reliability of battery systems. This study proposes a novel ESC fault assessment method based on electrochemical impedance spectroscopy (EIS) and differential feature extraction from relaxation time distributions. By comparing EIS responses before and after the short circuit, differential curves are constructed, and relevant peak descriptors are extracted to form physically interpretable feature vectors without requiring equivalent circuit modeling. Standardized feature data are further analyzed using principal component analysis (PCA) and K-Means clustering to perform unsupervised classification of fault severity. In addition, a differential evolution algorithm is employed to adaptively optimize the feature weights, enhancing the monotonic correlation between the weighted scores and actual short-circuit durations. The resulting SeverityScore provides an interpretable, mechanism-driven indicator of ESC fault severity. Experimental results demonstrate that the proposed method effectively distinguishes between mild and moderate short-circuit conditions and generalizes well across four independent battery groups. The model, trained on a single group, demonstrates strong robustness by accurately classifying the fault severity for three unseen validation groups. This data-driven framework offers a robust and model-free approach for fault evaluation, providing a promising tool for health monitoring and risk assessment in li-ion batteries.

1. Introduction

With the continuous development of renewable energy technologies and the widespread proliferation of mobile smart devices, li-ion batteries have become a cornerstone in the global energy transition due to their high energy density, long cycle life, and excellent rechargeability [1,2,3]. They are widely applied in consumer electronics, electric vehicles (EVs), and large-scale energy storage systems. However, during practical operation, li-ion batteries are susceptible to extreme conditions such as overcharging, over-discharging, and short circuits, which can lead to performance degradation or even catastrophic safety incidents like thermal runaway and explosions. Therefore, the development of efficient and accurate battery fault diagnosis techniques holds significant theoretical and practical value for ensuring system safety [4,5].
In recent years, as application scenarios have become increasingly complex, early fault detection, severity assessment, and failure evolution modeling have attracted growing research interest. Existing approaches mainly rely on equivalent circuit modeling, thermal model analysis, or data-driven strategies [6]. Methods such as multi-scale mechanism modeling with multi-feature fusion [7], real-time monitoring systems combining Internet of Things (IoT) and multiphysics coupling models [8], and fault isolation techniques integrating battery management systems (BMS) with domain-adaptive neural networks [9,10], have demonstrated considerable progress in state estimation and lifetime prediction. However, for high-risk fault modes like external short circuits (ESCs), further investigations are still lacking [11], especially regarding how to quantify and classify ESC severity under varying short-circuit durations. Key challenges remain in terms of diagnostic accuracy, response time, and feature clarity.

1.1. Literature Review

ESCs are typically caused by external factors such as metallic foreign objects, battery casing rupture, or connector failure, leading to direct contact between the positive and negative electrodes. This results in severe current surges and rapid temperature rise and potentially triggers thermal runaway [12,13]. Chen et al. [14] proposed a two-layer model based on a simplified equivalent circuit, combined with a dynamic neighborhood particle swarm optimization (DPSO) algorithm, to achieve rapid fault diagnosis even under inaccurate initial state-of-charge (SOC) estimation, completing diagnosis within 5 s with a voltage error of less than 0.36 V. Ma et al. [15] adopted a graph-structured autoencoder that integrates sensor connectivity and robustness strategies, significantly improving the accuracy and generalization of fault detection. Zhang et al. [16] conducted systematic experiments to analyze the effects of temperature, SOC, short-circuit resistance, and duration on ESC characteristics from single cells to battery modules. Their work revealed the fire evolution mechanisms induced by module-level ESCs, providing theoretical support for future algorithm development. Addressing the lack of research on the impact of single-cell short circuits on battery packs in traditional methods, Yang et al. [17] proposed a fault diagnosis method based on artificial neural networks. This approach estimates the short-circuit current from voltage signals and predicts temperature rise distribution using a 3D electro-thermal model, achieving accurate diagnosis without the need for temperature or current sensors. Xiong et al. [18] developed a two-step equivalent circuit model to decouple polarization voltage variations from abrupt current drops and employed a genetic algorithm to optimize parameters, demonstrating strong generalization performance. Moreover, since the severity of short-circuit faults directly affects battery safety, performance recovery, and recycling value, accurate identification and evaluation of ESC severity has become a key research focus in li-ion battery safety management [19].
Despite these contributions, existing approaches generally fall into two categories: model-driven methods reliant on equivalent circuit approximations and data-driven black-box models with limited interpretability. Furthermore, most studies emphasize either fault occurrence or current surge quantification while failing to capture the underlying temporal evolution of electrochemical impedance during ESCs, an essential aspect for mechanism-aware fault severity assessment.
As a powerful tool for characterizing internal electrochemical processes of batteries, EIS offers advantages in capturing interfacial reactions, charge transfer, and diffusion behaviors. By deconvoluting EIS data, the distribution of relaxation times can be obtained, which reveals the dynamics of multi-timescale processes inside the battery [20] and further reflects the disturbances introduced by short-circuit conditions. In recent years, the integration of electrochemical impedance spectroscopy (EIS) with machine learning has become an important tool for battery state estimation [21]. For instance, Li et al. [22] proposed a method combining EIS features and machine learning models for capacity estimation. Similarly, Lin et al. [23] employed transfer learning strategies based on EIS data to enhance the robustness of state of health estimation.
Moreover, soft clustering techniques have been applied in the study of retired battery reutilization. Related research utilized Gaussian Mixture Models (GMMs) to cluster EIS data from retired batteries, effectively assessing their health status and demonstrating the effectiveness of EIS in state-of-health (SOH) discrimination [24]. Yang et al. [25] conducted a comprehensive review on the research progress of passive EIS in battery management. They pointed out that this technique offers advantages such as non-invasiveness, low energy consumption, and strong real-time capability, making it well-suited for embedded system environments. Moreover, it holds great potential for future applications in in-situ diagnostics and intelligent battery management systems. Other studies [26] showed that combining partial EIS measurements with machine learning algorithms enables fast SOH estimation, proving that reliable predictions are feasible even with limited data.
In existing studies, the severity of external short-circuit faults in li-ion batteries is commonly assessed using the following mainstream methods: (1) Terminal voltage decay rate method, which evaluates fault intensity by measuring the rate of voltage drop during the short-circuit process; this method is suitable for preliminary screening [12]. (2) Current–time integration method (I–t method), which estimates the energy impact on the cell by integrating the current under the short-circuit discharge curve [27]. (3) Equivalent circuit parameter variation method (e.g., increment of R c t ), which is based on a second-order RC model and extracts changes in internal resistance and interfacial impedance for fault identification [28]. A detailed comparison of these methods (including the proposed approach) is presented in Table 1.
Despite the relatively good performance of the aforementioned methods in conventional scenarios, existing research primarily focuses on estimating battery health status or capacity, with insufficient attention given to the temporal evolution of impedance characteristics under external short-circuit conditions. Additionally, existing clustering and classification models often rely heavily on fully supervised learning, which limits their generalization to unknown fault types or situations with limited labeled data.
To address the aforementioned gap, this study proposes a method for evaluating external short-circuit faults in li-ion batteries based on impedance spectrum feature extraction. This method extracts peak features from the relaxation time distribution curve and analyzes them using unsupervised learning algorithms such as K-Means. This method emphasizes adaptability across different battery samples and reveals the temporal correlation between impedance changes and short-circuit severity, offering both theoretical support and practical value for battery safety management.

1.2. Paper Contributions

To address the limitations of existing binary fault detection methods, a novel framework for quantifying ESC severity is presented. The specific contributions of this work to further scientific development are summarized as follows:
(1)
A differential DRT analysis method is proposed for the first time to grade ESC severity. Unlike traditional methods that rely on raw voltage or temperature thresholds, this approach isolates fault-induced electrochemical changes, specifically mass transport limitations from static inconsistencies, thereby establishing a new, high-sensitivity metric for battery safety assessment.
(2)
The gap between “black-box” machine learning and “white-box” electrochemical mechanisms is bridged through the construction of physically interpretable feature vectors. By extracting features directly from DRT peaks and optimizing them via differential evolution, the proposed model retains electrochemical interpretability, offering a potential solution to the “trust” problem in AI-based diagnostics.
(3)
A robust, model-free diagnostic paradigm is established that operates without the need for complex equivalent circuit modeling or extensive labeled datasets. This unsupervised framework demonstrates strong cross-batch generalization and possesses the potential to be extended for diagnosing other complex failure modes, such as internal short circuits and lithium plating, thereby accelerating the development of next-generation intelligent Battery Management Systems.

1.3. Paper Structure

The remainder of this paper is organized as follows. Section 2 introduces the experimental platform design, short-circuit fault induction protocol, and the construction of the battery dataset under different external short-circuit durations. Section 3 presents the theoretical foundation and full implementation of the proposed ESC fault evaluation method, including relaxation time inversion based on EIS, difference distribution construction, peak-based feature extraction, and unsupervised learning via PCA and K-Means clustering. Section 4 provides detailed analysis of experimental results, including relaxation time distribution patterns before and after faults, dimensionality-reduced feature clustering, algorithm comparisons, and severity scoring using optimized feature weights. Section 5 concludes the paper by summarizing the methodological advantages and outlining future directions such as real-time applications and extension to other fault types.

2. Test Platform and Dataset

2.1. Test Platform

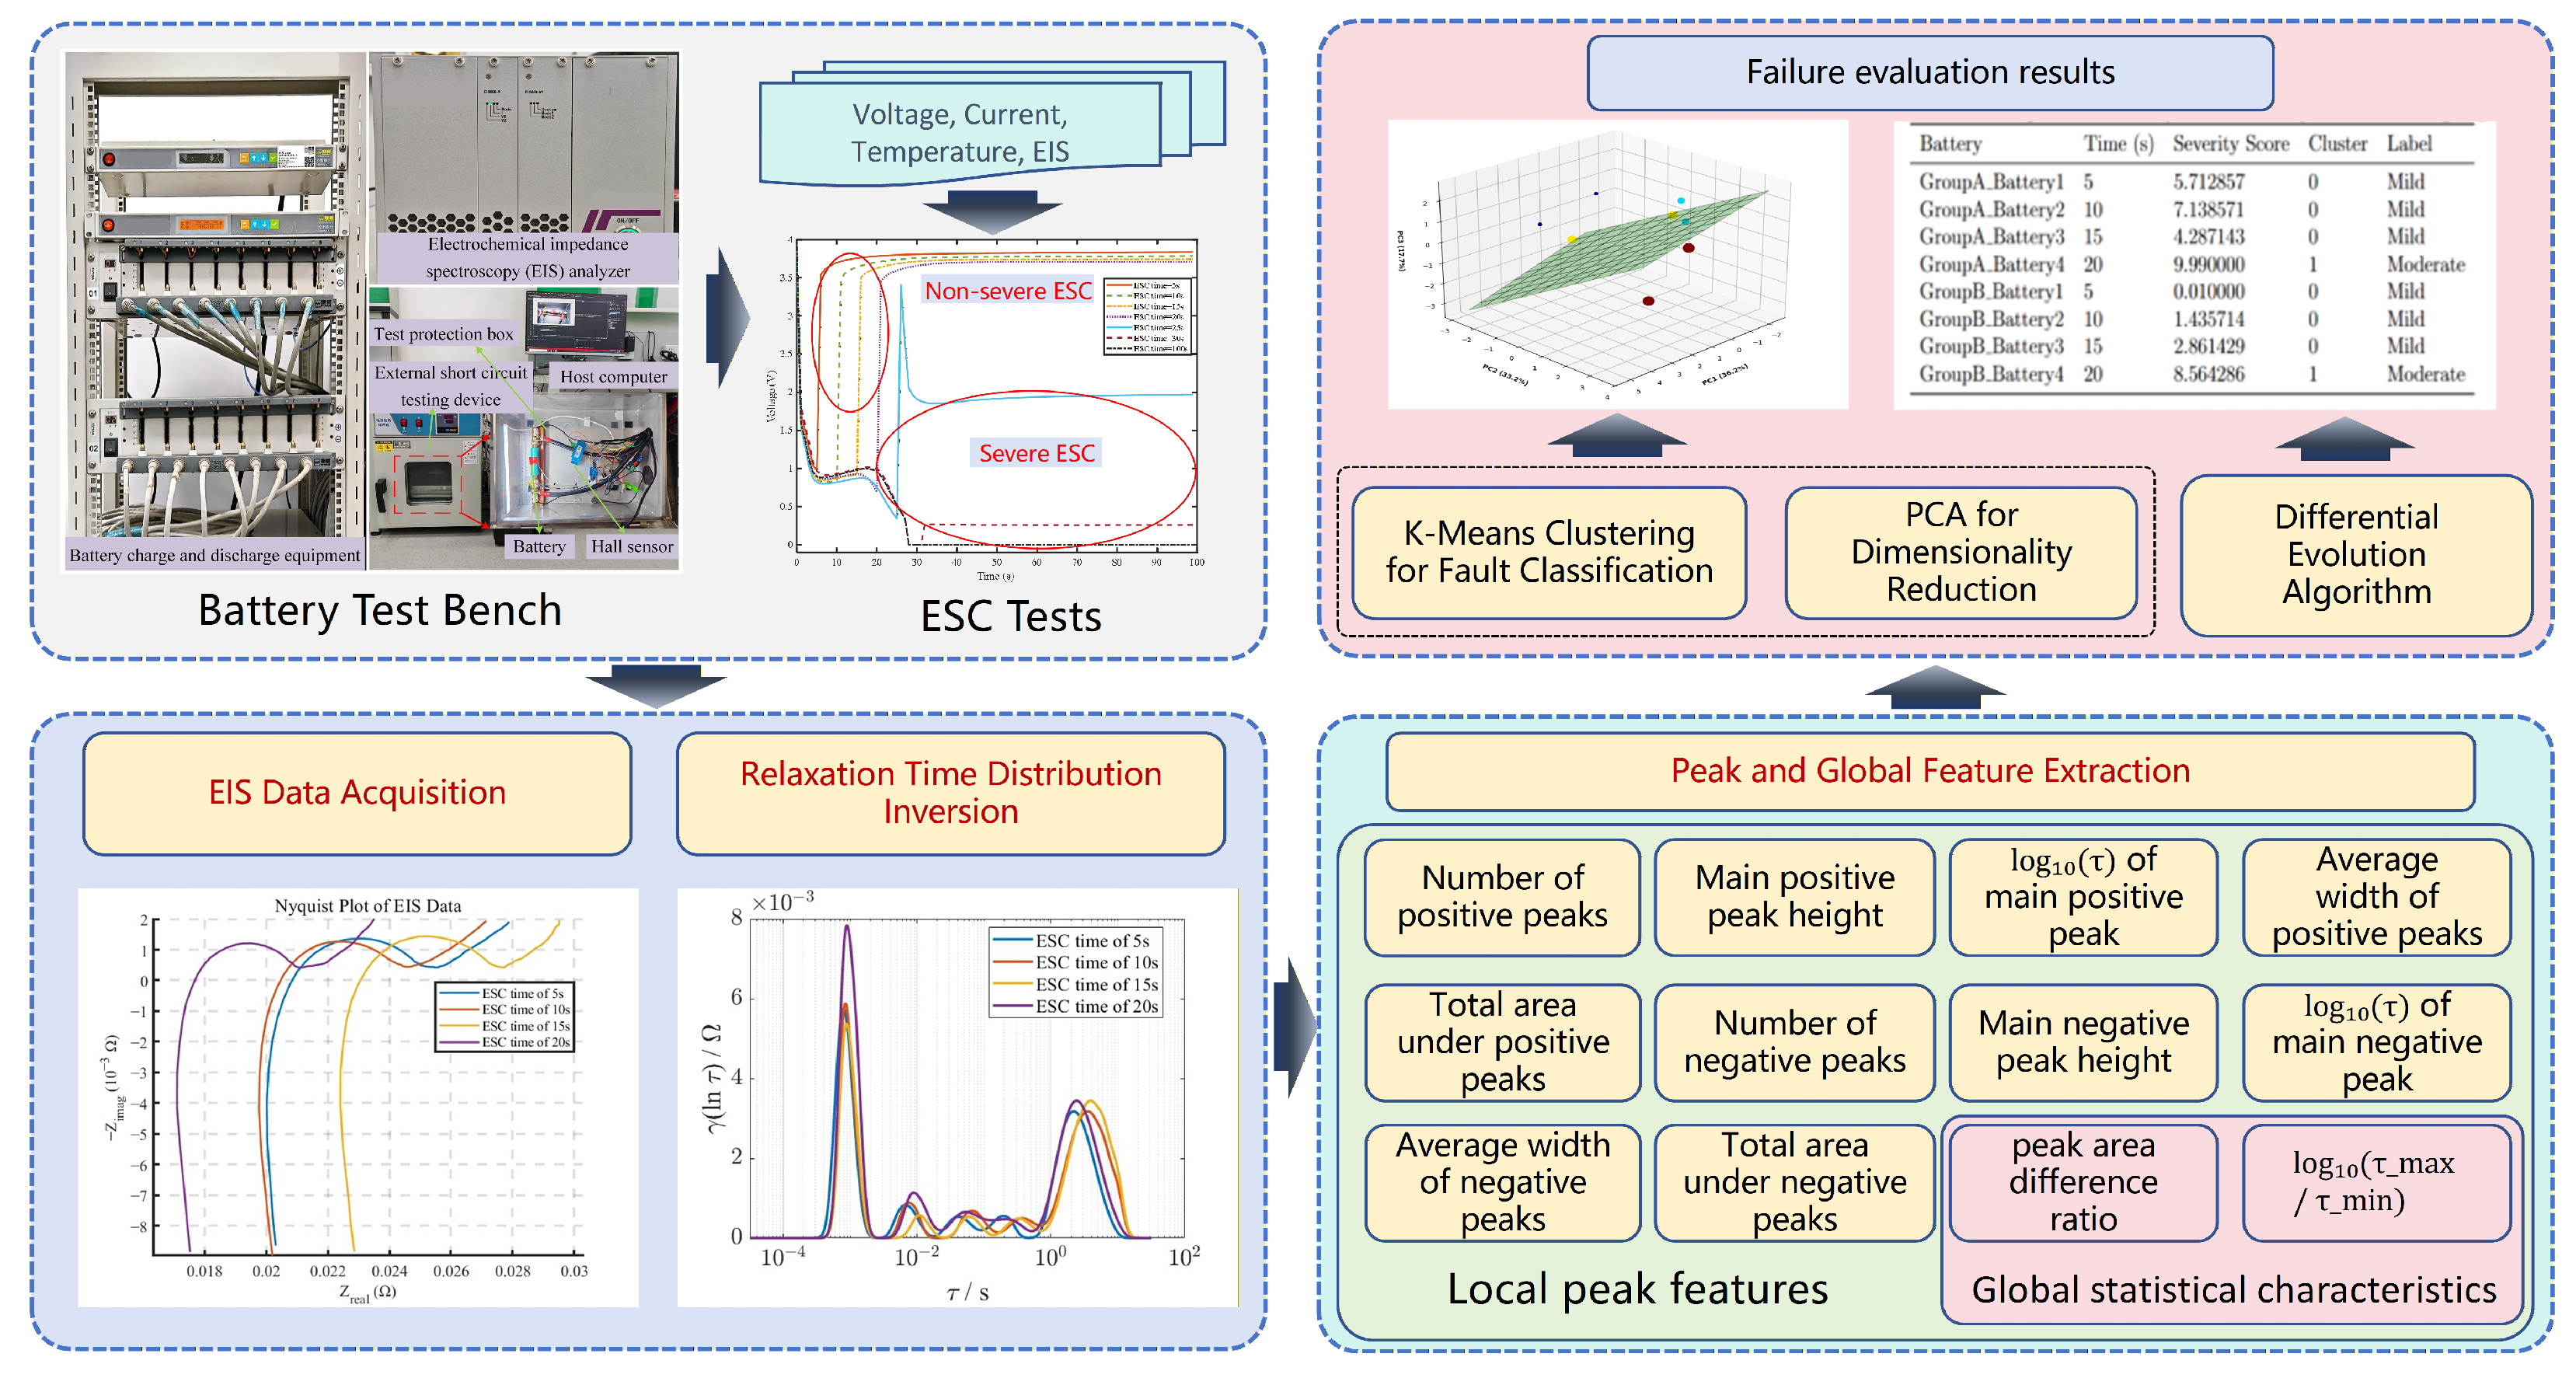
In practical applications, li-ion batteries may face extreme conditions such as overcharge, over-discharge, high or low temperatures, and external short circuits. These abnormal scenarios significantly increase safety risks, particularly due to the high energy density of li-ion cells. Therefore, evaluating battery safety under such extreme conditions is essential for ensuring reliable performance. This study focuses on assessing the degree of external short-circuit faults in li-ion batteries. Accordingly, a complete test platform capable of accurately acquiring real-time data and ensuring safety was constructed. The overall structure is illustrated in Figure 1.
The test platform includes an EIS analyzer (EIS01B2NY, Fire Cloud, Shanghai, China), battery charge and discharge equipment (CT-4008T-5V12A-S1, Neware, Shenzhen, China), a thermal chamber (101-00A, Mingtu, Changge, China), a custom-made external short-circuit device, and a host computer running software developed in Visual Studio 2019 (Microsoft, Redmond, WA, USA).
Specifically, the external short-circuit device is composed of a high-current DC contactor and a low-resistance copper wire. To ensure the consistency of the experiments, the contactor is electronically controlled to eliminate manual operation errors, and all electrical connections utilize bolted terminals to minimize and stabilize the contact resistance, thereby ensuring reproducible short-circuit currents and thermal responses across different test groups.

2.2. Experimental Setup

To investigate the fault evolution under the most severe conditions, the experiment simulated a “hard short” scenario using a fixed low-resistance connection. Under this condition, the severity of the fault was predominantly determined by the accumulation of heat and chemical damage over time. Therefore, to obtain batteries with different degrees of fault severity, the experiment set various short-circuit durations. Based on the characteristics of data variation during external short-circuit testing [28], the durations were set to 5 s, 10 s, 15 s, 20 s, 25 s, 30 s, and 100 s. Prior to testing, all batteries were brought to the initial 80% SOC using a standard Constant Current Constant Voltage (CCCV) charging protocol, followed by a rest period to ensure stabilization. The ambient temperature was maintained at 25 °C, and SOC was 80%. To verify the generalization capability and robustness of the proposed method against manufacturing variations, four independent experimental groups (Groups A, B, C, and D) were established. Specifically, Groups A and B were sourced from one manufacturing batch, whereas Groups C and D were obtained from a separate, distinct batch. This cross-batch design introduced real-world batch-to-batch inconsistencies, allowing us to rigorously test whether the model trained on Group A could adapt to unseen cells from a different production lot (Groups C and D).
The li-ion battery type used was 18650. The specifications are listed in Table 2.

2.3. Battery Dataset

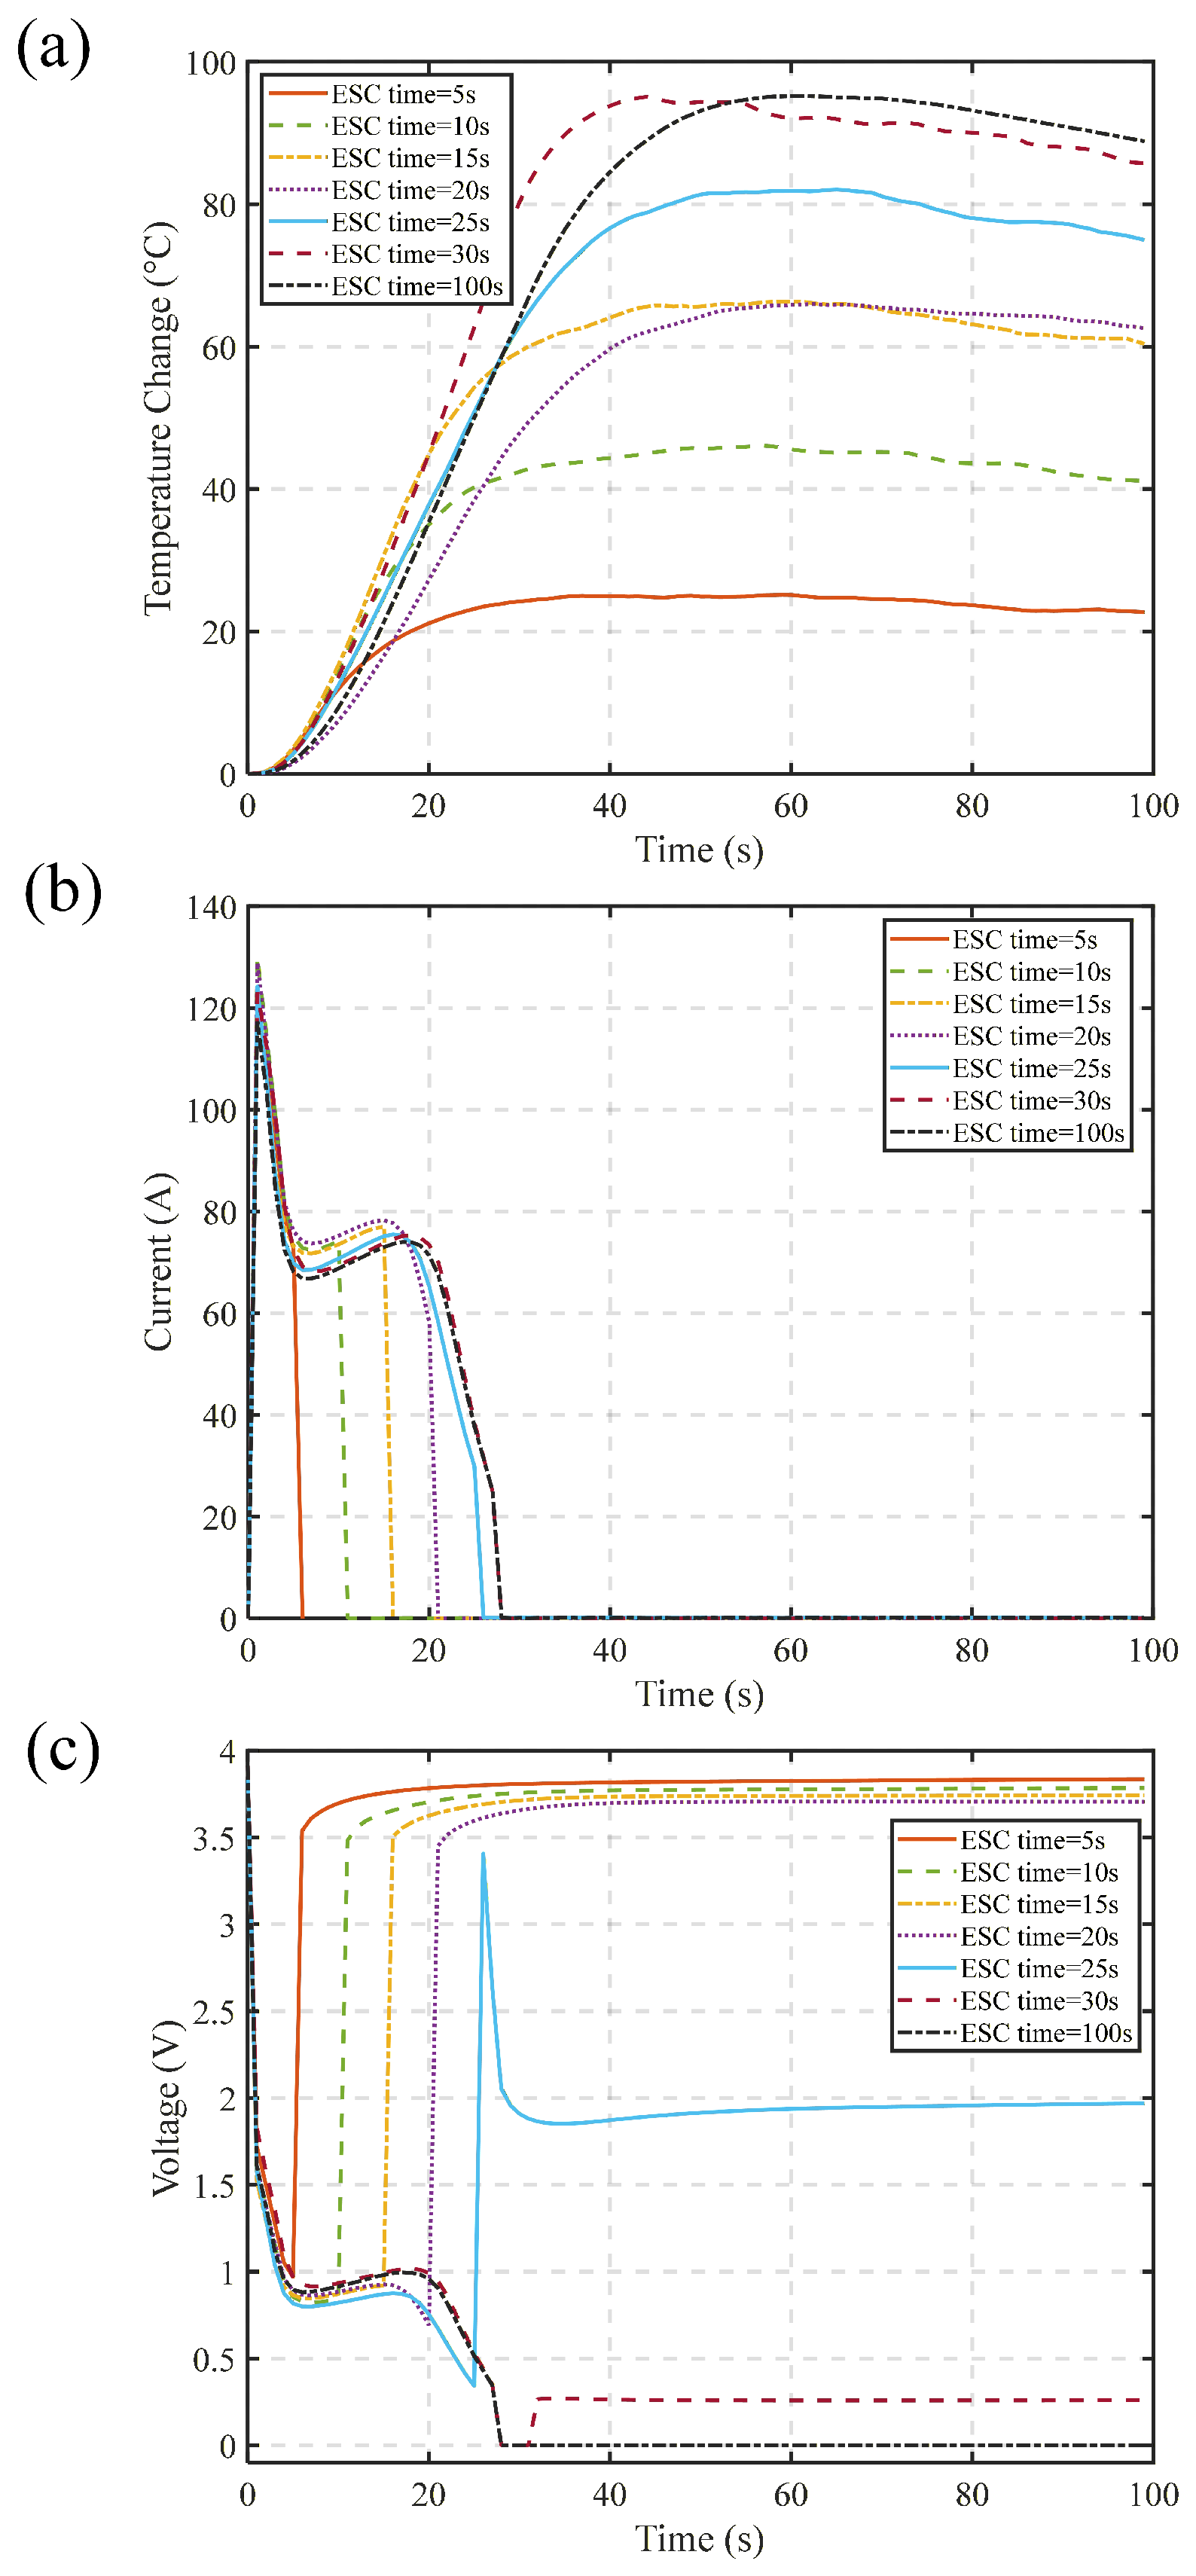
Figure 2a shows the temperature variation curves for different short-circuit durations. When a li-ion battery underwent an external short circuit, the temperature-time curve exhibited a typical rapid rise followed by a stabilization plateau. As the duration increased, the temperature rise became more significant. Thus, the duration of the short circuit directly determined the internal heat generation and safety risk. Long short-circuits can result in catastrophic thermal runaway.
Figure 2b shows the current variation curves for different short-circuit durations. Under all tested durations (5 s to 100 s), an initial current peak of approximately 120–130 A was observed, followed by a gradual decline to near-zero after about 30 s. Therefore, the longer the short-circuit duration, the greater the energy impact endured by the battery per unit time, increasing the risk of internal damage or triggering thermal runaway.
Figure 2c shows the voltage variation curves. During the initial 0–5 s, a sharp voltage drop occurred, reflecting significant Ohmic polarization under short-circuit conditions. For shorter durations (5 s, 10 s, 15 s, 20 s), voltage quickly dropped then recovered close to the original level, indicating reversible polarization. For medium durations (25 s), voltage dropped more and recovered slowly, suggesting electrolyte decomposition and onset of irreversible damage. For long durations (30 s, 100 s), voltage remained low with no recovery, implying severe loss of active material, internal micro-short circuits, or SEI layer collapse. After allowing the batteries to rest for one hour, their terminal voltages were measured. The results showed that for batteries subjected to short-circuit durations of 25 s or longer, the terminal voltages had dropped to below 10% of their initial values.
Accordingly, external short circuits in li-ion batteries can be broadly categorized into two types: severe external short-circuit faults, where the short-circuit duration exceeds twenty-five seconds, and non-severe external short-circuit faults. Among the non-severe cases, defined as those with durations of twenty seconds or less, further classification of fault severity remains necessary.

3. ESC Fault Evaluation Method Based on Distribution of Relaxation Times

EIS, as a highly sensitive electrochemical characterization technique, can be used to analyze the internal electrochemical processes and state evolution of batteries. The relaxation time, a kinetic parameter derived from EIS data, reflects the response speed of internal processes and their changing trends. In this chapter, relaxation times will be calculated based on EIS data obtained before and after external short-circuit conditions. The overall diagnostic process is shown in Figure 3.

3.1. Definition and Calculation Method of Relaxation Time

Relaxation time is a physical quantity that describes the time required for an electrochemical system to return to a stable state after being subjected to a disturbance. In EIS testing, the overall impedance response of the system can be viewed as a superposition of multiple subprocesses, each with different relaxation characteristics. Therefore, the relaxation time distribution function γ ( τ ) can be introduced to characterize the contribution of each subprocess to the overall response [29]. Based on the distributed impedance model, the total impedance of the system Z D R T ( f ) can be expressed in the following integral form:
Z D R T ( f ) = R 1 + 0 γ ( τ ) 1 + i 2 π f τ d τ
Here, R 1 represents the ohmic resistance of the system, γ ( τ ) is the relaxation time distribution function, f is the excitation frequency, and τ denotes the relaxation time. Considering that EIS data are often acquired on a logarithmic frequency scale, the above expression is commonly transformed into its logarithmic form to improve computational stability:
Z D R T ( f ) = R 1 + γ ( ln τ ) 1 + i 2 π f τ d ln τ
γ ( ln τ ) = τ · γ ( τ )
This logarithmic transformation is derived from the mathematical change of integration variable, where d ( ln τ ) = 1 τ d τ , ensuring that γ ( ln τ ) correctly represents the distribution density on a logarithmic time scale. This form is more suitable for subsequent numerical inversion. Since directly retrieving γ ( ln τ ) from experimental impedance data constitutes an ill-posed inverse problem, regularization methods are required. In this study, a discrete representation of γ ( ln τ ) was constructed using radial basis functions (RBFs), expressed as follows:
γ ( ln τ ) m = 1 M x m · f m ( | ln τ ln τ m | )
Here, f m denotes the RBF centered at ln τ m , x m represents the weight coefficients to be determined, and M is the number of selected discrete points. Based on the above expansion, the impedance expression can be discretized as
Z D R T ( f ) = R 1 + m = 1 M x m 1 + i 2 π f τ m
To solve for the parameter vector
x = [ x 1 , x 2 , , x M ] T
from experimental data, this study employed a weighted least squares fitting approach and introduced a regularization term to suppress overfitting. The objective function was given by
S ( x ) = Z D R T real Z e x p real 2 + Z D R T imag Z e x p imag 2 + λ L x 2
Here, Z e x p real and Z e x p imag represent the real and imaginary parts of the experimental impedance, respectively; L is the derivative matrix (representing the first derivative of γ ( ln τ ) ); and λ is the regularization parameter used to balance fitting accuracy and function smoothness.
Compared to traditional equivalent circuit methods, this approach offers greater flexibility and physical interpretability. In particular, it enables more accurate identification of time-scale variations associated with different processes when analyzing complex electrochemical behaviors following external short-circuit faults in li-ion batteries.

3.2. Feature Extraction of Relaxation Time and Fault Classification Method

To effectively extract the characteristic changes in electrochemical behavior of li-ion batteries before and after external short circuits from EIS data, this study proposes a feature extraction algorithm based on the relaxation time distribution function γ ( τ ) . The algorithm is designed around peak-difference analysis, and, combined with PCA and K-Means clustering, it enables unsupervised classification of short-circuit fault severity in batteries.

3.2.1. Construction of Difference Distribution

First, the distributions γ ( τ ) of each battery cell before and after the short circuit are extracted separately and interpolated onto a common logarithmic time scale sequence τ . Let the distribution functions before and after the short circuit be denoted as γ post ( τ ) and γ pre ( τ ) , respectively. Then, the difference distribution is defined as
Δ γ ( τ ) = γ post ( τ ) γ pre ( τ )
This distribution reflects the dynamic response changes of the battery after experiencing an external short circuit and serves as the basis for evaluating the degradation of its electrochemical state. Specifically, positive peaks ( Δ γ ( τ ) > 0 ) in the differential spectrum signify electrochemical processes that have been enhanced or newly induced by the fault, such as the increased diffusion resistance caused by electrode structural degradation. Conversely, negative peaks ( Δ γ ( τ ) < 0 ) correspond to processes that have been weakened or diminished, such as the decay of double-layer capacitance associated with the loss of active material interfaces [30,31].

3.2.2. Peak Feature Extraction Method

After smoothing the difference distribution Δ γ ( τ ) , an improved extremum-search algorithm was applied to extract key features of both positive and negative peaks. These features included the number of peaks, the height of the main peak, the position of the main peak (expressed in log 10 τ ), the average peak width, and the peak area (approximated using trapezoidal integration). In addition, global feature indicators were introduced to enhance the perception of overall response strength changes, including the ratio of the difference between positive and negative peak areas to the total absolute area of Δ γ ( τ ) and the relaxation time span in log 10 ( τ max / τ min ) . As a result, each battery sample was quantitatively represented by a feature vector consisting of 12 peak-related and global features, providing a structured input for subsequent machine learning processing.

3.2.3. Dimensionality Reduction and Clustering Analysis

To reduce the dimensionality of features and reveal the distribution structure among samples, PCA was applied to the standardized feature matrix. The first three principal components were extracted for visualization and clustering. These components collectively accounted for over 86.1% of the total variance, indicating strong representational capability. Given the standardized feature matrix X R n × p , where n denotes the number of samples and p the number of features, PCA performed dimensionality reduction by conducting eigenvalue decomposition on the covariance matrix of X.
C = 1 n 1 X T X
C v i = λ i v i
Here, λ i and v i represent the i-th eigenvalue and its corresponding eigenvector, respectively. The principal component directions are defined by the eigenvectors associated with the top k largest eigenvalues. The projection of the samples in the principal component space is given by
Z = X · V k
Here, Z R n × k is the dimensionality-reduced data and V k R p × k is the matrix composed of the top k principal component vectors.
Let the reduced data be { z 1 , z 2 , , z n } R k and the cluster centroids be { μ 1 , μ 2 , , μ K } ; the objective of K-Means is to minimize the within-cluster sum of squared errors:
min { μ j } j = 1 K z i C j z i μ j 2
The algorithm was updated through the following two iterative steps:
Assignment step: assign each sample to its nearest centroid.
c i = arg min j z i μ j 2
Update step: recompute the centroid of each cluster.
μ j = 1 | C j | z i C j z i
Iterate until the cluster centroids converge or the maximum number of iterations is reached.

4. Experimental Results Analysis

4.1. Relaxation Time Calculation Results

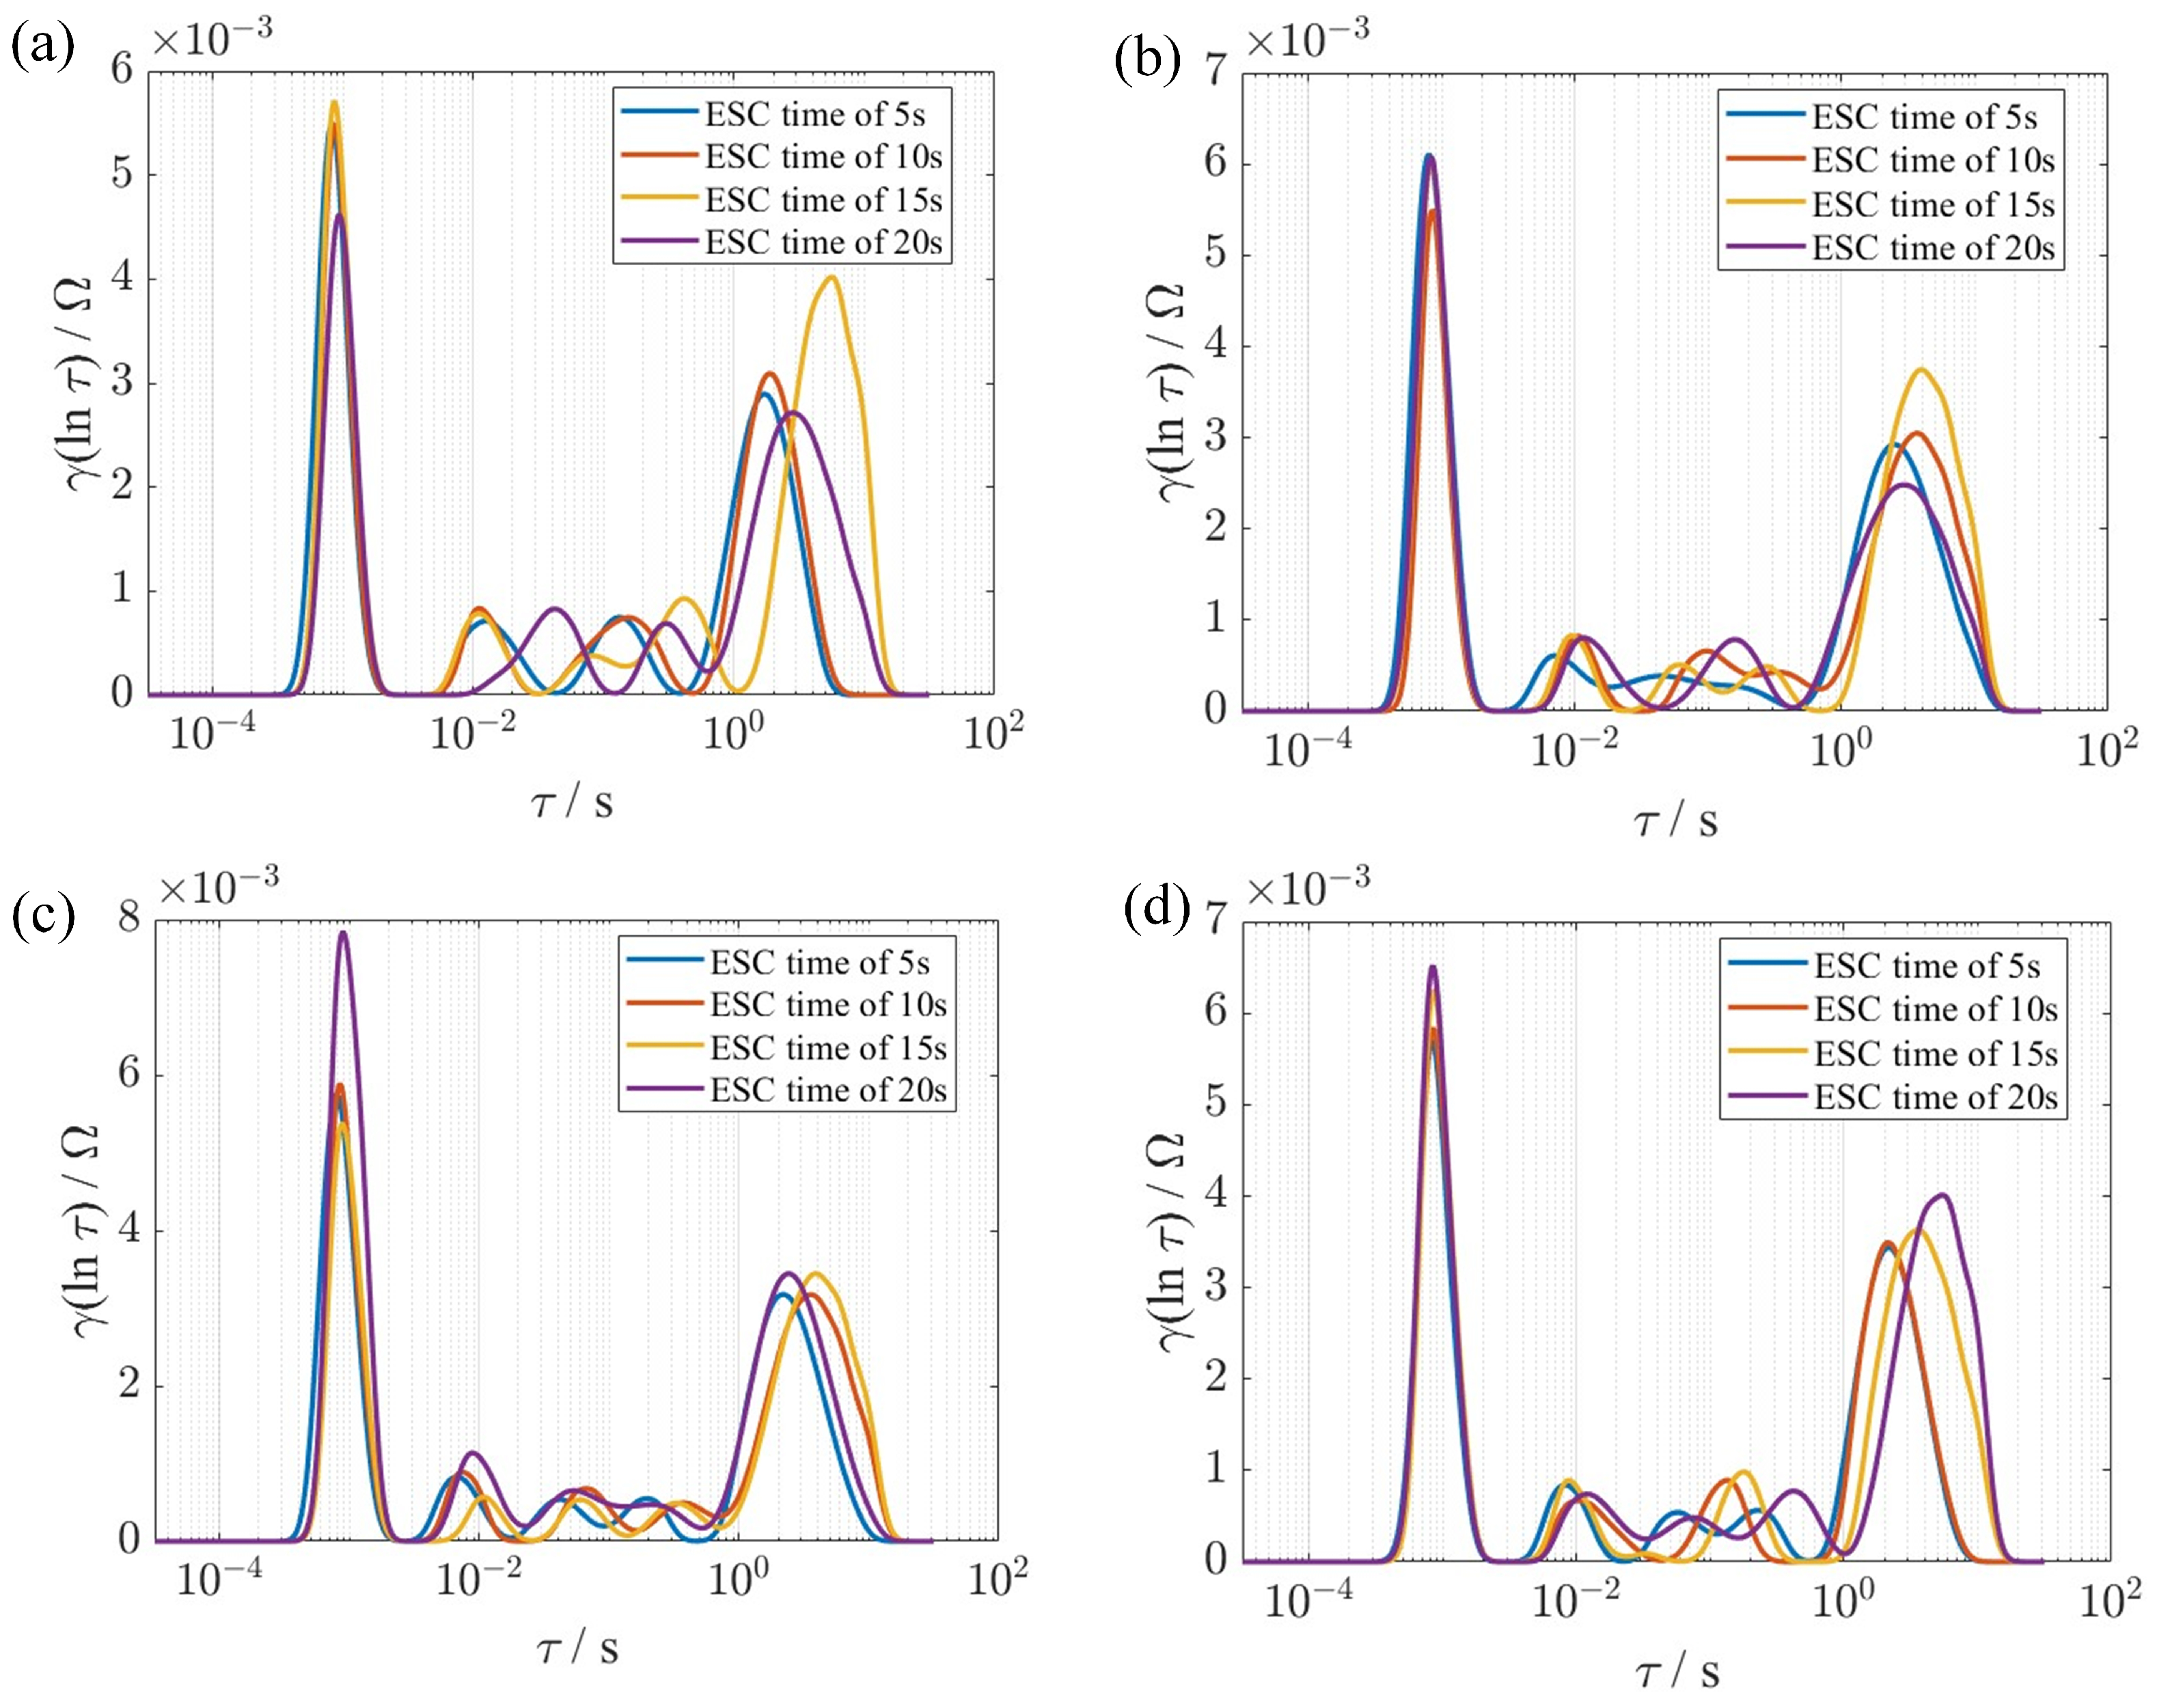
Figure 4a,b show the relaxation time distributions of Groups A and B before the ESC, respectively. The main peaks of both groups are located around τ 10 3 s and exhibit similar shapes, indicating that the dominant electrochemical processes (such as double-layer capacitance or charge transfer) are consistent. In the region of τ > 1 s, slight differences in curve morphology are observed between the two groups. However, the amplitude of these deviations is small and the overall trends remain consistent. Such minor fluctuations are likely within the allowable range of system measurement errors or inherent sample variability and do not imply substantive mechanistic differences.
Figure 4c,d show the relaxation time distributions of Groups A and B after the ESC. After the short circuit, both groups show a slight increase in the amplitude of the main peak at τ 10 3 s, while the peak position remains unchanged, suggesting that the charge transfer process is not significantly affected by the fault. Significant changes are observed in the region of τ 1 10 s. Except for one 15 s ESC sample in Group A (whose deviation is attributed to system measurement error), enhanced peaks emerge in this region under all ESC durations. These enhanced responses reflect increased diffusion resistance and electrode polarization; this increased diffusion is the direct electrochemical signature of increased mass transport (diffusion) limitations, physically caused by the structural degradation of the electrode composite (such as microcracking and particle pulverization) induced by the thermo-mechanical stress of the external short circuit [30,31]. Such phenomena are commonly observed under external short circuits, elevated temperatures, or overcharging conditions.
Furthermore, the response trends of Groups A and B after the external short circuit are consistent, as evidenced by the intensification of slow processes and the rightward shift of the peak position. This indicates that the relaxation time distribution γ ( ln τ ) effectively captures the evolution of electrochemical behavior before and after the short circuit. As the ESC duration increases, the slow-process response continues to intensify, reflecting a progressive increase in fault severity.
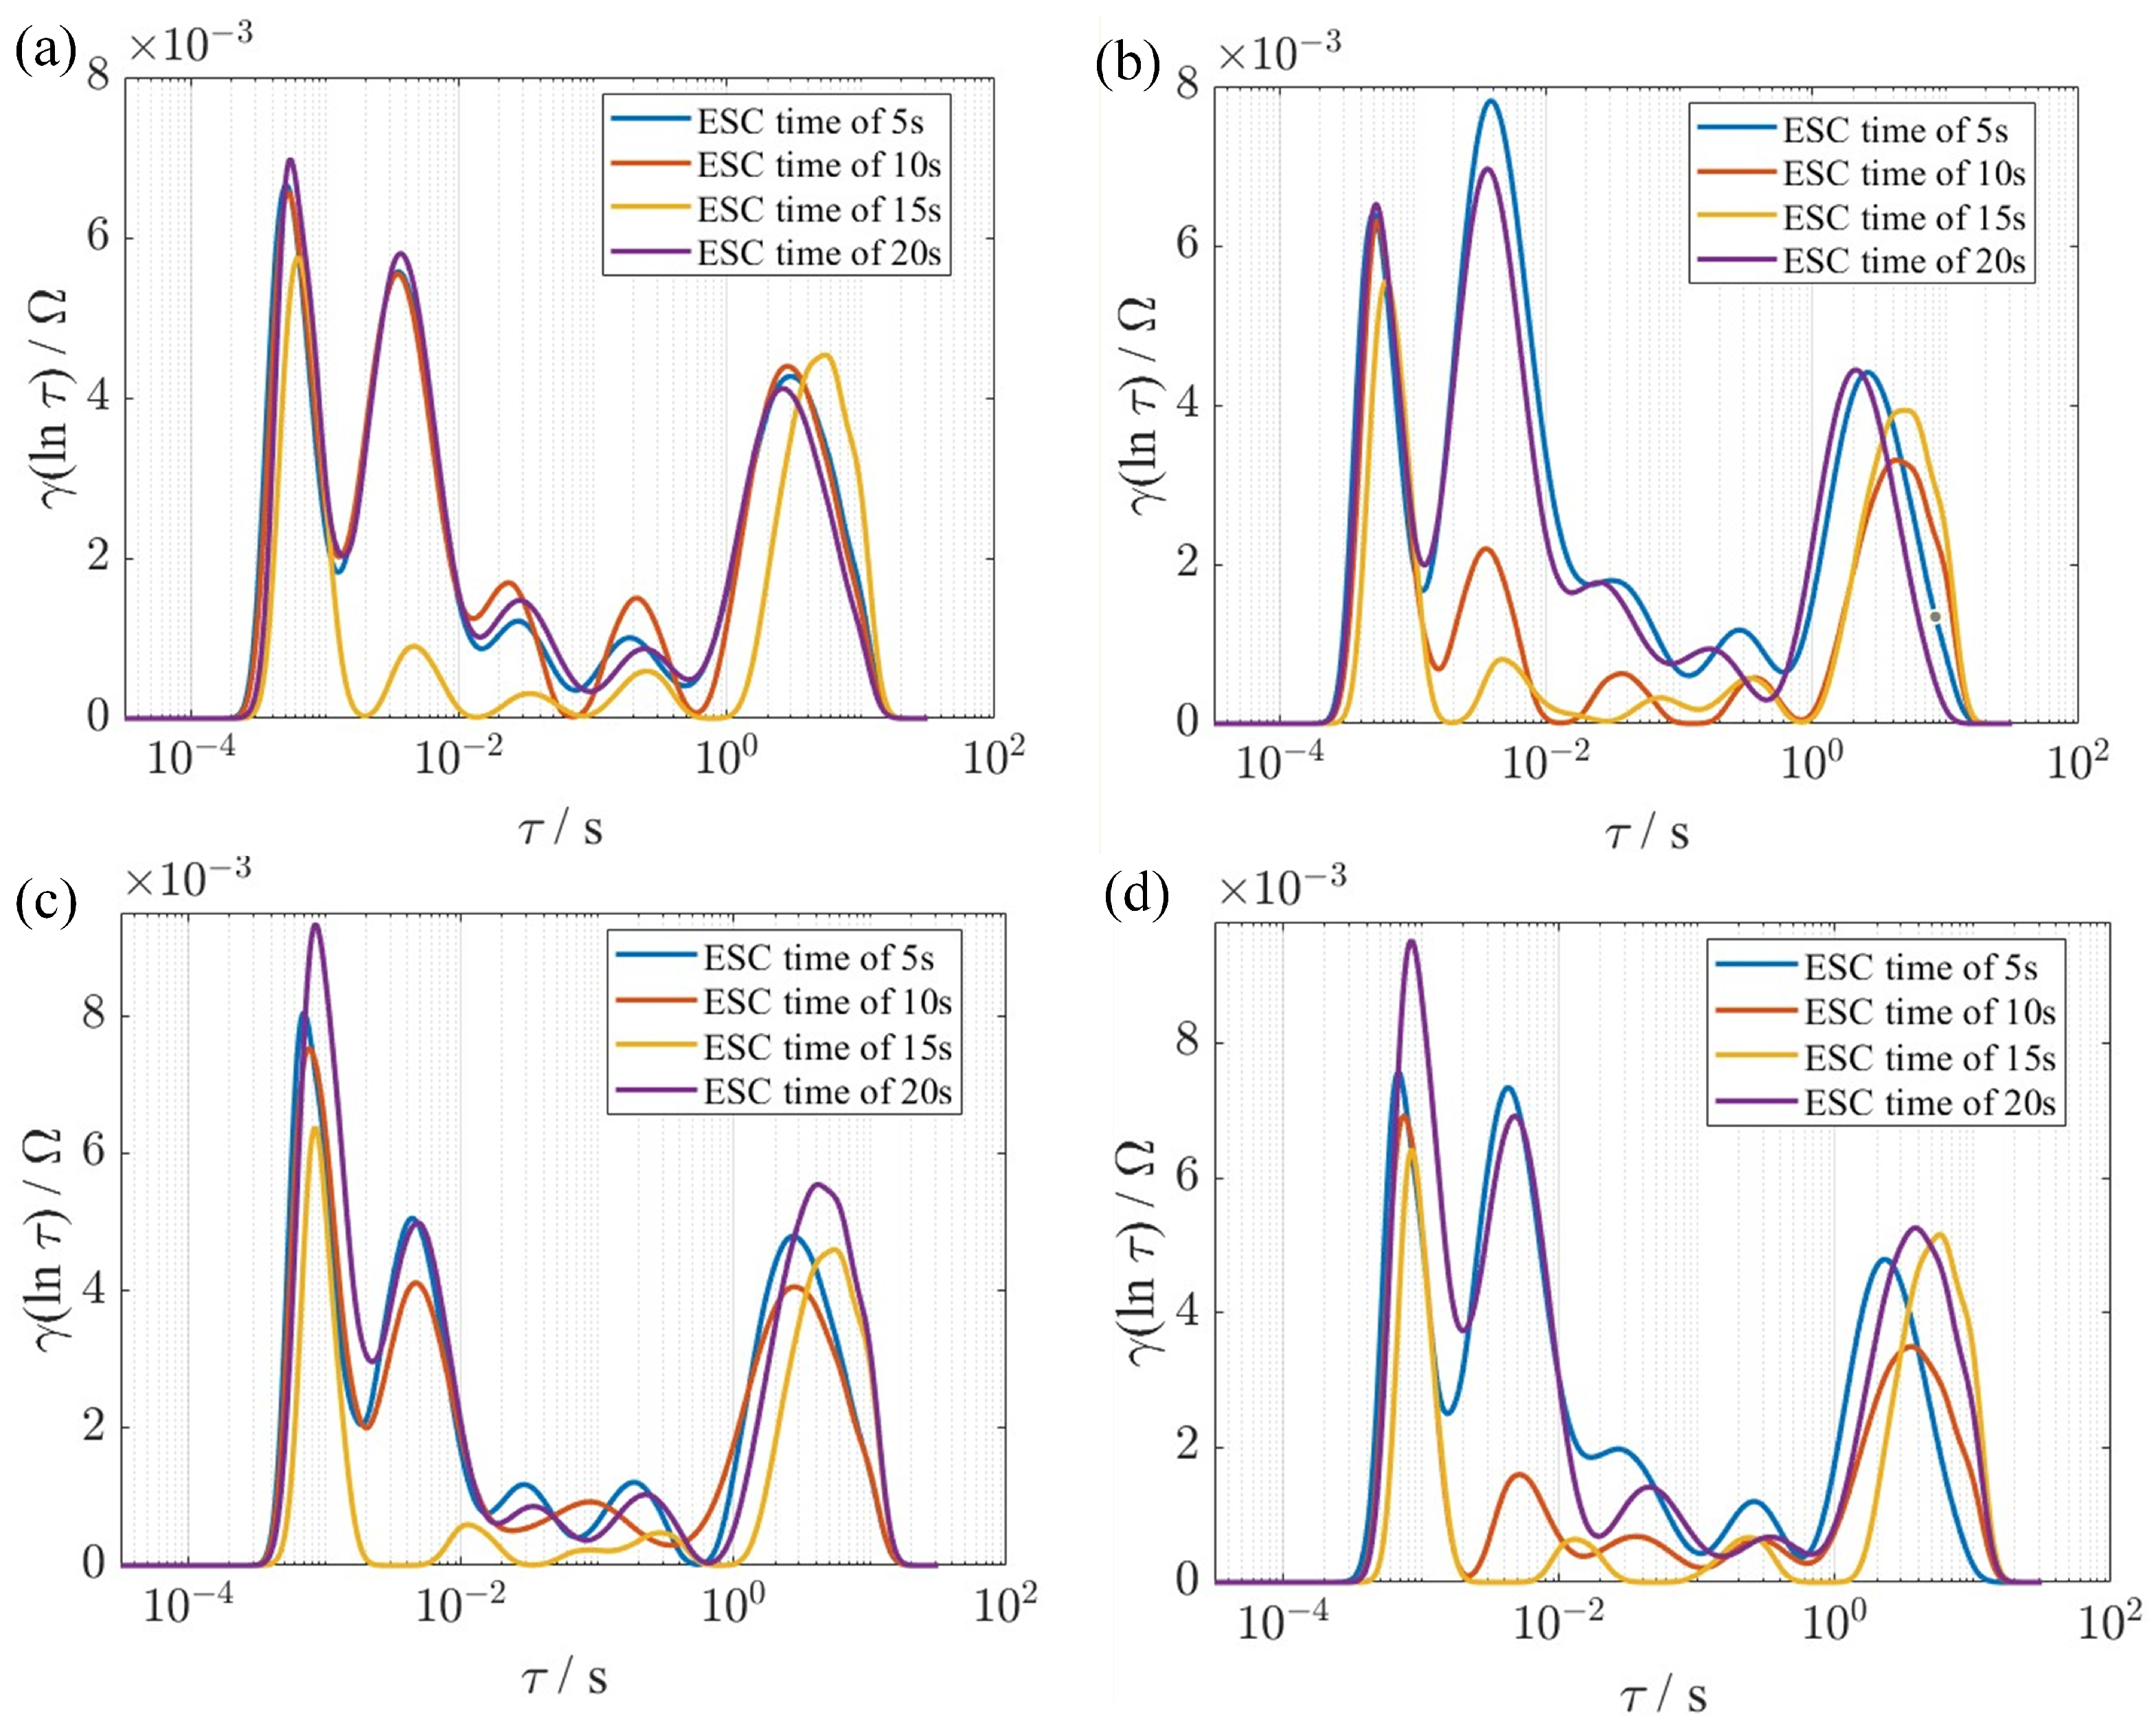
As shown in Figure 5, the experimental Groups C and D exhibit the exact same electrochemical response patterns. Before the ESC, their DRT curves are broadly consistent with Groups A and B. After the ESC, their main peaks are significantly enhanced and shift to the right, and this effect intensifies as the short-circuit duration increases. This consistency across all four groups strongly validates that the DRT differential spectrum is a reliable and reproducible indicator of ESC-induced degradation. Furthermore, the proposed differential DRT methodology effectively accounts for the complex degradation mechanisms inherent in hard-short failures. The high-current surge induces rapid Joule heating and mechanical stress, leading to the electrochemical disconnection of active material particles (e.g., via binder failure or microcracking). In our analysis, this disconnection is captured by the negative peaks in the differential spectrum (representing a loss of double-layer capacitance due to reduced active area). Simultaneously, the cumulative impact of the dynamic temperature rise, which drives irreversible SEI decomposition and electrolyte consumption, is encoded in the enhanced positive peaks (representing increased diffusion and ohmic resistance). Thus, although the measurement is performed post-relaxation, the extracted feature vector integrates the irreversible consequences of both the electrical disconnection and the thermal history of the fault event.

4.2. Clustering Results

To verify the separability of relaxation time differential features for classifying the severity of external short-circuit faults in li-ion batteries, the previously proposed 12-dimensional peak and global difference features were first standardized. Principal component analysis (PCA) was then applied to reduce the high-dimensional feature set to three principal components for visualization and clustering. The cumulative variance explained by the first three components reached 86.1%, with PC1 accounting for 36.2%, PC2 for 33.2%, and PC3 for 17.7%, effectively preserving the critical information.
In this three-dimensional feature space, the K-Means algorithm with k = 2 was employed to perform unsupervised grouping of the battery responses after external short circuits, yielding two representative fault-pattern centroids.

4.3. Comparative Analysis with Other Methods

As shown in Table 3, in addition to the proposed K-Means clustering method, this study also conducted comparative experiments on several commonly used supervised and unsupervised learning algorithms, including DBSCAN, Logistic Regression, and Random Forest. The evaluation metric was clustering accuracy based on short-circuit duration, tested on the full dataset of 16 samples.
Experimental results show that the K-Means method achieved the highest classification accuracy among all tested approaches. In the PCA-reduced feature space, it provided clearer separation between samples with varying fault severity. Although DBSCAN could identify local clusters and noise points, its performance was highly sensitive to parameter settings and showed instability across different datasets. Logistic Regression and Random Forest, as supervised learning methods, demonstrated moderate accuracy when labeled data were available. However, their generalization ability was limited, making them less suitable for unknown fault types or scenarios with insufficient labeling. These results further verify the effectiveness and adaptability of the proposed unsupervised K-Means method for evaluating external short-circuit faults in li-ion batteries.

4.4. Fault Severity Evaluation Based on Optimized Feature Weighting

In addition to unsupervised clustering, an adaptive weighting strategy was introduced to further enhance the correlation between computed severity scores and actual short-circuit durations. For Group A samples (short-circuit durations of 5, 10, 15, and 20 s), a differential evolution algorithm was used to search for a set of non-negative feature weights { w i } summing to unity. The algorithm’s objective is to maximize the fitness function f ( w ) , which is defined as the Spearman rank correlation ( ρ ) between the vector of weighted scores for Group A, S A ( w ) and the vector of known durations, t A . The optimization problem is therefore formulated as finding the optimal weight vector w * :
w * = arg max w f ( w ) = arg max w ρ ( S A ( w ) , t A )
where S A , j ( w ) = i w i x A , j , i denotes the weighted score for the j-th sample in Group A, subject to the constraints w i 0 and i w i = 1 .
The algorithm converged within 200 generations to the optimal weights w * . These optimized weights were then applied to all samples to compute the raw severity score:
S j = i = 1 12 w i * x j , i ,   j = 1 , 2 , , 16 .
Finally, the raw scores S j were linearly mapped by rank into the interval (0.01, 9.99) to ensure no strict zeros or tens. This guaranteed that within Group A, longer short-circuit durations corresponded to higher Severity Scores and that the same weight set could be robustly extended to Groups B, C, and D.

4.5. Fault Severity Evaluation Results

Applying K-Means clustering on the standardized 12-dimensional features from all 16 samples still yielded two clusters that correlated strongly with short-circuit duration. Moreover, clustering the samples by their optimized weighted Severity Scores provided an intuitive division into “mild external short circuit” (≤15 s) and “moderate external short circuit” (20 s) categories. As shown in Table 4, the model (trained only on Group A) demonstrated perfect generalization to the unseen Groups B, C, and D. All samples with durations 15 s were correctly identified as ‘Mild’ and all 20 s samples as ’Moderate’. Consequently, the evolutionary-optimized weighting strategy adds a mechanism-driven refinement to the unsupervised classification framework and proves its robustness.

5. Conclusions

The primary purpose of this study was to address the critical challenge of quantifying fault severity under external short-circuit conditions, where traditional voltage-based monitoring often fails to capture the complex evolution of internal electrochemical damage. To achieve this, we proposed a novel and interpretable framework that leverages the differential analysis of relaxation time distributions ( γ ( τ ) ) derived from electrochemical impedance spectroscopy, integrating differential feature extraction, principal component analysis, and unsupervised K-Means clustering.
The results confirm that the differential DRT spectrum, Δ γ ( τ ) , effectively captures the internal electrochemical changes induced by ESC faults, with enhanced main peaks and rightward shifts indicating increased polarization and diffusion resistance. A structured 12-dimensional feature vector, built from these differential peak descriptors, proved highly effective for fault classification. When visualized using PCA, the 16 samples from all four experimental groups formed two distinct, well-separated clusters, clearly separating mild (≤15 s) and moderate (20 s) ESC conditions.
The most critical finding is the method’s high degree of robustness and generalization. The SeverityScore model, based on adaptively optimized feature weights, was able to perfectly classify the fault severity for all samples across all four independent experimental groups (A, B, C, and D). This demonstrates a significant advantage in adaptability over conventional methods. The strong correlation between the computed scores and actual short-circuit durations, combined with the clear separation of mild and moderate faults, validates this framework as a reliable, physically grounded tool for fault evaluation. Moreover, the specific electrochemical features extracted in this study can serve as valuable experimental benchmarks for improving Equivalent Circuit Models. By revealing the precise evolution of internal time constants and polarization resistance under extreme conditions, these findings provide a physical basis for calibrating model parameters related to high-temperature operation and dynamic electrochemical responses, thereby supporting the development of higher-fidelity simulation tools.
Ultimately, the end goal of this research is to bridge the gap between electrochemical mechanism analysis and practical engineering applications, providing a robust, model-free diagnostic tool that enhances the safety reliability of battery systems through precise risk stratification and early warning capabilities. Future research will focus on optimizing this method for real-time, on-board applications, extending the model to cover a broader severity spectrum. Additionally, the methodological framework presented here, combining differential DRT analysis with unsupervised learning, offers a valuable reference for investigating other failure modes, such as high-impedance soft shorts, where capturing subtle electrochemical variations is critical.

Author Contributions

Z.H. contributed to writing—original draft, validation, software, methodology, investigation, and data curation; J.G. contributed to writing—review and editing and data curation; Y.W. contributed to writing—original draft, supervision, project administration, methodology, funding acquisition, and conceptualization. All authors have read and agreed to the published version of the manuscript.

Funding

This work was supported by the National Natural Science Foundation of China (Grant No. 62373340).

Data Availability Statement

The raw data supporting the conclusions of this article will be made available by the authors, without undue reservation.

Conflicts of Interest

The authors declare no conflicts of interest. The funders had no role in the design of the study; in the collection, analyses, or interpretation of data; in the writing of the manuscript; or in the decision to publish the results.

References

  1. Yu, J.; Yao, F. Multi-Timescale Estimation of SOE and SOH for Lithium-Ion Batteries with a Fractional-Order Model and Multi-Innovation Filter Framework. Batteries 2025, 11, 372. [Google Scholar] [CrossRef]
  2. Wang, Y.; Xiang, H.; Soo, Y.Y.; Fan, X. Aging mechanisms, prognostics and management for lithium-ion batteries: Recent advances. Renew. Sustain. Energy Rev. 2025, 207, 114915. [Google Scholar] [CrossRef]
  3. Lian, Y.; Qiao, D. A Novel Capacity Estimation Method for Lithium-Ion Batteries Based on the Adam Algorithm. Batteries 2025, 11, 85. [Google Scholar] [CrossRef]
  4. Tran, M.K.; Fowler, M. A review of lithium-ion battery fault diagnostic algorithms: Current progress and future challenges. Algorithms 2020, 13, 62. [Google Scholar] [CrossRef]
  5. Zhao, Y.; Li, G.; Gao, Y.; Wang, D.; Huang, Q.; Wang, D. Stable Li metal anode by a hybrid lithium polysulfidophosphate/polymer cross-linking film. ACS Energy Lett. 2019, 4, 1271–1278. [Google Scholar] [CrossRef]
  6. Adasah, S.N.; Wang, Z.; Hu, S.; Capezza, S.; Shao, J.; Chow, M.Y. Review of fault diagnosis based protection mechanisms for battery energy storage systems. In Proceedings of the 2024 IEEE 33rd International Symposium on Industrial Electronics (ISIE), Ulsan, Republic of Korea, 18–21 June 2024; pp. 1–6. [Google Scholar]
  7. Hu, X.; Zhang, K.; Liu, K.; Lin, X.; Dey, S.; Onori, S. Advanced fault diagnosis for lithium-ion battery systems: A review of fault mechanisms, fault features, and diagnosis procedures. IEEE Ind. Electron. Mag. 2020, 14, 65–91. [Google Scholar] [CrossRef]
  8. Rao, K.D.; Lakshmi Pujitha, N.N.; Rao Ranga, M.; Manaswi, C.; Dawn, S.; Ustun, T.S.; Kalam, A. Fault mitigation and diagnosis for lithium-ion batteries: A review. Front. Energy Res. 2025, 13, 1529608. [Google Scholar] [CrossRef]
  9. Madani, S.; Ziebert, C. Beyond limits: A brief exploration of fault detection and balancing in lithium-ion battery technology. J. Phys. Conf. Ser. 2024, 2723, 012012. [Google Scholar] [CrossRef]
  10. Lin, M.; Hu, D.; Meng, J.; Wu, J. Transfer learning-based lithium-ion battery state of health estimation with electrochemical impedance spectroscopy. IEEE Trans. Transp. Electrif. 2025, 11, 7910–7920. [Google Scholar] [CrossRef]
  11. Yang, R.; Xiong, R.; Shen, W.; Lin, X. Extreme learning machine-based thermal model for lithium-ion batteries of electric vehicles under external short circuit. Engineering 2021, 7, 395–405. [Google Scholar] [CrossRef]
  12. Jung, J.B.; Lim, M.G.; Kim, J.Y.; Han, B.G.; Kim, B.; Rho, D.S. Safety assessment for external short circuit of Li-ion battery in ESS application based on operation and environment factors. Energies 2022, 15, 5052. [Google Scholar] [CrossRef]
  13. An, Z.; Shi, T.; Zhao, Y.; Gong, Q.; Zhang, D.; Bai, J.; Du, X. Study on aging and external short circuit mechanisms of Li-ion cells with different electrode thicknesses. Appl. Energy 2023, 350, 121796. [Google Scholar] [CrossRef]
  14. Chen, Z.; Xiong, R.; Tian, J.; Shang, X.; Lu, J. Model-based fault diagnosis approach on external short circuit of lithium-ion battery used in electric vehicles. Appl. Energy 2016, 184, 365–374. [Google Scholar] [CrossRef]
  15. Ma, G.; Xu, S.; Cheng, C. Fault detection of lithium-ion battery packs with a graph-based method. J. Energy Storage 2021, 43, 103209. [Google Scholar] [CrossRef]
  16. Zhang, B.; Chen, Z.; Tao, Q.; Jiao, M.; Li, P.; Zhou, N. Characterization study on external short circuit for lithium-ion battery safety management: From single cell to module. J. Energy Storage 2024, 99, 113239. [Google Scholar] [CrossRef]
  17. Yang, R.; Xiong, R.; Ma, S.; Lin, X. Characterization of external short circuit faults in electric vehicle Li-ion battery packs and prediction using artificial neural networks. Appl. Energy 2020, 260, 114253. [Google Scholar] [CrossRef]
  18. Xiong, R.; Yang, R.; Chen, Z.; Shen, W.; Sun, F. Online fault diagnosis of external short circuit for lithium-ion battery pack. IEEE Trans. Ind. Electron. 2019, 67, 1081–1091. [Google Scholar] [CrossRef]
  19. Zhang, Y.; Nguyen, R.T.; Liaw, B. Status and gap in rechargeable lithium battery supply chain: Importance of quantitative failure analysis. Proc. IEEE 2021, 109, 1029–1038. [Google Scholar] [CrossRef]
  20. Wan, T.H.; Saccoccio, M.; Chen, C.; Ciucci, F. Influence of the discretization methods on the distribution of relaxation times deconvolution: Implementing radial basis functions with DRTtools. Electrochim. Acta 2015, 184, 483–499. [Google Scholar] [CrossRef]
  21. Gao, Z.; Jin, Y.; Zhang, Y.; Zhang, Z.; Li, S.; Liu, J.; Wang, H. Static EIS multi-frequency feature points combined with WOA-BP neural network for Li-ion battery SOH estimation. Measurement 2025, 253, 117780. [Google Scholar] [CrossRef]
  22. Li, Y.; Ye, M.; Wang, Q.; Lian, G.; Kemény, M.; Xia, B.; Zhang, B. Capacity estimation of lithium-ion battery through interpretation of electrochemical impedance spectroscopy combined with machine learning. Measurement 2025, 243, 116374. [Google Scholar] [CrossRef]
  23. Meng, J.; Hu, D.; Lin, M.; Peng, J.; Wu, J.; Stroe, D.I. A domain-adversarial neural network for transferable lithium-ion battery state of health estimation. IEEE Trans. Transp. Electrif. 2025, 11, 7732–7742. [Google Scholar] [CrossRef]
  24. Lai, X.; Deng, C.; Tang, X.; Gao, F.; Han, X.; Zheng, Y. Soft clustering of retired lithium-ion batteries for the secondary utilization using Gaussian mixture model based on electrochemical impedance spectroscopy. J. Clean. Prod. 2022, 339, 130786. [Google Scholar] [CrossRef]
  25. Yang, B.; Wang, D.; Yu, B.; Wang, F.; Chen, S.; Sun, X.; Dong, H. Research on online passive electrochemical impedance spectroscopy and its outlook in battery management. Appl. Energy 2024, 363, 123046. [Google Scholar] [CrossRef]
  26. Xia, B.; Qin, Z.; Fu, H. Rapid estimation of battery state of health using partial electrochemical impedance spectra and interpretable machine learning. J. Power Sources 2024, 603, 234413. [Google Scholar] [CrossRef]
  27. Feng, X.; Ouyang, M.; Liu, X.; Lu, L.; Xia, Y.; He, X. Thermal runaway mechanism of lithium ion battery for electric vehicles: A review. Energy Storage Mater. 2018, 10, 246–267. [Google Scholar] [CrossRef]
  28. Hong, Z.; Wang, Y.; Jin, Z. Diagnosis of battery external short circuits based on an improved second-order RC fault model and recursive least squares identification method. Energy 2025, 319, 134880. [Google Scholar] [CrossRef]
  29. Liu, J.; Ciucci, F. The Gaussian process distribution of relaxation times: A machine learning tool for the analysis and prediction of electrochemical impedance spectroscopy data. Electrochim. Acta 2020, 331, 135316. [Google Scholar] [CrossRef]
  30. La Mantia, F.; Vetter, J.; Novák, P. Impedance spectroscopy on porous materials: A general model and application to graphite electrodes of lithium-ion batteries. Electrochim. Acta 2008, 53, 4109–4121. [Google Scholar] [CrossRef]
  31. Chowdhury, S.; Barrera, A.; Marinova, M.; Fadel, A.; Bellayer, S.; Hosdez, J.; Vandingenen, C.; Soubhie, F.; Belhache, M.; Supiot, P.; et al. Impact of external short circuit on lithium-ion batteries: A post-mortem case study. J. Mater. Chem. A 2025, 13, 18600–18609. [Google Scholar] [CrossRef]
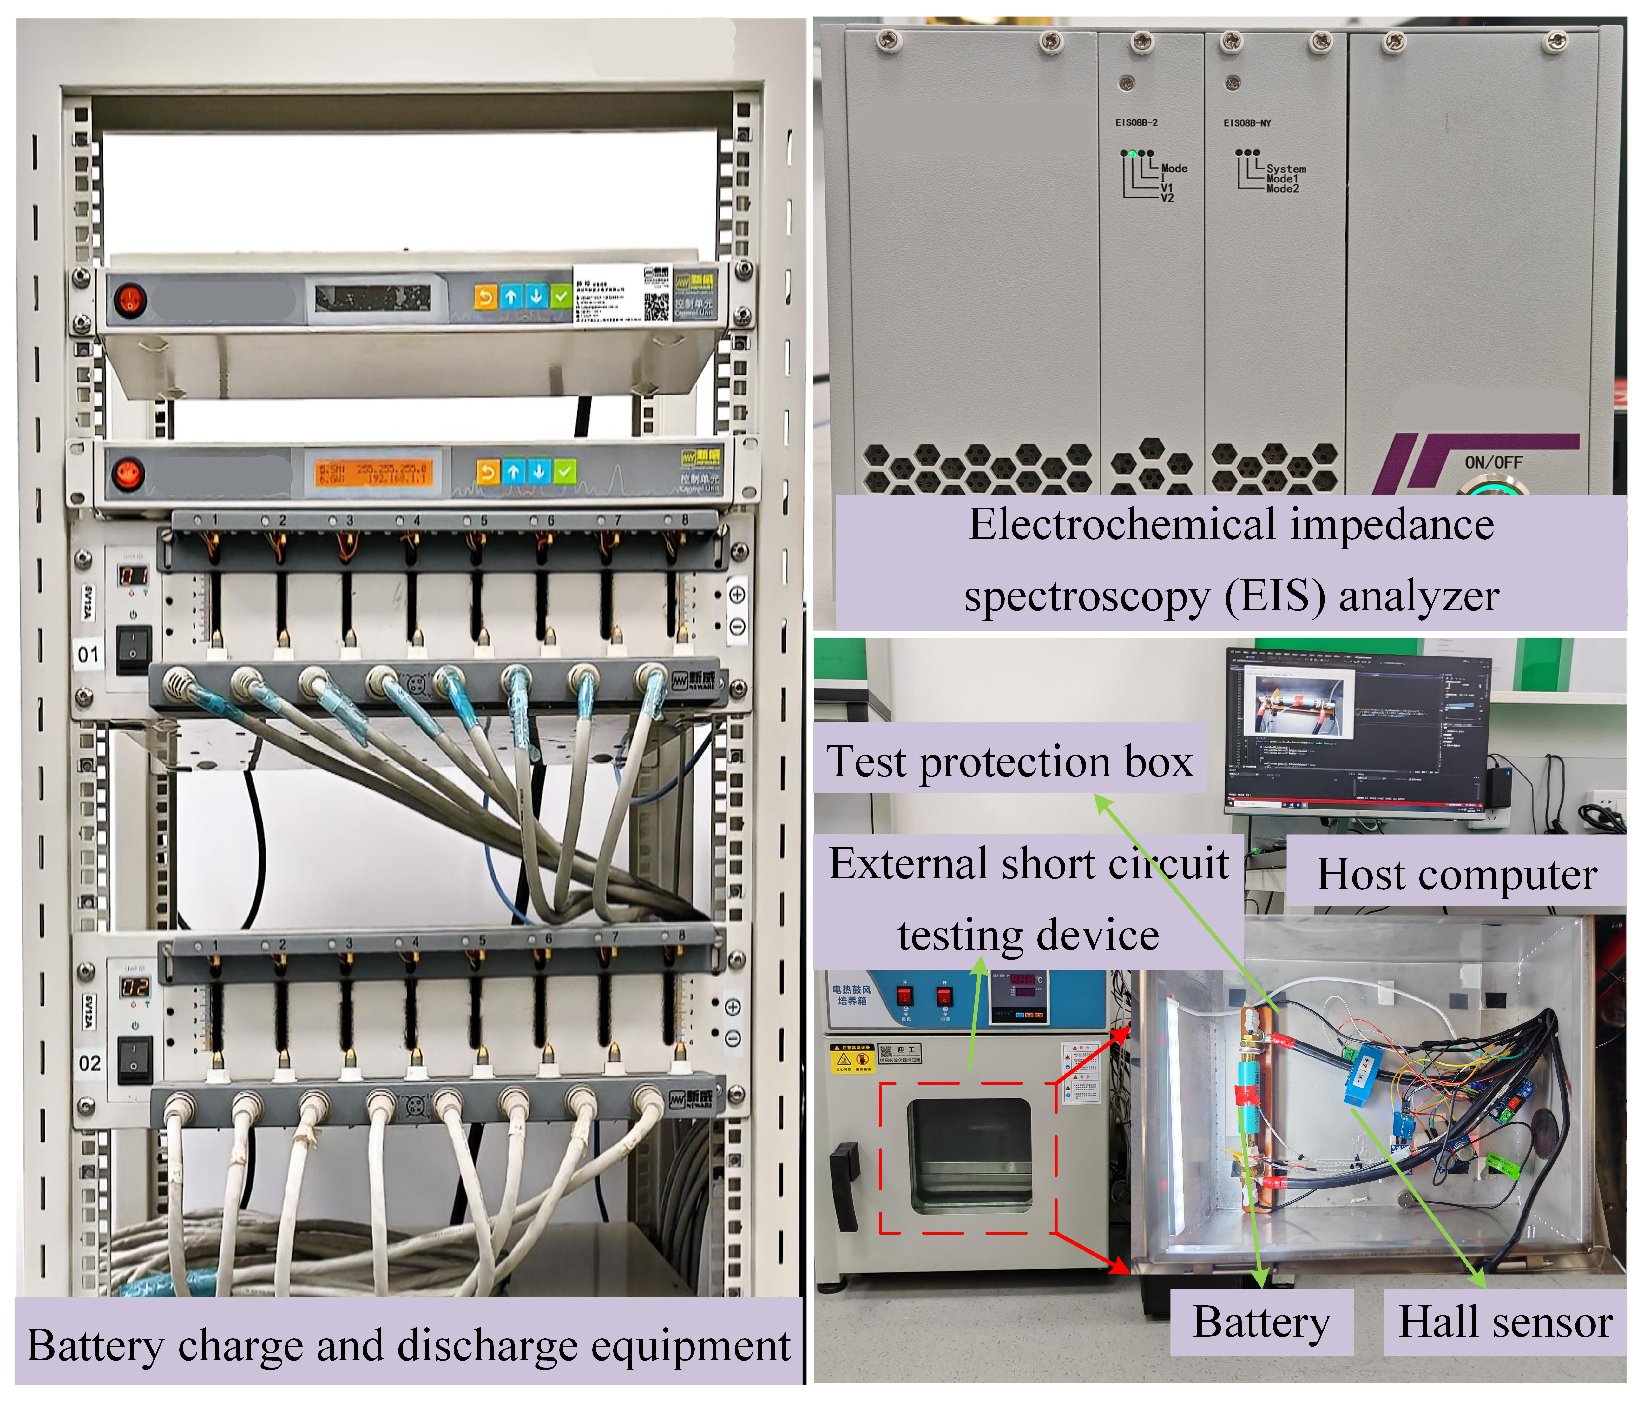
Figure 1. Schematic Diagram of the Experimental Platform.
Batteries 11 00437 g001
Figure 2. Temperature, current, and voltage change curves for different external short circuit durations: (a) Temperature rise curves showing the thermal response; (b) Current profiles illustrating the surge and cut-off; (c) Voltage variations showing the drop and recovery behaviors.
Batteries 11 00437 g002
Figure 3. Fault evaluation process for li-ion battery ESC based on impedance spectrum feature extraction.
Batteries 11 00437 g003
Figure 4. Relaxation time distributions of Groups A and B before and after external short circuit: (a) Group A before, (b) Group B before, (c) Group A after, (d) Group B after.
Batteries 11 00437 g004
Figure 5. Relaxation time distributions of Groups A and B before and after external short circuit: (a) Group A before, (b) Group B before, (c) Group A after, (d) Group B after. time distributions of Groups C and D before and after external short circuit: (a) Group C before, (b) Group D before, (c) Group C after, (d) Group D after.
Batteries 11 00437 g005
Table 1. Comparison of methods for evaluating external short-circuit fault severity in Li-ion batteries.
Method CategoryRequired DataFeature DimensionInterpretabilityAdvantages and Disadvantages
Voltage Decay Rate MethodTerminal voltage time seriesLowLowSimple and fast; suitable for preliminary screening; limited resolution
Current–Time Integration (I–t)Current time seriesLowMediumQuantifies energy impact; ignores structural response details
Equivalent Circuit Parameter Variation (e.g., R ct )Fitted EIS parametersLowMediumStrong model dependency; less effective for non-typical faults
γ ( τ ) Relaxation Time Difference + Clustering (this work)Full-frequency EIS responseHighHighNo model fitting required; adaptable to complex mechanisms; superior classification performance
Table 2. Specifications of the test cell.
Specification ParametersValue
ManufacturerYiwei Lithium (Huizhou, China)
ModelINR18650-20P
Nominal Capacity2000 mAh
Cathode MaterialLi(NiCoMn)O2 (NMC)
Dimension 18.3 × 65 mm
Mass47 g
Discharge cut-off voltage2.5 V
Charge cut-off voltage4.2 V
Internal resistance24 mΩ
Table 3. Accuracy Comparison of Different Algorithms for ESC Fault Classification.
AlgorithmK-MeansDBSCANLogistic RegressionRandom Forest
Accuracy1.000.500.750.75
Table 4. Clustering results and severity scores based on optimized feature weighting for all four groups.
BatteryTime (s)Severity ScoreClusterLabel
GroupA_Battery155.7130Mild
GroupA_Battery2107.1390Mild
GroupA_Battery3154.2870Mild
GroupA_Battery4209.9901Moderate
GroupB_Battery150.0100Mild
GroupB_Battery2101.4360Mild
GroupB_Battery3152.8610Mild
GroupB_Battery4208.5641Moderate
GroupC_Battery150.5700Mild
GroupC_Battery2103.9790Mild
GroupC_Battery3154.3150Mild
GroupC_Battery42010.0001Moderate
GroupD_Battery150.0000Mild
GroupD_Battery2102.7710Mild
GroupD_Battery3157.6340Mild
GroupD_Battery4209.9621Moderate
Disclaimer/Publisher’s Note: The statements, opinions and data contained in all publications are solely those of the individual author(s) and contributor(s) and not of MDPI and/or the editor(s). MDPI and/or the editor(s) disclaim responsibility for any injury to people or property resulting from any ideas, methods, instructions or products referred to in the content.