Article

Improving Lithium-Ion Battery Performance: Nano Al2O3 Coatings on High-Mass Loading LiFePO4 Cathodes via Atomic Layer Deposition

Center for Sustainable Energy, Fondazione Bruno Kessler, Via Sommarive 18, 38123 Trento, Italy
*
Authors to whom correspondence should be addressed.
Current address: Institute for Materials Research (imo-imomec), Hasselt University, Martelarenlaan 42, BE3500 Hasselt, Belgium.
Batteries 2024, 10(9), 304; https://doi.org/10.3390/batteries10090304
Submission received: 31 July 2024 / Revised: 22 August 2024 / Accepted: 26 August 2024 / Published: 28 August 2024

Abstract

:
Lithium iron phosphate (LiFePO4 or LFP) is a promising cathode material for lithium-ion batteries (LIBs), but side reactions between the electrolyte and the LFP electrode can degrade battery performance. This study introduces an innovative coating strategy, using atomic layer deposition (ALD) to apply a thin (5 nm and 10 nm) Al2O3 layer onto high-mass loading LFP electrodes. Galvanostatic charge–discharge cycling and electrochemical impedance spectroscopy (EIS) were used to assess the electrochemical performance of coated and uncoated LFP electrodes. The results show that Al2O3 coatings enhance the cycling performance at room temperature (RT) and 40 °C by suppressing side reactions and stabilizing the cathode–electrolyte interface (CEI). The coated LFP retained 67% of its capacity after 100 cycles at 1C and RT, compared to 57% for the uncoated sample. Post-mortem analyses, including scanning electron microscopy (SEM) and X-ray photoelectron spectroscopy (XPS), were conducted to investigate the mechanisms behind the improved performance. These analyses reveal that Al2O3 coatings are highly effective in reducing LFP electrode degradation during cycling, demonstrating the potential of ALD Al2O3 coatings to enhance the durability and performance of LFP electrodes in LIBs.

Graphical Abstract

1. Introduction

Lithium-ion batteries (LIBs) play a crucial role in achieving energy accessibility by enabling the smarter utilization of environmentally friendly resources, ultimately leading to a reduction in carbon dioxide emissions [1]. Nowadays, we see these batteries everywhere, in our watches, mobile phones, notebooks, and electric vehicles (EVs). According to a recent report, the market for LIB was estimated at USD 41.1 billion in 2021 [2], and it is poised for significant expansion, with forecasts suggesting it will exceed USD 120.65 billion by 2028 [3].
LIBs primarily comprise four major elements: a cathode, an anode, an electrolyte, and a separator. Cathode-active materials (CAMs) are usually made up of metal oxides. The most prevalent cathode materials found in LIBs encompass lithium cobalt oxide (LiCoO2 or LCO), lithium manganese oxide (LiMn2O4 or LMO), lithium nickel manganese cobalt oxide (LiNiMnCoO2 or NMC), and lithium iron phosphate (LiFePO4 or LFP) [4]. Each of these materials provides different combinations of energy density, thermal stability, and cost efficiency. Among these CAMs, olivine-type LFP is particularly notable as a highly promising cathode material because of its low cost, eco-friendliness, and reduced dependence on nickel and cobalt [5], making it a secure choice for sustainable batteries [6,7]. With millions of electric vehicles and enormous energy storage facilities equipped with billions of LFP batteries, it is essential to comprehend the factors contributing to their deterioration and to discover ways to enhance their performance. The structural stability and the interface of the electrode/electrolyte are the primary parameters that affect the performance of LFP batteries [8]. For instance, LFP-based LIBs exhibit significantly increased impedance polarization, whether operated at a high or low state of charge (SOC) [9]. This is primarily due to noticeable side reactions between the electrolytes and electrodes, along with evident structural alterations in LFP [10,11]. Surface modification of cathode electrodes is a promising approach to address the degradation issues in cathode materials for LIBs [12]. Thin films, in particular, can alter the surface properties of the substrates they cover, introducing new functionalities to bulk materials or shielding them from undesired reactions. Consequently, they have a significant impact on the overall performance of the systems in which they are incorporated. Prakasha et al. employed a wet chemical process to deposit Li2ZrO3 (LZO) onto an NMC cathode in order to mitigate electrode degradation. In Prakasha’s study, the surface-modified cathode material retained 85% of its initial capacity after 100 cycles, compared to 57% without modification [13]. Another study by Dai X. et al. demonstrated the deposition of ZnO coatings on LCO, resulting in an 81% capacity retention of the LIBs after 200 cycles [14].
Currently, there is an increasing interest and need for thin films, with thickness control at the nanoscale level. The atomic layer deposition (ALD) technique has recently gained considerable interest as a suitable method for the fabrication of nanoscale thin films [15] and engineering nanostructures in various applications, including energy conversion and storage, microelectronics, and sensing [16,17,18,19]. The virtue of this technique is that the deposition is controlled at the atomic level by self-limiting surface reactions through the alternate exposure of the substrate surface to different gaseous precursors [20]. It provides ultimate control of the film thickness and conformality and has the potential to achieve uniform film composition and properties over the entire substrate surface, even in high aspect ratio structures [17].
So far, ALD has found widespread use in LIBs, for applying nanocoatings to the surfaces of active electrode and electrolyte materials, leading to improvements in their stability, capacity, safety, and more [21,22,23]. For instance, recent studies have indicated that the ALD method exhibits less surface Li extraction for alumina-coated NMC and a more uniform coating morphology compared to the wet chemistry technique [24]. The ALD technique has also been employed to coat LCO powder, creating a cathode electrode in LIBs. This resulted in a capacity retention of 89% after 120 charge–discharge cycles, within the range of 3.3–4.5 V (vs. Li/Li+) [25]. Recently, the ALD technique has also emerged as a promising method for advancing next-generation batteries, particularly in the development of lithium–sulfur batteries [26]. However, most of the previous studies have focused on deposition on powder and low-mass loading electrodes [27], rather than electrodes with high-mass loading [28]. This limitation makes it challenging to assess the behavior of surface-modified cathodes for commercial applications.
In our current research, we focus on investigating the LFP cathode/electrolyte interface, with particular emphasis on how protective layers produced using ALD techniques can stabilize this interface and provide insights into the underlying mechanisms. It is noteworthy that directly applying coating layers onto cathode electrodes can maintain electrical conductivity and facilitate rapid electron transport by preventing deposition at contact points among active material particles, conductive agents, and the current collector [29,30]. This approach enhances battery performance, as reported in the recently published paper by Khotimah et al. on LFP electrodes [31]. Consequently, we opted to utilize ALD directly on the cathode electrode, applying very thin Al2O3 coatings on the surface of high-mass loading LFP films. This approach, involving more ALD cycles, resulted in coatings on LFP electrodes with different Al2O3 thicknesses compared to other similar studies [31]. We conducted electrochemical analyses, including galvanostatic charge and discharge cycles at both room temperature (RT) and 40 °C, as well as electrochemical impedance spectroscopy (EIS), to delve deeper into the role of Al2O3 coatings. Additionally, the morphological and chemical characterization of both coated and uncoated LFP electrodes was performed using scanning electron microscopy (SEM) and X-ray photoelectron spectroscopy (XPS). These tests, along with post-mortem analyses, revealed that the thin Al2O3 coating successfully suppressed undesirable side reactions and improved the transport of lithium ions at the interface between the LFP and the liquid electrolyte. However, to address the relatively low theoretical capacity of the LFP cathode, future research should focus on increasing battery energy density through electrode structure design, supported by modeling and experimental work. Additionally, breakthroughs in fast-charging technology are essential for advancing EVs [32].

2. Experimental Section

2.1. Al2O3 Coating of LFP Electrode by ALD

To deposit an Al2O3 coating over the LFP electrode, the ALD technique was utilized. The depositions were performed in a commercial Beneq Oy TFS 500 ALD reactor, employing trimethylaluminum (TMA, 99.5+%, CAS 75-24-1) (0.25 s exposure) and UPW vapor (0.25 s exposure) as precursors. After each cycle, the reactor chamber underwent purging through the use of an intense N2 flow to remove the byproducts of the chemical reactions. The reactor temperature remained at 115 °C during the deposition process. The growth rate, determined on a Si wafer planar surface, was approximately 0.112 nm/cycle. Consequently, we applied 44 ALD cycles to deposit an Al2O3 layer nominally 5 nm thick on LFP and 88 ALD cycles to deposit an Al2O3 layer nominally 10 nm thick on LFP.

2.2. Electrochemical Measurements

The single-coated LFP cathode was purchased from MSE Supplies. This electrode possesses 93.4% active-mass loading, with a coating density of 14 mg cm−2. For cell assembly, 2032 coin cells were employed for all the electrochemical tests. The cell included pristine LFP or modified LFP electrodes (10 mm diameter), lithium metal chips as the anode (15.6 mm diameter and thickness of 0.25 mm, purchased from MSE supplies), a 25 um polypropylene separator (TOB new energy), and 1.0 M of LiPF6 solution in a 1:1 (v/v)ratio of ethylene carbonate/dimethyl carbonate, as the electrolyte (Merck, battery grade). The cells were assembled in an argon-filled MBraun glove box, with H2O and O2 levels lower than 5 ppm
The assembled cells were then subjected to electrochemical analysis using a constant current (CC) protocol within the voltage range of 2.5–4.2 V, at current rates of 0.1, 0.5, 1, 2, and 5C. The current rates were calculated based on the active material weight of the LFP electrode. The LFP cells were galvanostatically characterized at 1C at room temperature (RT) and 0.5C at 40 °C in the 2.5–4.2 V range. After cell assembly, the cells were rested for 18 h. Afterwards, activation cycles at 0.1C were carried out in order to stabilize the cathode–electrolyte interface (CEI). The cycling performance of the Li/LFP cell was also compared with the modified LFP cell during overcharging (up to 4.5 V) at RT and 1C. EIS was conducted at various states of discharge to gain a better understanding of the performance of the modified and pristine electrodes. Each EIS experiment involved applying an amplitude of 10 mV over a frequency range of 100 kHz to 10 mHz and recording 5 points. Various electrical parameters were derived from the EIS data analysis fitted by the BT-Lab software (V1.75), with a chi-square goodness of fit (χ2) below 10−3. All the electrochemical tests at RT were carried out using a BCS-810 BioLogic instrument and repeated three times to ensure reproducibility. The cycling analyses at 40 °C were conducted using the BTS-5 V10 mA (Neware battery testing system), with the assistance of a thermal chamber.

2.3. Characterization of the LFP Electrodes

The morphological and chemical characterizations were performed on both fresh and cycled electrodes. To do this, the cycled electrodes were removed from the cells after cell disassembly. Subsequently, the electrodes were rinsed with dimethyl carbonate solvent in an argon-filled glove box and further dried for structural analyses. The surface morphology and elemental distribution of the main elements in the modified electrode were obtained using FE-SEM (Thermo Fisher Scientific, Waltham, MA USA) in transmission mode, equipped with an energy-dispersive spectrometer (EDS).
A detailed chemical analysis of the pristine LFP electrode material, LFP electrode coated with alumina by ALD, and the cycled electrodes was conducted using X-ray photoelectron spectroscopy (XPS). The XPS spectra were obtained with a Kratos Axis DLD Ultra instrument (Kratos Analytical, Manchester, UK), equipped with a hemispherical analyzer and a monochromatic Al Kα (1486.6 eV) X-ray source. The broad spectra (survey) were acquired at a pass energy of 160 eV, while a higher resolution was employed for the acquisition of the core lines, with the pass energy set at 20 eV, resulting in an energy resolution of ~0.4 eV. The analyses were conducted with the sample tilted at 90° with respect to the analyzer, enabling a maximum sampling depth of approximately 10 nm. Spectral fitting was performed using homemade software (R-XPS), based on the R platform [33]. Following a Shirley-type background subtraction, Gaussian–Lorentzian peak shapes were utilized for the deconvolution of single core lines. Experimental sensitivity factors (RSF) were applied for quantifying the different components. The quantification accuracy, in terms of the relative atomic concentration, was evaluated to be within the range of 0.5–1%.

3. Results and Discussion

3.1. Structural Characterization of the Pristine LFP Electrode and of the Al2O3-Coated Electrodes

The chemical composition of the pristine LFP electrode and the same substrate coated with 5 nm and 10 nm of Al2O3 deposited by ALD was analyzed by XPS. The broad survey spectra are presented in Figure 1: in green the spectrum acquired on the pristine LFP electrode are shown, in red the spectrum acquired on the LFP coated with 5 nm of Al2O3 and, finally, in black the spectrum acquired on the LFP coated with 10 nm of Al2O3.
As indicated by the labels in Figure 1, the main peaks appearing in the data acquired on the pristine LFP (green upper line) are those due to the elements fluorine (F1s), carbon (C1s), oxygen (O1s), and phosphorus (P2s and P2p). The presence of iron is also detected, even if the signal of the line Fe2p is partially embedded in the loss structures on the high binding energy (BE) side of the F1s peak. Similarly, the Li1s signal is not easily discernible in the survey spectrum due to its position at 56 eV, falling within the weak, low BE region of the broad spectrum. As expected, O1s, P2p, Fe2p, and Li1s peaks originate from the LiFePO4 composite structure, while C1s and F1s signals arise from the carbon black and the polyvinylidene fluoride (PVDF) binder, which are commonly found in commercial LFP electrodes. It is also important to point out that peaks related to the Auger transitions of electrons of O (OKLL) and F (FKLL) are present in the data and they have been labeled for better clarity.
Looking at the wide spectrum acquired for the LFP electrode coated with 5 nm of Al2O3 (red central line in Figure 1), one can observe a significant reduction in the fluorine and carbon signals, while those of aluminum (Al2p and Al2s) appear, together with an increase in O1s signal intensity. This indicates the successful deposition of an alumina layer (Al2O3) on the LFP surface. The Al2O3 coating, in fact, covers the LFP surface and tends to attenuate the XPS signal coming from it. (This result has been validated with FE-SEM/EDS analysis, as shown in Figure S1 in the Supporting Information.) Considering that the maximum sampling depth of XPS is 10 nm, it is reasonable that with 5 nm of Al2O3 coating the peak of F1s is still visible, even if strongly reduced in intensity, as it comes from the LFP underneath. On the contrary, the F1s peak nearly disappears in the wide spectrum acquired on the LFP sample coated with 10 nm of alumina (lower black line in Figure 1), as the coating thickness approaches the sampling depth of the technique, minimizing the contribution from the underlying LFP electrode. Overall, we can conclude that Figure 1 is helpful in proving the successful deposition of Al2O3 coatings with increasing and controlled thicknesses by ALD on LFP substrates.
The high-resolution core lines of the different elements detected were then analyzed and deconvoluted to highlight the contribution of the various chemical states [34,35].
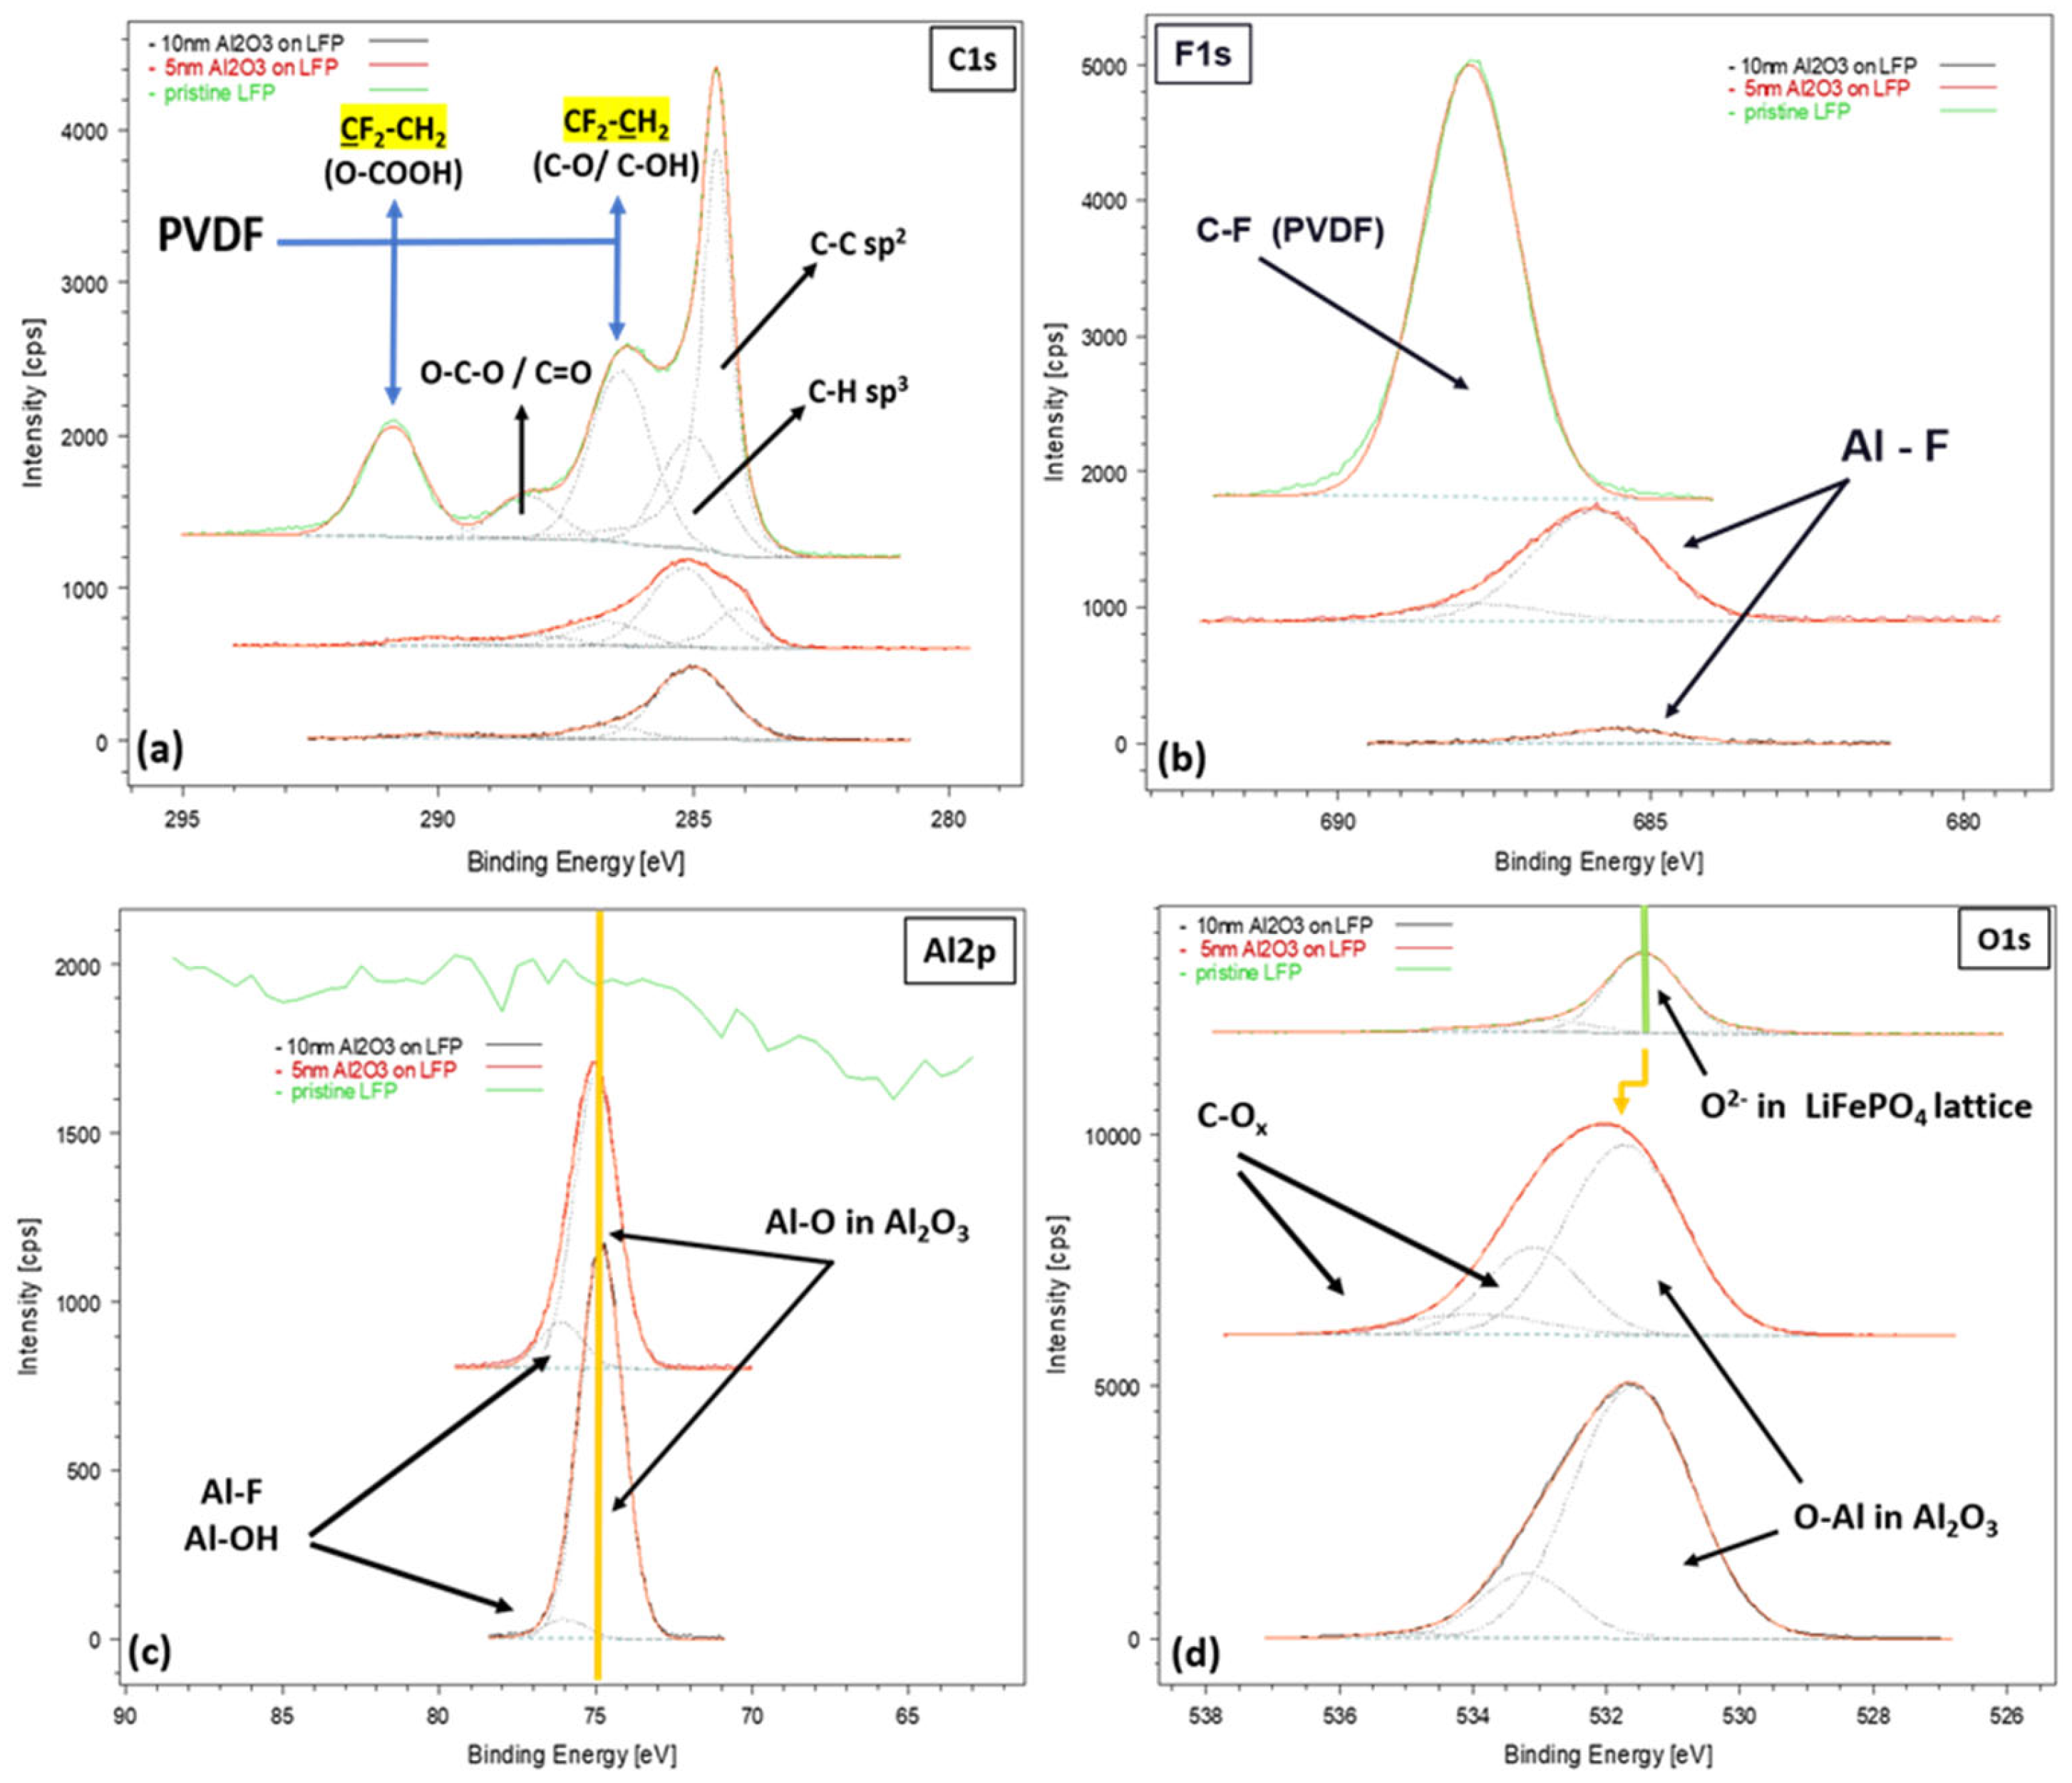
Particularly in Figure 2, we present the deconvolution of the detailed core lines of C1s (panel a), F1s (panel b), O1s (panel c), and Al2p (panel d), acquired on pristine LFP (green curves) and on LFP coated with 5 nm and 10 nm of Al2O3 (red and black curve, respectively).
The C1s peak acquired on the pristine LFP (Figure 2a, green curve) exhibits a strong component at 284.5 eV, attributed to C-C sp2 bonds, commonly associated with carbon black present in LFP electrodes. Additionally, the components at 285 eV (C-H bonds), 286.5 eV (CF2-CH2 bonds), and 290.9 eV (CF2-CH2 bonds) are mainly due to the PVDF binder typically added to LFP, while the component at 288 eV can be attributed to ether O-C-O or carbonyl C=O groups from carbonaceous contamination [35]. Looking at the F1s core line acquired on the same sample (Figure 2b, upper green curve), it can be fitted with just one component at 688 eV, which corresponds exactly to the C-F bond in the CH2-CF2 polymeric chain of the PVDF binder. Finally, the O1s core line acquired on pristine LFP (Figure 2d, green curve) displays a main component at 531.4 eV, attributed to lattice oxygen of LFP, with weaker components at higher BEs due to carbonaceous contamination (O-C-O and C=O oxidized states of carbon).
Following the evolution of the different core lines in Figure 2, it is possible to highlight the changes in the LFP electrode surface composition, which occur after the Al2O3 layer deposition by ALD. As previously evidenced by the comparison of the survey spectra in Figure 1, the alumina coatings cover the LFP surface, gradually hiding its native chemical structure, as long as the thickness of the film increases. This is shown first of all in the evolution of the C1s core line (Figure 2, panel (a): the red core line corresponding to the 5 nm Al2O3-coated LFP and the black core line to the 10 nm Al2O3-coated LFP), where signals from the conductive carbon black and the PVDF binder at 284.5 eV, 286.5 eV, and 290.9 eV, coming from the LFP, are significantly progressively attenuated as the thickness of the alumina film increases. The C1s core line acquired on the surface of the growing Al2O3 film is instead mainly composed of components at 285 eV and 288 eV, attributable to C-H and C-Ox bonds, probably related to residuals coming from the TMA reactant used in the ALD process.
Correspondingly, in Figure 2, panel (b), it can be observed how the single C-F component at 688 eV coming from the PVDF binder, which is intense in the pristine LFP (green line), is greatly diminished in the Al2O3-coated samples (red and black lines). As the LFP surface starts to be covered by the alumina layer, in fact, the signal due to C-F bonds leaves place to a lower BE component at around 685.5eV, which can be attributed to Al-F bonds [34] which probably are created at the interface between LFP and the growing alumina films. The fact that this contribution is notably weaker in the sample coated with the thickest 10 nm alumina film (lower black line in panel b) confirms our hypothesis, as in this sample the XPS sampling depth (10 nm) is comparable to the thickness of the film and the signal coming from the interface with the LFP underneath is necessarily less intense.
Confirmation of the successful deposition of an Al2O3 coating on the LFP surface finally comes from the analysis of the Al2p and O1s core lines (Figure 2 (panels c and d)): the deconvolution of the former acquired on the ALD-coated samples reveals a main component at 75 eV, which is the expected BE for aluminum oxide, with a minor shoulder at higher BEs due to Al-F and/or Al-OH bonds [34]. Similarly, the fitting of the latter acquired on the coated samples shows an upward shift in the main O1s component, consistent with the creation of Al-O bonds, and minor components at higher BEs due to C-Ox bonds, probably related, as discussed before, to residuals coming from the TMA reactant used in the ALD process.

3.2. Electrochemical and Post-Mortem Analyses

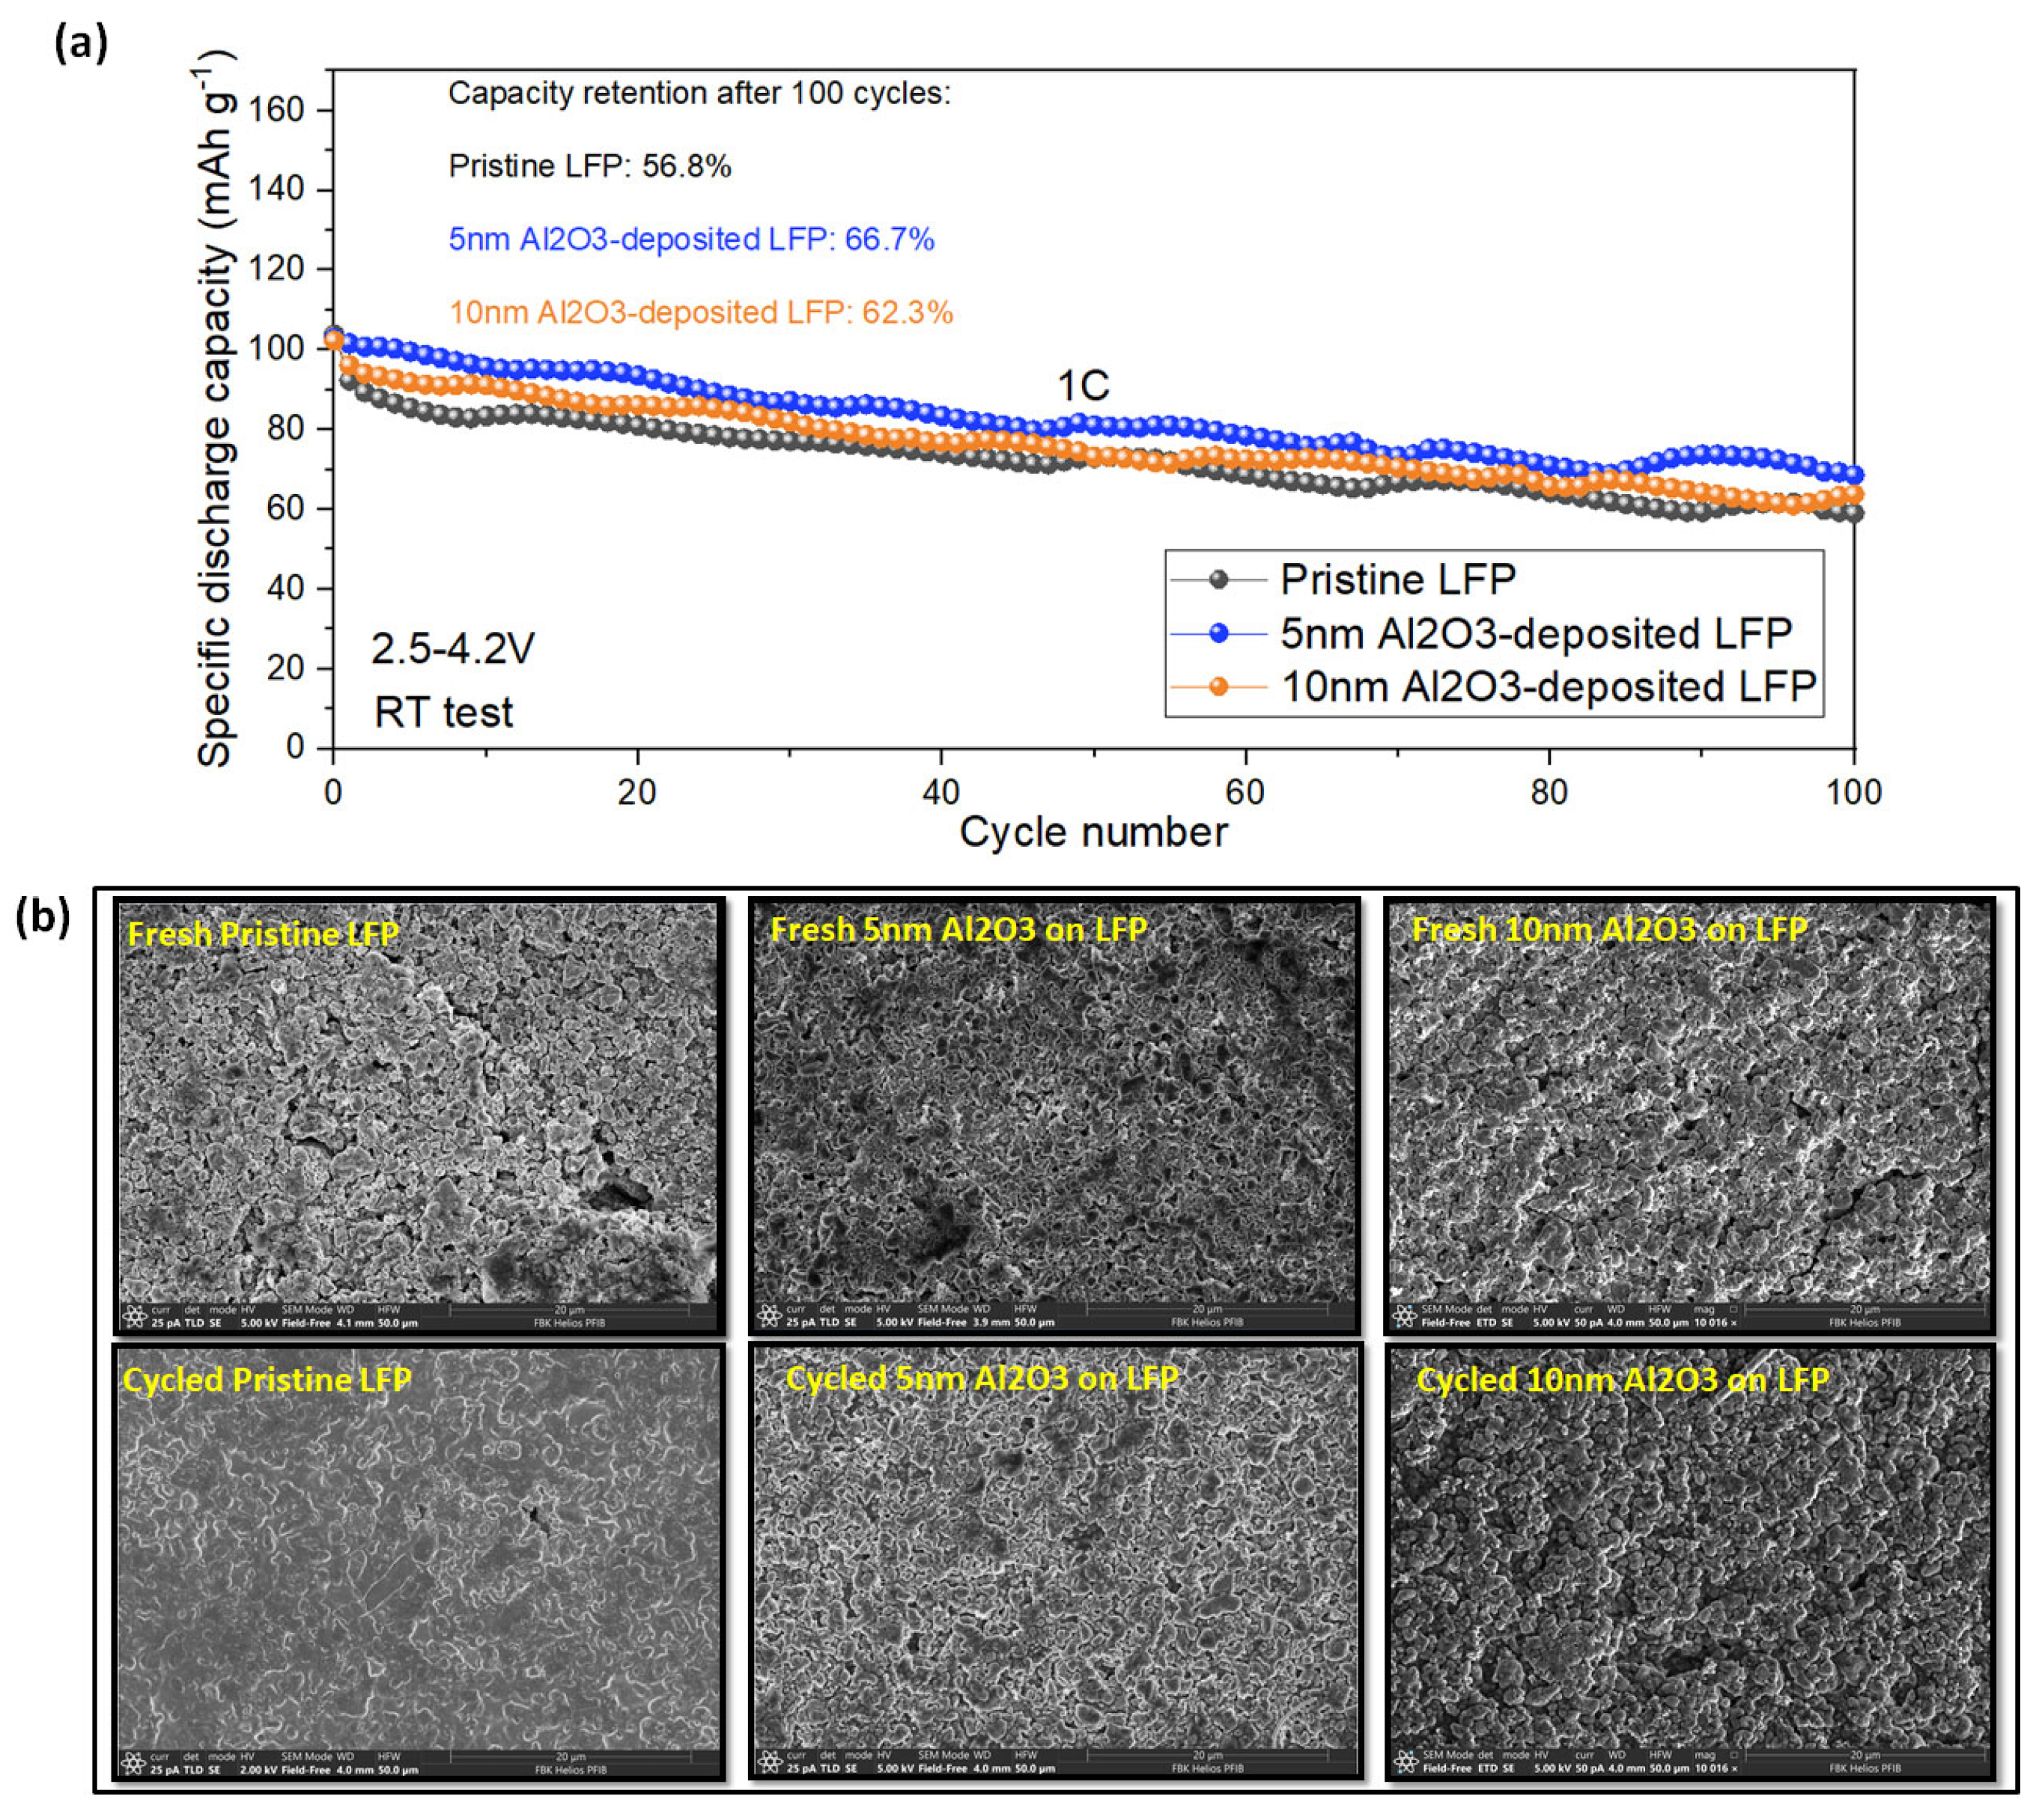
The cycling performance of pristine and Al2O3-coated LFP electrodes (5 nm and 10 nm coating), over 100 charge and discharge cycles at 1C, are shown in Figure 3a. Initially, all three electrodes exhibit a similar capacity of approximately 103 mAh g−1. However, after 100 cycles, the capacity of the pristine LFP electrodes and 5 nm and 10 nm Al2O3-coated LFP electrodes decreases to around 59, 69, and 64 mAh g−1, respectively. Notably, the capacity retention of the 5 nm Al2O3-coated LFP is 66.7%, surpassing that of the other two electrodes. To investigate the origin of the improved cycling performance imparted by the Al2O3 film, top-view SEM analysis (Figure 3b) was performed on the coated and uncoated electrodes in the fresh state and after cycling. After 100 cycles, the original LFP electrode exhibits agglomerates and protrusions on its surface, hindering electrolyte penetration into the internal active materials and impeding the channel for Li+ transportation. Conversely, when employing coated LFP electrodes, the morphological changes are less pronounced, indicating that the protective layer ensures a stable interface throughout the charge and discharge processes. Consequently, the LFP electrodes with coated layers demonstrate both enhanced capacity and better cycling stability.
To gain deeper insights, galvanostatic charge–discharge profiles (1st, 50th, and 100th cycles) and differential capacity (dQ/dV) versus voltage plots for the 100th cycle were analyzed. Figure S2a,b illustrates the higher overpotential observed in the pristine LFP compared to the modified sample during cycling. Additionally, during the lithiation and delithiation processes of the LFP (Figure S2c), two sharp reduction and oxidation peaks are observed at around 3.3 V and 3.6 V, respectively, both corresponding to the Fe2+/Fe3+ redox couple [36]. The voltage difference between these peaks is 0.38 V for the pristine sample, compared to 0.29 V for the 5 nm Al2O3-coated sample, indicating greater polarization in the pristine LFP under half-cell configuration.
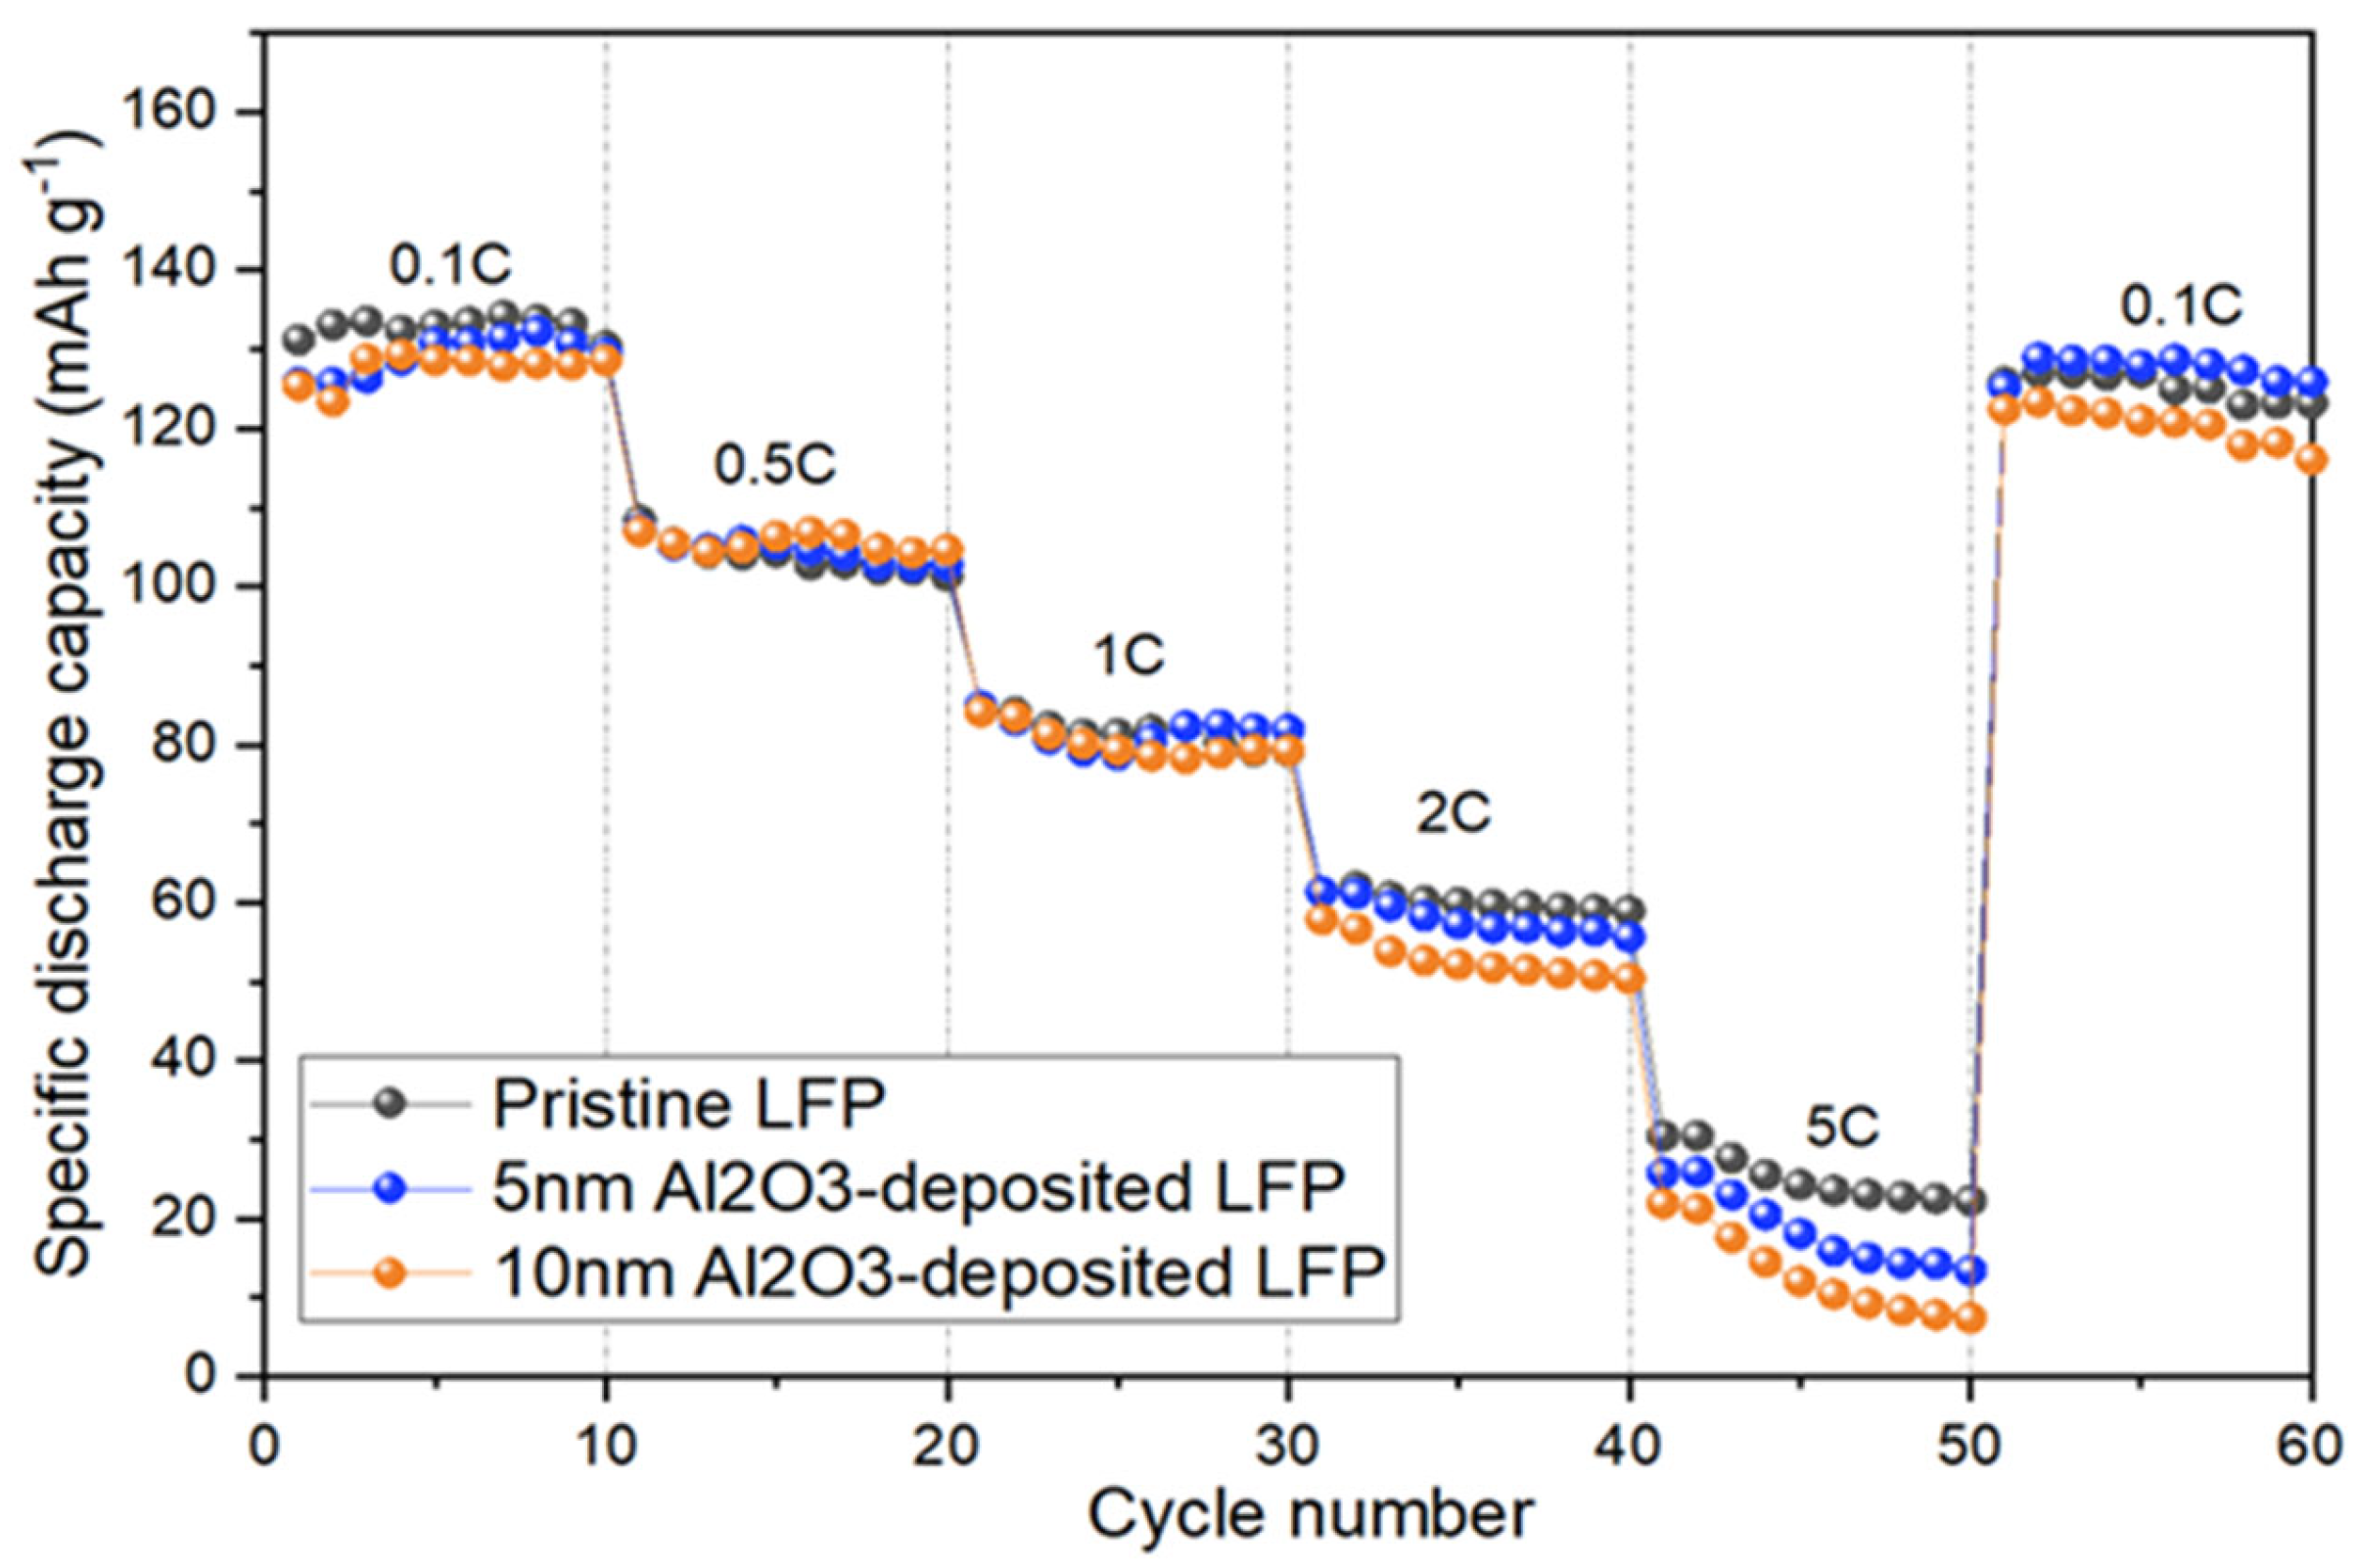
Figure 4 illustrates the performance rate of the LFP-based electrodes at different C rates. For each cathode electrode, the discharge capacities exhibit a clear decline as the C rate increases, a phenomenon commonly observed in LIB electrodes [29]. The dominant factor influencing this behavior is the diffusion of lithium ions within the cathodes at very low rates, which plays a crucial role in the lithium insertion process [37,38]. This leads to the formation of a concentration gradient for lithium ions within the cathodes during discharge. Consequently, the cathode potential rapidly declines to the cutoff potential, once the cathode surface completes the discharge process. However, the central region of the cathodes may not achieve full discharge, contributing to a reduction in the cathode usage efficiency. This decrease in efficiency is exacerbated when higher current densities are applied, inevitably leading to a lower discharge capacity. Here, at C rates lower than 2C, the electrodes exhibit very similar behavior. However, at 2C and 5C, the pristine sample demonstrates a higher capacity compared to the coated electrodes. This difference may be attributed to the protective layer on the LFP surface in the case of the coated electrodes, which increases the resistance and enhances the transport range of Li ions to LFP electrodes. Nevertheless, the 5 nm Al2O3-coated LFP electrode demonstrates better reversibility when the current rate returns to 0.1C after 50 cycles.
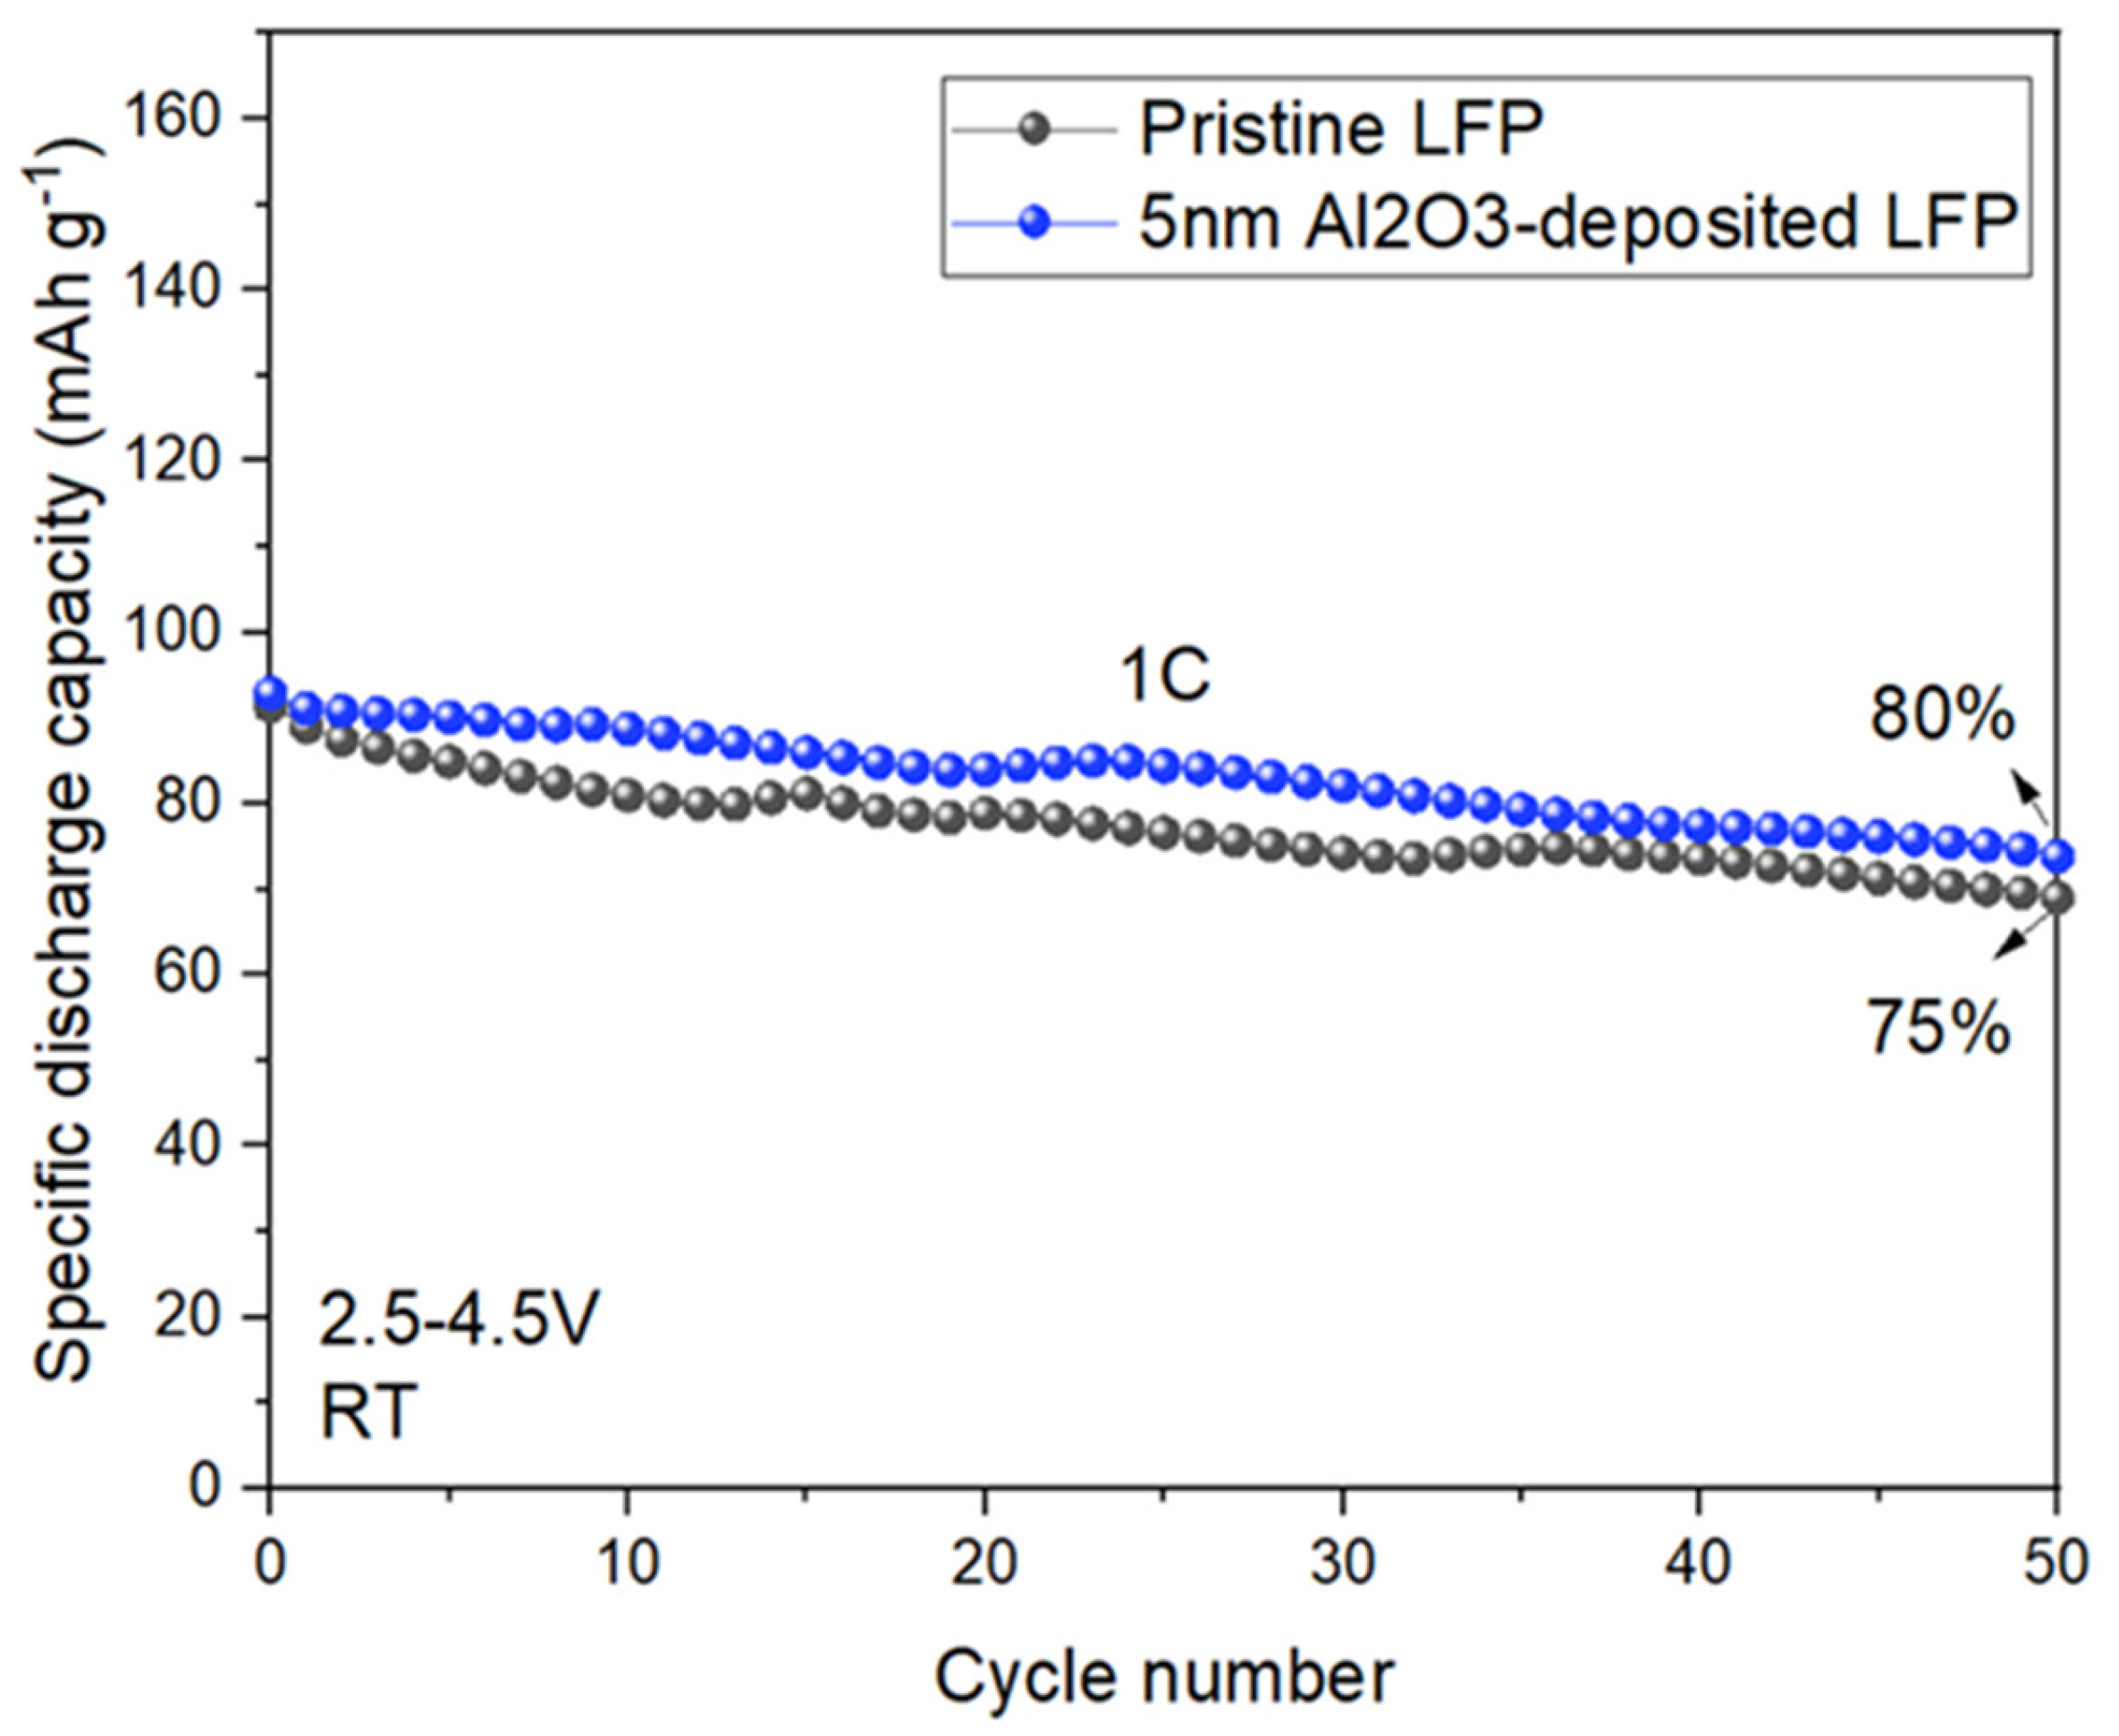
The market share of low-voltage LFP cathodes is currently increasing due to its economical nature, high thermal stability, lack of toxicity, and safety features. Although its discharge voltage plateau is lower than that of other cathodes, such as LiCoO2, the stable discharge voltage of LFP within the electrochemical stability window of existing electrolyte systems serves to prevent electrolyte decomposition and the development of a Solid Electrolyte Interphase (SEI) [9]. The stability of LFP is credited to its olivine structure and secure P-O bonds [39]. Despite the overall stability of low-voltage cathode materials like LFP, during overcharging the small size of LFP nanoparticles can trigger adverse reactions, leading to SEI formation and degradation in LIBs’ performance [40]. This may result in local heating, causing cell destruction, with potential ignition. In this work, in addition to the evaluation of the performance of both pristine and 5 nm Al2O3-coated LFP electrodes within the voltage range of 2.5 to 4.2 V, an exploratory investigation has been initiated to understand the impact of increased upper cutoff potentials, specifically set at 4.5 V, on the cyclability of LFP electrodes. As depicted in Figure 5, the coated sample exhibits superior performance in comparison to the pristine LFP, indicating that the Al2O3 coating might efficiently shield the LFP electrodes from additional degradation.
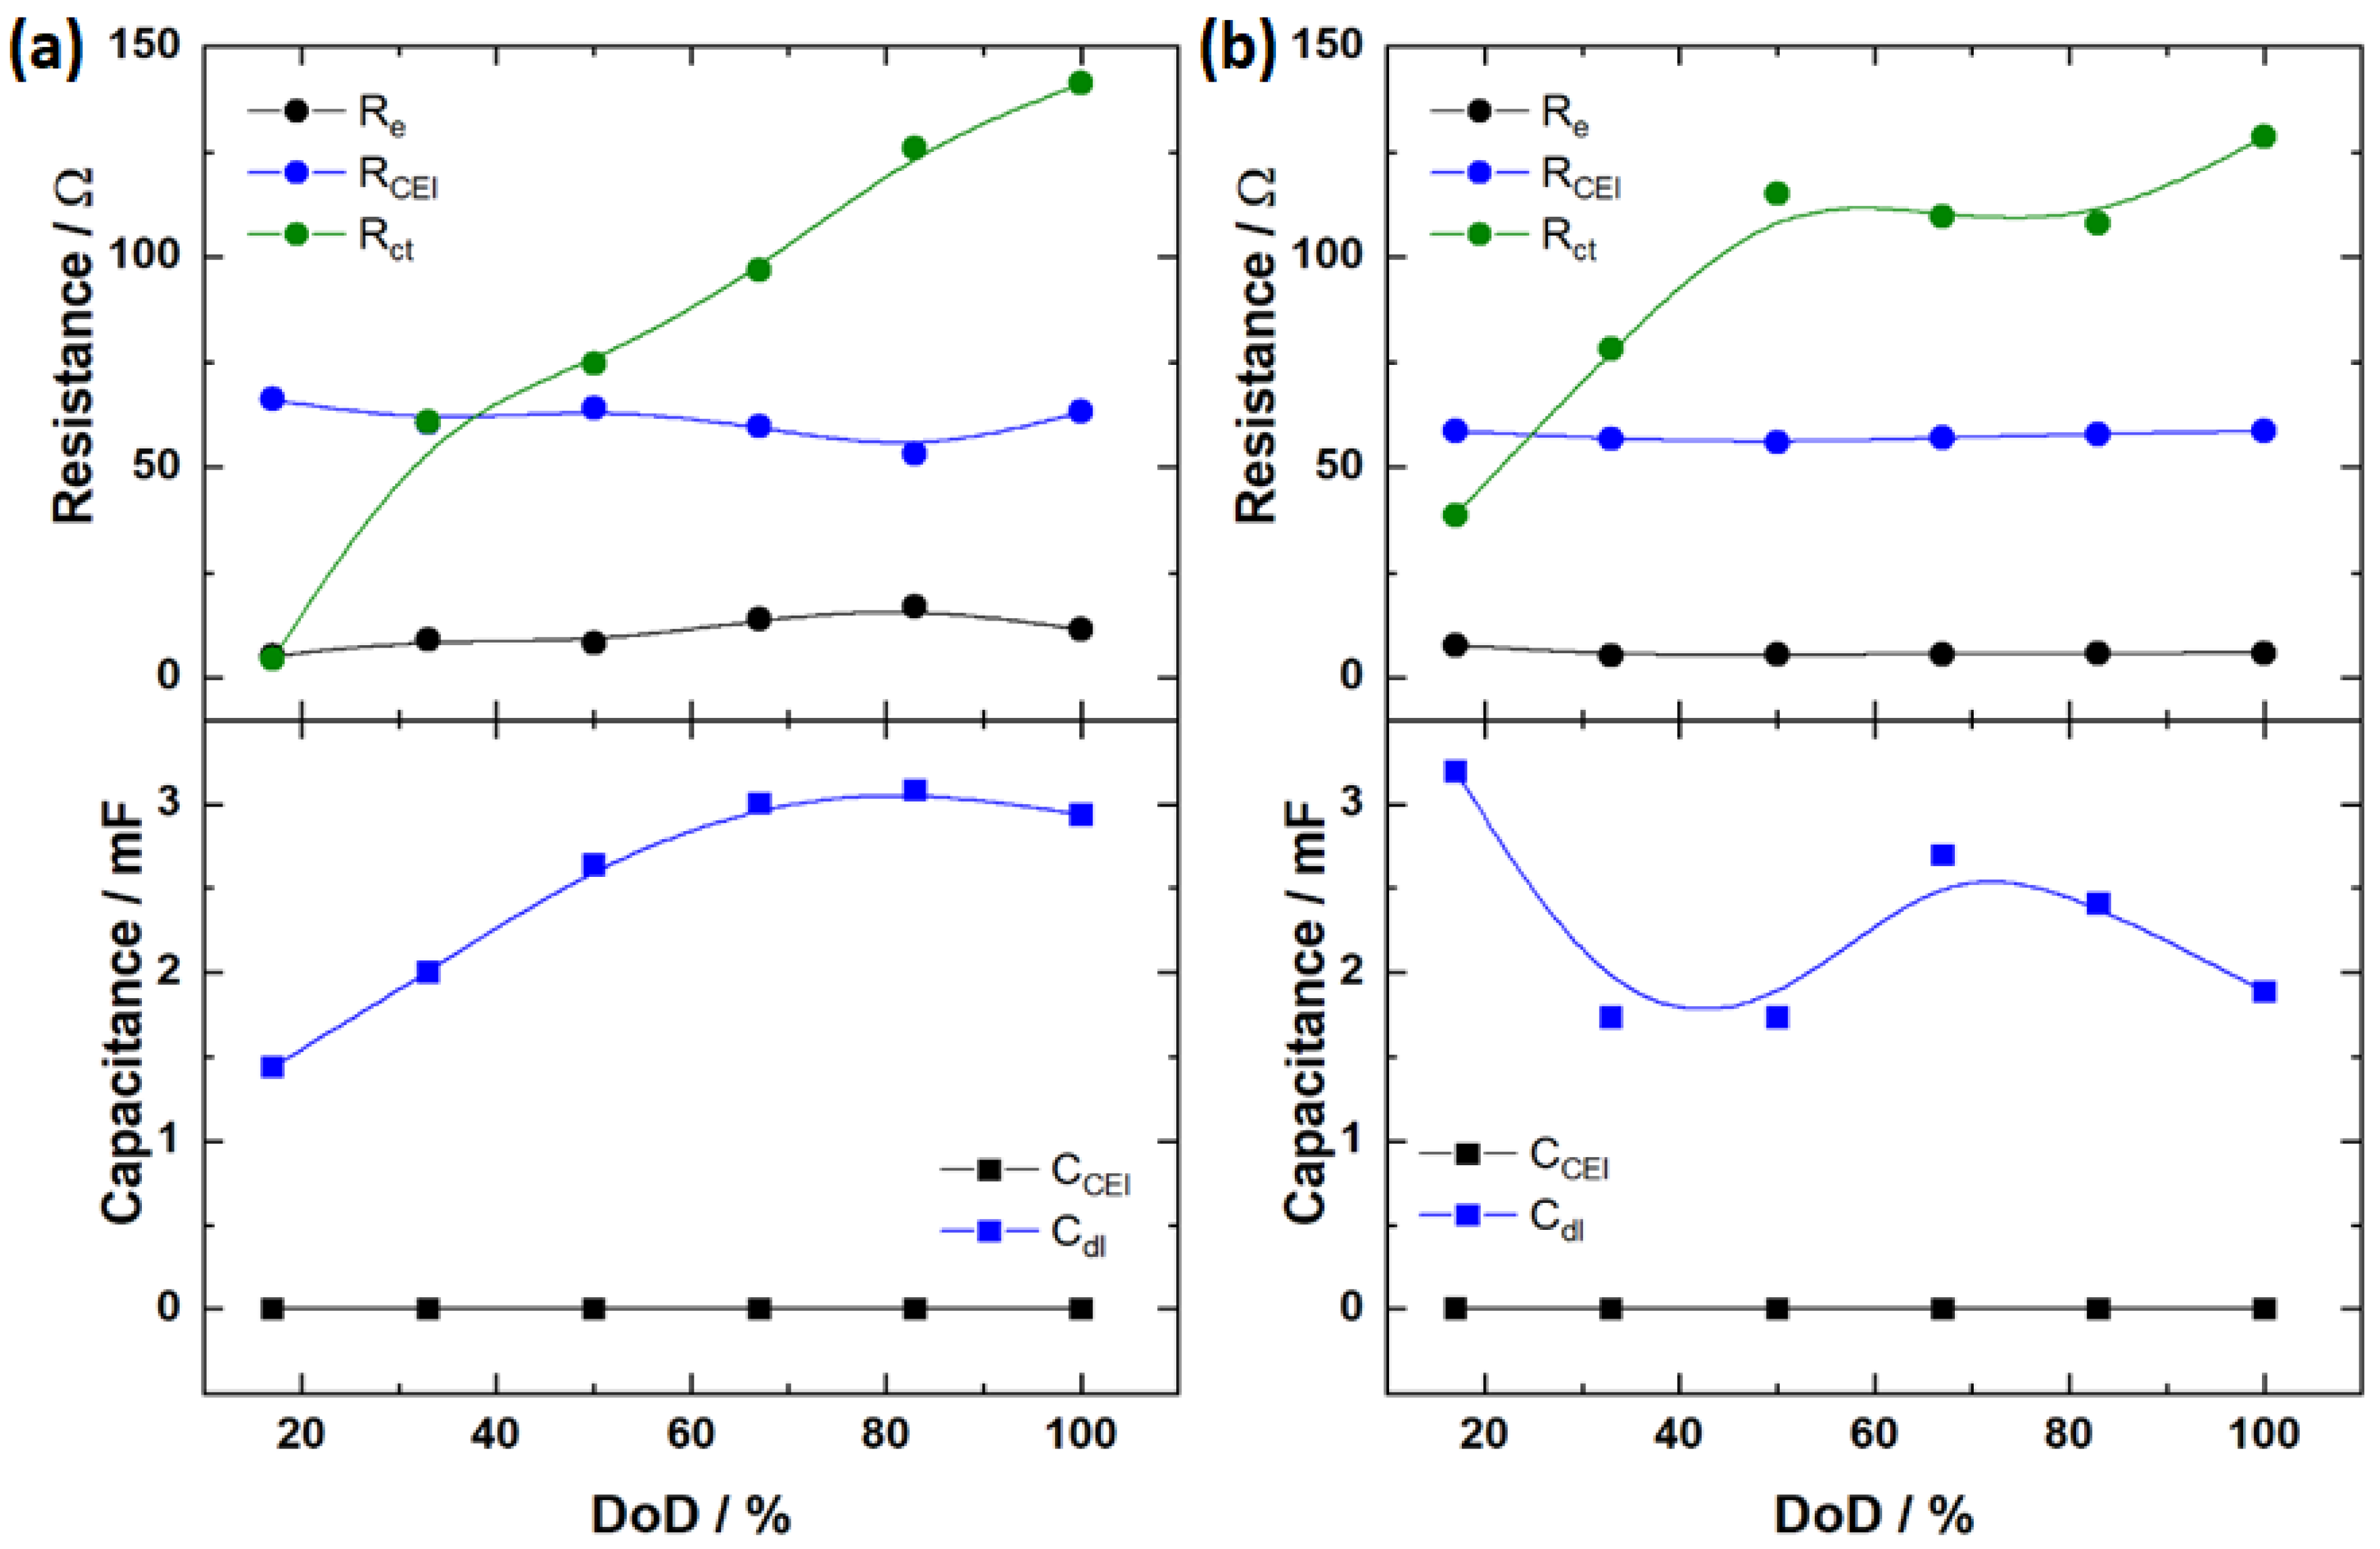
To gain a better understanding of the electrochemical performance of the samples, we conducted EIS on both pristine and 5 nm Al2O3-coated LFP electrodes. After stabilizing the cell, the electrode was completely charged and discharged at 0.1C, employing a different discharge cutoff voltage (Figure S3). Figure 6a,b displays the Nyquist plot for the EIS data recorded at various lithiation states of both electrodes. At intermediate frequencies, it is possible to see a depressed, large semicircle, which corresponds to the superposition of two semicircles related to the CEI layer formation and the charge transfer of the faradaic process; finally, at low frequencies a straight line due to diffusion is observed [41]. To better distinguish the semicircles, a Bode plot of the cells at 50% DOD is provided, as an example, in the Supplementary Information (Figure S4). To obtain the electrochemical parameters, the experimental data were fitted using an equivalent electric circuit (Figure S5), in which Re, RCEI, and Rct are the resistances of the electrolyte, CEI, and charge transfer, respectively, while CPE1 and CPE2 are the constant phase elements used to obtain the effective capacitance values CCEI and Cdl related to the CEI and the double layer, respectively, with the aid of the Brug equation, Equation (1) [42]. The W element represents the Warburg impedance associated with the diffusion process.
Ceff = [Q(Re−1 + R−1)(α−1)](1/α),
Our findings indicate that the overall impedance of the pristine sample is higher than that of the coated sample, as the discharge process approaches its completion (depth of discharge, DOD of around 80% and 100%). Notably, the CEI resistance in the pristine sample (Figure 7a) exhibits more variation at different states of lithiation, whereas the coated sample maintains an RCEI of approximately 58 Ω across the various discharge states (Figure 7b). Table S1 and Figure 7 present the numerical values of Re, RCEI, and Rct, CCEI, Cdl, and W, obtained from fitting the EIS spectra at different lithiation states.
Since the LFP electrodes used in all cell tests underwent no modification in regard to their preparation, it is reasonable to assume that the differences in the RCEI values are related to processes involving the CEI layer. Therefore, it is possible to verify that the coated electrode presents an RCEI almost 10% lower than the pristine electrode, indicating a more stable CEI layer. Furthermore, it was also observed that the Rct increases along with the DoD for both electrodes, indicating that the delithiated form has higher electrical conductivity than the lithiated form, consistent with previous reports on LFP-based batteries [43,44]. Additionally, the coated electrode presented resistance values in the same range as the pristine electrode, which points out that the additional non-conductive 5 nm layer of Al2O3 does not substantially hinder electrode conductivity.
The transport properties of lithium ions play a crucial role in the performance, durability, and efficiency of LIBs; if ion mobility is hindered or slowed down, it can lead to degradation of the electrode materials and a loss of capacity over time. Therefore, EIS was used to estimate the diffusion coefficient of Li+ (DLi+) for both the pristine and 5 nm-coated electrodes, to assess possible side effects from the alumina deposited film. The Warburg impedance can be used to obtain (DLi+) by means of Equation (2) [45,46].
DLi+ = ½[(Vm/FAσW)(dE/dx)]2,
where Vm is the molar volume of LiFePO4 (43.87 cm3 mol−1), F stands for the Faraday constant, A is the surface area of the electrode (0.79 cm2), σW is the Warburg coefficient obtained from the fitting, and (dE/dx) is the slope of the discharge curve for each composition. Table S2 and Figure S6 show the calculated DLi+ for both the pristine and 5 nm Al2O3-deposited electrodes at different DoD. Based on the analysis, it is possible to verify that the more lithiated region presents higher ionic mobility, when compared to the low-lithiated DoD, which might be related to distortions in the lattice parameters and, consequently, the expansion of the internal channels in the LFP olivine structure when the content of Li+ increases [47]. Furthermore, since the lithium insertion starts from the periphery of the electrode during the reaction, the results show that the additional 5 nm Al2O3 coating did not cause significant drawbacks in the ionic diffusion during the lithiation process [44].
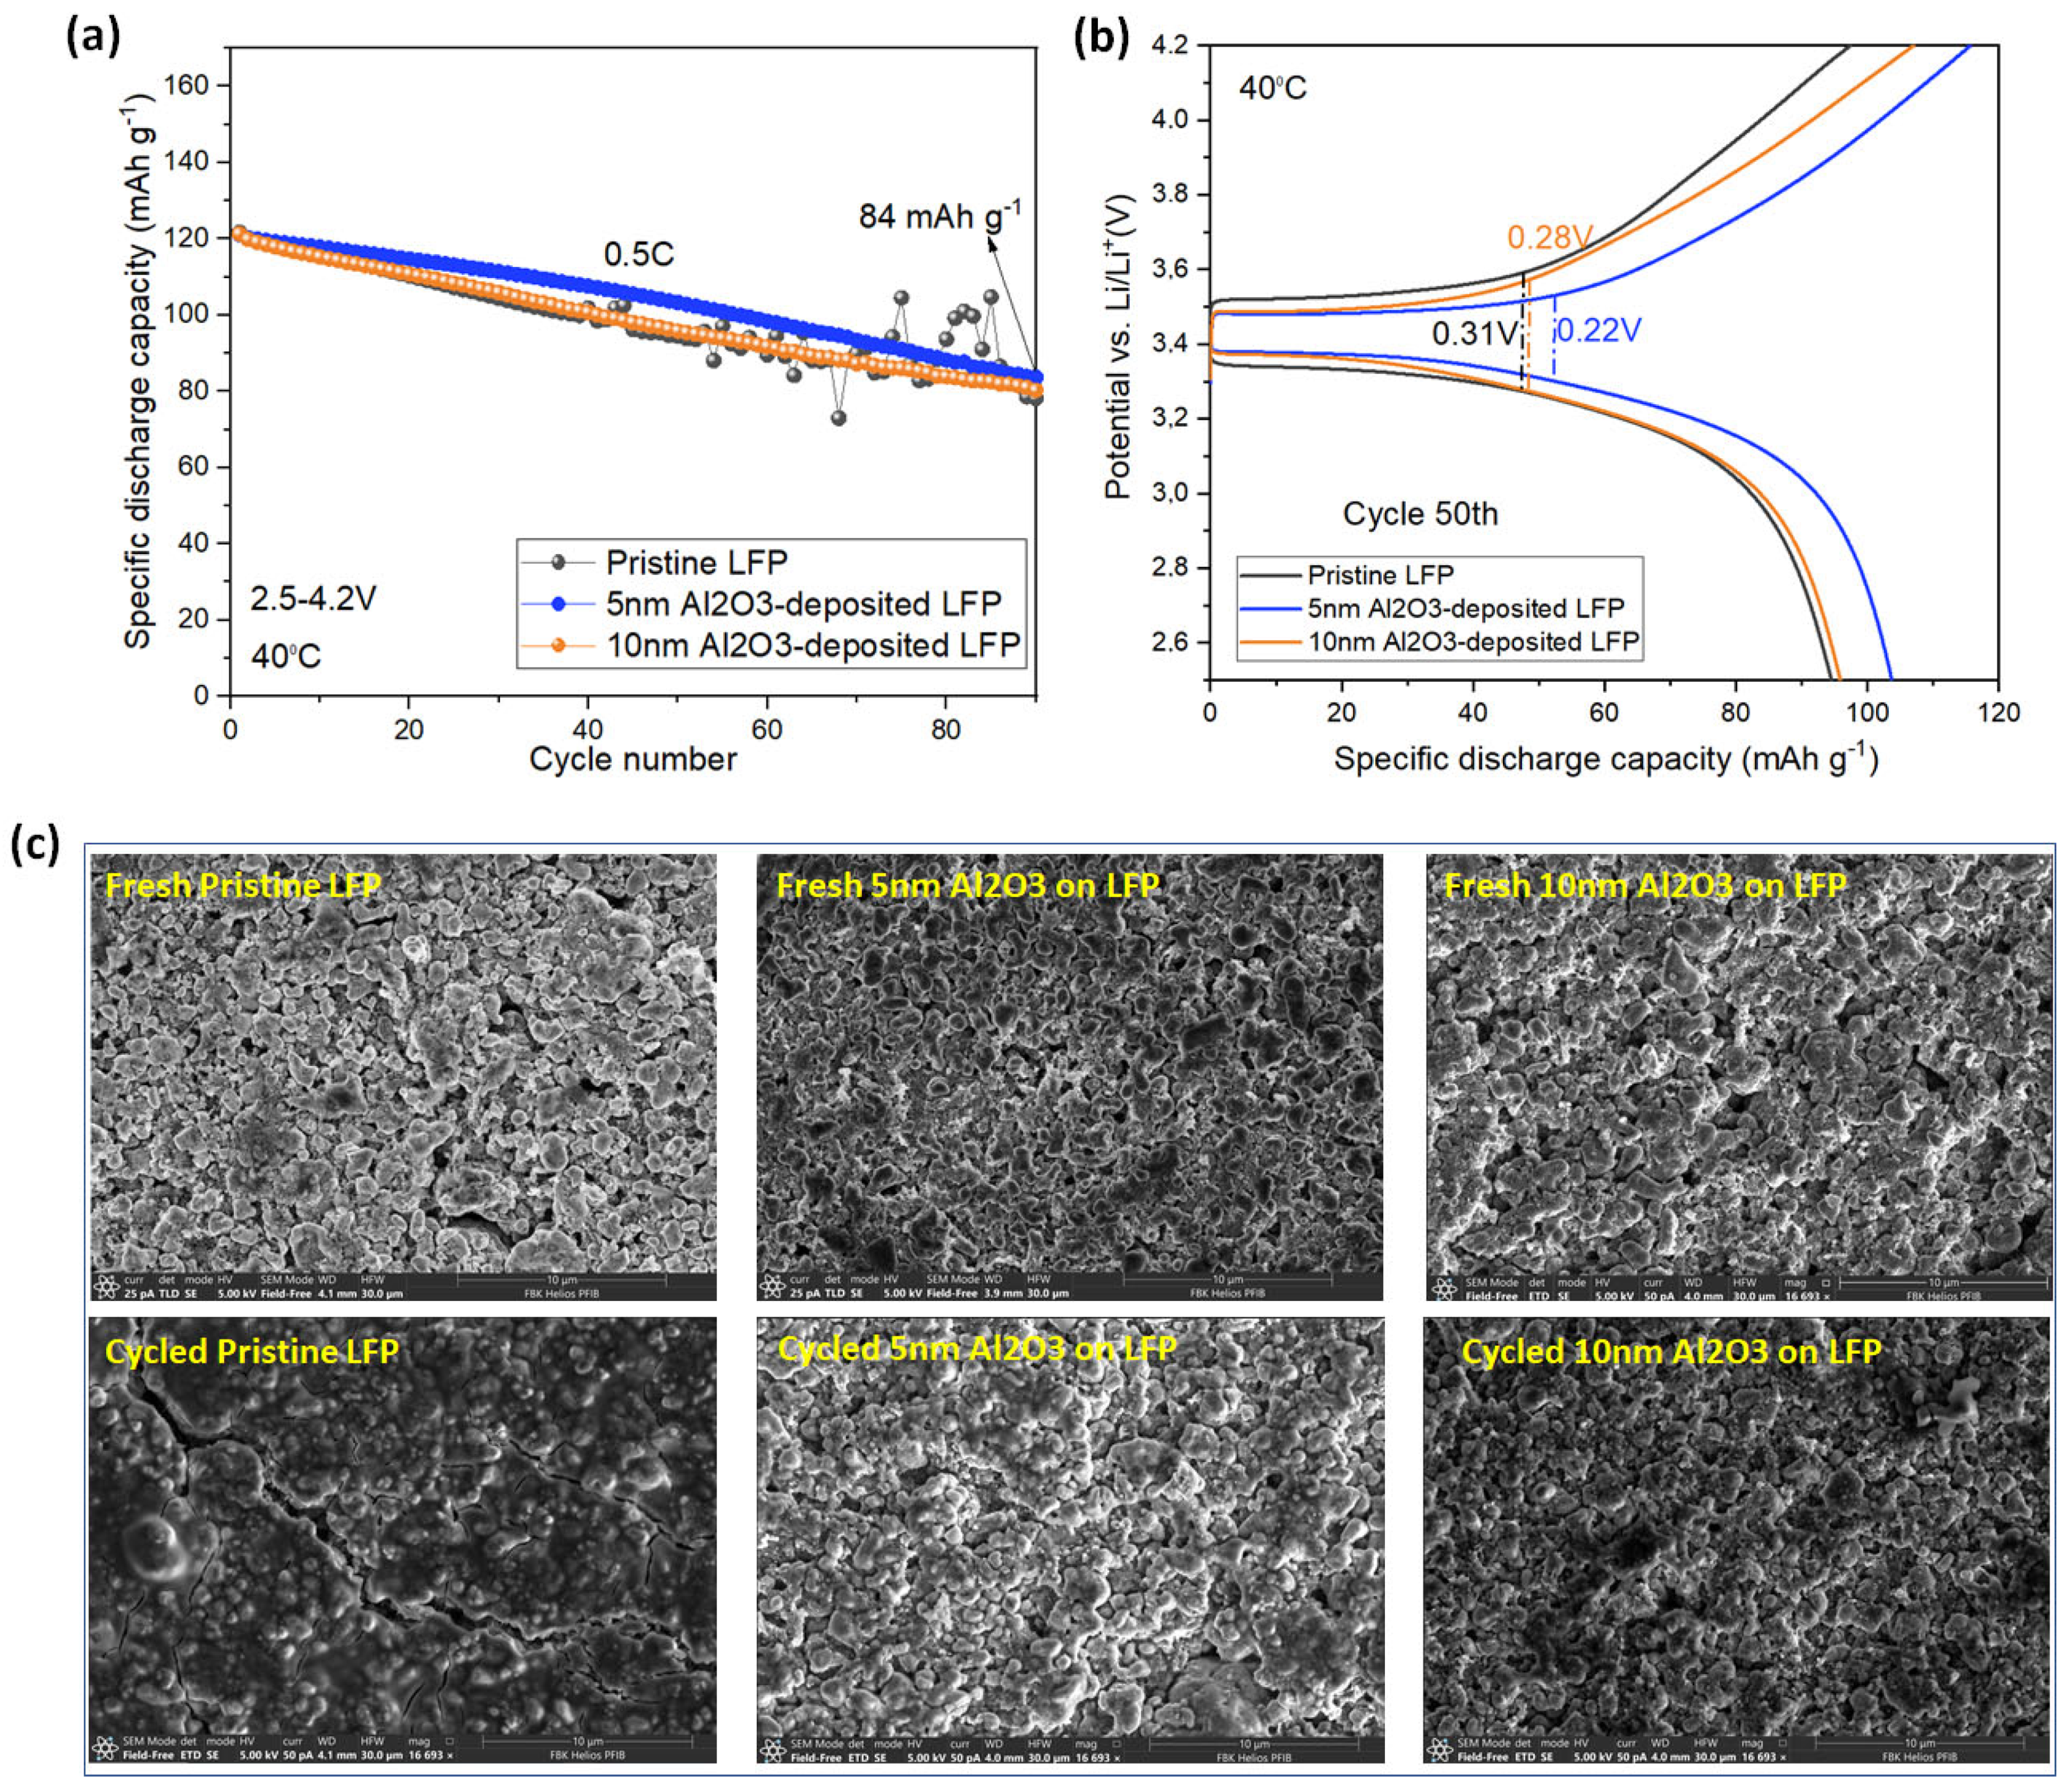
In addition to analyzing the electrodes at room temperature, the cycling performance of the electrodes at elevated temperatures is considered a crucial criterion. Figure 8 illustrates the electrochemical behavior and structural changes in both the uncoated and coated electrodes during cycling at 0.5C and 40 °C. According to Figure 8a, coated LFP electrodes with 5 nm and 10 nm Al2O3 exhibit more stable behavior compared to the pristine electrode. In the cell with pristine LFP particles, there was a capacity fluctuation after 40 cycles of charge/discharge, likely due to the unstable reaction between the electrode and the electrolyte. Consequently, uncontrollable side reactions between the electrolyte and the LFP cathode led to electrolyte decomposition, resulting in an unstable interface layer. In contrast, cells fabricated using Al2O3-coated LFP electrodes exhibited stable behavior, indicating that side reactions at the interface were suppressed by the Al2O3 coating. Among all the cells, the LFP electrode with a 5 nm Al2O3 ALD coating showed the highest capacity. The sample with the 10 nm coating also demonstrated good performance, but with less capacity compared to the 5 nm Al2O3-coated LFP, possibly because the thicker Al2O3 coating suppressed undesirable side reactions, while extending the lithium-ion transport pathway, resulting in increased resistance. Figure 8b illustrates the charge/discharge curves of the electrode at the 50th cycle. The overpotential of the pristine sample is higher than the other two coated electrodes, consistent with the cycling performance. Moreover, the top-view SEM images of the electrodes (Figure 8c) after cycling at 40 °C display morphological changes and crack generation on the pristine LFP surface, while the coated LFP surface undergoes minimal changes. These results further confirm that Al2O3 coating can suppress undesirable side reactions between LFP and the electrolyte, leading to better cycling behavior.
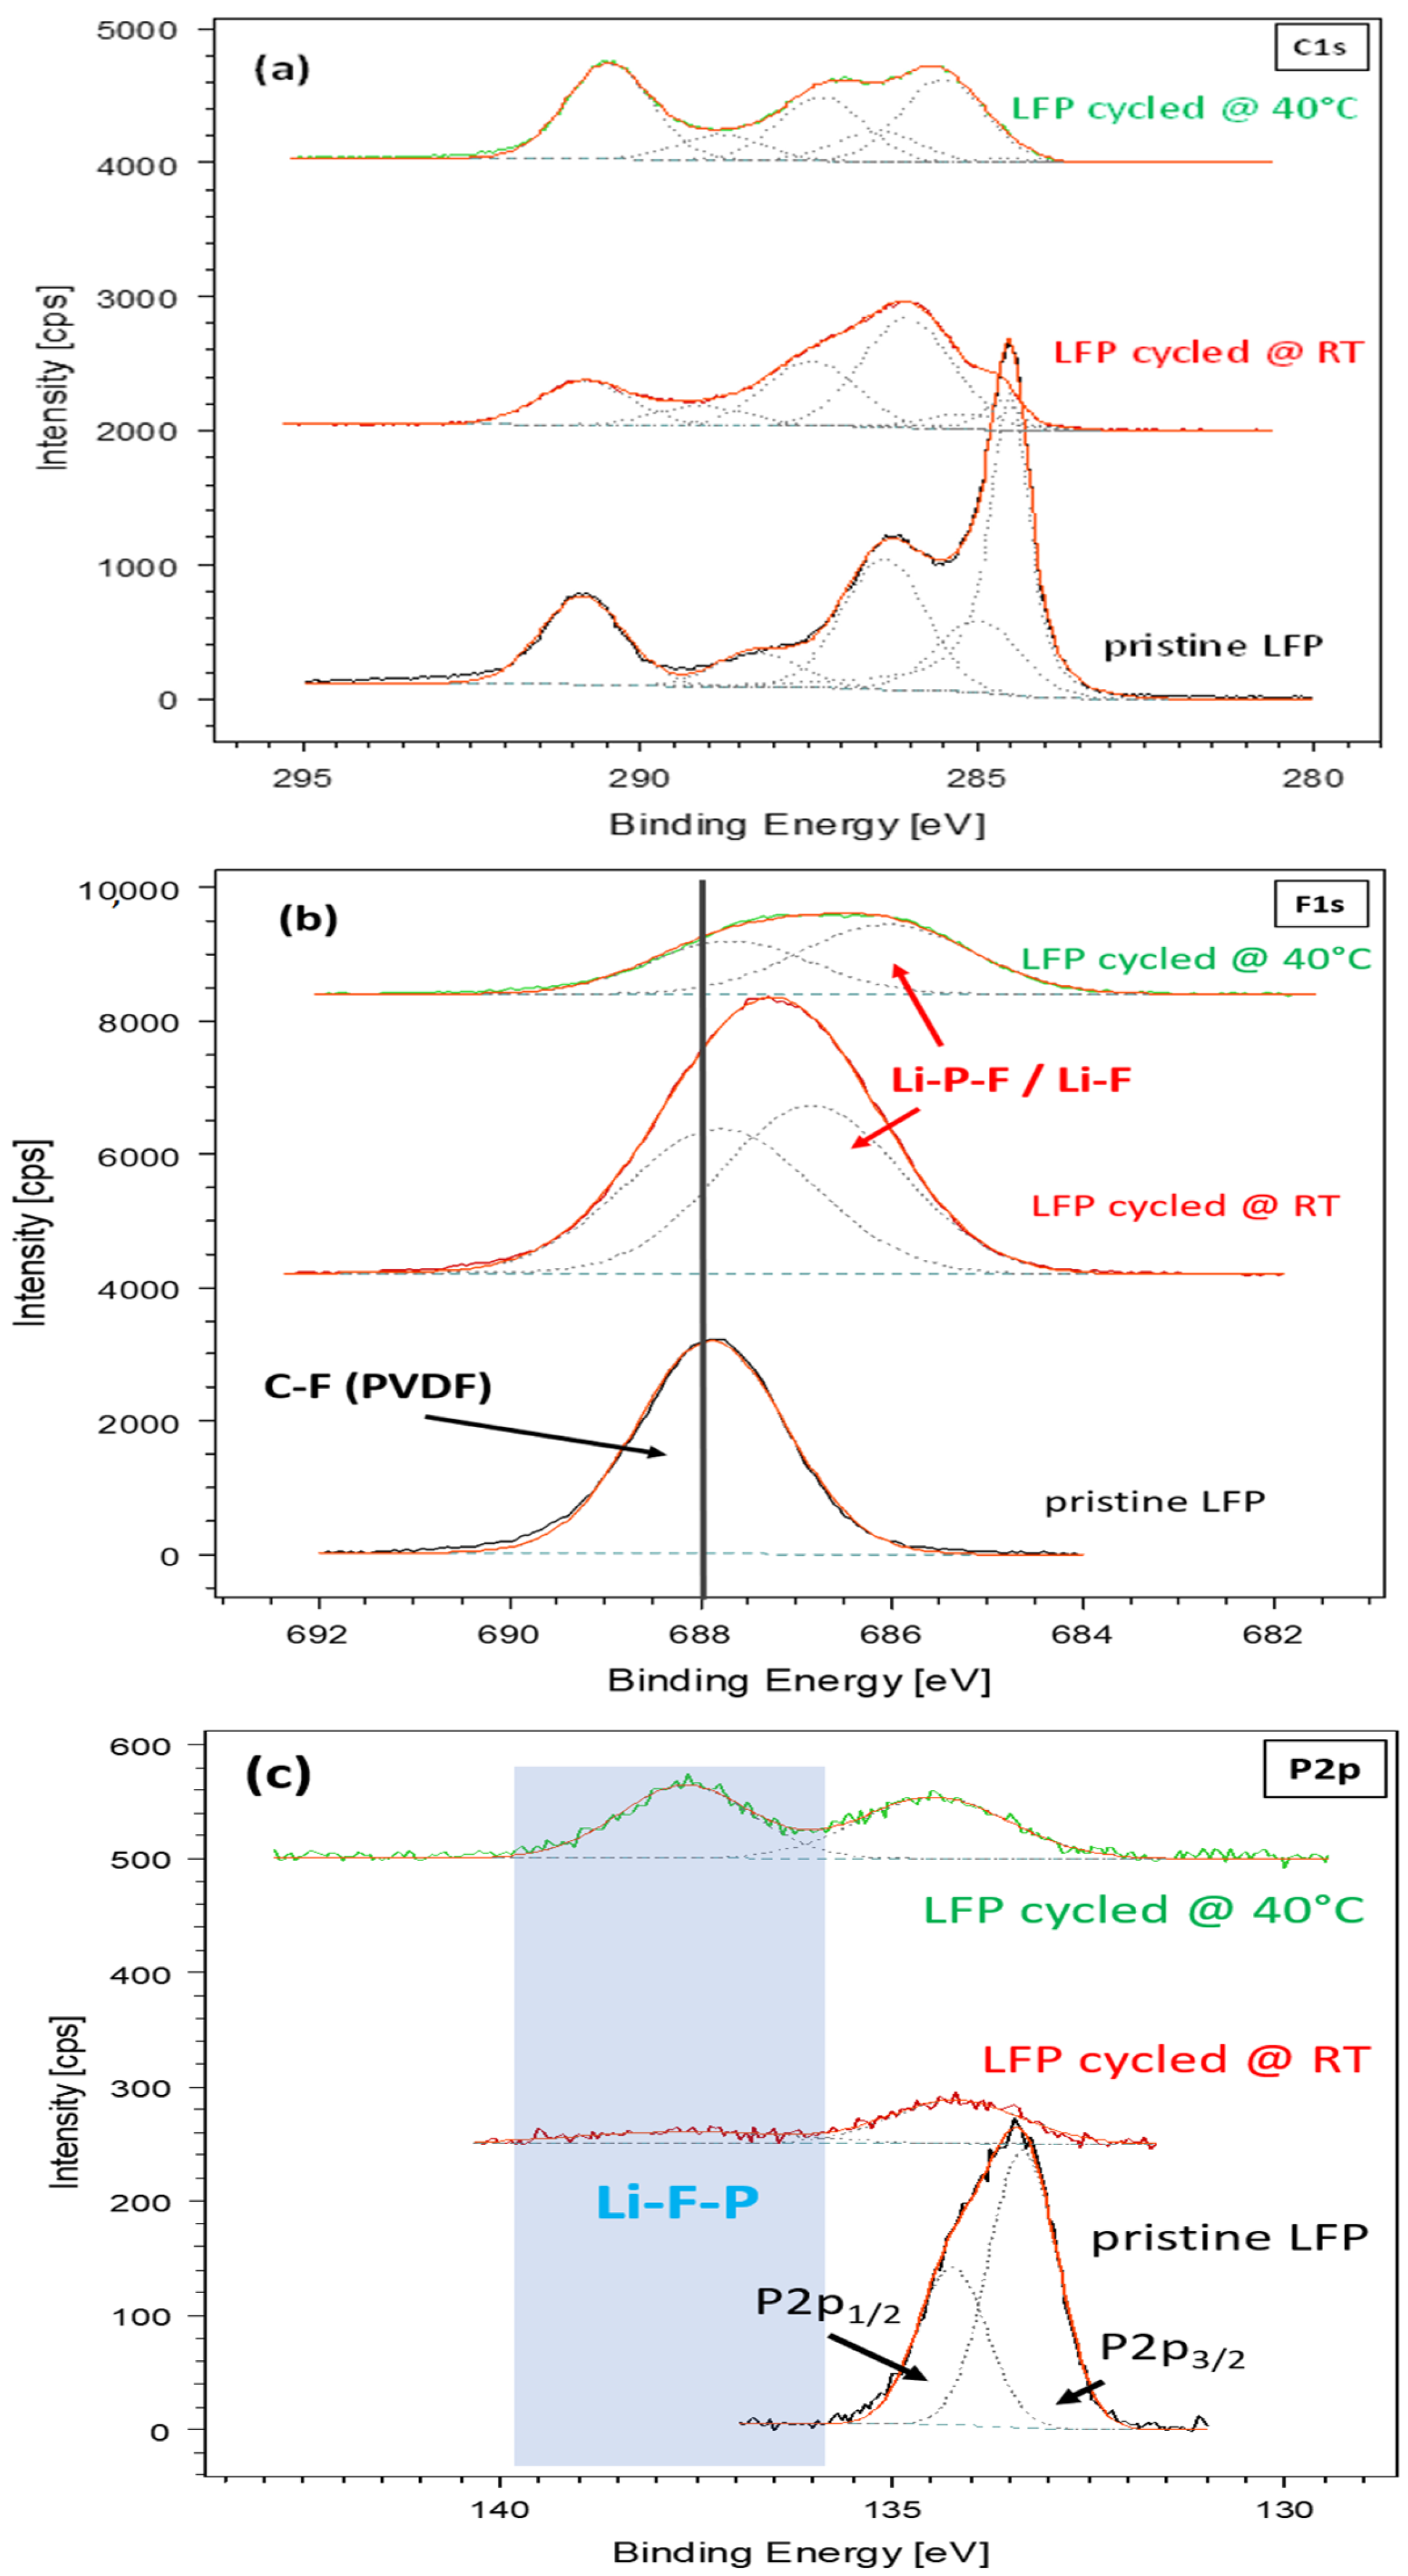
XPS analyses were conducted on selected LFP samples, both pristine and coated with 5 nm Al2O3 thin films by ALD, both before and after cycling at room temperature and at 40 °C. These analyses proved invaluable in exploring the surface’s chemical changes resulting from cycling and for elucidating the mechanisms influencing the varied performance of LFP cathodes coated with Al2O3 thin films compared to their pristine counterparts. In Figure 9, the C1s, F1s, and P2p core lines (panels a, b, and c, respectively) are displayed, acquired from the pristine LFP and the same samples post-cycling at room temperature and at 40 °C. A comparison, among the various samples, distinctly indicates a shift in the chemical composition of the cathode surface after cycling, as anticipated, attributable to the formation of a CEI. These chemical alterations likely stem from a combination of LFP degradation and side reactions within the electrolyte phase. Particularly in Figure 9a, the shape and deconvolution of the C1s core line suggest that signals related to carbon black and binder (PVDF), which constitute the fingerprint of the C1s peak on the pristine reference LFP, persist after cycling, albeit with a change in the ratio of their intensities. Conversely, all cycled samples exhibit an increase in the components associated with various oxidized carbon species (COx), notably C-O or C-OH bonds around 286–287 eV and O-C-O or C=O bonds around 288 eV, likely resulting from electrolyte oxidation. This cycling-induced effect becomes even more pronounced when examining the F1s and P2p core lines. In Figure 9b, the F1s component around 688 eV, originating from the C–F bonds in the PVDF binder within the LFP, remains in the same position pre- and post-cycling, but with reduced intensity, while a distinct shoulder emerges around 686 eV. Drawing from several published results [9,48,49,50], this shoulder band may be associated with Li-F bonds in LixPOy-1Fz+1 (F-rich fluorophosphates) or possibly LixPFy compounds deposited on the LFP, due to electrolyte/salt decomposition during charging. The origin and presence of such species are also confirmed in the P2p spectrum (Figure 9c). In the P2p spectrum acquired from the pristine LFP, the excellent signal-to-noise ratio facilitated the fitting of the peak with two components at 133.3 eV and 134.2 eV. The binding energy (BE) separation of 0.9 eV aligns with the spin orbit separation of P 2p3/2 and P 2p1/2 components of phosphorus P5+ in LiFePO4. Conversely, in the cycled samples, this peak is diminished in intensity, while a second peak, at a higher BE, emerges. The latter, falling around 137 eV, characterizes Li-F-P bonds in LixPOy-1Fz+1 and/or LixPFy compounds deposited on the cathode, once again indicating a side reaction in the electrolyte phase during cycling [9,48,50].
All the observed changes described above reasonably correlate with the formation of a CEI on the LFP surface. The presence of an Al2O3 coating can mitigate side reactions involving the electrolyte phase. In fact, analogous results were obtained by XPS analyses on samples coated with 5 nm Al2O3 after cycling. On the other hand, the electrochemical results obtained show that Al2O3 ALD-coated samples demonstrated better performance under cycling, indicating that alumina coatings may play a role in protecting LFP material from degradation processes induced by charging cycles. To investigate this point, we focused on the Fe 2p and Fe3p core lines, considering that Fe is the only element detectable on the LFP surface that could provide insights into the LFP structure, while all the others (Li, F, P, O, C) could originate from either the LFP or the electrolyte. It is important to note that the Fe signal suffers from overlapping with the bremsstrahlung loss tail of the F1s peak for the Fe2p core line and with the Li1s for the Fe3p core line. Nevertheless, a comparative study of the two XPS regions together can provide us with some important indications regarding the degradation or preservation of LFP in the absence or presence of a protective Al2O3 layer, respectively. The Fe2p core line of the pristine LFP (Figure 10a, black curve) exhibits two peaks at 710.2 eV and 723.9 eV corresponding to Fe2p3/2 and Fe2p1/2, respectively, indicating the Fe2+ oxidation state of Fe, as expected in LiFePO4 [9,49,50]. Additionally, two smaller peaks at higher binding energies (BEs) are present (near 715 eV and 726 eV), corresponding to satellite peaks typically arising in transition metal ions with partially filled d-orbitals. In contrast, the Fe2p spectrum of cycled LFP (Figure 10a, red and green curves) reveals an additional signal around 713 eV, attributed to a different oxidation state of iron, Fe3+ in particular. This finding suggests degradation of the pristine LFP cathode’s chemical structure, leading, with cycling, to the formation of inactive Fe3+-containing species (e.g., FeOOH, Fe2O3, or FeF3). Conversely, the presence of an alumina coating on the LFP cathode surface appears to preserve the electrode from degrading reactions. This can be inferred from the fact that only the signal from the 2+ oxidation state of iron is present in the corresponding Fe2p lines (blue and purple lines) acquired for the cycled alumina-coated LFP samples. A similar conclusion can be drawn by analyzing the Li1s/Fe3p region (Figure 10b). The broadband deconvolution in the spectrum acquired for the pristine LFP samples (black curve) reveals two main peaks around 54.5 eV, attributed to the Li1s signal, and around 55.7 eV, attributed to the Fe3p (Fe2+) signal from LiFePO4. A weak shoulder at higher BEs is also present, typically attributed to Fe3p (Fe3+) from the FePO4 species. Examining the charged LFP sample (red curve), a strong peak emerges after cycling at BEs higher than 58 eV, attributable to highly oxidized iron, such as Fe3p (Fe3+) in FeF3 compounds. Concurrently, the Li1s signal diminishes, while a peak centered around 55.7eV persists. In this case, its origin is not solely from the Fe3p (Fe2+) signal from LiFePO4, but is also from Li-F bonds, which, as discussed earlier, develop during cycling as side reactions involving the electrolyte. Similar components are observed in the spectrum acquired for the LFP sample cycled at high temperatures (green curve). Conversely, cycled LFP samples previously coated with 5 nm of Al2O3 (blue and purple curves) exhibit an Fe3p/Li1s band, where the signal from highly oxidized iron (Fe3+) is either absent or negligible. This finding aligns with our previous considerations regarding the mitigating effect of the alumina coating on the degradation of the chemical structure of LFP and the improved cycling performance demonstrated by the coated samples.

4. Conclusions

In this study, we investigated the effectiveness of protective coatings for the surface treatment of high-mass loading LiFePO4 electrodes to mitigate battery performance degradation. Coatings with thicknesses of 5 nm and 10 nm were explored using the atomic layer deposition technique, with a focus on the physical and chemical characterization of the electrode surface after cycling tests. Our findings, consistent with the existing literature, demonstrate that thin Al2O3 coatings are highly effective in reducing degradation and tend to improve specific capacity performance. Optimal thickness was observed at 5 nm, while a 10 nm protective coating exhibited moderate improvements against degradation, but with minimal enhancement in terms of the performance. Specifically, the 5 nm coating facilitated both good battery performance and a significant reduction in degradation. The characterization results indicate that the 5 nm Al2O3 coating does not adversely affect electrical conductivity and prevents the degradation of the pristine LFP cathode’s chemical structure. This degradation, if unchecked, could lead to the formation of inactive Fe3+-containing species (e.g., FeOOH, Fe2O3, or FeF3) during cycling. It is worth noting that further studies are warranted to identify the optimal thickness of the protective layers to prevent side reactions between the electrode and the electrolyte. This consideration is not limited to liquid-based electrolytes, but also holds promise for high-energy lithium-based solid-state technologies.

Supplementary Materials

The following supporting information can be downloaded at: https://www.mdpi.com/article/10.3390/batteries10090304/s1, Figure S1: FESEM-EDS analysis on 5 nm Al2O3 LFP electrode to find out the uniform distribution of the elements (Al-O); Figure S2: Galvanostatic charge and discharge in the voltage range of 2.5–4.2 V at 1C (1C = 170 mA gLFP−1) for Li/LFP cells without (a) and with 5 nm Al2O3 deposition (b), and (c) Differential capacity vs. voltage profile of the cells measured for the 100th cycle at 1; Figure S3: Galvanostatic discharge curve of the Li/LFP half-cell, employing a different discharge cut-off voltage after fully charging the cell; Figure S4: Bode plot of the cells with pristine and 5 nm Al2O3-coated LFP electrodes at DOD of 50%; Figure S5: An equivalent circuit model used to fit and analyze the EIS data; Figure S6: Lithium ions diffusion coefficient obtained from EIS spectra as function of the DoD for both pristine and coated LFP. Table S1: Numerical value of Resistance and capacitances obtained from the fitting of the EIS spectra at different states of lithiation for Pristine LFP electrode and 5 nm Al2O3-coated LFP electrode; Table S2: Lithium ions diffusion coefficient obtained from EIS spectra as function of the DoD for both pristine and coated LFP.

Author Contributions

P.S.: writing—review and editing, original draft, visualization, investigation, formal analysis, data curation, validation. G.G.: validation, methodology, investigation, formal analysis, review and editing, writing—original draft, data curation. W.G.M.: writing—review and editing, validation, methodology, investigation, formal analysis, data curation. R.B.: funding, validation, review and editing. N.L.: funding, validation, review. E.G.M.: validation, funding, review and editing. All authors have read and agreed to the published version of the manuscript.

Funding

This work is funded by the Italian Ministry of Enterprises and Made in Italy within the framework of the Important Project of Common European Interest (IPCEI) European Battery Innovation (project IPCEI Batterie 2-CUP: B62C22000010001). The IPCEI European Battery Innovation is also funded by public authorities from Austria, Belgium, Croatia, Finland, France, Germany, Greece, Poland, Slovakia, Spain, and Sweden.

Data Availability Statement

The datasets used and/or analyzed during this study are available from the corresponding author upon reasonable request.

Acknowledgments

The authors would like to acknowledge Andrea Pedrielli for FE-SEM/EDS analysis and Giorgio Speranza for the fruitful discussion about XPS data interpretation. This work is funded by the Italian Ministry of Enterprises and Made in Italy within the framework of the Important Project of Common European Interest (IPCEI) European Battery Innovation (project IPCEI Batterie 2-CUP: B62C22000010001). The IPCEI European Battery Innovation is also funded by public authorities from Austria, Belgium, Croatia, Finland, France, Germany, Greece, Poland, Slovakia, Spain, and Sweden.

Conflicts of Interest

The authors declare no conflict of interest.

References

  1. Xu, C.; Steubing, B.; Hu, M.; Harpprecht, C.; van der Meide, M.; Tukker, A. Future Greenhouse Gas Emissions of Automotive Lithium-Ion Battery Cell Production. Resour. Conserv. Recycl. 2022, 187, 106606. [Google Scholar] [CrossRef]
  2. Gonçalves, R.; Lanceros-Méndez, S.; Costa, C.M. Electrode Fabrication Process and Its Influence in Lithium-Ion Battery Performance: State of the Art and Future Trends. Electrochem. Commun. 2022, 135, 107210. [Google Scholar] [CrossRef]
  3. Lithium-Ion Battery Market to Exceed $120 Billion by 2028: Electric Vehicles and Renewable Energy Drive Global Expansion. Available online: https://finance.yahoo.com/news/lithium-ion-battery-market-exceed-121800187.html?guccounter=1&guce_referrer=aHR0cHM6Ly93d3cuZ29vZ2xlLmNvbS8&guce_referrer_sig=AQAAANlnQLaH5owzBNcTLsFa9nCpN610I1L0fIQV_Huuhev0AKDIiV_-R2GSUCG7S7rQALIiGC5mzs9U3VylcBQrvJ8medgdzentpdMCrTHstCfaSOuqh-BfrIibVxZY9ykQGw6MgAD4FZOuyiPY6tYz-QW15QFGSaCJxyjR_1Ji9kUA (accessed on 26 April 2024).
  4. Huang, Y. The Discovery of Cathode Materials for Lithium-Ion Batteries from the View of Interdisciplinarity. Interdiscip. Mater. 2022, 1, 323–329. [Google Scholar] [CrossRef]
  5. Stenina, I.; Minakova, P.; Kulova, T.; Yaroslavtsev, A. Electrochemical Properties of LiFePO4 Cathodes: The Effect of Carbon Additives. Batteries 2022, 8, 111. [Google Scholar] [CrossRef]
  6. Salimi, P.; Tieuli, S.; Taghavi, S.; Venezia, E.; Fugattini, S.; Lauciello, S.; Prato, M.; Marras, S.; Li, T.; Signoretto, M.; et al. Sustainable Lithium-Ion Batteries Based on Metals-Free Tannery Waste Biochar. Green Chem. 2022, 24, 4119–4129. [Google Scholar] [CrossRef]
  7. Parviz, Z.; Salimi, P.; Javadian, S.; Gharibi, H.; Morsali, A.; Bayat, E.; Leoncino, L.; Lauciello, S.; Zaccaria, R.P. Fabrication of Sustainable Hybrid MOF/Silica Electrodes for Current Lithium-Ion Batteries and Beyond. ACS Appl. Energy Mater. 2022, 5, 15155–15165. [Google Scholar] [CrossRef]
  8. Huang, X.; Chen, K.; Liu, Y. Interfacial Effect of Nano Al2O3 Modifying LiFePO4 to Improve Capacity Retention and Rate Capability of Lithium Ion Batteries. Mater. Res. Express 2018, 6, 015511. [Google Scholar] [CrossRef]
  9. Beletskii, E.V.; Alekseeva, E.V.; Spiridonova, D.V.; Yankin, A.N.; Levin, O.V. Overcharge Cycling Effect on the Surface Layers and Crystalline Structure of LiFePO4 Cathodes of Li-Ion Batteries. Energies 2019, 12, 4652. [Google Scholar] [CrossRef]
  10. Wang, L.; Qiu, J.; Wang, X.; Chen, L.; Cao, G.; Wang, J.; Zhang, H.; He, X. Insights for Understanding Multiscale Degradation of LiFePO4 Cathodes. eScience 2022, 2, 125–137. [Google Scholar] [CrossRef]
  11. Jiang, J.; Shi, W.; Zheng, J.; Zuo, P.; Xiao, J.; Chen, X.; Xu, W.; Zhang, J.-G. Optimized Operating Range for Large-Format LiFePO4/Graphite Batteries. J. Electrochem. Soc. 2014, 161, A336–A341. [Google Scholar] [CrossRef]
  12. David, L.A.; Dahlberg, K.; Mohanty, D.; Ruther, R.E.; Huq, A.; An, S.J.; Mao, C.; King, D.; Stevenson, L.; Wood, D.L. Unveiling the Role of Al2O3 in Preventing Surface Reconstruction During High-Voltage Cycling of Lithium-Ion. Batteries 2019, 2, 1308–1313. [Google Scholar] [CrossRef]
  13. Prakasha, K.R.; Sathish, M.; Bera, P.; Prakash, A.S. Mitigating the Surface Degradation and Voltage Decay of Li1.2Ni0.13Mn0.54Co0.13O2 Cathode Material through Surface Modification Using Li2ZrO3. ACS Omega 2017, 2, 2308–2316. [Google Scholar] [CrossRef] [PubMed]
  14. Dai, X.; Wang, L.; Xu, J.; Wang, Y.; Zhou, A.; Li, J. Improved Electrochemical Performance of LiCoO2 Electrodes with ZnO Coating by Radio Frequency Magnetron Sputtering. ACS Appl. Mater. Interfaces 2014, 6, 15853–15859. [Google Scholar] [CrossRef] [PubMed]
  15. Etinger-Geller, Y.; Polishchuk, I.; Seknazi, E.; Livne, A.; Ciatto, G.; Pokroy, B. Surface Reconstruction Causes Structural Variations in Nanometric Amorphous Al2O3. Phys. Chem. Chem. Phys. 2019, 21, 14887–14891. [Google Scholar] [CrossRef]
  16. Yoo, J.E.; Zazpe, R.; Cha, G.; Prikryl, J.; Hwang, I.; Macak, J.M.; Schmuki, P. Uniform ALD Deposition of Pt Nanoparticles within 1D Anodic TiO2 Nanotubes for Photocatalytic H2 Generation. Electrochem. Commun. 2018, 86, 6–11. [Google Scholar] [CrossRef]
  17. Yasmeen, S.; Ryu, S.W.; Lee, S.H.; Lee, H.B.R. Atomic Layer Deposition Beyond Thin Film Deposition Technology. Adv. Mater. Technol. 2023, 8, 202200876. [Google Scholar] [CrossRef]
  18. Pan, H.; Zhou, L.; Zheng, W.; Liu, X.; Zhang, J.; Pinna, N. Atomic Layer Deposition to Heterostructures for Application in Gas Sensors. Int. J. Extrem. Manuf. 2023, 5, 022008. [Google Scholar] [CrossRef]
  19. Ansari, M.Z.; Hussain, I.; Mohapatra, D.; Ansari, S.A.; Rahighi, R.; Nandi, D.K.; Song, W.; Kim, S.H. Atomic Layer Deposition—A Versatile Toolbox for Designing/Engineering Electrodes for Advanced Supercapacitors. Adv. Sci. 2023, 11, e202303055. [Google Scholar] [CrossRef]
  20. George, S.M. Atomic Layer Deposition: An Overview. Chem. Rev. 2010, 110, 111–131. [Google Scholar] [CrossRef]
  21. Cao, Y.Q.; Wang, S.S.; Liu, C.; Wu, D.; Li, A.D. Atomic Layer Deposition of ZnO/TiO2 Nanolaminates as Ultra-Long Life Anode Material for Lithium-Ion Batteries. Sci. Rep. 2019, 9, 1–9. [Google Scholar] [CrossRef]
  22. Mohanty, D.; Dahlberg, K.; King, D.M.; David, L.A.; Sefat, A.S.; Wood, D.L.; Daniel, C.; Dhar, S.; Mahajan, V.; Lee, M.; et al. Modification of Ni-Rich FCG NMC and NCA Cathodes by Atomic Layer Deposition: Preventing Surface Phase Transitions for High-Voltage Lithium-Ion Batteries. Sci. Rep. 2016, 6, 26532. [Google Scholar] [CrossRef]
  23. Kazyak, E.; Chen, K.H.; Wood, K.N.; Davis, A.L.; Thompson, T.; Bielinski, A.R.; Sanchez, A.J.; Wang, X.; Wang, C.; Sakamoto, J.; et al. Atomic Layer Deposition of the Solid Electrolyte Garnet Li7La3Zr2O12. Chem. Mater. 2017, 29, 3785–3792. [Google Scholar] [CrossRef]
  24. Han, B.; Key, B.; Lipton, A.S.; Vaughey, J.T.; Trevey, J.; Dogan, F.; Hughes, B. Influence of Coating Protocols on Alumina-Coated Cathode Material: Atomic Layer Deposition versus Wet-Chemical Coating. J. Electrochem. Soc. 2019, 166, A3679–A3684. [Google Scholar] [CrossRef]
  25. Jung, Y.S.; Cavanagh, A.S.; Dillon, A.C.; Groner, M.D.; George, S.M.; Lee, S.-H. Enhanced Stability of LiCoO2 Cathodes in Lithium-Ion Batteries Using Surface Modification by Atomic Layer Deposition. J. Electrochem. Soc. 2010, 157, A75. [Google Scholar] [CrossRef]
  26. Shi, C.; Hamann, T.; Takeuchi, S.; Alexander, G.V.; Nolan, A.M.; Limpert, M.; Fu, Z.; O’Neill, J.; Godbey, G.; Dura, J.A.; et al. 3D Asymmetric Bilayer Garnet-Hybridized High-Energy-Density Lithium−Sulfur Batteries. ACS Appl. Mater. Interfaces 2023, 15, 751–760. [Google Scholar] [CrossRef] [PubMed]
  27. Koshtyal, Y.; Olkhovskii, D.; Rumyantsev, A.; Maximov, M. Applications and Advantages of Atomic Layer Deposition for Lithium-Ion Batteries Cathodes: Review. Batter. 2022, 8, 184. [Google Scholar] [CrossRef]
  28. Sahoo, P.P.; Güneren, A.; Hudec, B.; Mičušík, M.; Lenčéš, Z.; Siffalovic, P.; Frohlich, K. Improved Properties of Li-Ion Battery Electrodes Protected By Al2O3 and ZnO Ultrathin Layers Prepared By Atomic Layer Deposition. ECS Meet. Abstr. 2022, MA2022-02, 1136. [Google Scholar] [CrossRef]
  29. Li, X.; Liu, J.; Banis, M.N.; Lushington, A.; Li, R.; Cai, M.; Sun, X. Atomic Layer Deposition of Solid-State Electrolyte Coated Cathode Materials with Superior High-Voltage Cycling Behavior for Lithium Ion Battery Application. Energy Environ. Sci. 2014, 7, 768–778. [Google Scholar] [CrossRef]
  30. Jung, Y.S.; Cavanagh, A.S.; Riley, L.A.; Kang, S.H.; Dillon, A.C.; Groner, M.D.; George, S.M.; Lee, S.H. Ultrathin Direct Atomic Layer Deposition on Composite Electrodes for Highly Durable and Safe Li-Ion Batteries. Adv. Mater. 2010, 22, 2172–2176. [Google Scholar] [CrossRef] [PubMed]
  31. Khotimah, C.; Cheng, H.M.; Wang, F.M. Enhanced Cyclability of Lithium-Ion Batteries Resulting from Atomic Layer Deposition of Al2O3 on LiFePO4 Electrodes. J. Solid State Electrochem. 2024. [Google Scholar] [CrossRef]
  32. Hu, C.; Geng, M.; Yang, H.; Fan, M.; Sun, Z.; Yu, R.; Wei, B. A Review of Capacity Fade Mechanism and Promotion Strategies for Lithium Iron Phosphate Batteries. Coatings 2024, 14, 832. [Google Scholar] [CrossRef]
  33. Speranza, G.; Canteri, R. RxpsG a New Open Project for Photoelectron and Electron Spectroscopy Data Processing. SoftwareX 2019, 10, 100282. [Google Scholar] [CrossRef]
  34. Moulder, J.; Stickle, W.; Sobol, W.; Bomben, K.D. Handbook of X-Ray Photoelectron Spectroscopy. Perkin-Elmer Corp. 1992, 40, 221. [Google Scholar]
  35. Beamson, G.; Briggs, D. High Resolution Monochromated X-Ray Photoelectron Spectroscopy of Organic Polymers: A Comparison between Solid State Data for Organic Polymers and Gas Phase Data for Small Molecules. Mol. Phys. 1992, 76, 919–936. [Google Scholar] [CrossRef]
  36. Evshchik, E.Y.; Sanginov, E.A.; Kayumov, R.R.; Zhuravlev, V.D.; Bushkova, O.V.; Dobrovolsky, Y.A. Li4Ti5O12/LiFePO4 Solid-State Lithium-Ion Full Cell with LithiatedNafion Membrane. Int. J. Electrochem. Sci. 2020, 15, 2216–2225. [Google Scholar] [CrossRef]
  37. Buqa, H.; Goers, D.; Holzapfel, M.; Spahr, M.E.; Novák, P. High Rate Capability of Graphite Negative Electrodes for Lithium-Ion Batteries. J. Electrochem. Soc. 2005, 152, A474. [Google Scholar] [CrossRef]
  38. Dokko, K.; Nakata, N.; Kanamura, K. High Rate Discharge Capability of Single Particle Electrode of LiCoO2. J. Power Sources 2009, 189, 783–785. [Google Scholar] [CrossRef]
  39. Yuan, L.X.; Wang, Z.H.; Zhang, W.X.; Hu, X.L.; Chen, J.T.; Huang, Y.H.; Goodenough, J.B. Development and Challenges of LiFePO4 Cathode Material for Lithium-Ion Batteries. Energy Environ. Sci. 2011, 4, 269–284. [Google Scholar] [CrossRef]
  40. Peled, E.; Menkin, S. Review—SEI: Past, Present and Future. J. Electrochem. Soc. 2017, 164, A1703–A1719. [Google Scholar] [CrossRef]
  41. Barsoukov, E.; Macdonald, J.R. (Eds.) Impedance Spectroscopy; John Wiley & Sons: Hoboken, NJ, USA, 2018. [Google Scholar] [CrossRef]
  42. Brug, G.J.; van den Eeden, A.L.G.; Sluyters-Rehbach, M.; Sluyters, J.H. The Analysis of Electrode Impedances Complicated by the Presence of a Constant Phase Element. J. Electroanal. Chem. Interfacial Electrochem. 1984, 176, 275–295. [Google Scholar] [CrossRef]
  43. Bal, B.; Ozdogru, B.; Nguyen, D.T.; Li, Z.; Murugesan, V.; Çapraz, Ö.Ö. Probing the Formation of Cathode-Electrolyte Interphase on Lithium Iron Phosphate Cathodes via Operando Mechanical Measurements. ACS Appl. Mater. Interfaces 2023, 15, 42449–42459. [Google Scholar] [CrossRef] [PubMed]
  44. Gao, C.; Zhou, J.; Liu, G.; Wang, L. Lithium-Ions Diffusion Kinetic in LiFePO4/Carbon Nanoparticles Synthesized by Microwave Plasma Chemical Vapor Deposition for Lithium-Ion Batteries. Appl. Surf. Sci. 2018, 433, 35–44. [Google Scholar] [CrossRef]
  45. Wang, J.; Koenig, G.M. Comparison of Lithium Diffusion Coefficient Measurements in Tellurium Electrodes via Different Electrochemical Techniques. J. Electrochem. Soc. 2023, 170, 050534. [Google Scholar] [CrossRef]
  46. Ho, C.; Raistrick, I.D.; Huggins, R.A. Application of A-C Techniques to the Study of Lithium Diffusion in Tungsten Trioxide Thin Films. J. Electrochem. Soc. 1980, 127, 343–350. [Google Scholar] [CrossRef]
  47. Ahsan, Z.; Ding, B.; Cai, Z.; Wen, C.; Yang, W.; Ma, Y.; Zhang, S. Recent Progress in Capacity Enhancement of LiFePO4cathode for Li-Ion Batteries. J. Electrochem. Energy Convers. Storage 2021, 18, 010801. [Google Scholar] [CrossRef]
  48. Baboo, J.P.; Yatoo, M.A.; Dent, M.; Hojaji Najafabadi, E.; Lekakou, C.; Slade, R.; Hinder, S.J.; Watts, J.F. Exploring Different Binders for a LiFePO4 Battery, Battery Testing, Modeling and Simulations. Energies 2022, 15, 2332. [Google Scholar] [CrossRef]
  49. Kroff, M.; Hevia, S.A.; O’Shea, J.N.; de Muro, I.G.; Palomares, V.; Rojo, T.; del Río, R. Lithium Iron Phosphate/Carbon (LFP/C) Composite Using Nanocellulose as a Reducing Agent and Carbon Source. Polymers 2023, 15, 2628. [Google Scholar] [CrossRef]
  50. Lee, H.; Lim, H.S.; Ren, X.; Yu, L.; Engelhard, M.H.; Han, K.S.; Lee, J.; Kim, H.T.; Xiao, J.; Liu, J.; et al. Detrimental Effects of Chemical Crossover from the Lithium Anode to Cathode in Rechargeable Lithium Metal Batteries. ACS Energy Lett. 2018, 3, 2921–2930. [Google Scholar] [CrossRef]
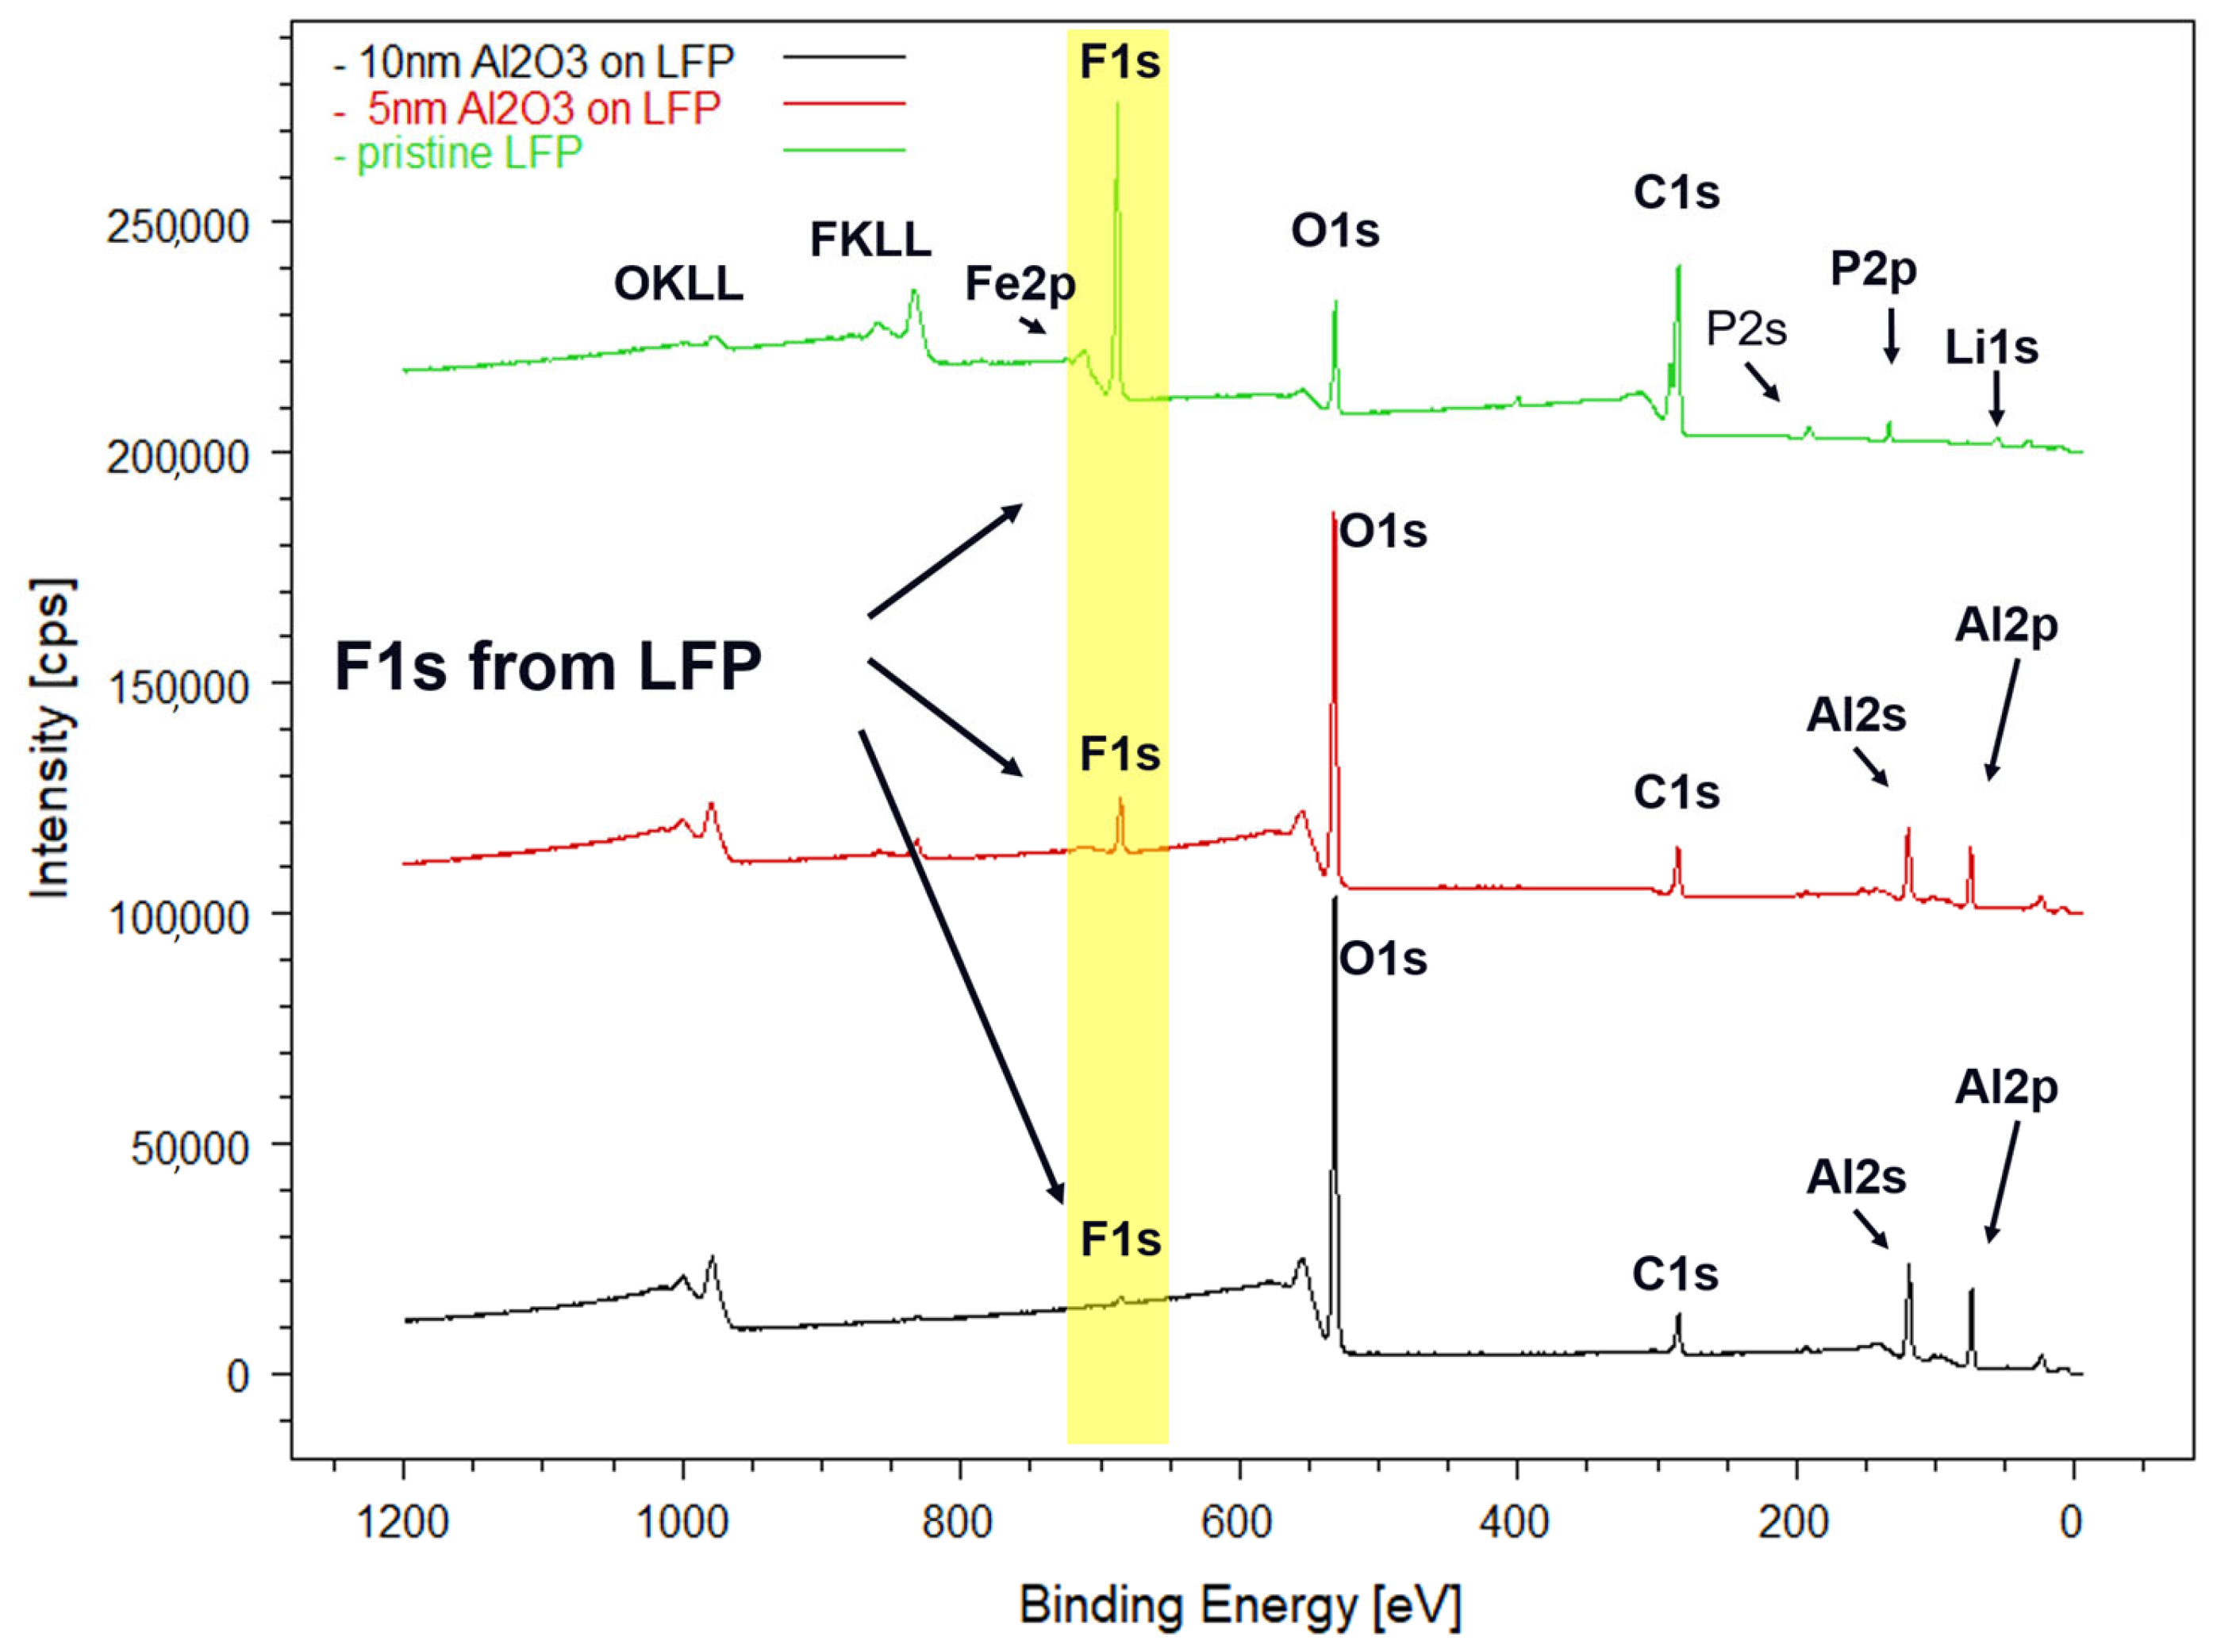
Figure 1. XPS survey spectra of the pristine LFP (green curve), LFP coated with 5 nm Al2O3 (red curve), and LFP coated with 10 nm Al2O3 (black curve). The main core levels are labeled.
Batteries 10 00304 g001
Figure 2. XPS core-level spectra of (a) C1s, (b) F1s, (c) Al2p, and (d) O1s, acquired on the pristine LFP (green curve), LFP coated with 5 nm Al2O3 (red curve), and LFP coated with 10 nm Al2O3 (black curve). The main core-level components are labeled.
Batteries 10 00304 g002
Figure 3. (a) Cycling performance of Li/LFP cells with and without Al2O3 deposition, in the range of 2.5–4.2 V at 1C (1C = 170 mA gLFP−1) and RT. The test was performed after 10 cycles at 0.1C. (b) Top-view FE-SEM images of the electrodes in the fresh state and 100 cycles at 1C.
Batteries 10 00304 g003
Figure 4. The performance of the pristine and 5 nm and 10 nm Al2O3-coated LFP electrodes at different C rates. The test was conducted at RT and within a voltage range of 2.5–4.2 V.
Batteries 10 00304 g004
Figure 5. A comparison of the cyclic performance of pristine and coated LFP electrodes at 1C and RT, within the voltage range of 2.5–4.5 V. The test was performed after 10 cycles at 0.1C, within the voltage range of 2.5 to 4.2 V.
Batteries 10 00304 g005
Figure 6. Nyquist plots and fitting lines for the EIS spectra at different states of lithiation for the pristine LFP electrode (a) and 5 nm Al2O3-coated LFP electrodes (b) are shown. The discharge was performed at 0.1C after 100 cycles at room temperature.
Batteries 10 00304 g006
Figure 7. Resistance and capacitance obtained from fitting the EIS spectra at different states of lithiation for the pristine LFP electrode (a) and 5 nm Al2O3-coated LFP electrode (b).
Batteries 10 00304 g007
Figure 8. (a) Cycling performance of Li/LFP cells with and without Al2O3 deposition, within the voltage range of 2.5–4.2 V at 0.5 C (1C = 170 mA gLFP−1) and 40 °C. The test was performed after 10 cycles at 0.1C. (b) Galvanostatic charge and discharge in the same conditions and (c) top-view FE-SEM images of the electrodes in the fresh state and after 100 cycles at 1C.
Batteries 10 00304 g008
Figure 9. XPS core-level spectra of (a) C1s, (b) F1s, and (c) P2p, acquired for the pristine LFP (black curve), the LFP cycled at room temperature (red curve), and the LFP cycled at 40 °C (green curve). The main core-level components are labeled.
Batteries 10 00304 g009
Figure 10. XPS core-level spectra of (a) Fe2p and (b) Fe3p/Li1s acquired for the pristine LFP (black curve), the LFP cycled at room temperature (red curve), the LFP cycled at 40 °C (green curve), LFP coated with 5 nm Al2O3 cycled at room temperature (blue curve), and the LFP coated with 5nm Al2O3 cycled at 40 °C (purple curve). The main core-level components are labeled.
Batteries 10 00304 g010
Disclaimer/Publisher’s Note: The statements, opinions and data contained in all publications are solely those of the individual author(s) and contributor(s) and not of MDPI and/or the editor(s). MDPI and/or the editor(s) disclaim responsibility for any injury to people or property resulting from any ideas, methods, instructions or products referred to in the content.