Article

Characterization and Magnetic Properties of Sintered Glass-Ceramics from Dispersed Fly Ash Microspheres

by
Elena V. Fomenko
1,*,
Galina V. Akimochkina
1,
Yuriy V. Knyazev
2,
Sergey V. Semenov
2,3,
Vladimir V. Yumashev
1,4,
Leonid A. Solovyov
1 and
Alexander G. Anshits
1,5
1
Institute of Chemistry and Chemical Technology, Federal Research Center “Krasnoyarsk Science Center of the Siberian Branch of the Russian Academy of Sciences”, Akademgorodok 50/24, 660036 Krasnoyarsk, Russia
2
Kirensky Institute of Physics, Federal Research Center “Krasnoyarsk Science Center of the Siberian Branch of the Russian Academy of Sciences”, Akademgorodok 50/24, 660036 Krasnoyarsk, Russia
3
Institute of Engineering Physics and Radioelectronics, Siberian Federal University, 79 Svobodny Av., 660041 Krasnoyarsk, Russia
4
Laboratory of Electron Microscopy, Siberian Federal University, 79 Svobodny Av., 660041 Krasnoyarsk, Russia
5
Department of Chemistry, Siberian Federal University, Svobodny Av. 79, 660041 Krasnoyarsk, Russia
*
Author to whom correspondence should be addressed.
Magnetochemistry 2023, 9(7), 177; https://doi.org/10.3390/magnetochemistry9070177
Submission received: 30 May 2023 / Revised: 3 July 2023 / Accepted: 7 July 2023 / Published: 9 July 2023
(This article belongs to the Section Magnetic Materials)

Abstract

:
The recycling of hazardous industrial waste into high-tech materials with desired properties is of considerable interest since it provides optimal alternatives for its final disposal. Coal fly ash, the major waste generated by coal-fired power plants, contains significant quantities of dispersed microspheres with a diameter smaller than 10 μm, which are anthropogenic atmospheric pollutants PM10. Due to their composition and fine-grained powder morphology, they can be converted into sintered products. In this study, dispersed microspheres from class C fly ash were directly sintered without any additive to form high-strength glass-ceramics with magnetic properties. The optimum processing conditions were achieved at a temperature of 1200 °C, at which samples with a compressive strength of 100.6 MPa were obtained. Sintering reduces the quantity of the glass phase and promotes the formation of larnite, Fe-spinel, ye’elimite, and ternesite. Mössbauer measurements show that the relative concentration of the magnetic phase compared to the paramagnetic one rises almost in order. The sintered sample demonstrates a narrower distribution of the hyperfine magnetic field and a significantly lower value of the coercive field of 25 Oe, which allows proposing such materials as soft magnetic materials. The presented results demonstrate promising industrial applications of hazardous PM10 to minimize solid waste pollution.

1. Introduction

Currently, coal-fired power plants provide 37% of the world’s electricity. According to the International Energy Agency, coal will remain the largest source of global electricity, producing at least 22% until 2040 [1]. The main waste from coal combustion is fly ash (CFA), which is recognized as a hazardous environmental pollutant that requires disposal, but the production of CFA actually exceeds the real consumption. Specifically, about 750 million tons of CFA are produced annually [2], while its total utilization rate in the world is only 25% [3].
Serious problems in the specification and subsequent utilization of CFAs are associated with the variability of their granulometric, chemical, and mineral-phase compositions, depending on the type of coal and combustion conditions. Therefore, on the industrial scale, CFA is considered to be a raw material with unstable properties of a low technological level. The traditional fields of the CFA application are the cement and concrete industry, road construction, soil amelioration, and mine reclamation [2,4,5,6]. The ASTM C618 specification standard declares the suitability of a CFA source for use in concrete, subdividing all ashes into two classes based on the chemical composition [7]. Class F fly ash is typically produced from the combustion of anthracite or bituminous coal, with the total content of SiO2, Al2O3, and Fe2O3 being higher than 70%; this class of fly ash has pozzolanic properties. Class C fly ash is produced from lignite or sub-bituminous coal burning, with the total of SiO2, Al2O3, and Fe2O3 being at least 50%; this class of fly ash, in addition to its pozzolanic properties, also has some cementitious properties. Class C has the total calcium content, expressed as CaO, which is higher than in class F.
The most valuable information for identifying the potential application of CFA and environmental concerns associated with CFAs is provided by the classification system based on their origin, phase-mineral and chemical composition, properties, and behavior [8]. CFAs containing a large amount of CaO, SiO2, Al2O3, and glass phase, having fine-grained powder morphology, can be a good raw material for manufacturing cost-effective sintered products, such as glass and ceramics [9,10,11,12], light-weight aggregates [4,13,14], and filtration membranes [15,16], as well as building ceramic [17] and ceramic mixtures [18], cementitious composites [19], geopolymer [20,21,22], etc. From both an economic and an environmental viewpoint, the production of sintered materials only from CFA without the addition of natural raw materials, nucleating agents, various waste and organic binders is of particular interest [10,23,24,25,26,27,28].
Glass-ceramics are fine-grained polycrystalline materials formed in suitable compositions by controlled partial crystallization. DeGuire and Risbod [23] were among the first to study the preparation, crystallization, and properties of glasses obtained by melting and quenching CFA without any additives. Class F ash was melted at a temperature of 1500 °C to obtain the parent glass, followed by recrystallization studies. The highest degree of crystallization, ~23 vol %, was found in the samples heat-treated at 1150 °C for 4 h; ferroaugite and potassium melilite crystalline phases were identified.
Erol et al. [10] obtained glass, glass ceramics, and ceramic material by melting CFA (class F, dav = 91 µm) at 1500 °C followed by annealing at 600, 1150, and 1125–1200 °C, respectively. The crystalline phase-augite was detected in the glass-ceramic sample, while enstatite and mullite phases were found in the ceramic samples. The microstructural, physical, chemical, and mechanical properties of the obtained glass-ceramic samples are better than those of the glass and ceramic samples. It is noted that the physical and mechanical properties of the manufactured materials are consistent with the literature values for commercial products obtained from non-waste sources.
Glass-ceramics were fabricated by controlled crystallization of glass vitrified from class C CFA with d40 = 63 µm [24]. The processing route included melting, quenching, crushing and milling, sieving, pressing, and sintering. Glass was obtained by melting fly ash at 1450–1500 °C; the sintering temperatures varied from 800 to 1100 °C. The ratio of the crystalline and amorphous phases was 68/32, and the major crystalline phases were anorthite and hematite.
As compared with the widely used techniques of glass-ceramics preparation, including melting raw materials at a high temperature (about 1500 °C) to obtain the parent glass [10,23,24], direct sintering using a relatively low processing temperature is a way to avoid high energy consumption; this is typical for the mass production of conventional ceramic materials and reduces the production costs. Acar and Atalay [25] obtained glass-ceramics from class F fly ash samples with dav 23 and 40 µm by direct sintering in the temperature range of 1000–1150 °C. The best microcrystalline structures, high density and splitting tensile strength, low porosity, and water absorption values were observed at a smaller particle size and maximum sintering temperature.
The effect of the particle size of CFA on the properties of sintered glass-ceramics was studied in [26]. The glass-ceramics were successfully produced from class F fly ash by direct sintering at 1000–1200 °C. As compared with an ash sample with d50 = 12.6 μm, the sintered glass-ceramics from the ash sample with d50 7.5 and 4.9 μm had higher bulk density and flexural strength and lower water absorption values.
In [27], class C fly ash with an average particle size of 82 μm, derived from lignite combustion, was milled to an average particle size of 5.6 µm, compacted, and sintered at temperatures between 1130 and 1190 °C to form monolithic ceramic materials with low porosity. Sintering reduces the amount of glass, quartz, gehlenite, and anhydrite, but enhances the formation of anorthite, mullite, hematite, and cristobalite.
The particle size of the initial raw material is a key technological variable in ceramic production, which determines, along with the composition, the microstructure and properties of the resulting sintered materials. Depending on the type and conditions of coal combustion, ash contains up to 40% of dispersed particles < 10 μm in size [28], which are anthropogenic atmospheric pollutants, namely, particulate matter PM10, including highly hazardous aerosol particles PM2.5. A significant reduction in the volume of environmentally hazardous dispersed ash waste becomes possible due to the involvement of microspheres < 10 μm in size in the processing, with an additional advantage being the perspective of eliminating the energy-consuming grinding stage.
In the Krasnoyarsk Region (Russian Federation), where one of the world’s largest coal basins, namely, the Kansk-Achinsk basin, is located, particulate matter is among the major pollutants of the region, and the coal-fired power plants are included in the list of the main sources of the PM emissions into the environment [29]. Fly ash from pulverized combustion of lignite from the Kansk-Achinsk basin is classified as class C fly ash [7] and has a wide potential for large-scale production of building materials: bricks [30], ceramic tiles [17,31,32], wall ceramics [33], and geopolymer [20,21,22]. There is no information in the literature on the preparation of magnetic ceramics from dispersed fly ash microspheres.
In this context, the present study is focused on obtaining glass-ceramic materials based on dispersed microspheres from lignite fly ash without any additives by direct sintering and determining their characteristics that are generally used in the ceramic industry and magnetic properties. The conducted studies demonstrate that class C fly ashes can successfully be used not only in traditional cement and building materials production but also to obtain sintered glass-ceramics with better microcrystalline structure, high density and strength, low porosity, and water absorption, containing a large amount of magnetic phase.

2. Materials and Methods

2.1. Materials

A narrow fraction of dispersed microspheres was used as a raw material for sintering glass-ceramics. The target fraction was isolated by aerodynamic classification implemented on a centrifugal laboratory classifier 50 ATP (Hosokawa ALPINE, Augsburg, Germany) from the class C fly ash produced during pulverized combustion of lignite from the Kansk-Achinsk coal basin. The classifier scheme and the principle of its operation are described in detail in [34]; the physicochemical characteristics of fly ash and the technological scheme for extracting fine narrow fractions were reported in [35,36]. As a result, a fraction of dispersed microspheres with narrow particle size distribution was isolated: d10 = 0.6 μm, d50 = 1.5 μm, d90 = 3.8 μm, and d99 = 6.6 μm; the average microsphere diameter was dav = 1.9 μm. The chemical and phase compositions of the fine narrow fraction are summarized in Table 1, and the SEM images are shown in Figure 1.

2.2. Characterization Methods

The fine narrow fraction was characterized by the following parameters: bulk density, particle size distribution, average globule diameter, chemical and phase composition, composition of individual microspheres, hyperfine field (isomer chemical shift from αFe, quadrupole splitting, the spectral line width at half-height, hyperfine magnetic field, and the relative population), and magnetic characteristics (coercivity, remanence, and saturation magnetization).
The bulk density was measured on an automated Autotap density analyzer (Quantachrome Instruments, Boynton Beach, FL, USA), and the particle size distribution was measured on a MicroTec 22 laser particle sizer (Fritsch, GmbH, Idar-Oberstein, Germany). The chemical composition, including the content of silicon, aluminum, iron, calcium, magnesium, and potassium oxides, was determined by the methods of chemical analysis [37].
The phase composition of the fine narrow fraction was determined using the quantitative X-ray powder diffraction analysis with the full-profile Rietveld method and the derivative difference minimization according to the procedure [38]. The X-ray diffraction data were obtained on an X’Pert Pro MPD powder diffractometer (PANalytical, Almelo, The Netherlands) with a PIXcel solid-state detector. The weight percent of the X-ray amorphous component was determined by the external standard method, with corundum used as the standard. The absorption coefficients of the samples were calculated from the total elemental composition, according to the chemical analysis data.
The composition of single microspheres located in the fine narrow fraction was studied by SEM-EDS using a TM-3000 scanning electron microscope (High Technologies Corporation, Hitachi, Japan) equipped with a Quantax 70 microanalysis system with a Bruker XFlash 430H energy dispersive X-ray spectrometer (EDS) at a magnification of ×10,000 and an accelerating voltage of 15   kV . The powder samples were applied to a double-coated conductive carbon adhesive tape (Ted Pella Inc., Altadena, CA, USA) attached to a flat substrate (1–3 mm thick, 30 mm in diameter) fabricated from Duopur poly(methylmethacrylate) resin (Adler, Schwaz, Austria). The data acquisition time was at least 10 min, which enabled quantitative processing of the spectra. For each analyzed globule, the gross composition, including the elemental content of Ca, Si, Al, Fe, Mg, S, Na, K, Ti, Mn, P, and Ba, was determined. The elemental composition was converted to oxides and normalized to 100%.
Mössbauer spectra were measured using a standard MS1104Em spectrometer in the constant acceleration mode with a 1024-channel detector. A mobile source of 57Co(Rh) gamma-ray photons was at room temperature. Experimental samples were fixed in a polymer iron-free holder so that the sample was perpendicular to the direction of propagation of gamma rays. Interpretation of the spectra was performed in two stages. In the first stage, we determined the probability distribution of quadrupole splitting P(QS) in the spectrum. Such a calculation provides possible nonequivalent iron positions in the samples.
To perform the P(QS) and P(H) calculations, the experimental spectrum was fulfilled by a set of doublets and sextets with Lorentzian line and variable linewidth and with the step of Δ = 0.02 mm/s and Δ = 1.3 kOe for QS and H, respectively. Then, the isomer shift and intensity of spectral lines were varied. As a result, we obtained the set of intensities corresponding to each doublet or sextet in our series. These data conform to the probability of the existence of each doublet or sextet in the experimental spectrum.
Then, based on the mentioned calculations, we formed a preliminary spectrum for the fitting procedure. It is contained a set of Mössbauer doublets and sextets, corresponding to possible nonequivalent positions and modeling as a group of the analytical functions. This group was fitted to the experimental spectrum by varying the entire set of hyperfine interaction parameters using the least-squares method in the linear approximation (χ2 criterion).
Mössbauer absorption lines were represented by the pseudo-Voight function, in accordance with the following equation:
I = I   ( k ( 1 + x i ) 2 + ( 1 k ) · e ln 2   ·   x i 2 )
Here, x i = 2   ·   ( I S i W ) and i is a channel number. I, IS, and W are hyperfine interaction parameters (line intensity, isomer shift, and linewidth, respectively) and k is the Lorentz–Gauss parameter, which determines the absorption line form. In our case, the approximation of the Lorentz form was used, i.e., k = 1.
The magnetic measurements were performed on a LakeShore VSM 8604 vibrating sample magnetometer at room temperature in a constant magnetic field of 0−15,000 Oe, with an increment of 50 Oe.

2.3. Glass-Ceramic Preparation and Characterization

The simultaneous thermal analysis (DSC-TG) was performed to analyze the processes that occur upon heating the fraction of dispersed microspheres to obtain glass-ceramic materials. DSC-TG was performed in the dynamic gas mixture of 20% O2 + 80% Ar with a total flow of 50 sccm, with the simultaneous registration of mass changes, heat flow, and composition of gaseous products (in terms of molecular ions Ar+, O2+, CO2+, CO+, SO2+, and H2O+) on a Jupiter STA 449C synchronous thermal analysis unit with an Aëolos QMS 403C mass spectral (MS) analyzer (Netzsch, Selb, Germany). Measurements were performed in Pt-Rh crucibles without lids at a linear temperature rate of 10 °C/min in the range of 40–1100 °C with a sample weight of 20 mg. The DSC sensor was heat flow calibrated by measuring the heat capacity of the sapphire disc according to the method DIN 51007:1994-06 Thermal analysis; differential thermal analysis principles. The primary thermoanalytical data were processed using the licensed NETZSCH Proteus (ver. 4.8.4) software package. Samples of glass-ceramics based on the narrow fraction of dispersed fly ash microspheres were obtained by compacting the powder samples through cold static uniaxial pressing in a closed rigid mold [39]. At a pressure of 50 MPa, cylindrical tablets 16 mm in diameter and 8–12 mm high were obtained. Prior to sintering, the pressed samples were dried at 90 °C for 2 h to remove moisture. Sintering was performed in a muffle furnace at a temperature of 1000, 1100, and 1200 °C for 3 h.
For the sintered materials, the following characteristics were determined:
  • Sintering coefficient: k = V2/V1 is a dimensionless value, which is determined by the ratio of the sample volume after sintering (V2 = πr22h2) to the volume of the compacted sample (V1 = πr12h1).
  • Linear shrinkage (%): changes in the height (Δh) and diameter (Δd) of the as-compacted sample resulting from drying and sintering.
  • Apparent density (g/cm3): this is determined as the ratio of the sample weight (g) to its total volume (cm3) [40].
  • Water absorption (%): this characterizes the ability of the material to absorb and retain moisture in the pores of capillaries; it is determined by the ratio of the water volume absorbed by the sample during vacuum pumping to the weight of the initial sample [40].
  • Open porosity (%): this is the ratio of the volume of available pores in the sample to its total volume; the volume of available pores is determined by the water saturation of the material [41].
  • Compressive strength (MPa): σ = F/S is the compressive strength corresponding to the compressive load at which the test sample is fractured; it is calculated as the ratio of the breaking load F (H) to the cross-sectional area of the sample S (mm2) [42]. The F value was determined on a laboratory hydraulic press #4350 (Carver, Wabash, IN, USA), S = 2Rh.
The glass-ceramics sintered at 1200 °C were characterized by Mössbauer and magnetic parameters compared to the initial fine narrow fraction.

3. Results and Discussion

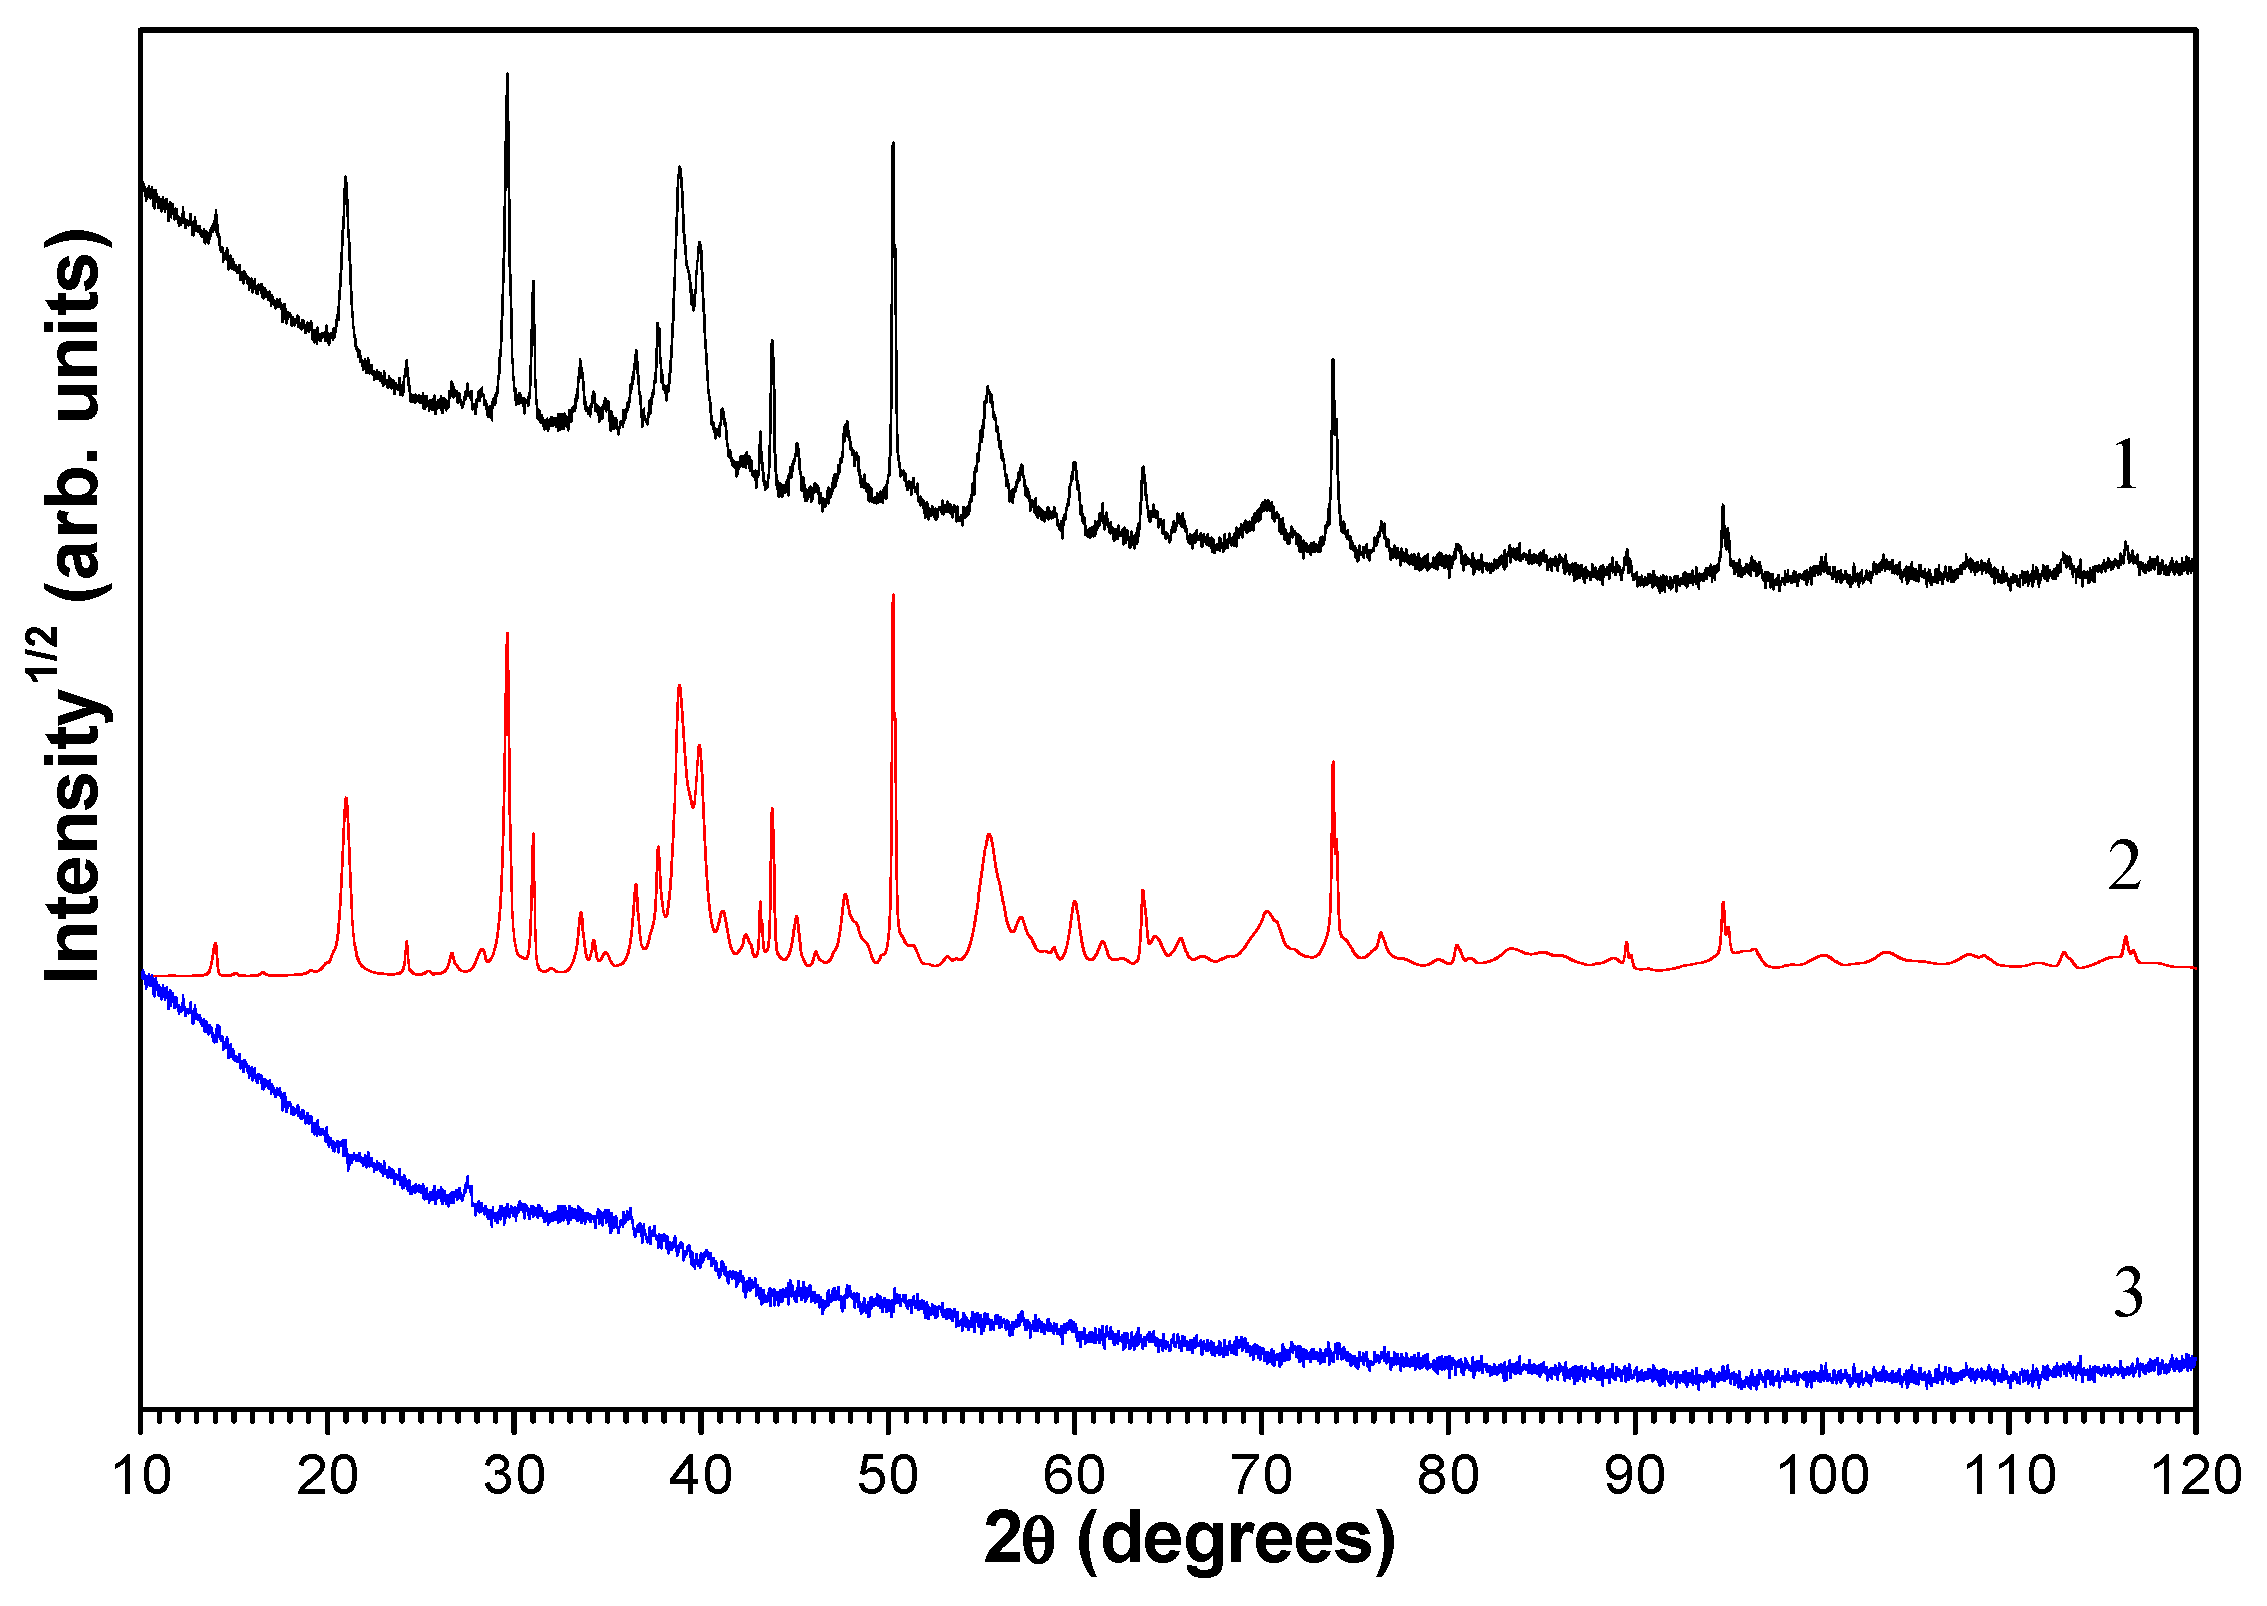
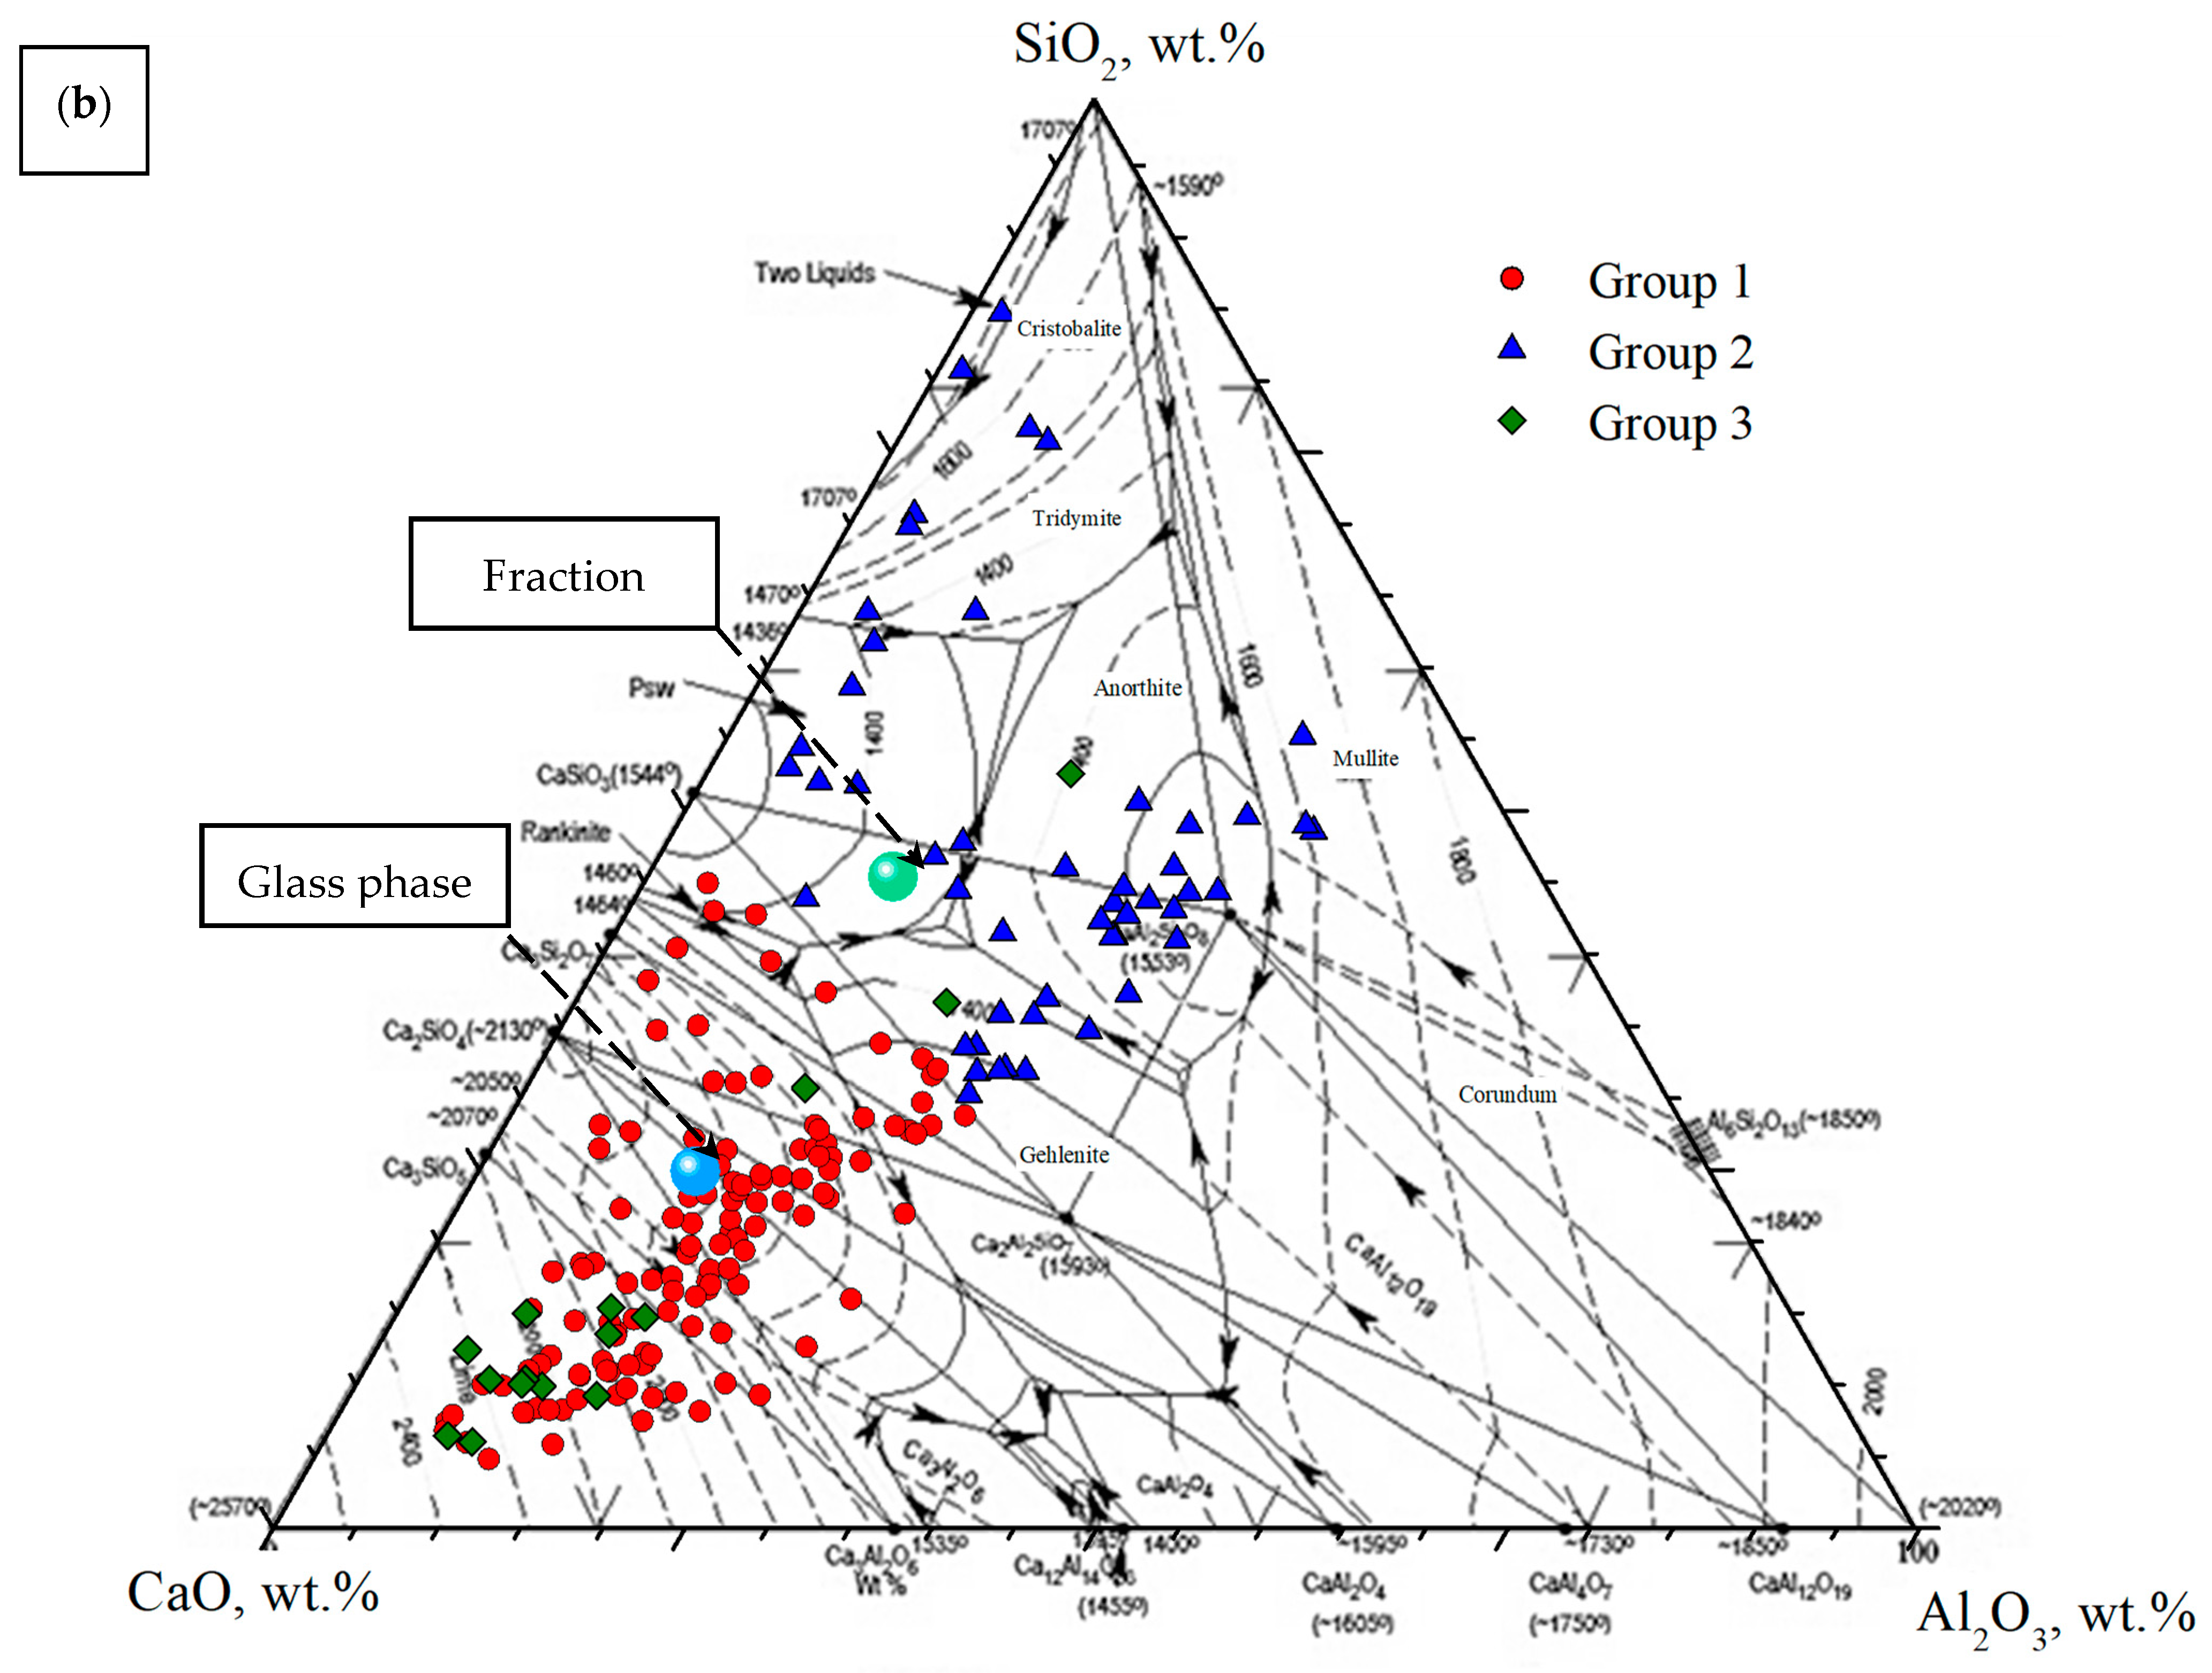
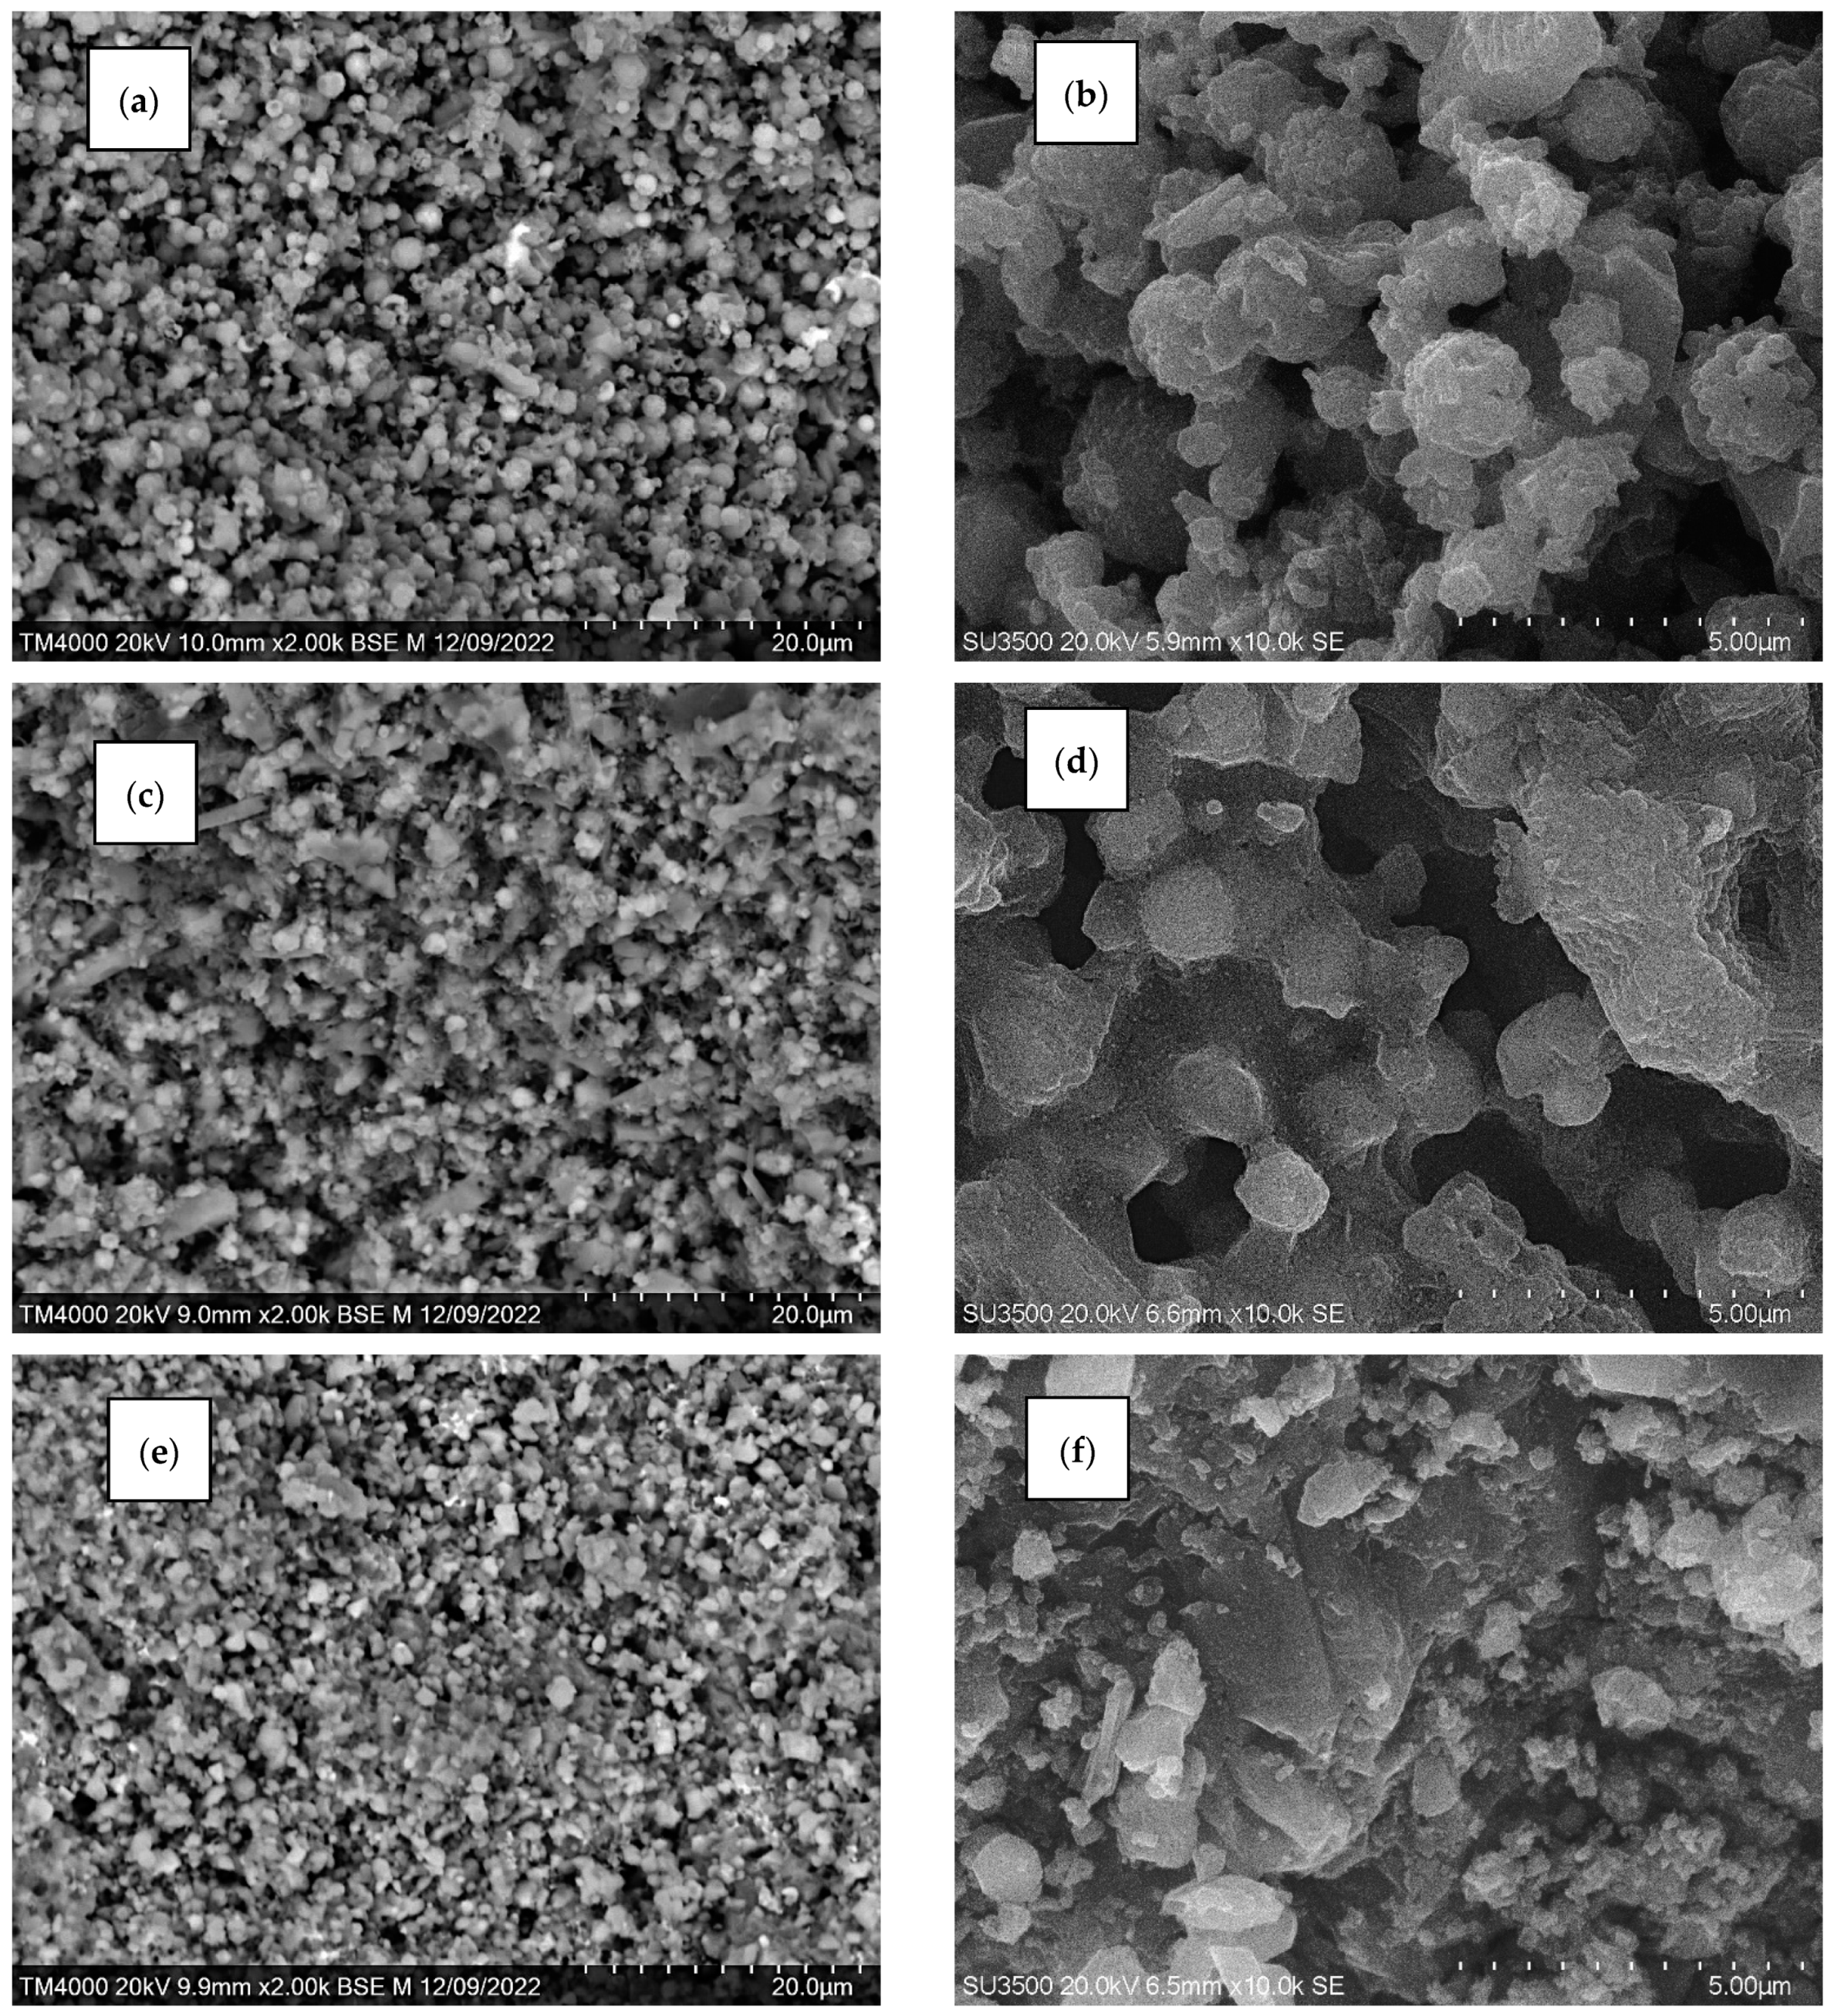
3.1. Characterization of the Fine Narrow Fraction

According to the chemical analysis, the main component of the narrow fraction of dispersed microspheres is CaO—39.5 wt %, while other components are found in a lower amount (wt %): SiO2—15.9, Fe2O3—13.8, Al2O3—8.4, MgO—8.3, and SO3—7.6; with Na2O, K2O, and TiO2 being present as admixtures (Table 1).
Figure 2 shows the experimental and calculated XRD patterns and their difference from those for the initial fine narrow fraction. The halo at 2θ ~ 30–40° (line 3) indicates the presence of an X-ray amorphous phase in the sample.
According to the quantitative X-ray diffraction analysis (Table 1), Ca-bearing compounds are the main crystalline phases. The compounds are the following: aluminum-substituted ferrite (Ca4Al2Fe2O10—brownmillerite), tricalcium aluminate (Ca3Al2O6), and calcium sulfate and carbonate; together with calcium hydroxide and oxide, this accounts for 48.5 wt % of the gross composition of the fraction. The other crystalline phases of the dispersed fraction are magnesium oxide (6.8 wt %), Fe-spinel (2 wt %), and quartz (2 wt %) (Table 1). The content of the amorphous Ca-bearing glass phase is 40.7 wt %. As compared to the gross chemical composition, the glass phase is characterized by a higher content of SiO2, as well as Al2O3 (Figure 3).

3.2. Single-Particle SEM-EDS Analysis

We performed a systematic study of the gross compositions of individual microspheres in the fine narrow fraction. On the whole, 195 microspheres ranging in size from 0.6 to 2.4 μm were analyzed. According to the SEM-EDS data, the main macrocomponents of the dispersed microspheres were found to be CaO, SiO2, Al2O3, Fe2O3, and MgO, with their total amount for all the globules being from 75 to 95 wt %, while along with SO3, it was equal to 87–99 wt %. Depending on the content of the main macrocomponents, individual groups of microspheres can be distinguished that meet certain composition criteria (Table 2). The compositions of the studied microspheres are shown in Figure 4 in a triple diagram [CaO + MgO] − [SiO2 + Al2O3] − [Fe2O3], and they are superposed on the phase diagram CaO–SiO2–Al2O3 [43].
Group 1 includes 2 3 of the microspheres, which are characterized by the high content of [CaO + MgO]—from 30 to 60 wt %, [SiO2 + Al2O3] < 40 wt %. Group 2 accounts for 1 4 of the microspheres with the increased content of the aluminosilicate component: [SiO2 + Al2O3]—from 40 to 80 wt %, [CaO + MgO]—from 10 to 40 wt %. Group 3 includes about 8% of the microspheres with a high content of Fe2O3—from 31 to 59 wt %, [CaO + MgO]—from 10 to 50 wt %, [SiO2 + Al2O3]—from 5 to 20 wt %.

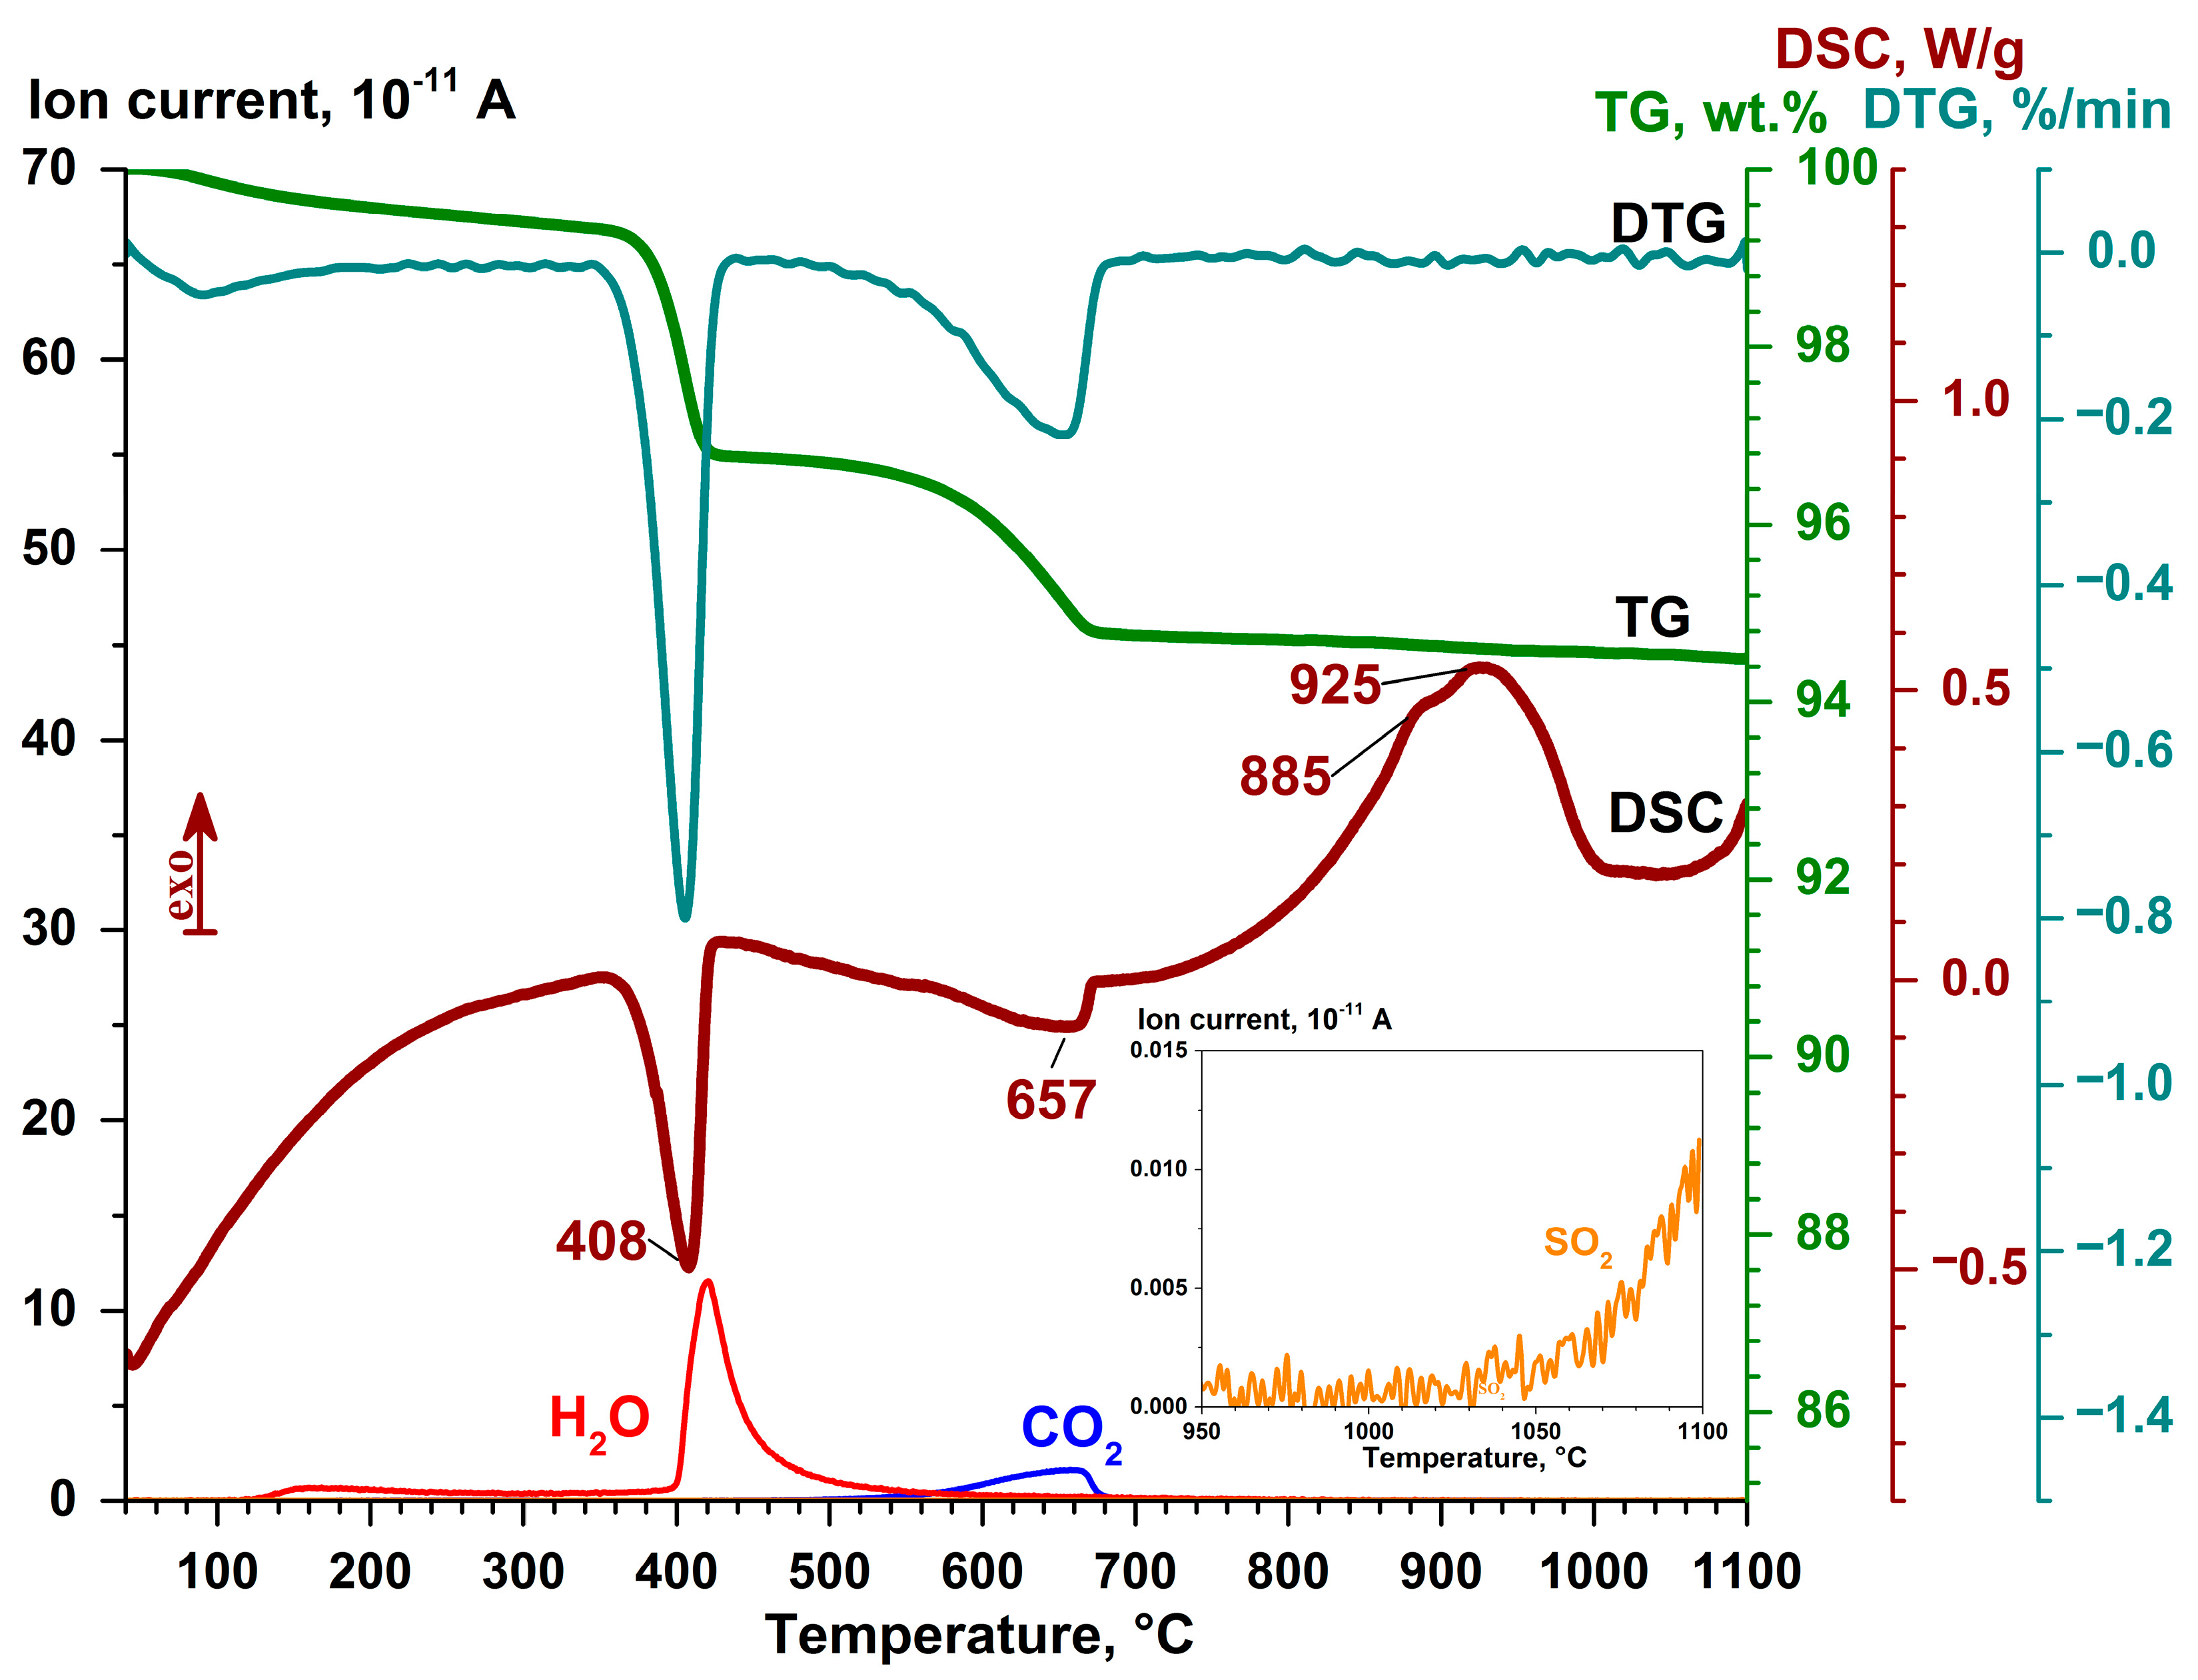
3.3. Thermochemical Transformations

It is difficult to directly synthesize glass-ceramics from fly ash without any additives. The thermochemical transformations observed in the sample of dispersed microspheres upon heating in the temperature range of 40–1100 °C were studied using the DSC-TG method (Figure 5).
  • The endothermic effect in the temperature range of 40–244 °C corresponds to the dehydration of calcium compounds and/or thermal desorption of hygroscopic moisture, accompanied by a weight loss of 0.50 wt %.
  • The endothermic effect in the temperature range of 244–435 °C with the maximum at 408 °C corresponds to the dissociation reaction Ca(OH)2 = CaO + H2O with a weight loss of 2.74 wt.%.
  • The endothermic effect in the temperature range of 435–700 °C with the main maximum at 657 °C and the local one at 624 °C corresponds to the dissociation reaction of calcium carbonate CaCO3 = CaO + CO2 (or that of the solid solution Ca1−x−yMgxFeyCO3) with a weight loss of 2.01 wt %.
  • The endothermic effect expressed as a bimodal DSC peak with the main maximum at 925 °C and the local one near 885 °C in the temperature range of 700–1050 °C corresponds to the crystallization of a new phase, presumably, wollastonite, and it is characterized by a slight weight loss of 0.21 wt %, which is due to the continuous emission of CO2.
  • The endothermic effect in the temperature range of T > 1050 °C compensates for the endothermic process of phase dissociation of anhydrite CaSO4 = CaO + SO2 and corresponds to the onset of crystallization of new calcium silicate/aluminosilicate phases.
The operational characteristics of ceramic materials are largely determined by their mineral-phase composition. The XRD data show that the sintering of the dispersed microspheres at 1200 °C leads to the formation of new crystalline phases (Figure 6 and Figure 7): larnite Ca2SiO4—47%, ye’elimite Ca4(Al6O12)(SO4)—15%, and ternesite Ca5(SiO4)2SO4—4%, where some elements can be replaced by other ones. It also leads to a noticeable increase in the content of Fe-spinel by up to 21%. A decrease in the content of MgO down to 5%, and in those of CaSO4 to 6% and tricalcium aluminate to 2% is observed. Quartz and Ca-containing crystalline phases, such as calcium aluminoferrite, hydroxide, oxide, and carbonate, present in the initial fraction of microspheres were not detected after the heat treatment; the glass phase disappeared almost completely (Figure 2 and Figure 6).
The combination of the DSC-TG and XRD data allows one to conclude that the exothermic effect in the temperature range of 700–1050 °C corresponds to the recrystallization of the glass phase with the molar ratio CaO/SiO2 = 0.94 with the formation of crystals of a new phase, presumably wollastonite CaSiO3 (the molar ratio CaO/SiO2 = 1), with the maxima at 885 °C and 925 °C (Figure 5). According to the literature data [44,45], the crystallization of wollastonite from coal ash samples is manifested in the form of a complex exothermic DSC peak with two maxima in the temperature range of 823–870 °C and 903–926 °C, with the wollastonite formation being observed in the temperature range of 847–938 °C.
Among the crystalline phases of the narrow fraction annealed at 1200 °C, the wollastonite phase is absent, while the phase of another calcium silicate, Ca2SiO4 larnite (47%), is present in a significant amount. The analysis of both the total chemical composition of the fraction and the composition of the glass phase in the coordinates of the ternary system CaO–SiO2–Al2O3 (Figure 4b) shows that the total composition of the fraction is found in the region of primary crystallization of the wollastonite phase CaSiO3, while the composition of the glass phase is observed in the region of primary crystallization of the larnite phase Ca2SiO4. The compositions of individual microspheres of Group 1 and Group 2, respectively, are localized in the same areas. It can be assumed that the formation of the wollastonite phase is an intermediate stage in the high-temperature formation of such phases as larnite and other calcium silicates/aluminosilicates. Thus, during the synthesis of glass-ceramic samples in the high-temperature region T > 700 °C, the following thermochemical transformations occur in the dispersed microspheres:
  • CaO (glass matrix) + SiO2 (glass matrix) → CaSiO3;
  • Fe2O3 (glass matrix) + Al2O3 (glass matrix) + MgO (glass matrix) → Fe-spinel;
  • Ca3(Al3+, Fe3+)O6 + CaSO4 → Ca4[(Al3+, Fe3+)3O12]SO4;
  • Ca2(Al3+, Fe3+)O5 + CaSO4 + CaO (portlandite, calcite) → Ca4[(Al3+, Fe3+)3O12]SO4;
  • CaSiO3 + CaO (portlandite, calcite, anhydrite) → Ca2SiO4;
  • Ca2SiO4 + CaSO4 → Ca5(SiO4)2SO4.

3.4. Characterization of Glass-Ceramic Materials

Class C CFAs are much more suitable for synthesizing glass-ceramics of the CaO–Al2O3–SiO2 system. These glass-ceramics have many excellent properties such as high mechanical strength, excellent dimensional stability and abrasion, and corrosion resistance, which demonstrate the potential for a wide range of applications in construction [9]. The sintered materials based on the narrow fraction of dispersed microspheres from lignite fly ash are characterized by physical and mechanical parameters generally used in the ceramic industry. Figure 8 shows the images of the initial fly ash fraction and the samples obtained after the sintering processes at 1000, 1100, and 1200 °C. The characterization results are shown in Table 3. As is observed, with the increasing sintering temperature, the color of the samples becomes saturated and darker, changing from gray-yellow in the initial ash to black-brown after sintering at 1200 °C (Figure 8). The volume and geometric size of the samples decreased noticeably, which is numerically confirmed by the sintering coefficient and linear shrinkage (Table 3).
Direct sintering techniques for glass-ceramics can produce samples with a large pore size, resulting in low density and high water absorption. In the case of the dispersed PM10 microspheres, the small particle size and homogeneity of the fraction made it possible to obtain well-sintered samples with appropriate properties. The microstructure of the glass-ceramics is presented in Figure 9. The sample annealed at 1000 °C was less sintered, while the samples annealed at 1100 and 1200 °C appeared to be more consolidated: microspheres coalesced, forming a significant number of interactions between particles, which led to more compact products. With an increase in the sintering temperature, individual large-sized grains were formed in the matrix.
The apparent density, water absorption, and porosity were analyzed as physical measures of the sintering efficiency, as well as for evaluating the technological properties of the glass-ceramics. With an increase in the sintering temperature, the value of the apparent density increased from 1.3 g/cm3 at 1000 °C to 1.9 g/cm3 at 1100 °C and up to 3.2 g/cm3 at 1200 °C. As the density values increased, the water absorption values, as well as the porosity, decreased (Table 3). The lowest water absorption of 1.8% and porosity of 4.3% were observed in the glass-ceramic samples with the highest apparent density, sintered at 1200 °C.
The most important data in this study are the results obtained in the compressive test. The strength was observed to increase when increasing the heat-treatment temperature from 7.2 MPa at 1000 °C to 46.7 MPa at 1100 °C. The maximum compressive strength of 100.6 MPa was shown in the glass-ceramic samples sintered at 1200 °C. The high strength is associated with the formation of the main crystalline phases. Thus, larnite, Mohs hardness 6, is an important component of high-tech and ceramic materials [46,47], heat-resistant coatings [48], and sulfoaluminate-belite cement [49]. Ye’elimite and ternesite are the main components of calcium sulfoaluminate cement, which is currently being promoted as an alternative to Portland cement [50].
The overall results show that it is possible to produce high-performance glass-ceramic materials from fly ash by direct sintering without any additives. The physical and mechanical parameters obtained for the sintered samples based on PM10 microspheres from lignite fly ash (Table 3) are comparable to those of commercially produced engineering ceramics [51,52]. In addition, due to the presence of Fe-spinel, all the sintered samples have magnetic properties.

3.5. Mössbauer Spectroscopy

The Mössbauer spectra of the initial and sintered (1200 °C) samples measured at 300 K, determined quadrupole splitting P(QS), and hyperfine magnetic field P(H) distributions are shown in Figure 10 and Figure 11, respectively.
The probability distributions of quadrupole splitting P(QS) for both samples clearly show two poorly separated doublets, which may correspond to the two paramagnetic iron states in the samples. In contrast, the P(H) distributions show a series of maxima, which correspond to the possible iron positions in a magnetically ordered state. We note that for the initial sample, P(H) dependence demonstrates quite a wide distribution of the possible iron magnetic states in the sample. This can be understood as a highly disordered magnetic spinel phase.
Our analysis was taken as a basis for the fitting procedure with the variation of all the hyperfine interactions’ parameters. The fitted parameters are shown in Table 4. The obtained data show that iron is in the 3+ oxidation high spin state [53]. In addition, we can distinguish the tetrahedral (designated as A in Table 4) and the octahedral (designated as B in Table 4) coordination of iron atoms. According to our calculations, sextets S1 and S2 in the initial sample are iron atoms with octahedral coordination. Sextet S3 and both the doublets have an isomer shift corresponding to the tetrahedral iron sites.
In the same way, in the sintered sample, sextets S1 and S2 are devoted to the octahedral (B) coordination of iron, whereas sextets S3 and S4 and the doublet D1 demonstrate the isomer shift corresponding to the tetrahedral (A) iron coordination. The lower isomer shift is observed for doublet D1 (0.163 mm/s); thus, these iron atoms may also be attributed to the defective positions with the oxygen atom vacancy. A similar situation was observed in a previous study of magnetic microspheres [54]. Our data for the magnetically split sextets also show that iron atoms in the spinel structure are highly substituted with the other atoms in the annealed sample. This is due to the significantly lower values of the hyperfine magnetic field in comparison with the pure iron spinel [55]. In the initial sample, the relative area of the magnetically split sextets was ~53%, which is much less than in the sintered sample. Nevertheless, we should note that the average hyperfine magnetic field is slightly lower for the sintered sample.

3.6. Magnetization Measurements

Field dependences of magnetization for initial fly ash fraction and the samples obtained after the sintering at 1200 °C measured at room temperature are shown in Figure 12. It can be seen that the hysteresis curves for these samples are different. The main parameters of the hysteresis loops are listed in Table 5. The sintered sample shows a lower coercivity, HC = 25 Oe, compared to the initial fraction, for which HC = 125 Oe. The HCR value (the magnetic field after which the remanence magnetization value becomes zero) and the HCR/HC ratio also decreased significantly for the sintered sample. The remanence magnetization MR and saturation magnetization MS that were reduced to the mass of the sample, on the contrary, increase after sintering, while the MR/MS ratio decreases. This may be a consequence of a change in the domain state, as well as intergranular interaction during sintering [56,57,58].
Along with changes in the parameters of the hysteresis loop, the change in the shape of the loop after sintering also draws attention. Thus, the shape of the hysteresis loop of the initial fraction is characterized as a “wasp-waisted” hysteresis loop, which is not observed for the sample after heat treatment. The performed sintering procedure led to an improvement in the magnetic properties of the fly ash in terms of reducing the magnetic hardness. This approach can be used to obtain inexpensive soft magnetic materials for engineering applications.

4. Conclusions

A narrow fraction of dispersed microspheres with d10 = 0.6 μm, d50 = 1.5 μm, and d90 = 3.8 μm from class C fly ash was directly sintered without any additives to form glass-ceramics with several desirable properties. The best characteristics, such as density of 3.2 g/cm3, water absorption of 1.8%, and compressive strength of 100.6 MPa, were demonstrated by the samples sintered at 1200 °C. It is established that sintering reduces the amount of glass phase and promotes the formation of larnite, Fe-spinel, ye’elimite, and ternesite. The concentration of the magnetic phase increases by almost an order of magnitude, which makes it possible to obtain highly concentrated magnetic spinel glass-ceramics with a remanence magnetization of 0.366 emu/g compared to the initial fly ash narrow fraction with MR ~ 0.185 emu/g. Mössbauer measurements show that the sintered sample demonstrates a narrower distribution of the hyperfine magnetic field. In addition, we observed a significantly lower value of the coercive field in the sintered sample 25 Oe, which allows proposing such materials for industrial use as soft magnetic materials. The presented results confirm the possibility of successfully using class C fly ash as a potential raw material for obtaining glass-ceramics with enhanced features, which will ensure the large-scale utilization of CFA with high efficiency and low energy consumption, minimizing solid waste pollution.

Author Contributions

Conceptualization, E.V.F. and A.G.A.; formal analysis, Y.V.K., S.V.S., L.A.S. and V.V.Y.; investigation, E.V.F., G.V.A., Y.V.K., S.V.S., L.A.S. and V.V.Y.; writing—original draft preparation, E.V.F., Y.V.K., S.V.S., G.V.A. and V.V.Y.; writing—review and editing, E.V.F.; visualization, G.V.A., Y.V.K., S.V.S., L.A.S. and V.V.Y.; supervision, A.G.A.; project administration, E.V.F. All authors have read and agreed to the published version of the manuscript.

Funding

Russian Science Foundation and the Krasnoyarsk Regional Science Foundation, grant number 22-27-20039, https://rscf.ru/project/22-27-20039/ (accessed on 15 March 2023).

Institutional Review Board Statement

Not applicable.

Informed Consent Statement

Not applicable.

Data Availability Statement

Not applicable.

Acknowledgments

The reported study was conducted using the equipment of the Krasnoyarsk Regional Research Equipment Centre of SB RAS (FRC KSC SB RAS) for SEM-EDS and magnetic analyses.

Conflicts of Interest

The authors declare no conflict of interest.

References

  1. Coal & Electricity. Available online: https://www.worldcoal.org/coal-facts/coal-electricity/ (accessed on 15 March 2023).
  2. Yao, Z.T.; Ji, X.S.; Sarker, P.K.; Tang, J.H.; Ge, L.Q.; Xia, M.S.; Xi, Y.Q. A comprehensive review on the applications of coal fly ash. Earth-Sci. Rev. 2015, 141, 105–121. [Google Scholar] [CrossRef] [Green Version]
  3. Belviso, C. State-of-the-art applications of fly ash from coal and biomass: A focus on zeolite synthesis processes and issues. Prog. Energy Combust. Sci. 2018, 65, 109–135. [Google Scholar] [CrossRef]
  4. Ahmaruzzaman, M. A review on the utilization of fly ash. Prog. Energy Combust. Sci. 2010, 36, 327–363. [Google Scholar] [CrossRef]
  5. Blissett, R.S.; Rowson, N.A. A review of the multi-component utilization of coal fly ash. Fuel 2012, 97, 1–23. [Google Scholar] [CrossRef]
  6. Kotelnikova, A.D.; Rogova, O.B.; Karpukhina, E.A.; Solopov, A.B.; Levin, I.S.; Levkina, V.V.; Proskurnin, M.A.; Volkov, D.S. Assessment of the structure, composition, and agrochemical properties of fly ash and ash-and-slug waste from coal-fired power plants for their possible use as soil ameliorants. J. Clean. Prod. 2022, 333, 130088. [Google Scholar] [CrossRef]
  7. ASTM Standard Specification for Coal Fly Ash and Raw or Calcined Natural Pozzolan for Use in Concrete (C618-05) Annual Book of ASTM Standards, Concrete and Aggregates, Volume 04.02, American Society for Testing Materials 2005. Available online: www.astm.org (accessed on 15 March 2023).
  8. Vassilev, S.V.; Vassileva, C.G. A new approach for the classification of coal fly ashes based on their origin, composition, properties, and behaviour. Fuel 2007, 86, 1490–1512. [Google Scholar] [CrossRef]
  9. Wang, S.; Zhang, C.; Chen, J. Utilization of coal fly ash for the production of glass-ceramics with unique performances: A brief review. J. Mater. Sci. Technol. 2014, 30, 1208–1212. [Google Scholar] [CrossRef]
  10. Erol, M.; Kücükbayrak, S.; Ersoy-Mericboyu, A. Comparison of the properties of glass, glass-ceramic and ceramic materials produced from coal fly ash. J. Hazard. Mater. 2008, 153, 418–425. [Google Scholar] [CrossRef]
  11. Yoon, S.D.; Lee, J.U.; Lee, J.H.; Yun, Y.H.; Yoon, W.J. Characterization of Wollastonite Glass-ceramics Made from Waste Glass and Coal Fly Ash. J. Mater. Sci. Technol. 2013, 29, 149–153. [Google Scholar] [CrossRef]
  12. Choo, T.F.; Mohd Salleh, M.A.; Kok, K.Y.; Matori, K.A.; Abdul Rashid, S. A Study on the Utilization of Coal Fly Ash Derived Grog in Clay Ceramics. Materials 2020, 13, 5218. [Google Scholar] [CrossRef]
  13. Balapour, M.; Thway, T.; Rao, R.; Moser, N.; Garboczi, E.J.; Hsuan, Y.G.; Farnam, Y. A thermodynamics-guided framework to design lightweight aggregate from waste coal combustion fly ash. Resour. Conserv. Recycl. 2022, 178, 106050. [Google Scholar] [CrossRef]
  14. Kourti, I.; Cheeseman, C.R. Properties and microstructure of lightweight aggregate produced from lignite coal fly ash and recycled glass. Resour. Conserv. Recycl. 2010, 54, 769–775. [Google Scholar] [CrossRef] [Green Version]
  15. Abdullayev, A.; Bekheet, M.F.; Hanaor, D.A.H.; Gurlo, A. Materials and Applications for Low-Cost Ceramic Membranes. Membranes 2019, 9, 105. [Google Scholar] [CrossRef] [Green Version]
  16. Huang, J.; Chen, H.; Yang, J.; Zhou, T.; Zhang, H. Effects of particle size on microstructure and mechanical strength of a fly ash based ceramic membrane. Ceram. Int. 2023, 49, 15655–15664. [Google Scholar] [CrossRef]
  17. Húlan, T.; Štubňa, I.; Ondruška, J.; Trník, A. The influence of fly ash on mechanical properties of clay-based ceramics. Minerals 2020, 10, 930. [Google Scholar] [CrossRef]
  18. Sokolar, R.; Nguyen, M. The Effect of Class C Fly Ash on the Plasticity and Ageing of Ceramic Mixtures Based on Kaolin. Materials 2021, 14, 2761. [Google Scholar] [CrossRef]
  19. Arshad, M.T.; Ahmad, S.; Khitab, A.; Hanif, A. Synergistic use of fly ash and silica fume to produce high-strength self-compacting cementitious composites. Crystals 2021, 11, 915. [Google Scholar] [CrossRef]
  20. Ambrus, M.; Mucsi, G. Advanced processing of high Ca fly ash for enhanced reactivity and improved high value-added application possibilities. Case Stud. Constr. Mater. 2023, 18, e02214. [Google Scholar] [CrossRef]
  21. Chen, X.; Zhang, J.; Lu, M.; Chen, B.; Gao, S.; Bai, J.; Zhang, H.; Yang, Y. Study on the effect of calcium and sulfur content on the properties of fly ash based geopolymer. Constr. Build. Mater. 2022, 314, 125650. [Google Scholar] [CrossRef]
  22. Kumar, S.; Mucsi, G.; Kristály, F.; Pekker, P. Mechanical activation of fly ash and its influence on micro and nano-structural behaviour of resulting geopolymers. Adv. Powder Technol. 2017, 28, 805–813. [Google Scholar] [CrossRef]
  23. DeGuire, E.J.; Risbud, S.H. Crystallization and properties of glasses prepared from Illinois coal fly ash. J. Mater. Sci. 1984, 19, 1760–1766. [Google Scholar] [CrossRef]
  24. Angjusheva, B.; Jovanov, V.; Fidanchevski, E. Conversion of coal fly ash glass into glass-ceramics by controlled thermal treatment. Maced. J. Chem. Chem. Eng. 2021, 40, 307–319. [Google Scholar] [CrossRef]
  25. Acar, I.; Atalay, M.U. Characterization of sintered class F fly ashes. Fuel 2013, 106, 195–203. [Google Scholar] [CrossRef]
  26. Zeng, L.; Sun, H.J.; Peng, T.J.; Zheng, W.M. The sintering kinetics and properties of sintered glass-ceramics from coal fly ash of different particle size. Results Phys. 2019, 15, 102774. [Google Scholar] [CrossRef]
  27. Ilic, M.; Cheeseman, C.; Sollars, C.; Knight, J. Mineralogy and microstructure of sintered lignite coal fly ash. Fuel 2003, 82, 331–336. [Google Scholar] [CrossRef]
  28. Moreno, N.; Querol, X.; Andrés, J.M.; Stanton, K.; Towler, M.; Nugteren, H.; Janssen-Jurkovicová, M.; Jones, R. Physico-chemical characteristics of European pulverized coal combustion fly ashes. Fuel 2005, 84, 1351–1363. [Google Scholar] [CrossRef]
  29. State Report “On the State and Protection of the Environment in the Krasnoyarsk Territory in 2020”—Krasnoyarsk, 2021. Available online: http://www.mpr.krskstate.ru/dat/bin/art_attach/17690_gosdoklad_2020.pdf (accessed on 15 March 2023). (In Russian).
  30. Sokolar, R.; Nguyen, M. Influence of Class C Fly Ash on the Properties of Plastic Clay and Fired Brick Body. Mater. Technol. 2020, 54, 107–111. [Google Scholar] [CrossRef]
  31. Biffi, G. Book for the Production of Ceramic Tiles, 1st ed.; Gruppo Editionale: Faenza, Italy, 2003. [Google Scholar]
  32. Zimmer, A.; Bergmann, C.P. Fly ash of mineral coal as ceramic tiles raw material. Waste Manag. 2007, 27, 59–68. [Google Scholar] [CrossRef]
  33. Tatsky, L.N.; Lokhova, N.A.; Gershanovich, G.L.; Senichak, E.B. Raw Mixture for the Manufacture of Wall Ceramic Products. RU Patent No. 2086517C1, 10 August 1997. Available online: https://patents.google.com/patent/RU2086517C1/ru (accessed on 15 March 2023). (In Russian).
  34. Fomenko, E.V.; Anshits, N.N.; Kushnerova, O.A.; Akimochkina, G.V.; Kukhtetskiy, S.V.; Anshits, A.G. Separation of nonmagnetic fine narrow fractions of PM10 from coal fly ash and their characteristics and mineral precursors. Energy Fuels 2019, 33, 3584–3593. [Google Scholar] [CrossRef]
  35. Fomenko, E.V.; Akimochkina, G.V.; Anshits, A.G. Narrow dispersed fractions of high-calcium fly ash produced from the pulverized combustion of irsha-borodinsky coal. Therm. Eng. 2019, 66, 560–568. [Google Scholar] [CrossRef]
  36. Akimochkina, G.V.; Rogovenko, E.S.; Gareeva, A.S.; Fomenko, E.V. Aerodynamic separation of dispersed microspheres PM2.5, PM10 from fly ash of lignite combustion for production of new materials. J. Sib. Fed. Univ. Chem. 2022, 15, 387–397. Available online: https://elib.sfu-kras.ru/bitstream/handle/2311/148510/09_Akimochkina.pdf?sequence=1 (accessed on 15 March 2023).
  37. GOST 5382-2019; Cements and Materials for Cement Production. Chemical Analysis Methods. Publishing House of Standards: Moscow, Russia, 2019. Available online: https://docs.cntd.ru/document/1200168999 (accessed on 15 March 2023). (In Russian)
  38. Fomenko, E.; Anshits, N.; Solovyov, L.; Mikhaylova, O.A.; Anshits, A. Composition and morphology of fly ash cenospheres produced from the combustion of kuznetsk coal. Energy Fuels 2013, 27, 5440–5448. [Google Scholar] [CrossRef]
  39. Glass, S.J.; Ewsuk, K.G. Ceramic Powder Compaction. MRS Bull. 1997, 22, 24–28. [Google Scholar] [CrossRef] [Green Version]
  40. GOST 7025–91; Ceramic and Calcium Silicate Bricks and Stones. Methods for Water Absorption and Density Determination and Frost Resistance Control. Standards Inform: Moscow, Russia, 2006. Available online: https://docs.cntd.ru/document/901700526 (accessed on 15 March 2023). (In Russian)
  41. GOST 2409-14; Refractories. Method for Determination of Bulk Density, Apparent and True Porosity, Water Absorption. Standards Inform: Moscow, Russia, 2014. Available online: https://docs.cntd.ru/document/1200114732 (accessed on 15 March 2023). (In Russian)
  42. GOST 24409-80; Ceramic Electrotechnical Materials. Methods of Testing. Standards Inform: Moscow, Russia, 2005. Available online: https://docs.cntd.ru/document/1200011905 (accessed on 15 March 2023). (In Russian)
  43. Osborn, E.F.; Muan, A. Phase Equilibrium Diagrams of Oxide Systems, Plate 1. The System CaO–Al2O3–SiO2; American Ceramic Society and Edward Orton, Ir., Ceramic Foundation: Columbus, OH, USA, 1960. [Google Scholar]
  44. Kaminskas, R.; Kubiliūtė, R. The effect of coal ash on synthesis and properties of tricalcium silicate. Mater. Sci. 2010, 16, 236–241. [Google Scholar]
  45. Giergiczny, Z. Effect of some additives on the reactions in fly ASH-Ca(OH)2 system. J. Therm. Anal. Calorim. 2004, 76, 747–754. [Google Scholar] [CrossRef]
  46. Gou, Z.; Chang, J.; Zhai, W. Preparation and characterization of novel bioactive dicalcium silicate ceramics. J. Eur. Ceram. Soc. 2005, 25, 1507–1514. [Google Scholar] [CrossRef]
  47. Venkatraman, S.K.; Choudhary, R.; Krishnamurithy, G.; Raghavendran, H.R.B.; Murali, M.R.; Kamarul, T.; Suresh, A.; Abraham, J.; Swamiappan, S. Biomineralization, mechanical, antibacterial and biological investigation of larnite and rankinite bioceramics. Mater. Sci. Eng. C 2021, 118, 111466. [Google Scholar] [CrossRef]
  48. Jansen, F.; Wei, X.H.; Dorfman, M.R.; Peters, J.A.; Nagy, D.R. Performance of dicalcium silicate coatings in hot-corrosive environment. Surf. Coat. Technol. 2002, 149, 57–61. [Google Scholar] [CrossRef]
  49. Rungchet, A.; Poon, C.S.; Chindaprasirt, P.; Pimraksa, K. Synthesis of low-temperature calcium sulfoaluminate-belite cements from industrial wastes and their hydration: Comparative studies between lignite fly ash and bottom ash. Cem. Concr. Compos. 2017, 83, 10–19. [Google Scholar] [CrossRef]
  50. Shen, Y.; Chen, X.; Li, J.; Wang, P.; Qian, J. Preparation and Performance of Ternesite–Ye’elimite Cement. Materials 2022, 15, 4369. [Google Scholar] [CrossRef]
  51. Morrell, R. Handbook of Properties of Technical and Engineering Ceramics. Part 1. An Introduction for the Engineer and Designer; HMSO: London, UK, 1989. [Google Scholar]
  52. Asokan, P.; Saxena, M.; Asolekar, S.R. Coal combustion residues—Environmental implications and recycling potentials. Resour. Conserv. Recycl. 2005, 43, 239–262. [Google Scholar] [CrossRef]
  53. Gütlich, P.; Bill, E.; Trautwein, A.X. Mössbauer Spectroscopy and Transition Metal Chemistry: Fundamentals and Applications; Springer Science & Business Media: Berlin/Heidelberg, Germany, 2010. [Google Scholar] [CrossRef]
  54. Bayukov, O.A.; Anshits, N.N.; Balaev, A.D.; Sharonova, O.M.; Rabchevskii, E.V.; Petrov, M.I.; Anshits, A.G. Mössbauer study of magnetic microspheres isolated from power plant fly ash. Inorg. Mater. 2005, 41, 50–59. [Google Scholar] [CrossRef]
  55. Murray, P.J.; Linnett, J.W. Mössbauer studies in the spinel system coxfe3−xo4. J. Phys. Chem. Solids 1976, 37, 619–624. [Google Scholar] [CrossRef]
  56. De Boer, C.B.; Dekkers, M.J. Unusual thermomagnetic behaviour of haematites: Neoformation of a highly magnetic spinel phase on heating in air. Geophys. J. Int. 2001, 144, 481–494. [Google Scholar] [CrossRef] [Green Version]
  57. Na, J.G.; Lee, T.D.; Park, S.J. Effects of cation distribution on magnetic properties in cobalt ferrite. J. Mater. Sci. Lett. 1993, 12, 961–962. [Google Scholar] [CrossRef]
  58. Hu, P.; Yang, H.; Pan, D.; Wang, H.; Tian, J.; Zhang, S.; Wang, X.; Volinsky, A.A. Heat treatment effects on microstructure and magnetic properties of Mn–Zn ferrite powders. J. Magn. Magn. Mater. 2010, 322, 173–177. [Google Scholar] [CrossRef]
Figure 1. SEM images of the fine narrow fraction.
Magnetochemistry 09 00177 g001
Figure 2. XRD patterns of the fine narrow fraction: 1—experimental, 2—calculated, and 3—difference.
Magnetochemistry 09 00177 g002
Figure 3. Main component contents in the fine narrow fraction and its glass phase.
Magnetochemistry 09 00177 g003
Figure 4. Chemical composition of the fine narrow fraction, its glass phase, and individual microspheres of Group 1, Group 2, and Group 3 in the diagrams: (a) [CaO + MgO] − [SiO2 + Al2O3] − [Fe2O3]; (b) CaO–SiO2–Al2O3.
Magnetochemistry 09 00177 g004aMagnetochemistry 09 00177 g004b
Figure 5. DSC-TG-DTG-MS curves of the thermal transformation process for the fine narrow fraction.
Magnetochemistry 09 00177 g005
Figure 6. XRD patterns of the fine narrow fraction after heat treatment at 1200 °C: 1—experimental, 2—calculated, and 3—difference.
Magnetochemistry 09 00177 g006
Figure 7. Content of the crystalline phases in the fine narrow fraction and after the heat treatment at 1200 °C.
Magnetochemistry 09 00177 g007
Figure 8. Images of the samples: (a) initial fine narrow fraction 2.5 ± 0.2 g, which was used for sintering; (b) sintered at 1000 °C; (c) sintered at 1100 °C; and (d) sintered at 1200 °C.
Magnetochemistry 09 00177 g008
Figure 9. SEM images of the samples sintered at different temperatures: (a,b) 1000 °C; (c,d) 1100 °C; and (e,f) 1200 °C.
Magnetochemistry 09 00177 g009
Figure 10. Mössbauer spectrum at 300 K of the initial sample with the partial components marked in the colored areas (a). Quadrupole splitting distribution (b); hyperfine magnetic field distribution in the experimental spectrum (c). The observable extremums were used in the preliminary spectrum in the fitting procedure.
Magnetochemistry 09 00177 g010
Figure 11. Mössbauer spectrum at 300 K of the sintered at 1200 °C sample with the partial components marked in the colored areas (a). Quadrupole splitting distribution (b); hyperfine magnetic field distribution in the experimental spectrum (c). The observable extremums were used in the preliminary spectrum in the fitting procedure.
Magnetochemistry 09 00177 g011
Figure 12. Field dependences of magnetization for initial fine narrow fraction and after the heat treatment at 1200 °C; measured at 300 K.
Magnetochemistry 09 00177 g012
Table 1. Compositions of the fine narrow fraction.
Chemical Composition, wt %
LOISiO2Al2O3Fe2O3CaOMgONa2OK2OSO3TiO2
5.5015.908.4213.7839.528.250.300.147.640.25
Phase Composition, wt %
Glass phaseCa4Al2Fe2O10Ca3Al2O6CaSO4CaCO3CaOCa(OH)2MgOQuartzFe-spinel
40.712.910.211.20.72.011.56.82.02.0
Table 2. Minimum and maximum values of the oxide content (wt %) in individual microspheres (195 globules).
Groupd, μmSiO2Al2O3Fe2O3CaOMgONa2OK2OTiO2MnOP2O5SO3BaOSiO2/Al2O3
1SiO2 + Al2O3 < 40 wt %; 129 microspheres
min0.63.02.93.823.34.1<0.01<0.01<0.01<0.01<0.011.6<0.010.4
max2.333.518.727.556.928.30.80.82.52.91.623.23.910.4
2SiO2 + Al2O3 > 40 wt %; 51 microspheres
min0.721.21.31.97.62.1<0.01<0.01<0.01<0.01<0.011.90.001.08
max2.470.133.517.836.49.18.13.611.90.830.913.22.755.2
4 Fe2O3 > 30 wt %; 15 microspheres
min0.92.41.931.29.003.8<0.01<0.01<0.01<0.01<0.012.1<0.010.6
max1.818.78.858.142.814.22.21.11.41.30.411.81.62.4
Table 3. Characteristics of the sintered samples.
ParameterThermal Treatment Temperature
1000 °C1100 °C1200 °C
Sintering coefficient1.10.80.5
Linear shrinkage (%)
  • height
0−12.5−25.0
  • diameter
6.2−6.3−21.9
Apparent density (g/cm3)1.31.93.2
Water absorption (%)42.522.11.8
Open porosity (%)32.727.44.3
Compressive strength (MPa)7.246.7100.6
Table 4. Mössbauer parameters of the samples at 300 K. δ is the chemical shift relative to α-Fe, Hhf is the hyperfine magnetic field on iron nuclei, Δ is the quadrupole splitting, W is the spectral line FWHM, dW is the broadening of the line, and A is the relative contribution of the component to the whole spectrum.
δ, mm/s
±0.005
Hhf,
kOe, ±3
Δ/2,
mm/s ±0.01
W,
mm/s ±0.01
dW,
mm/s ±0.01
A,
% ±3%
Origin
Initial fine narrow fraction (χ2 = 1.128)
S10.312480−0.180.800.2012Fe3+(B)
S20.35342500.790.020Fe3+(B)
S30.291283−0.370.530.3321Fe3+(A)
D10.232--0.790.66--20Fe3+(A)
D20.274--1.570.70--27Fe3+(A)
Sintered sample at 1200 °C fraction (χ2 = 1.346)
S10.3022640.000.162.2029Fe3+(B)
S20.3003960.140.390.6020Fe3+(B)
S30.2843590.000.390.6331Fe3+(A)
S40.239320−0.060.380.3610Fe3+(A)
D10.163--0.730.71--9Fe3+(A)
Table 5. Magnetic parameters of the samples at 300 K. HC—coercivity, MR—remanence, MS—saturation magnetization.
ParameterSample
Initial Fine Narrow FractionSintered Sample at 1200 °C
HC (Oe)12525
HCR (Oe)116869
HCR/HC9.3442.76
MR (emu/g)0.1850.366
MS (emu/g)1.1363.450
MR/MS0.1630.106
Disclaimer/Publisher’s Note: The statements, opinions and data contained in all publications are solely those of the individual author(s) and contributor(s) and not of MDPI and/or the editor(s). MDPI and/or the editor(s) disclaim responsibility for any injury to people or property resulting from any ideas, methods, instructions or products referred to in the content.

