Article

On the Size of Superconducting Islands on the Density-Wave Background in Organic Metals

by
Vladislav D. Kochev
1,
Seidali S. Seidov
1 and
Pavel D. Grigoriev
1,2,*
1
Department of Theoretical Physics and Quantum Technology, National University of Science and Technology “MISiS”, 119049 Moscow, Russia
2
L.D. Landau Institute for Theoretical Physics, 142432 Chernogolovka, Russia
*
Author to whom correspondence should be addressed.
Magnetochemistry 2023, 9(7), 173; https://doi.org/10.3390/magnetochemistry9070173
Submission received: 23 May 2023 / Revised: 15 June 2023 / Accepted: 28 June 2023 / Published: 4 July 2023

Abstract

:
Most high- T c superconductors are spatially inhomogeneous. Usually, this heterogeneity originates from the interplay of various types of electronic ordering. It affects various superconducting properties, such as the transition temperature, the magnetic upper critical field, the critical current, etc. In this paper, we analyze the parameters of spatial phase segregation during the first-order transition between superconductivity (SC) and a charge- or spin-density wave state in quasi-one-dimensional metals with imperfect nesting, typical of organic superconductors. An external pressure or another driving parameter increases the transfer integrals in electron dispersion, which only slightly affects SC but violates the Fermi surface nesting and suppresses the density wave (DW). At a critical pressure P c , the transition from a DW to SC occurs. We estimate the characteristic size of superconducting islands during this phase transition in organic metals in two ways. Using the Ginzburg–Landau expansion, we analytically obtain a lower bound for the size of SC domains. To estimate a more specific interval of the possible size of the superconducting islands in (TMTSF) 2 PF 6 samples, we perform numerical calculations of the percolation probability via SC domains and compare the results with experimental resistivity data. This helps to develop a consistent microscopic description of SC spatial heterogeneity in various organic superconductors.

1. Introduction

Superconductivity (SC) often competes [1,2,3] with charge-density wave (CDW) or spin-density wave (SDW) electronic instabilities [3,4], as both create an energy gap on the Fermi level. In such materials, the density wave (DW) is suppressed by some external parameter, which deteriorates the nesting property of the Fermi surface (FS) and enables superconductivity. The driving parameters are usually the chemical composition (doping level) and pressure, as in cuprate- [5,6,7,8,9,10] or iron-based high- T c superconductors [11,12], organic superconductors (OSs) [13,14,15,16,17,18,19,20,21,22,23,24,25,26], transition metal dichalcogenides [1,2,3], etc. The DW can also be suppressed [27] or enhanced [28,29] by disorder. The latter happens, e.g., in (TMTSF) 2 ClO 4 organic superconductors [13,14,28,29,30], where the disorder is controlled by the cooling rate during the anion ordering transition. Anion ordering splits the electron spectrum, which deteriorates the FS nesting and dampens the SDW, enabling SC.
The SC–DW interplay is much more interesting than just a competition. Usually, the SC transition temperature, T c , is the highest in the coexistence region near the quantum critical point where the DW disappears [1,2,20,21]. This is attributed to the enhancement of Cooper pairing by the critical DW fluctuations, similar to cuprate high- T c superconductors [31]. This enhancement is also common for other types of quantum critical points, such as antiferromagnetic (AFM) points in cuprate [32,33] or heavy fermion [34] superconductors, ferromagnetic points [35], nematic phase transitions in Fe-based superconductors [36,37], etc. The enhancement of electron–electron (ee) interactions in the Cooper channel already appears in the random-phase approximation, and the resulting strong momentum dependence of ee coupling may lead to unconventional superconductivity [38]. The spin-dependent coupling to an SDW may additionally affect the SC in the case of their microscopic coexistence and even favor triplet SC pairing [39,40]. Generally, any antiferromagnetic background changes the spin structure of eigenstates and the electronic g-factor, as was studied both theoretically and experimentally in cuprate and organic superconductors [41]. The upper critical field H c 2 is often several times higher in the coexistence region than in a pure SC phase [18,25], which may be useful for applications.
OSs are helpful for investigating the SC–DW interplay because they have rather weak electronic correlations and low DW and SC transition temperatures [13,14], which is convenient for their theoretical and experimental study. However, their phase diagram, layered crystal structure and many other features are very similar to those of high- T c superconductors. Moreover, by changing the chemical composition or pressure in OSs, one can easily vary the electronic dispersion in a wide interval and even change the FS topology from quasi-1D (Q1D) to quasi-2D. Large and pure monocrystals of organic metals can be synthesized, so that their electronic structure can be experimentally studied by high-magnetic-field tools [42] and by other experimental techniques [13,14].
To understand the DW–SC interplay and the influence of DW on SC properties in OSs, one needs to know the microscopic structure of their coexistence. Each of these ground states creates an energy gap on the Fermi level and removes the FS instability. Hence, the DW and SC must be somehow separated in the momentum or coordinate space. The momentum space DW–SC separation assumes a spatially uniform structure, where the FS is only partially gapped by the DW, and the non-gapped parts of the FS maintain SC [3,40]. The resistivity hysteresis observed in (TMTSF) 2 PF 6 [19] suggests the spatial DW/SC segregation in OSs. Microscopic SC domains of size d comparable to the DW coherence length ξ DW may emerge due to the soliton DW structure [39,43,44,45,46]. However, such a small size of SC or metallic domains contradicts the angular magnetoresistance oscillations (AMROs) in the region of SC/DW coexistence, observed both in (TMTSF) 2 ClO 4 [30] and in (TMTSF) 2 PF 6 [21] and implying the domain width d > 1 µm [21,30].
The observed [18,25] enhancement of the SC upper critical field H c 2 in OSs is possible in all of the above scenarios [40,45]. Spatial DW–SC segregation only requires a SC domain on the order of the penetration depth λ of the magnetic field into the superconductor [47]. In (TMTSF) 2 ClO 4 , the penetration depth within the TMTSF layers is [48] λ a b ( T = 0 ) 0.86 µm, and increases with T T c S C . Hence, the macroscopic spatial phase separation with a SC domain size d > 1 µm suggested by AMRO data [21,30] is consistent with the observed H c 2 enhancement in the DW–SC coexistence phase.
Another interesting feature of SDW/SC coexistence in OSs is the anisotropic SC onset, opposite to a weak intrinsic interlayer Josephson coupling in high- T c superconductors [47]; the SC transition and the zero resistance in OSs was first observed [20,21,28] only along the least-conducting interlayer z-direction, then along the two least-conducting directions, z and y, and only finally in all three directions. This anisotropic SC onset was explained recently [49] by assuming a spatial SC/DW separation and studying the percolation in finite-size samples with a thin elongated shape relevant to the experiments on (TMTSF) 2 PF 6 [20,21] and (TMTSF) 2 ClO 4 [28,29]. This additionally supports the scenario of spatial SC/DW segregation in the form of rather large domains of width d > 1 µm. However, the microscopic reason for such phase segregation remains unknown. Similar anisotropic SC onset and even T c enhancement in FeSe mesa structures was observed and explained by heterogeneous SC inception [50]. The spatial segregation in FeSe and some other Fe-based high- T c superconductors probably originates from the so-called nematic phase transition and domain structure, but similar electronic ordering is absent in OSs.
Recently, the DW–metal phase transition in OSs was shown to be of first order [51], which suggests that the spatial DW–SC segregation may be due to phase nucleation during this transition. In this paper, we estimate the typical size of superconducting islands in organic metals with two different methods. In Section 2, we formulate a model and the Landau–Ginzburg functional for free energy in the DW state. In Section 3.1, we analytically obtain a lower bound for the size of the superconducting islands. In Section 3.2, we discuss the relationship between the DW coherence length and the SC nucleation size during the first-order phase transition. In Section 3.3, we perform numerical calculations of the percolation probability, from which we determine the interval of possible sizes of the superconducting islands in (TMTSF) 2 PF 6 . In Section 4, we discuss our results in connection with the experimental observations of (TMTSF) 2 PF 6 and in other superconductors.

2. The Model

2.1. Q1D Electron Dispersion and the Driving Parameters of DW–Metal/SC Phase Transitions in OSs

In Q1D organic metals [13,14], the free electron dispersion near the Fermi level is approximately given by
ε ( k ) = v F ( | k x | k F ) + t ( k ) ,
where v F and k F are the Fermi velocity and Fermi momentum in the chain x-direction. The interchain electron dispersion t ( k ) is given by the tight-binding model:
t ( k ) = 2 t b cos ( k y b ) + 2 t b cos ( 2 k y b ) ,
where b is the lattice constant in the y-direction. The dispersion along the interlayer z-axis is usually significantly less than along the y-axis; thus, it is left out here. In (TMTSF) 2 PF 6 , the transfer integral t b is 30 meV [52], and the “antinesting” parameter t b is 4.5 K [53] at ambient pressure.
As illustrated in Figure 1b, the FS of Q1D metals consists of two slightly warped sheets separated by 2 k F and roughly exhibits the nesting property.
It leads to the Peierls instability and favors the formation of DWs at low temperatures T < T cDW T c , which competes with superconductivity. The quasiparticle dispersion in the DW state in the mean-field approximation is given by
E ± ( k ) = ε + ( k , k Q ) ± | Δ Q | 2 + ε 2 ( k , k Q ) ,
where we have used the notations
ε ± ( k , k ) = ε ( k ) ± ε ( k ) 2 .
The FS has the property of perfect nesting at the wave vector Q if ε + ( k , k Q ) = 0 . If ε + ( k , k Q ) < | Δ Q | for the entire FS, all electron states are gapped at the Fermi level due to DW formation. Then, the DW converts to a semiconducting state at T < T cDW and SC does not emerge. If ε + ( k , k Q ) > | Δ Q | in a finite interval of k at the Fermi level, the metallic state survives at T < T cDW . Then, a uniform SC state may emerge, but its properties differ from those without DWs [39,40] because of the FS reconstruction and the change in electron dispersion by the DW. For Q = Q 0 = 2 k F , π / b , only the second harmonic in the electron dispersion given by Equation (2) violates FS nesting: ε + ( k , k Q 0 ) = 2 t b cos ( 2 k y b ) . Hence, usually only t b t b 2 / v F k F t b is important for the DW phase diagram.
With the increase in applied pressure P, the lattice constants decrease. This enhances the interchain electron tunneling and the transfer integrals. The increase in t b ( P ) with pressure spoils the FS nesting and decreases the DW transition temperature T cDW ( P ) . There is a critical pressure P c and a corresponding critical value t b * = t b ( P c ) at which T cDW P c = 0 and a quantum critical point (QCP) exists. The electronic properties at this DW QCP are additionally complicated by superconductivity emerging at T < T cSC at P > P c . In organic metals, SC appears even earlier, at P > P c 1 < P c , and there is a finite region P c 1 < P < P c of SC–DW coexistence [20,21,25]. This simple model qualitatively describes the phase diagram observed in (TMTSF) 2 PF 6 [20,21,25], α -(BEDT-TTF) 2 KHg(SCN) 4 [25], in various compounds of the (TMTTF) 2 X family [26,54,55] and in many other OSs [13,14,16,17].

2.2. Mean Field Approach and the Landau–Ginzburg Expansion of DW Free Energy

Mean-field theory does not correctly describe strictly 1D conductors, where non-perturbative methods are helpful. However, in most DW materials, nonzero electron hopping between the conducting 1D chains and the 3D character of the electron–electron (ee) interactions and lattice elasticity reduce the deviations from the mean-field solution and also make most of the methods and exactly solvable models developed for the strictly 1D case inapplicable. On the other hand, the interchain electron dispersion strongly dampens the fluctuations and validates the mean-field description [56,57]. The perpendicular-to-chain term t ( k ) in Equations (1) and (2) is much greater than the energy scale of the DW transition temperature ( T c 0 12.1 K). Only the ”imperfect nesting” term t b of t ( k ) is on the order of T c 0 . Hence, the criterion for the mean-field theory to be applicable [56,57], t T c 0 , is reliably satisfied in most Q1D organic metals.
For our analysis, we take the Landau–Ginzburg expansion of the free energy in the series of even powers of the DW order parameter Δ = Δ Q :
F A ( T , Q ) 2 | Δ | 2 + B 4 | Δ | 4 + C 6 | Δ | 6 + D 8 | Δ | 8 +
Usually, the minimum of the free energy corresponds to the uniform DW order parameter Δ when Q = Q 0 . Since the coefficient A T cDW , Q 0 = 0 , we keep its temperature and momentum dependence. The sign of the coefficient B determines the type of DW–metal phase transition. If B DW > 0 , the phase transition is of the second order, and only the first two coefficients A DW and B DW are sufficient for its description. If B DW < 0 , the phase transition may be of the first order and the coefficients C DW and even D DW if C DW 0 are required for its description. The self-consistency equation (SCE) for a DW is obtained by the variation in the free energy (5) with respect to Δ :
Δ A + B Δ 2 + C Δ 4 + D Δ 6 + = 0 .
The free energy (5) can also be calculated by integrating the SCE over Δ . In ref. [58], the SCE for the DW was derived in a magnetic field acting via Zeeman splitting and for two coupling constants of the ee interaction, charge U c and spin U s (see Equation (17) in ref. [58]). Without a magnetic field, the charge U c and spin U s coupling constants do not couple, and the system chooses the largest one of them, corresponding to the highest transition temperature. We rewrite the SCE without a magnetic field and for only one charge or spin coupling constant U:
Δ = T U k ω Δ ( ω + i ε + ) 2 + ε 2 + | Δ | 2 ,
where ε ± = ε ± ( k , k Q ) are given by Equation (4), and ω takes the values π T ( 2 n + 1 ) , n Z . In Appendix A, we briefly describe the derivation of Equation (7) and discuss the relation of coefficients in the Landau–Ginzburg expansion (5) with electronic susceptibility. The Landau–Ginzburg expansion coefficients in Equations (5) and (6) can be obtained by the expansion of Equation (7) in a power series of | Δ | 2 .
The sum over k in Equation (7) for a macroscopic sample is equivalent to the integral:
k = 2 d k x 2 π π / b π / b d k y 2 π .
The factor of 2 appears because of two FS sheets are present at k x ± k F . Usually, for simplicity, the integration limits over k x are taken to be infinite and the resulting logarithmic divergence of Equation (7) is regularized by the definition of the transition temperature T c 0 . This procedure is briefly described in Appendix B of ref. [51]. When the Fermi energy E F t b , for a linearized electron dispersion (1) near the Fermi level, one may integrate Equation (7) over k x in infinite limits, which gives (cf. Equation (22) of ref. [58])
Δ = π ν F | U | T 2 ω Δ ( ω + i ε + ) 2 + | Δ | 2 k y ,
where the density of electron states at the Fermi level in the metallic phase per two spin components per unit length L x of one chain is ν F = 2 / π v F . Averaging over k y is denoted by triangular brackets, i.e., · k y = b π / b π / b d k y / 2 π · . Equation (9) is similar to the self-consistency equation for superconductivity in a magnetic field, where the orbital effect of the magnetic field is neglected and the pair-breaking Zeeman splitting is replaced by ε + ( k , k Q ) .

3. Estimation of the Size of the SC Islands

3.1. Analytical Calculation of the Ginzburg–Landau Expansion Coefficients for T t b

Expansion of Equation (9) over Δ yields
A = 4 π T v F ω sgn ω ω + i ε + k y 1 U = = 4 v F ln T c 0 T + ψ 1 2 Re ψ 1 2 + ε + 2 π T k y ,
where the logarithmic divergence π T ω ω 1 ln E F / T is contained in the definition of T c 0 = E F exp 1 / v F | U | . In (TMTSF) 2 PF 6 , T c 0 12.1 K [53].
The spatial modulation with the wave vector q of the DW order parameter Δ corresponds to the deviation of the DW wave vector Q from Q 0 by ± q . Hence, the gradient term in the Ginzburg–Landau expansion of the DW free energy can be obtained by the expansion of A ( T , Q ) given by Equation (10) in the powers of small deviation q = Q Q 0 . A ( Q , T ) depends on Q via ε + = ε + ( k , k Q ) , given by Equation (4). For the quasi-1D electron dispersion in Equations (1) and (2), approximately describing (TMTSF) 2 PF 6 , we may use Equation (21) from ref. [58]:
ε + = h v F q x 2 + 2 t b sin b q y 2 sin b k y q y 2 2 t b cos b q y cos b 2 k y q y .
The general form of the Taylor series of A ( T , Q 0 + q ) , given by Equation (10), over the deviation q = Q Q 0 of the DW wave vector Q from its optimal value Q 0 up to the second order is
A ( q ) 4 v F ln T c 0 T + π / b π / b d k y C 0 + c x q x + c y q y + c x y q x q y + A x q x 2 + A y q x 2 .
The linear terms and the cross term vanish when taking the integral π / b π / b d q y (this is always the case if wave vector Q 0 is the optimal one). The constant and quadratic terms do not vanish, thus
A ( q ) A 0 + A x q x 2 + A y q y 2 .
Expanding Equation (11) over the deviation q = Q Q 0 up to the second order, substituting it in Equation (10) and expanding the digamma function over the same wave vector q , we obtain the coefficients A i :
A 0 = 4 v F T c 0 T + ψ 1 2 Re ψ 1 2 i t b cos 2 b k y π T k y ; A x = 4 v F 2 v F 2 32 π 2 T 2 Re ψ ( 2 ) 1 2 i t b cos 2 b k y π T k y ; A y = 4 v F b 2 8 π 2 T 2 2 π T t b cos b k y 4 t b cos 2 b k y Im ψ ( 1 ) 1 2 i t b cos 2 b k y π T t b 4 t b cos b k y 2 sin 2 b k y Re ψ ( 2 ) 1 2 i t b cos 2 b k y π T k y .
The integrals over k y in A y , A x and A 0 can be calculated numerically and give the coherence lengthes ξ x and ξ y . From Equations (A10) and (A11), it follows that
ξ i 2 = A i / A 0 .
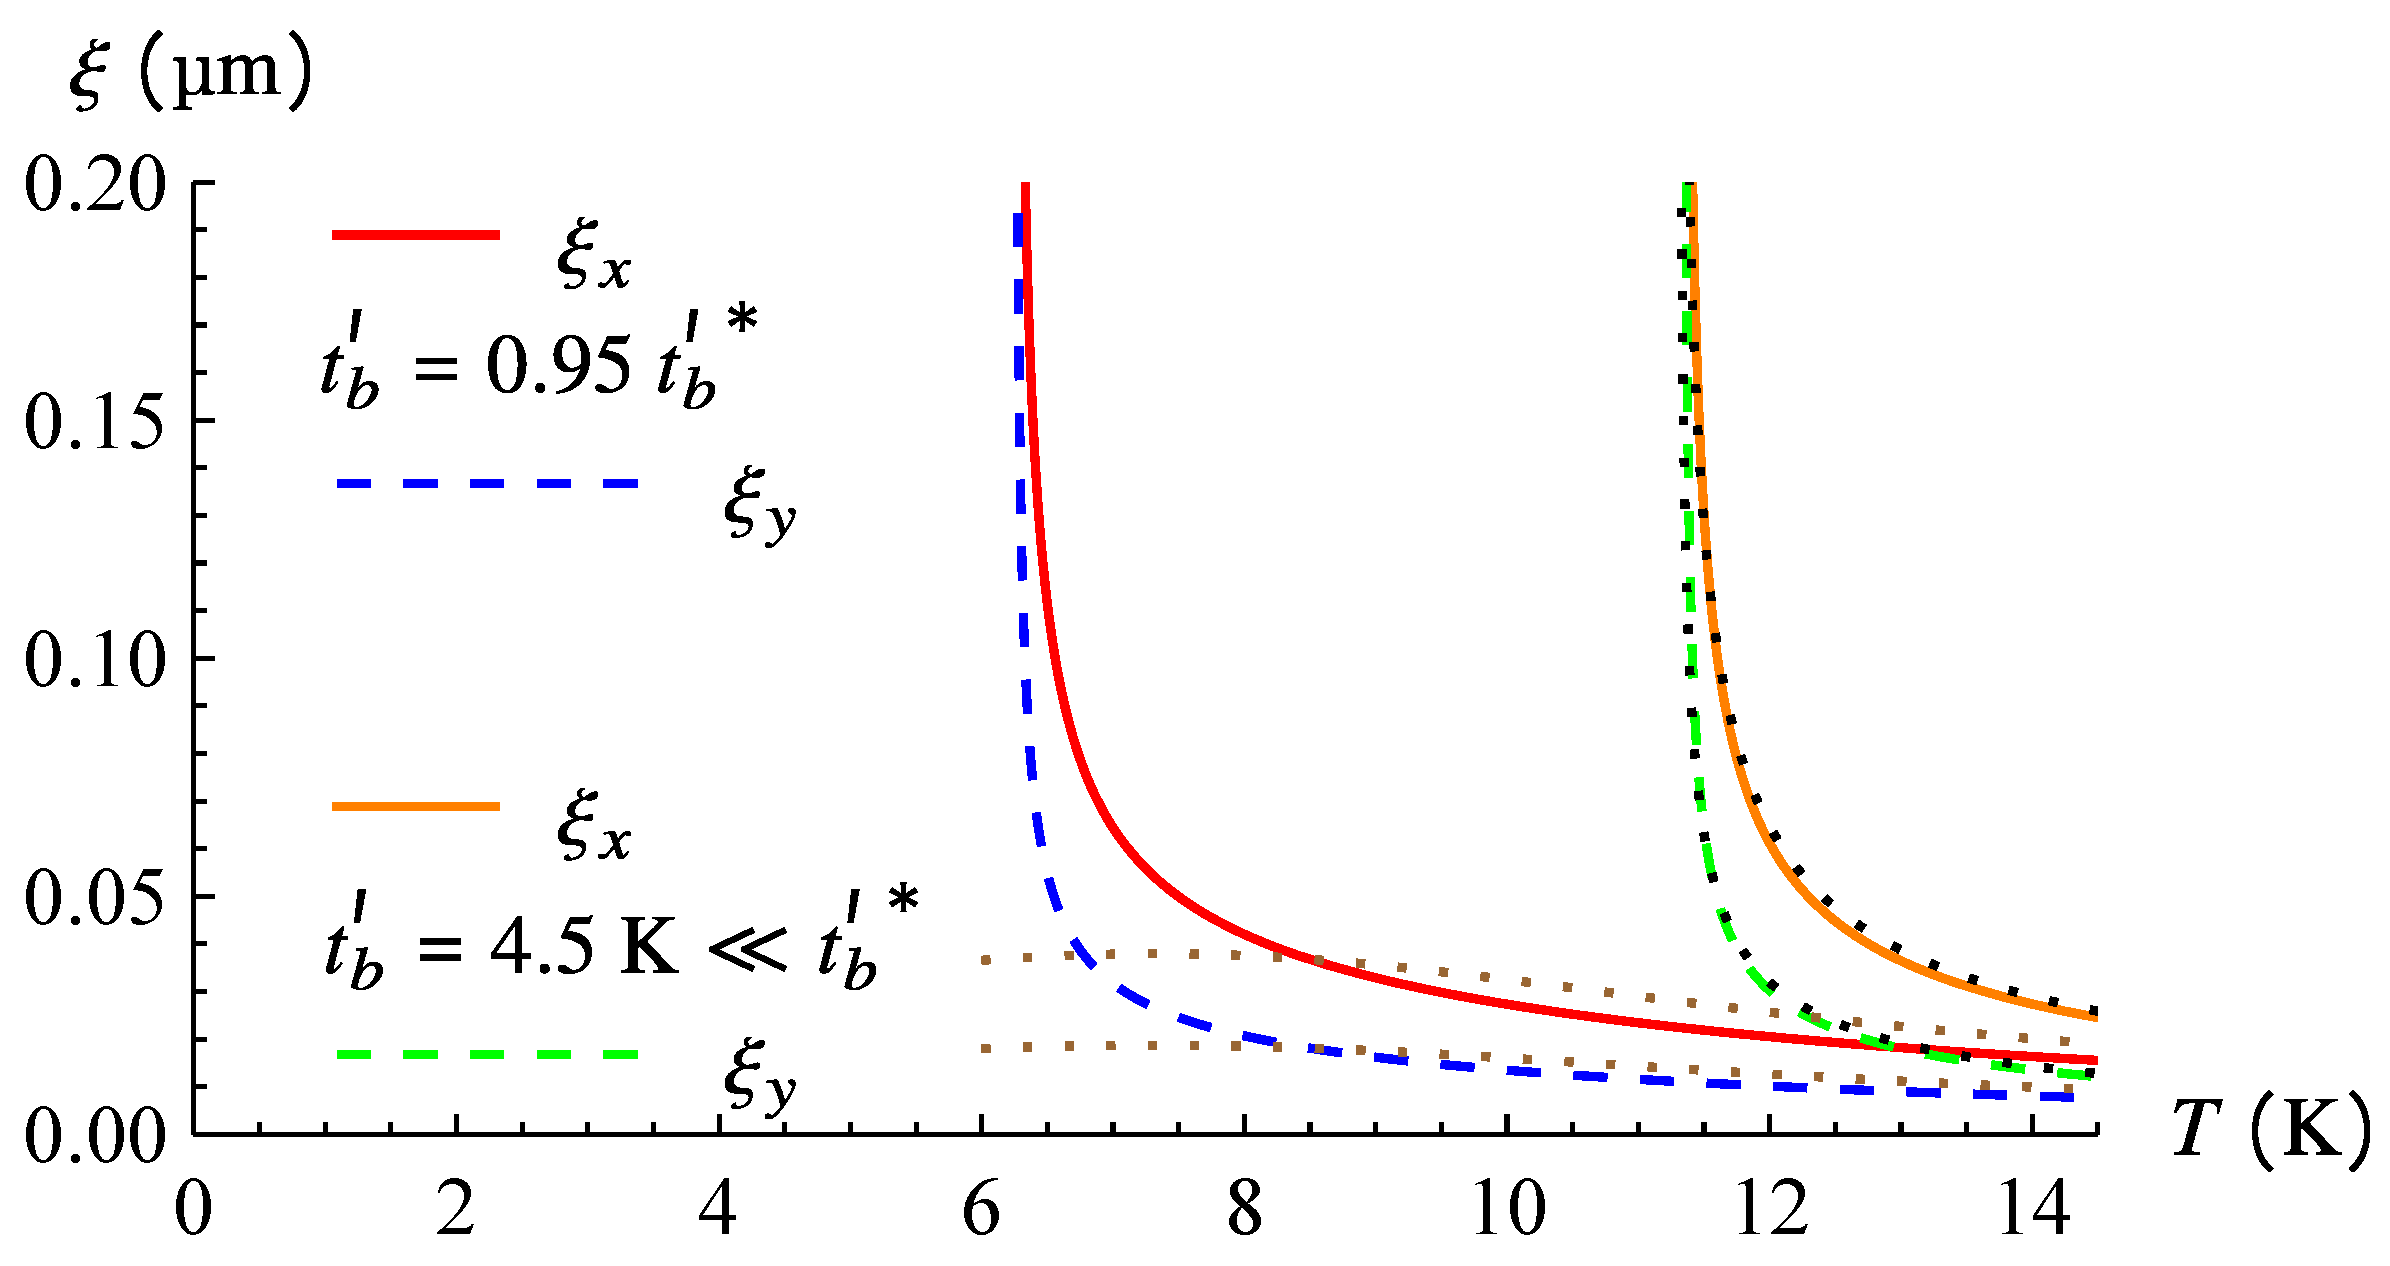
Figure 2 shows ξ x and ξ y as functions of temperature T for two different values of t b : t b 0.42 t b * , corresponding to (TMTSF) 2 PF 6 at ambient pressure [53] (solid orange and dashed green lines), and t b = 0.95 t b * (solid red and dashed blue lines), i.e., close to the quantum critical point at t b = t b * . These curves diverge at T = T c ( t b ) , where A 0 = 0 . This divergence, being a general property of phase transitions, is well known in superconductors. When plotting Figure 2, we used Equations (14) and (15), and the parameters of (TMTSF) 2 PF 6 , i.e., b = 0.767 nm [59] and v F = 10 7 cm/s [52].
At rather high temperatures ( 2 π T ε + t b ), we may expand the digamma function in Equation (10) to a Taylor series near 1 / 2 , which gives
ψ 1 2 Re ψ 1 2 + i ε + ( k , k Q ) 2 π T k y b 2 π π / b π / b d k y ψ ( 2 ) ( 1 / 2 ) ε + 2 ( k , k Q ) 8 π 2 T 2 .
Expanding Equation (11) over q up to the second order and substituting it into Equation (10) after using Equation (16), we obtain the coefficients A i :
A 0 = 4 v F ln T c 0 T + t b 2 4 π 2 T 2 ; A x = 4 v F ψ ( 2 ) 1 2 h 2 v F 2 32 π 2 T 2 ; A y = 4 v F ψ ( 2 ) 1 2 b 2 t b 2 4 t b 2 16 π 2 T 2 .
Substituting them into Equation (15), we derive simple analytical formulas for the SDW coherence lengths, ξ x and ξ y , valid at π T t b :
ξ x = v F 2 2 1 / 4 π 2 T 2 ln ( T c 0 / T ) / ψ ( 2 ) ( 1 / 2 ) + t b 2 ; ξ y = b 2 t b 2 4 t b 2 4 π 2 T 2 ln ( T c 0 / T ) / ψ ( 2 ) ( 1 / 2 ) + t b 2 .
At this limit of π T t b , the ratio of coherent lengths along the y- and x-axes does not depend on temperature:
ξ y ξ x = b v F 2 t b 2 4 t b 2 0.5 .
The temperature dependence of the coherence lengthes ξ x and ξ y given by Equation (18) are shown in Figure 2 by dotted lines. The black dotted curves in Figure 2 are obtained from Equation (18) by setting t b = 4.5 K = 0.42 t b * , corresponding to (TMTSF) 2 PF 6 at ambient pressure [53]. These curves coincide with the result of numerical integration in Equations (14), which confirms the applicability of Equations (17) and (18) with these parameters. From Equation (18), we obtain ξ x 0.06 µm and ξ y 0.03 µm at T = T c 0 = 12.1 K, corresponding to T / T c 1 0.075 . However, at T / T c 1 0.01 , this gives ξ x 0.16 µm and ξ y 0.08 µm.

3.2. Relation between the Coherence Length and Nucleation Size during the First-Order Phase Transition

Despite an extensive study of the phase nucleation process during the first-order phase transition [60,61,62,63], its general quantitative description is still missing. The nucleation rate and size may strongly depend on minor factors relevant to a particular system. The DW–metal or DW–SC phase transitions also have peculiarities, such as a strong dependence on the details of electron dispersion. Nevertheless, one can roughly estimate the lower limit of the nucleus size using the Ginzburg–Landau expansion for DW free energy. The latter gives the energy of a phase nucleus Ω , described by the spatial variation Δ ( r ) of the DW order parameter during the first-order phase transition as
Δ F Ω Ω d 3 r 1 2 A 0 Δ 2 + i A i ( i Δ ) 2 Ω d 3 r A 0 2 Δ 2 + i ( ξ i i Δ ) 2 .
If the nucleus size d i is < 2 ξ i , the second (always positive) gradient term exceeds the first term, which is energetically unfavorable. Hence, the minimal dimensions of phase nucleation during the first-order phase transition is given by the coherence lengths d i > 2 ξ i . The latter diverges at the spinodal line T c ( t b ) of the phase transition where A 0 = 0 , as illustrated in Figure 2 for our DW system. However, the first-order phase transition starts at a slightly different temperature T c 1 , while the spinodal line T c ( t b ) corresponds to the instability of one phase. Hence, for the estimates of nucleus size d i , one should take some finite interval Δ T = T c 1 T c , which is determined by the width of the first-order phase transition. Unfortunately, the latter is unknown and strongly depends on the physical system. In our case, this width Δ T depends on the details of electron dispersion, e.g., on the amplitude of higher harmonics in the electron dispersion given by Equation (2). If we take a reasonable estimate, i.e., Δ T = T c 1 T c 0.01 T c , we obtain the SC domain size d > 2 ξ > 0.3 µm.

3.3. Estimates of Superconducting Island Size from Transport Measurements and the Numerical Calculation of the Current Percolation Threshold

Another method of estimating the average SC island size is based on using the available transport measurements, especially the anisotropy of the SC transition temperature observed in various organic superconductors [20,21,28] and determined from the anisotropic zero-resistance onset in various samples. This anisotropy was explained both in organic superconductors [49] and in mesa structures of FeSe [50] by the direct calculation of the percolation threshold along different axes in samples of various spatial dimensions relevant to experiments. The qualitative idea behind this anisotropy is very simple. As the volume fraction ϕ of the SC phase grows, the isolated clusters of superconducting islands grow and become comparable to the sample size. When the percolation via superconducting islands between the opposite sample boundaries is established, zero resistance sets in. If the sample shape is flat or needle-like, as in organic metals, this percolation first establishes along the shortest sample dimension, when the SC cluster becomes comparable to the sample thickness (see Figure 4a in ref. [49] or Figure 4b in ref. [50] for illustration). With a further increase in the SC volume fraction ϕ , the zero resistance sets in along two axes, and only finally in all three directions, including the sample length.
In infinitely large samples, the percolation threshold is isotropic [64]. Hence, this anisotropy depends on the ratio of the average size d of superconducting islands to the sample size L. This dependence can be used for a qualitative estimate of SC island size d by analyzing the interval of d where the experimental data on conductivity anisotropy are consistent with theoretical calculations.
The algorithm and implementation details of percolation calculations are given in refs. [49,50]. Using this method, we calculated the probability of percolation of a random geometric configuration of superconducting islands in a sample of (TMTSF) 2 PF 6 with typical experimental dimensions of 3 × 0.2 × 0.1 mm 3 [19,20] for various island sizes. For simplicity, the geometry of the islands was taken as spherical.
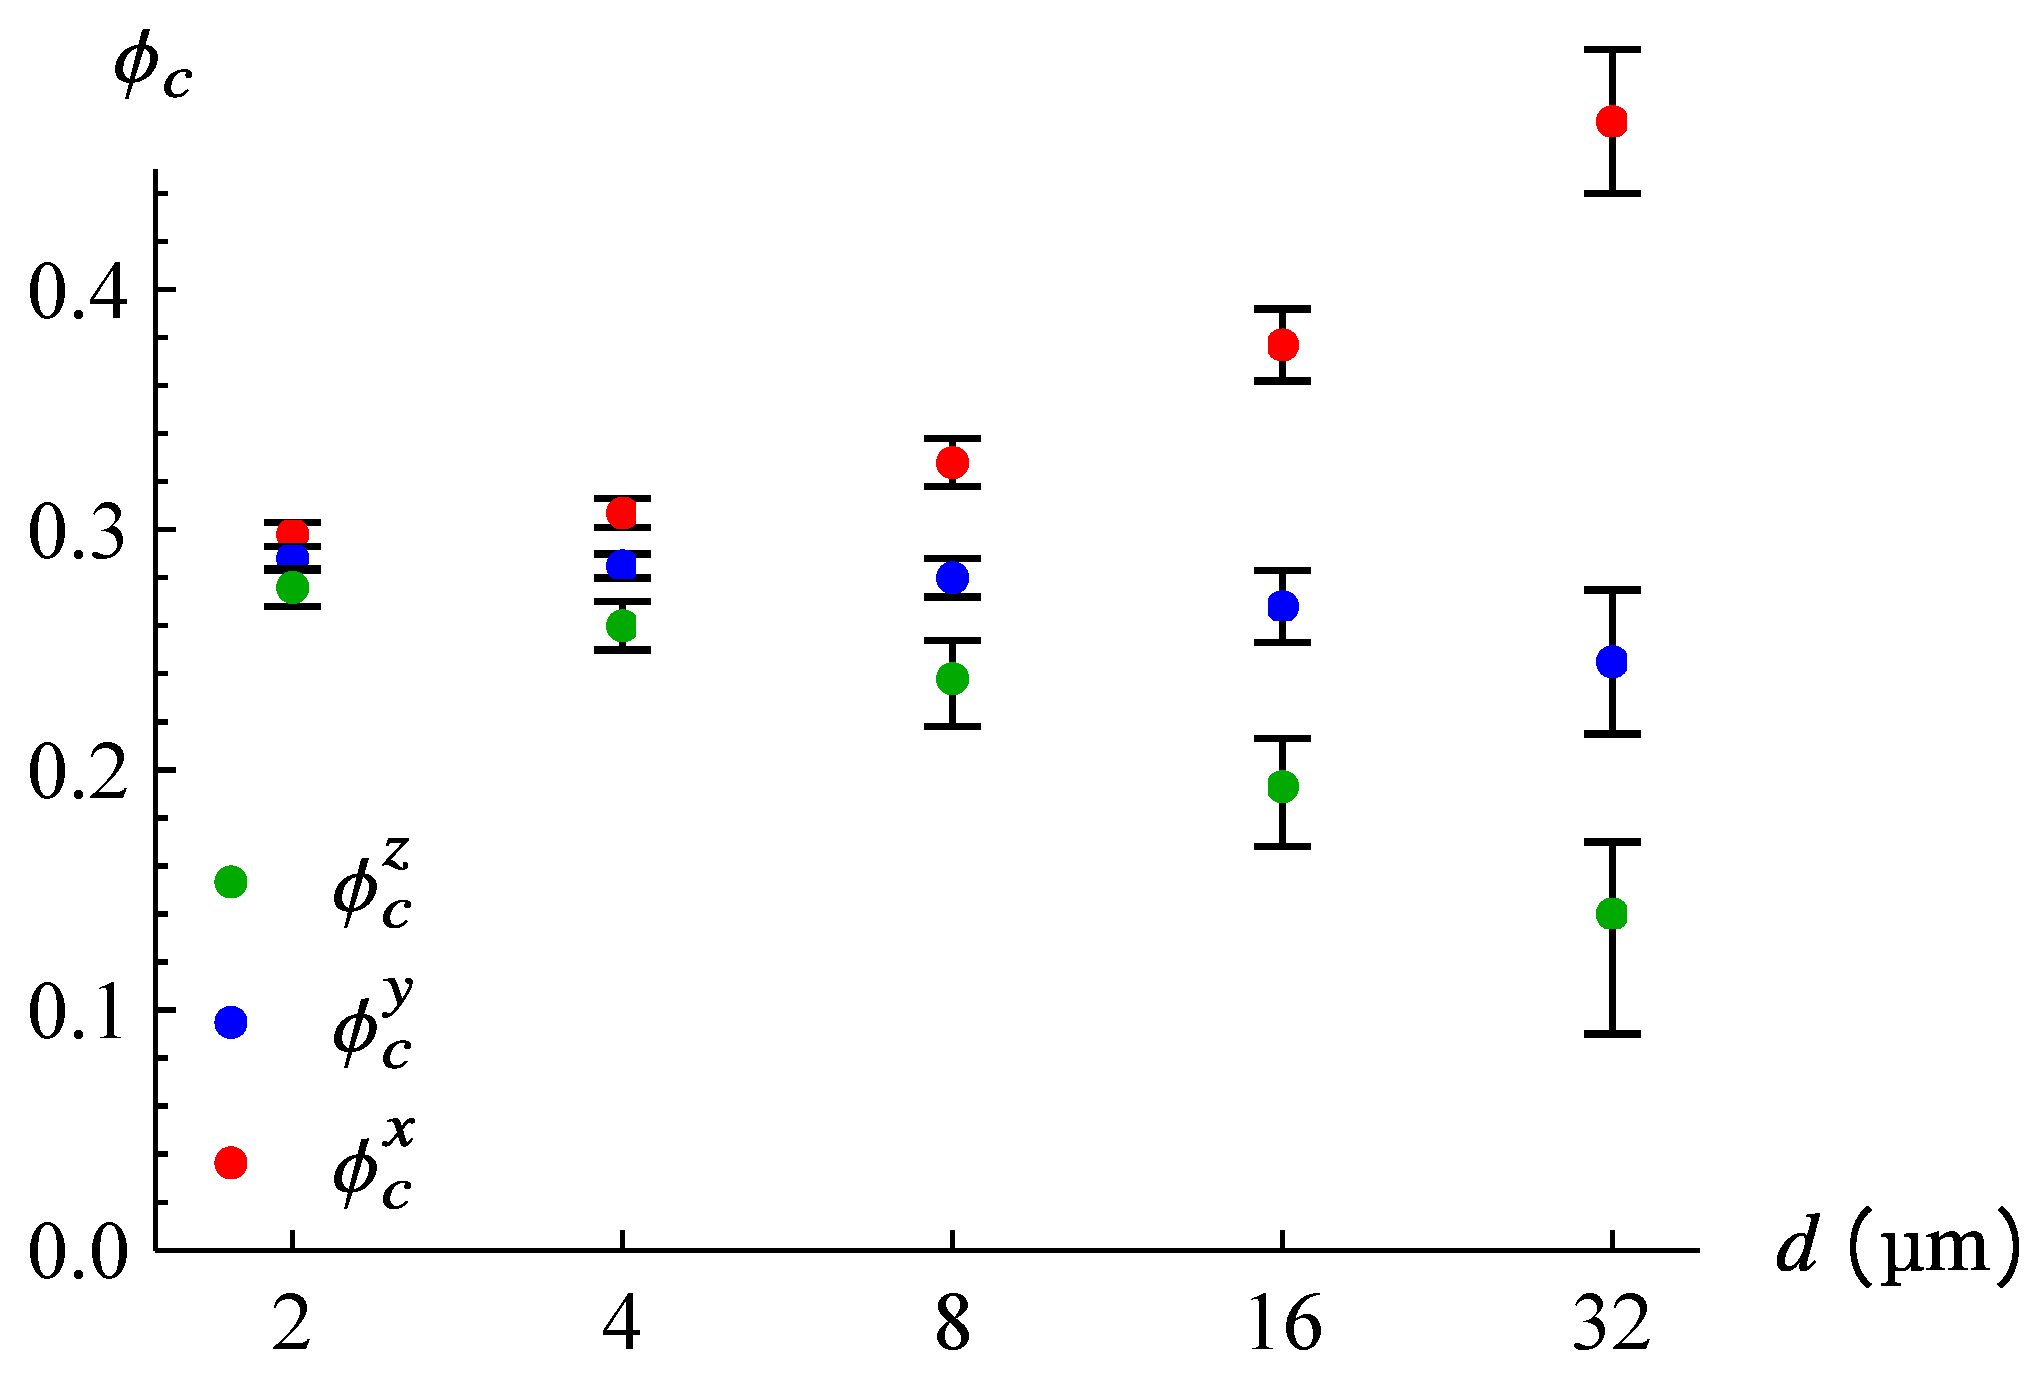
Figure 3 shows the dependence of the percolation threshold ϕ c of the SC phase on the geometric dimensions of the superconducting islands. By the percolation threshold, we mean the SC volume fraction ϕ at which the probability of percolation of a randomly chosen geometrical configuration of islands is 1 / 2 . In order to take into account possible random fluctuations of this SC current percolation, in Figure 3, we also plot the interval of the SC volume fraction ϕ , corresponding to the large interval of percolation probability p ( 0.1 , 0.9 ) and denoted by the error bars. These error bars get bigger with the increase in size d of the spherical islands, because the larger the SC domain size d, the smaller the number N of SC domains required for percolation and hence, the stronger its relative fluctuations δ N / N N 1 / 2 . From Figure 3, we can see that for the sample dimensions used in the experiment [20], the percolation threshold via SC domains is considerably anisotropic, beyond the random fluctuations corresponding to a particular sample realization, if the domain size exceeds 2 µm. For smaller sizes of superconducting islands, the anisotropy is smaller than the “error bar” of ϕ c , corresponding to the fluctuations in the percolation probability p ( 0.1 , 0.9 ) . These error bars get bigger with the increase in the size d of the superconducting islands, because the larger the SC domain size, the smaller the number N of SC domains required for percolation and the stronger the fluctuations in this number δ N / N N 1 / 2 . For d < 2 µm, the percolation thresholds along all three axes converge to the known isotropic percolation threshold in infinite samples ϕ c 0.2895 (see page 253 of ref. [65]).

4. Discussion and Conclusions

The observed strong anisotropy of the SC transition temperature T cSC in (TMTSF) 2 PF 6 [20,21] and (TMTSF) 2 ClO 4 [28] samples of thicknesses of 0.1 mm is consistent with our percolation calculations of the SC domain size of d > 2 µm. These estimates of the SC domain size d agree well with the result that d x > 1 µm, implied by the clear observation of angular magnetoresistance oscillations and of a field-induced SDW in (TMTSF) 2 PF 6 [21] and (TMTSF) 2 ClO 4 [30]. The latter requires that the electron mean free path, l τ , is > l B , where l B = / e B b 1 µm is the so-called quasi-1D magnetic length [21,42]. Hence, all experimental observations agree and suggest an almost macroscopic spatial separation of SC and SDW phases in these organic superconductors.
The above SDW coherence length ξ obtained from the Ginzburg–Landau expansion of the SDW free energy at the first-order SDW–SC phase transition in the organic superconductor (TMTSF) 2 PF 6 gives the SC domain size d > 2 ξ > 0.3 µm. This generally agrees with the experimental estimates of d > 1 µm, but gives a too weak limitation because of the following three possible reasons:
(1)
The SC proximity effect [47]: The SC order parameter is nonzero not only in the SC domains themselves, but also in shells of width δ d ξ S C around these SC domains. The SC coherence length ξ S C v F / π Δ SC diverges near the SC transition temperature T cSC , and even far from T cSC 1 K in organic superconductors δ d x ξ S C v F / π T c S C 0.3 µm. Hence, the resulting size of SC domains with this proximity effect shell is d x 2 ( ξ S C + ξ ) 1 µm, which well agrees with experimental data.
(2)
The clusterization of superconducting islands with the formation of larger SC domains, glued by the Josephson junction: In current percolation and zero-frequency transport measurements, such a cluster is seen as a single SC domain. Since the SDW–SC transition is observed close to the SC percolation threshold (the SC volume fraction of ϕ c > 0.1 ), the formation of such SC clusters is very probable. Note that such clusterization may also explain the small difference between the estimates of the SC domain size from AMRO data and from current percolation.
(3)
An oversimplified physical model: In our percolation calculations, we take all clusters of the same size, because the actual size distribution of superconducting islands is unknown. In addition, special types of disorder, such as local variations in (chemical) pressure, affect the SC–SDW balance.
The size of isolated SC domains allows an independent approximate measurement of the diamagnetic response. The diamagnetic response of small SC grains of size d λ , where λ is the penetration depth of magnetic field into the superconductor, strongly depends on the d / λ [47] ratio. Note that this penetration depth in layered superconductors is anisotropic. Since the SC volume fraction ϕ is approximately known from the transport measurements and from the percolation threshold, by measuring the diamagnetic response at ϕ < ϕ c for three main orientations of a magnetic field B and comparing it with the susceptibility χ = ϕ / ( 4 π ) of large SC domains of volume fraction ϕ , one may roughly estimate the SC domain size along all three axes. A similar diamagnetic response in combination with transport measurements was used in FeSe to estimate the size and shape of superconducting islands above T cSC [66,67]. A similar combined analysis of the diamagnetic response and transport measurements has also been used to obtain information about the SC domain size and shape above T cSC in another organic superconductor, β -(BEDT-TTF) 2 I 3 [68].
Spatial phase segregation may also happen near the quantum critical point of the Mott-AFM metal–insulator phase transition, e.g., as observed in the κ -(BEDT-TTF) 2 X family of organic superconductors [69,70,71,72]. The observation of clear magnetic quantum oscillations [71,72] in the almost insulating phase of these materials indicates a rather large size d of metal/SC domains in the Mott insulator media, comparable to the electron cyclotron radius. Although the first of our methods, based on the Ginzburg–Landau SDW free energy expansion, is not applicable in this case, our second method [49,50], based on the calculation of percolation anisotropy in finite-sized samples, should work well and give valuable information about the shape and size of metal/SC domains.
The obtained, almost macroscopic spatial SDW–SC phase separation on a scale of d 1 µm implies a rather weak influence of the SDW quantum critical point on SC coupling. Indeed, while in cuprate high- T c superconductors [5,31,73,74,75,76] and in transition metal dichalcogenides [1,2,3] the SC–DW coexistence is more “microscopic” and the corresponding T cSC enhancement is several-fold, in organic superconductors, the T cSC enhancement by quantum criticality is rather weak, at 10 %. Note that in iron-based high- T c superconductors [11,12], e.g., in FeSe, the T cSC enhancement by quantum criticality is also rather weak, at 10 %. A comparison of the observed [50,77] T cSC anisotropy in thin FeSe mesa structures of various thicknesses with the numerical calculations of percolation anisotropy in finite-sized samples [50], similar to that in Section 3.3, suggests that the SC domain size in FeSe is also rather large, at d 0.1 µm, close to the nematic domain width in this compound. Hence, similar to organic superconductors, in FeSe and other iron-based high- T c superconductors, the large size of SC domains reduces the SC enhancement by critical fluctuations. This observation may give a hint about raising the transition temperature in high- T c superconductors, which are always spatially inhomogeneous. The knowledge of the parameters of SC domains also helps to estimate and even propose possible methods to increase the upper critical field and critical current in such heterogeneous superconductors, considered as a network of SC nanoclusters linked by Josephson junctions [75,78].
To summarize, we have shown that the scenario in which the first-order phase transition results in the spatial phase separation of SC and SDW in organic superconductors is self-consistent and also agrees with the available experimental data. We estimated the size of SC domains d by two different methods. This estimate of d > 1 µm is consistent with various transport measurements, including the anisotropic zero resistance onset in thin samples [20,21,28] and with angular magnetoresistance oscillations and magnetic-field-induced spin-density waves [21,30]. We also discuss the relevance of our results, obtained for organic superconductors, to high- T c superconductors, and why the knowledge of SC domain parameters is important for increasing the transition temperature, the critical magnetic field H c 2 and the critical current density in various heterogeneous superconductors.

Author Contributions

Conceptualization, P.D.G.; methodology, P.D.G. and V.D.K.; software, V.D.K.; validation, V.D.K. and S.S.S.; formal analysis, V.D.K.; investigation, V.D.K. and P.D.G.; writing—original draft preparation, V.D.K.; writing—review and editing, P.D.G. and S.S.S.; supervision, P.D.G. All authors have read and agreed to the published version of the manuscript.

Funding

V.D.K. acknowledges the Foundation for the Advancement of Theoretical Physics and Mathematics “Basis” for grant # 22-1-1-24-1, and the RFBR grant # 21-52-12027. The work of S.S.S. was supported by the NUST “MISIS” grant no. K2-2022-025 in the framework of the federal academic leadership program Priority 2030. P.D.G. acknowledges the State assignment # 0033-2019-0001 and the RFBR grant # 21-52-12043.

Institutional Review Board Statement

Not applicable.

Informed Consent Statement

Not applicable.

Data Availability Statement

Data will be provided on request.

Conflicts of Interest

The authors declare no conflict of interest.

Appendix A. Mean-Field Theory for DW

The electronic Hamiltonian consists of the free-electron part H 0 and the interaction part H int :
H = H 0 + H int , H 0 = k ε ( k ) a k a k , H int = 1 2 k k Q V Q a k + Q a k a k Q a k .
We consider the interactions at the wave vector Q close to the nesting vector Q 0 = ( ± 2 k F , π / b ) . If the deviations from Q 0 are small, we can approximate the interaction function as V ( Q ) V ( Q 0 ) = U . In the case of CDW, U is the charge coupling constant, while for a SDW, U denotes the spin coupling constant. Next, in the mean-field approximation, we introduce the order parameter
Δ Q = 2 U k g ( k Q , k , 0 ) , g ( k , k , τ τ ) = T τ a k ( τ ) a k ( τ ) .
Then, the final mean-field Hamiltonian, which we will study further, is
H int = k Q Δ Q a k + Q a k + H.c. + const .
The factor of 2 in Equations (A2) and (A7) comes from the summation over two spin components. The operators a k + Q and a k correspond to the same spin component for a CDW, and to different spin components for an SDW. From Equations (A1) and (A3), using the standard equation for the operator evolution, i d A ^ / d t = A ^ , H ^ , one obtains the equations of motion for the Fourier transform of the Green’s function g ( k , k , τ τ ) = d ω / ( 2 π ) e i ω τ τ g ( k , k , ω ) :
[ i ω ε ( k ) ] g ( k , k , ω ) Q Δ Q g ( k , k , ω ) = δ k , k .
In the metallic phase, Δ Q , given by Equation (A2), vanishes after the thermodynamic averaging denoted by triangular brackets in Equation (A2). If the DW at wave vector Q 0 is formed, the order parameter Δ Q 0 for Q = Q 0 , while for Q Q 0 , the average Δ Q = 0 . The spatial variation in the order parameter Δ r = d 3 q / ( 2 π ) Δ q e i q · r is described by the deviation q = Q Q 0 of the DW wave vector Q from its value Q 0 , corresponding to the maximum susceptibility. If we now set Δ Q 1 = Δ δ Q 1 , ± Q , where Q = Q 0 + q with | q | k F , the equations of motion (A4) can be solved, giving
g ( k Q , k , ω ) = Δ Q ( ω + i ε + ) 2 + ε 2 + | Δ Q | 2 ,
where ε ± = ε ± ( k , k Q ) are given by Equation (4). From Equations (A2) and (A5), we obtain the self-consistency Equation (7), omitting the subscript Q in Δ Q :
Δ = T U k ω Δ ( ω + i ε + ) 2 + ε 2 + | Δ | 2 .
The mean-field Hamiltonian given by Equations (A1) and (A3) decouples to a sum over k of 2 × 2 matrices. Their diagonalization gives the new quasiparticle dispersion given by Equation (3). Hence, the order parameter Δ Q defined in Equation (A2) has the physical meaning of the DW energy gap for the case of perfect nesting. One could define the order parameter in a different way as
n Q = Δ Q U = 2 k T τ a k ( τ ) a k ( τ ) ,
which has the physical meaning of electron density n Q at wave vector Q . The latter couples to the external potential V Q at the same wave vector in the Hamiltonian: δ H = δ F = Q n Q V Q . The equilibrium value of the DW order parameter Δ Q = U n Q in the presence of an external field V Q can be obtained from the minimization of the total free energy F t o t = F + δ F , where the free energy F without an external field is given by Equation (5) at Δ Q 0 :
F t o t n Q = V Q + U F Δ Q = 0 ,
or
V Q + U 2 n Q A T , Q + B Δ Q 2 + = 0 .
Hence, the electronic susceptibility just above the DW phase transition temperature T cDW , where Δ Q = 0 , is related to the coefficient A T , Q > 0 of the Landau–Ginzburg expansion:
χ Q = n Q V Q = 1 A T , Q U 2 .
At the DW transition temperature T = T cDW , the coefficient A T , Q = 0 for some Q . Hence, the DW wave vector Q corresponds to the minimum of A T cDW , Q or to the maximum of susceptibility χ Q in Equation (A10). Near this extremum, one can expand Equation (A10) over the deviation q = Q Q 0 of the DW wave vector Q from its optimal value Q 0 :
χ Q = χ Q 0 1 + ξ 2 q 2 ,
which gives the estimate of the DW coherence length ξ .
Below the phase transition temperature T cDW , Equation (A9) gives
χ 1 Q = U 2 A T , Q + B Δ 2 + C Δ 4 + . . ,
which corresponds to a finite Δ Q at vanishing V Q . Nevertheless, one can find the differential susceptibility
χ 1 Q = d V Q d n Q = 2 F n Q 2 = U 2 2 F Δ Q 2 ,
which generalizes Equation (A10).

References

  1. Gabovich, A.M.; Voitenko, A.I.; Annett, J.F.; Ausloos, M. Charge- and spin-density-wave superconductors. Supercond. Sci. Technol. 2001, 14, R1–R27. [Google Scholar] [CrossRef]
  2. Gabovich, A.M.; Voitenko, A.I.; Ausloos, M. Charge- and spin-density waves in existing superconductors: Competition between Cooper pairing and Peierls or excitonic instabilities. Phys. Rep. 2002, 367, 583–709. [Google Scholar] [CrossRef]
  3. Monceau, P. Electronic crystals: An experimental overview. Adv. Phys. 2012, 61, 325–581. [Google Scholar] [CrossRef] [Green Version]
  4. Grüner, G. Density Waves in Solids; CRC Press: Boca Raton, FL, USA, 2000. [Google Scholar] [CrossRef]
  5. Chang, J.; Blackburn, E.; Holmes, A.; Christensen, N.; Larsen, J.; Mesot, J.; Liang, R.; Bonn, D.; Hardy, W.; Watenphul, A.; et al. Direct observation of competition between superconductivity and charge density wave order in YBa2Cu3O6.67. Nat. Phys. 2012, 8, 871–876. [Google Scholar] [CrossRef] [Green Version]
  6. Blanco-Canosa, S.; Frano, A.; Loew, T.; Lu, Y.; Porras, J.; Ghiringhelli, G.; Minola, M.; Mazzoli, C.; Braicovich, L.; Schierle, E.; et al. Momentum-Dependent Charge Correlations in YBa2Cu3O6+δ Superconductors Probed by Resonant X-ray Scattering: Evidence for Three Competing Phases. Phys. Rev. Lett. 2013, 110, 187001. [Google Scholar] [CrossRef] [Green Version]
  7. Tabis, W.; Yu, B.; Bialo, I.; Bluschke, M.; Kolodziej, T.; Kozlowski, A.; Blackburn, E.; Sen, K.; Forgan, E.; Zimmermann, M.; et al. Synchrotron x-ray scattering study of charge-density-wave order in HgBa2CuO4+δ. Phys. Rev. B 2017, 96, 134510. [Google Scholar] [CrossRef] [Green Version]
  8. Tabis, W.; Li, Y.; Tacon, M.L.; Braicovich, L.; Kreyssig, A.; Minola, M.; Dellea, G.; Weschke, E.; Veit, M.J.; Ramazanoglu, M.; et al. Charge order and its connection with Fermi-liquid charge transport in a pristine high-Tc cuprate. Nat. Commun. 2014, 5, 5875. [Google Scholar] [CrossRef]
  9. da Silva Neto, E.H.; Comin, R.; He, F.; Sutarto, R.; Jiang, Y.; Greene, R.L.; Sawatzky, G.A.; Damascelli, A. Charge ordering in the electron-doped superconductor Nd2−xCexCuO4. Science 2015, 347, 282–285. [Google Scholar] [CrossRef] [Green Version]
  10. Wen, J.J.; Huang, H.; Lee, S.J.; Jang, H.; Knight, J.; Lee, Y.S.; Fujita, M.; Suzuki, K.M.; Asano, S.; Kivelson, S.A.; et al. Observation of two types of charge-density-wave orders in superconducting La2−xSrxCuO4. Nat. Commun. 2019, 10, 3269. [Google Scholar] [CrossRef] [Green Version]
  11. Si, Q.; Yu, R.; Abrahams, E. High-temperature superconductivity in iron pnictides and chalcogenides. Nat. Rev. Mater. 2016, 1, 16017. [Google Scholar] [CrossRef] [Green Version]
  12. Liu, X.; Zhao, L.; He, S.; He, J.; Liu, D.; Mou, D.; Shen, B.; Hu, Y.; Huang, J.; Zhou, X.J. Electronic structure and superconductivity of FeSe-related superconductors. J. Phys. Condens. Matter 2015, 27, 183201. [Google Scholar] [CrossRef] [PubMed] [Green Version]
  13. Ishiguro, T.; Yamaji, K.; Saito, G. Organic Superconductors; Springer: Berlin/Heidelberg, Germany, 1998. [Google Scholar] [CrossRef]
  14. Lebed, A. (Ed.) The Physics of Organic Superconductors and Conductors; Springer: Berlin/Heidelberg, Germany, 2008. [Google Scholar] [CrossRef]
  15. Naito, T. Modern History of Organic Conductors: An Overview. Crystals 2021, 11, 838. [Google Scholar] [CrossRef]
  16. Yasuzuka, S.; Murata, K. Recent progress in high-pressure studies on organic conductors. Sci. Technol. Adv. Mater. 2009, 10, 024307. [Google Scholar] [CrossRef] [PubMed]
  17. Clay, R.; Mazumdar, S. From charge- and spin-ordering to superconductivity in the organic charge-transfer solids. Phys. Rep. 2019, 788, 1–89. [Google Scholar] [CrossRef] [Green Version]
  18. Lee, I.J.; Chaikin, P.M.; Naughton, M.J. Critical Field Enhancement near a Superconductor-Insulator Transition. Phys. Rev. Lett. 2002, 88, 207002. [Google Scholar] [CrossRef]
  19. Vuletić, T.; Auban-Senzier, P.; Pasquier, C.; Tomić, S.; Jérome, D.; Héritier, M.; Bechgaard, K. Coexistence of superconductivity and spin density wave orderings in the organic superconductor (TMTSF)2PF6. Eur. Phys. J. B 2002, 25, 319–331. [Google Scholar] [CrossRef] [Green Version]
  20. Kang, N.; Salameh, B.; Auban-Senzier, P.; Jerome, D.; Pasquier, C.R.; Brazovskii, S. Domain walls at the spin-density-wave endpoint of the organic superconductor (TMTSF)2PF6 under pressure. Phys. Rev. B 2010, 81, 100509(R). [Google Scholar] [CrossRef] [Green Version]
  21. Narayanan, A.; Kiswandhi, A.; Graf, D.; Brooks, J.; Chaikin, P. Coexistence of Spin Density Waves and Superconductivity in (TMTSF)2PF6. Phys. Rev. Lett. 2014, 112, 146402. [Google Scholar] [CrossRef]
  22. Lee, I.J.; Brown, S.E.; Yu, W.; Naughton, M.J.; Chaikin, P.M. Coexistence of Superconductivity and Antiferromagnetism Probed by Simultaneous Nuclear Magnetic Resonance and Electrical Transport in (TMTSF)2PF6 System. Phys. Rev. Lett. 2005, 94, 197001. [Google Scholar] [CrossRef] [Green Version]
  23. Lee, I.J.; Naughton, M.J.; Danner, G.M.; Chaikin, P.M. Anisotropy of the Upper Critical Field in (TMTSF)2PF6. Phys. Rev. Lett. 1997, 78, 3555–3558. [Google Scholar] [CrossRef]
  24. Lee, I.J.; Brown, S.E.; Clark, W.G.; Strouse, M.J.; Naughton, M.J.; Kang, W.; Chaikin, P.M. Triplet Superconductivity in an Organic Superconductor Probed by NMR Knight Shift. Phys. Rev. Lett. 2001, 88, 017004. [Google Scholar] [CrossRef] [PubMed]
  25. Andres, D.; Kartsovnik, M.V.; Biberacher, W.; Neumaier, K.; Schuberth, E.; Muller, H. Superconductivity in the charge-density-wave state of the organic metalα-(BEDT-TTF)2KHg(SCN)4. Phys. Rev. B 2005, 72, 174513. [Google Scholar] [CrossRef] [Green Version]
  26. Itoi, M.; Nakamura, T.; Uwatoko, Y. Pressure-Induced Superconductivity of the Quasi-One-Dimensional Organic Conductor (TMTTF)2TaF6. Materials 2022, 15, 4638. [Google Scholar] [CrossRef] [PubMed]
  27. Cho, K.; Kończykowski, M.; Teknowijoyo, S.; Tanatar, M.; Guss, J.; Gartin, P.; Wilde, J.; Kreyssig, A.; McQueeney, R.; Goldman, A.; et al. Using controlled disorder to probe the interplay between charge order and superconductivity in NbSe2. Nat. Commun. 2018, 9, 2796. [Google Scholar] [CrossRef] [Green Version]
  28. Gerasimenko, Y.A.; Sanduleanu, S.V.; Prudkoglyad, V.A.; Kornilov, A.V.; Yamada, J.; Qualls, J.S.; Pudalov, V.M. Coexistence of superconductivity and spin-density wave in(TMTSF)2ClO4: Spatial structure of the two-phase state. Phys. Rev. B 2014, 89, 054518. [Google Scholar] [CrossRef] [Green Version]
  29. Yonezawa, S.; Marrache-Kikuchi, C.A.; Bechgaard, K.; Jerome, D. Crossover from impurity-controlled to granular superconductivity in (TMTSF)2ClO4. Phys. Rev. B 2018, 97, 014521. [Google Scholar] [CrossRef] [Green Version]
  30. Gerasimenko, Y.A.; Prudkoglyad, V.A.; Kornilov, A.V.; Sanduleanu, S.V.; Qualls, J.S.; Pudalov, V.M. Role of anion ordering in the coexistence of spin-density-wave and superconductivity in (TMTSF)2ClO4. JETP Lett. 2013, 97, 419–424. [Google Scholar] [CrossRef] [Green Version]
  31. Wang, Y.; Chubukov, A.V. Enhancement of superconductivity at the onset of charge-density-wave order in a metal. Phys. Rev. B 2015, 92, 125108. [Google Scholar] [CrossRef] [Green Version]
  32. Armitage, N.P.; Fournier, P.; Greene, R.L. Progress and perspectives on electron-doped cuprates. Rev. Mod. Phys. 2010, 82, 2421–2487. [Google Scholar] [CrossRef]
  33. Helm, T.; Kartsovnik, M.V.; Proust, C.; Vignolle, B.; Putzke, C.; Kampert, E.; Sheikin, I.; Choi, E.S.; Brooks, J.S.; Bittner, N.; et al. Correlation between Fermi surface transformations and superconductivity in the electron-doped high-Tc superconductor Nd2−xCexCuO4. Phys. Rev. B 2015, 92, 094501. [Google Scholar] [CrossRef] [Green Version]
  34. Mukuda, H.; Fujii, T.; Ohara, T.; Harada, A.; Yashima, M.; Kitaoka, Y.; Okuda, Y.; Settai, R.; Onuki, Y. Enhancement of Superconducting Transition Temperature due to the Strong Antiferromagnetic Spin Fluctuations in the Noncentrosymmetric Heavy–Fermion Superconductor CeIrSi3: A 29Si NMR Study under Pressure. Phys. Rev. Lett. 2008, 100, 107003. [Google Scholar] [CrossRef] [PubMed] [Green Version]
  35. Manago, M.; Kitagawa, S.; Ishida, K.; Deguchi, K.; Sato, N.K.; Yamamura, T. Enhancement of superconductivity by pressure-induced critical ferromagnetic fluctuations in UCoGe. Phys. Rev. B 2019, 99, 020506. [Google Scholar] [CrossRef] [Green Version]
  36. Eckberg, C.; Campbell, D.J.; Metz, T.; Collini, J.; Hodovanets, H.; Drye, T.; Zavalij, P.; Christensen, M.H.; Fernandes, R.M.; Lee, S.; et al. Sixfold enhancement of superconductivity in a tunable electronic nematic system. Nat. Phys. 2020, 16, 346–350. [Google Scholar] [CrossRef] [PubMed] [Green Version]
  37. Mukasa, K.; Ishida, K.; Imajo, S.; Qiu, M.; Saito, M.; Matsuura, K.; Sugimura, Y.; Liu, S.; Uezono, Y.; Otsuka, T.; et al. Enhanced Superconducting Pairing Strength near a Pure Nematic Quantum Critical Point. Phys. Rev. X 2023, 13, 011032. [Google Scholar] [CrossRef]
  38. Tanaka, Y.; Kuroki, K. Microscopic theory of spin-triplet f-wave pairing in quasi-one-dimensional organic superconductors. Phys. Rev. B 2004, 70, 060502. [Google Scholar] [CrossRef] [Green Version]
  39. Gor’kov, L.P.; Grigoriev, P.D. Nature of the superconducting state in the new phase in (TMTSF)2PF6 under pressure. Phys. Rev. B 2007, 75, 020507(R). [Google Scholar] [CrossRef] [Green Version]
  40. Grigoriev, P.D. Properties of superconductivity on a density wave background with small ungapped Fermi surface parts. Phys. Rev. B 2008, 77, 224508. [Google Scholar] [CrossRef] [Green Version]
  41. Ramazashvili, R.; Grigoriev, P.D.; Helm, T.; Kollmannsberger, F.; Kunz, M.; Biberacher, W.; Kampert, E.; Fujiwara, H.; Erb, A.; Wosnitza, J.; et al. Experimental evidence for Zeeman spin–orbit coupling in layered antiferromagnetic conductors. Npj Quantum Mater. 2021, 6, 11. [Google Scholar] [CrossRef]
  42. Kartsovnik, M.V. High Magnetic Fields: A Tool for Studying Electronic Properties of Layered Organic Metals. Chem. Rev. 2004, 104, 5737–5782. [Google Scholar] [CrossRef]
  43. Brazovskii, S.; Kirova, N. Electron selflocalization and superstructures in quasi one-dimensional dielectrics. Sov. Sci. Rev. A 1984, 5, 99–166. [Google Scholar]
  44. Su, W.P.; Kivelson, S.; Schrieffer, J.R. Theory of Polymers Having Broken Symmetry Ground States. In Physics in One Dimension; Bernascony, J., Schneider, T., Eds.; Springer Series in Solid-State Sciences; Springer: Berlin/Heidelberg, Germany, 1981; pp. 201–211. [Google Scholar] [CrossRef]
  45. Grigoriev, P.D. Superconductivity on the density-wave background with soliton-wall structure. Phys. B 2009, 404, 513–516. [Google Scholar] [CrossRef] [Green Version]
  46. Gor’kov, L.P.; Grigoriev, P.D. Soliton phase near antiferromagnetic quantum critical point in Q1D conductors. Europhys. Lett. 2005, 71, 425–430. [Google Scholar] [CrossRef] [Green Version]
  47. Tinkham, M. Introduction to Superconductivity, 2nd ed.; International Series in Pure and Applied Physics; McGraw-Hill, Inc.: New York, NY, USA, 1996. [Google Scholar]
  48. Pratt, F.L.; Lancaster, T.; Blundell, S.J.; Baines, C. Low-Field Superconducting Phase of (TMTSF)2ClO4. Phys. Rev. Lett. 2013, 110, 107005. [Google Scholar] [CrossRef] [PubMed] [Green Version]
  49. Kochev, V.D.; Kesharpu, K.K.; Grigoriev, P.D. Anisotropic zero-resistance onset in organic superconductors. Phys. Rev. B 2021, 103, 014519. [Google Scholar] [CrossRef]
  50. Grigoriev, P.D.; Kochev, V.D.; Orlov, A.P.; Frolov, A.V.; Sinchenko, A.A. Inhomogeneous Superconductivity Onset in FeSe Studied by Transport Properties. Materials 2023, 16, 1840. [Google Scholar] [CrossRef]
  51. Seidov, S.S.; Kochev, V.D.; Grigoriev, P.D. First-order phase transition between superconductivity and charge/spin-density wave as the reason of their coexistence in organic metals. arXiv 2023, arXiv:2305.06957. [Google Scholar] [CrossRef]
  52. Valfells, S.; Brooks, J.S.; Wang, Z.; Takasaki, S.; Yamada, J.; Anzai, H.; Tokumoto, M. Quantum Hall transitions in (TMTSF)2PF6. Phys. Rev. B 1996, 54, 16413–16416. [Google Scholar] [CrossRef] [PubMed] [Green Version]
  53. Danner, G.M.; Chaikin, P.M.; Hannahs, S.T. Critical imperfect nesting in (TMTSF)2PF6. Phys. Rev. B 1996, 53, 2727–2731. [Google Scholar] [CrossRef] [PubMed]
  54. Araki, C.; Itoi, M.; Hedo, M.; Uwatoko, Y.; Mori, H. Electrical Resistivity of (TMTSF)2PF6 under High Pressure. J. Phys. Soc. Jpn. 2007, 76, 198–199. [Google Scholar] [CrossRef]
  55. Auban-Senzier, P.; Pasquier, C.; Jérome, D.; Carcel, C.; Fabre, J. From Mott insulator to superconductivity in (TMTTF)2BF4: High pressure transport measurements. Synth. Met. 2003, 133–134, 11–14. [Google Scholar] [CrossRef]
  56. Horovitz, B.; Gutfreund, H.; Weger, M. Interchain coupling and the Peierls transition in linear-chain systems. Phys. Rev. B 1975, 12, 3174–3185. [Google Scholar] [CrossRef]
  57. McKenzie, R.H. Microscopic theory of the pseudogap and Peierls transition in quasi-one-dimensional materials. Phys. Rev. B 1995, 52, 16428–16442. [Google Scholar] [CrossRef] [PubMed] [Green Version]
  58. Grigoriev, P.D.; Lyubshin, D.S. Phase diagram and structure of the charge-density-wave state in a high magnetic field in quasi-one-dimensional materials: A mean-field approach. Phys. Rev. B 2005, 72, 195106. [Google Scholar] [CrossRef]
  59. Kim, J.; Yun, M.; Jeong, D.W.; Kim, J.J.; Lee, I. Structural and Electrical Properties of the Single-crystal Organic Semiconductor Tetramethyltetraselenafulvalene (TMTSF). J. Korean Phys. Soc. 2009, 55, 212–216. [Google Scholar] [CrossRef]
  60. Oxtoby, D.W. Nucleation of First-Order Phase Transitions. Acc. Chem. Res. 1998, 31, 91–97. [Google Scholar] [CrossRef]
  61. Umantsev, A. Field Theoretic Method in Phase Transformations; Lecture Notes in Physics; Springer: New York, NY, USA, 2012. [Google Scholar] [CrossRef] [Green Version]
  62. Kalikmanov, V. Nucleation Theory; Lecture Notes in Physics; Springer: Dordrecht, The Netherlands, 2012. [Google Scholar]
  63. Karthika, S.; Radhakrishnan, T.K.; Kalaichelvi, P. A Review of Classical and Nonclassical Nucleation Theories. Cryst. Growth Des. 2016, 16, 6663–6681. [Google Scholar] [CrossRef]
  64. Efros, A.L. Physics and Geometry of Disorder: Percolation Theory; Science for Everyone; Mir Publishers: Moscow, Russia, 1987. [Google Scholar]
  65. Torquato, S. Random Heterogeneous Materials; Springer: New York, NY, USA, 2002. [Google Scholar] [CrossRef]
  66. Sinchenko, A.A.; Grigoriev, P.D.; Orlov, A.P.; Frolov, A.V.; Shakin, A.; Chareev, D.A.; Volkova, O.S.; Vasiliev, A.N. Gossamer high-temperature bulk superconductivity in FeSe. Phys. Rev. B 2017, 95, 165120. [Google Scholar] [CrossRef] [Green Version]
  67. Grigoriev, P.D.; Sinchenko, A.A.; Kesharpu, K.K.; Shakin, A.; Mogilyuk, T.I.; Orlov, A.P.; Frolov, A.V.; Lyubshin, D.S.; Chareev, D.A.; Volkova, O.S.; et al. Anisotropic effect of appearing superconductivity on the electron transport in FeSe. JETP Lett. 2017, 105, 786–791. [Google Scholar] [CrossRef]
  68. Seidov, S.S.; Kesharpu, K.K.; Karpov, P.I.; Grigoriev, P.D. Conductivity of anisotropic inhomogeneous superconductors above the critical temperature. Phys. Rev. B 2018, 98, 014515. [Google Scholar] [CrossRef] [Green Version]
  69. Miyagawa, K.; Kawamoto, A.; Kanoda, K. Proximity of Pseudogapped Superconductor and Commensurate Antiferromagnet in a Quasi-Two-Dimensional Organic System. Phys. Rev. Lett. 2002, 89, 017003. [Google Scholar] [CrossRef]
  70. Sasaki, T.; Yoneyama, N. Spatial mapping of electronic states in κ-(BEDT-TTF)2X using infrared reflectivity. Sci. Technol. Adv. Mater. 2009, 10, 024306. [Google Scholar] [CrossRef]
  71. Zverev, V.N.; Biberacher, W.; Oberbauer, S.; Sheikin, I.; Alemany, P.; Canadell, E.; Kartsovnik, M.V. Fermi surface properties of the bifunctional organic metal κ-(BETS)2Mn[N(CN)2]3 near the metal-insulator transition. Phys. Rev. B 2019, 99, 125136. [Google Scholar] [CrossRef] [Green Version]
  72. Oberbauer, S.; Erkenov, S.; Biberacher, W.; Kushch, N.D.; Gross, R.; Kartsovnik, M.V. Coherent heavy charge carriers in an organic conductor near the bandwidth-controlled Mott transition. Phys. Rev. B 2023, 107, 075139. [Google Scholar] [CrossRef]
  73. Lang, K.M.; Madhavan, V.; Hoffman, J.E.; Hudson, E.W.; Eisaki, H.; Uchida, S.; Davis, J.C. Imaging the granular structure of high-Tc superconductivity in underdoped Bi2Sr2CaCu2O8+δ. Nature 2002, 415, 412–416. [Google Scholar] [CrossRef] [PubMed] [Green Version]
  74. Wise, W.D.; Chatterjee, K.; Boyer, M.C.; Kondo, T.; Takeuchi, T.; Ikuta, H.; Xu, Z.; Wen, J.; Gu, G.D.; Wang, Y.; et al. Imaging nanoscale Fermi-surface variations in an inhomogeneous superconductor. Nat. Phys 2009, 5, 213–216. [Google Scholar] [CrossRef]
  75. Kresin, V.; Ovchinnikov, Y.; Wolf, S. Inhomogeneous superconductivity and the “pseudogap” state of novel superconductors. Phys. Rep. 2006, 431, 231–259. [Google Scholar] [CrossRef] [Green Version]
  76. Campi, G.; Bianconi, A.; Poccia, N.; Bianconi, G.; Barba, L.; Arrighetti, G.; Innocenti, D.; Karpinski, J.; Zhigadlo, N.D.; Kazakov, S.M.; et al. Inhomogeneity of charge-density-wave order and quenched disorder in a high-Tc superconductor. Nature 2015, 525, 359–362. [Google Scholar] [CrossRef] [Green Version]
  77. Mogilyuk, T.I.; Grigoriev, P.D.; Kesharpu, K.K.; Kolesnikov, I.A.; Sinchenko, A.A.; Frolov, A.V.; Orlov, A.P. Excess Conductivity of Anisotropic Inhomogeneous Superconductors Above the Critical Temperature. Phys. Solid State 2019, 61, 1549–1552. [Google Scholar] [CrossRef]
  78. Kresin, V.Z.; Ovchinnikov, Y.N. Nano-based Josephson Tunneling Networks and High Temperature Superconductivity. J. Supercond. Nov. Magn. 2021, 34, 1705–1708. [Google Scholar] [CrossRef]
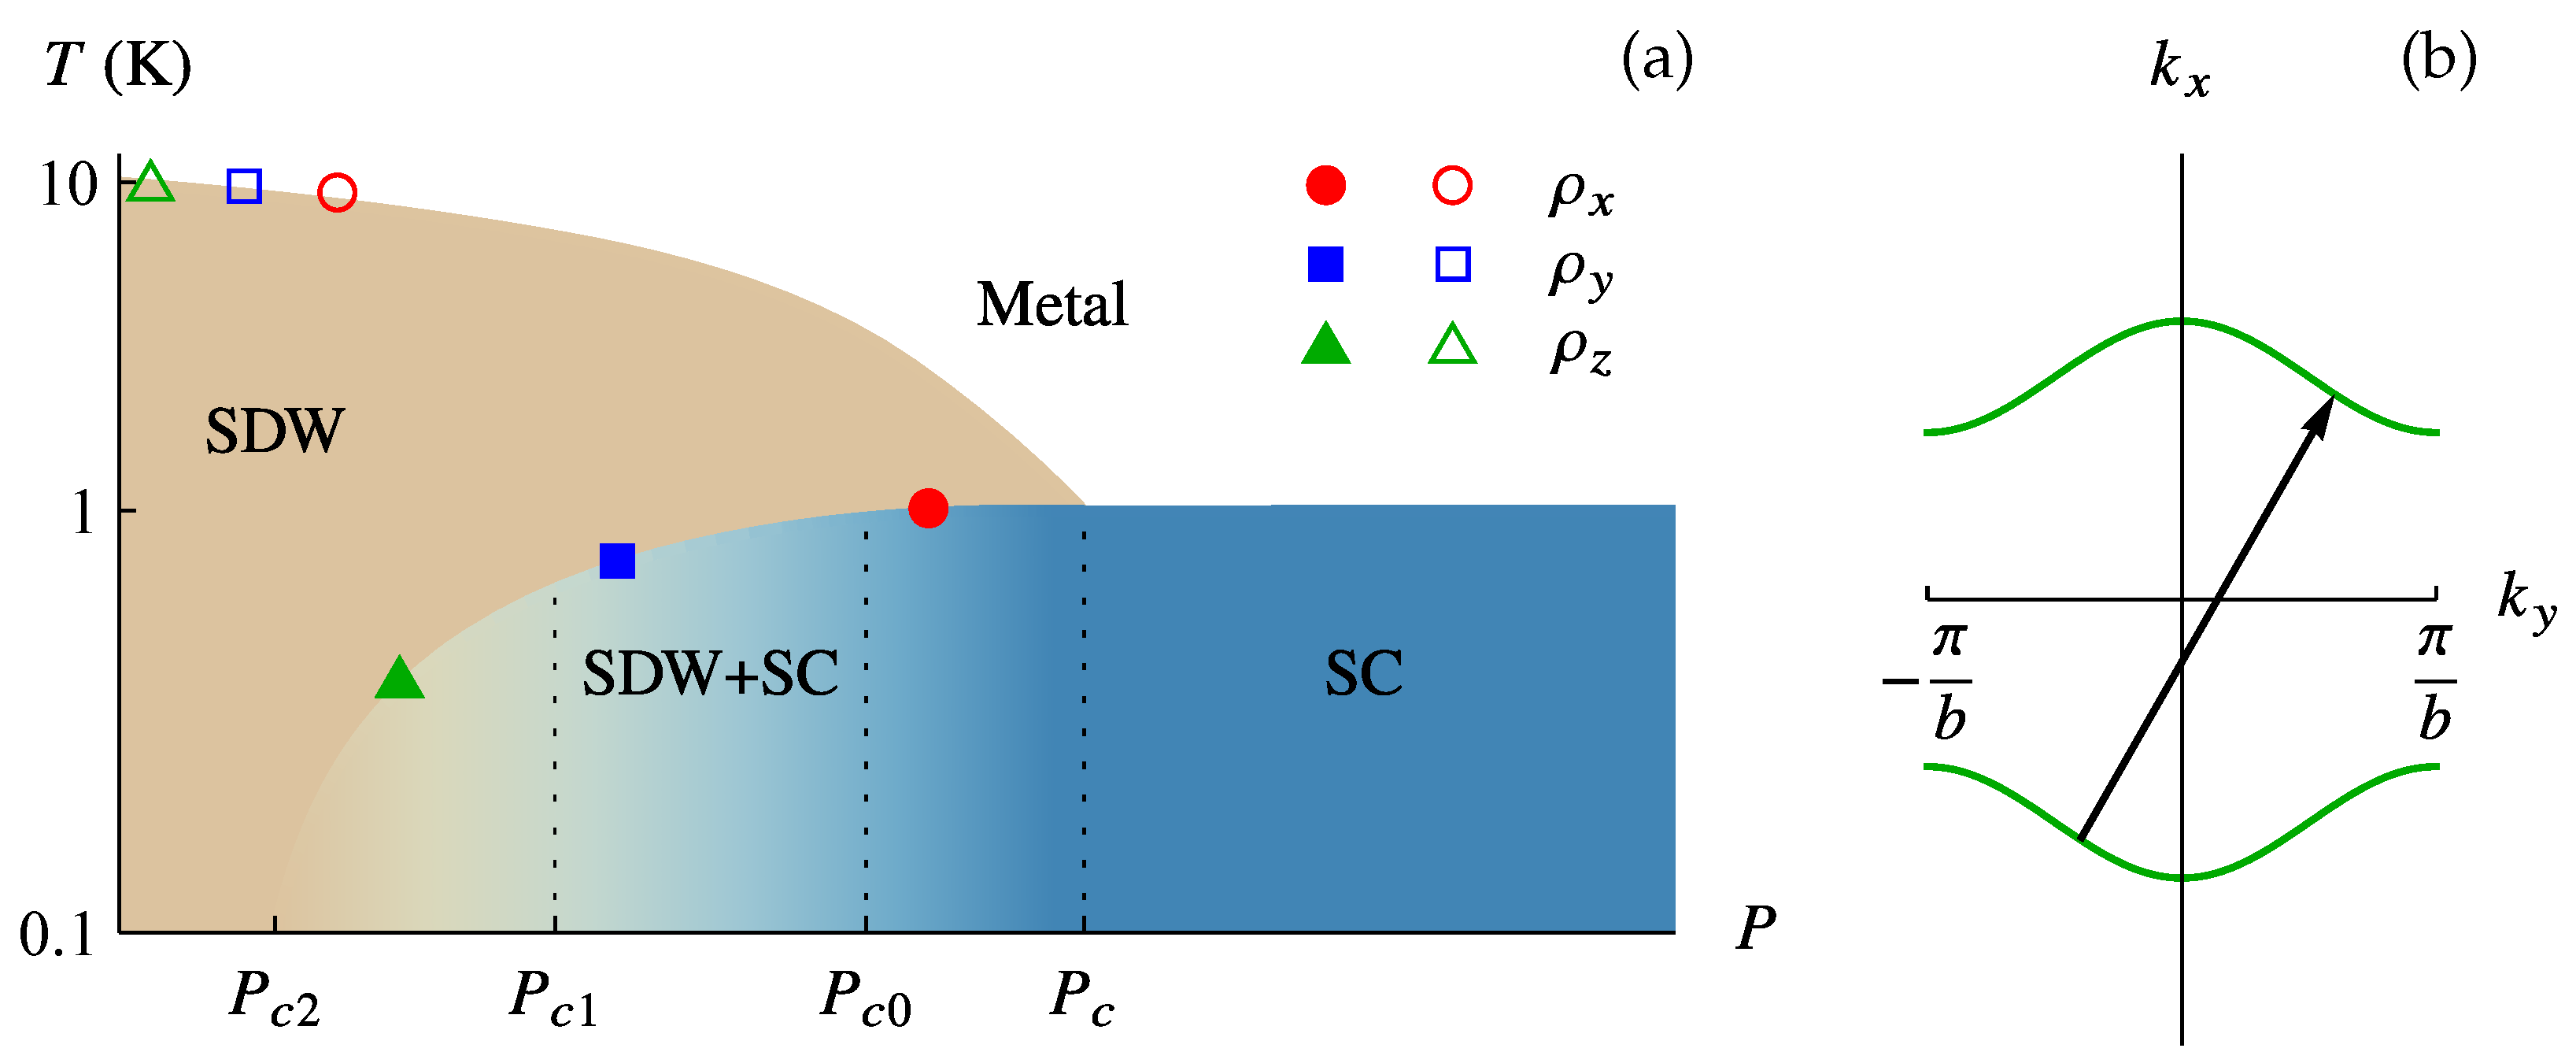
Figure 1. (a) Pressure–temperature phase diagram of (TMTSF) 2 PF 6 recreated from resistivity data in ref. [20]; (b) schematic FS of (TMTSF) 2 PF 6 , obtained from the Q1D electron dispersion given by Equations (1) and (2). The nesting vector Q is indicated by the black arrow.
Magnetochemistry 09 00173 g001
Figure 2. Temperature dependence of the DW coherence length ξ along two main axes at two different values of t b : t b = 4.5 K = 0.42 t b * , corresponding to (TMTSF) 2 PF 6 at ambient pressure, and t b = 0.95 t b * . Solid and dashed lines correspond to the numerical solution of Equations (14), while the dotted lines correspond to the approximate analytical formulas in Equations (17) and (18).
Magnetochemistry 09 00173 g002
Figure 3. The dependence of the percolation threshold ϕ c along different axes on the size of the spherical island d in (TMTSF) 2 PF 6 . The intervals of ϕ c , corresponding to the percolation probability p ( 0.5 ± 0.4 ) , are indicated by error bars.
Magnetochemistry 09 00173 g003
Disclaimer/Publisher’s Note: The statements, opinions and data contained in all publications are solely those of the individual author(s) and contributor(s) and not of MDPI and/or the editor(s). MDPI and/or the editor(s) disclaim responsibility for any injury to people or property resulting from any ideas, methods, instructions or products referred to in the content.