
Dirac Cone Formation in Single-Component Molecular Conductors Based on Metal Dithiolene Complexes


Abstract
1. Introduction


2. Models and Methods
2.1. Tight-Binding Model
2.2. DFT Calculations
3. Results
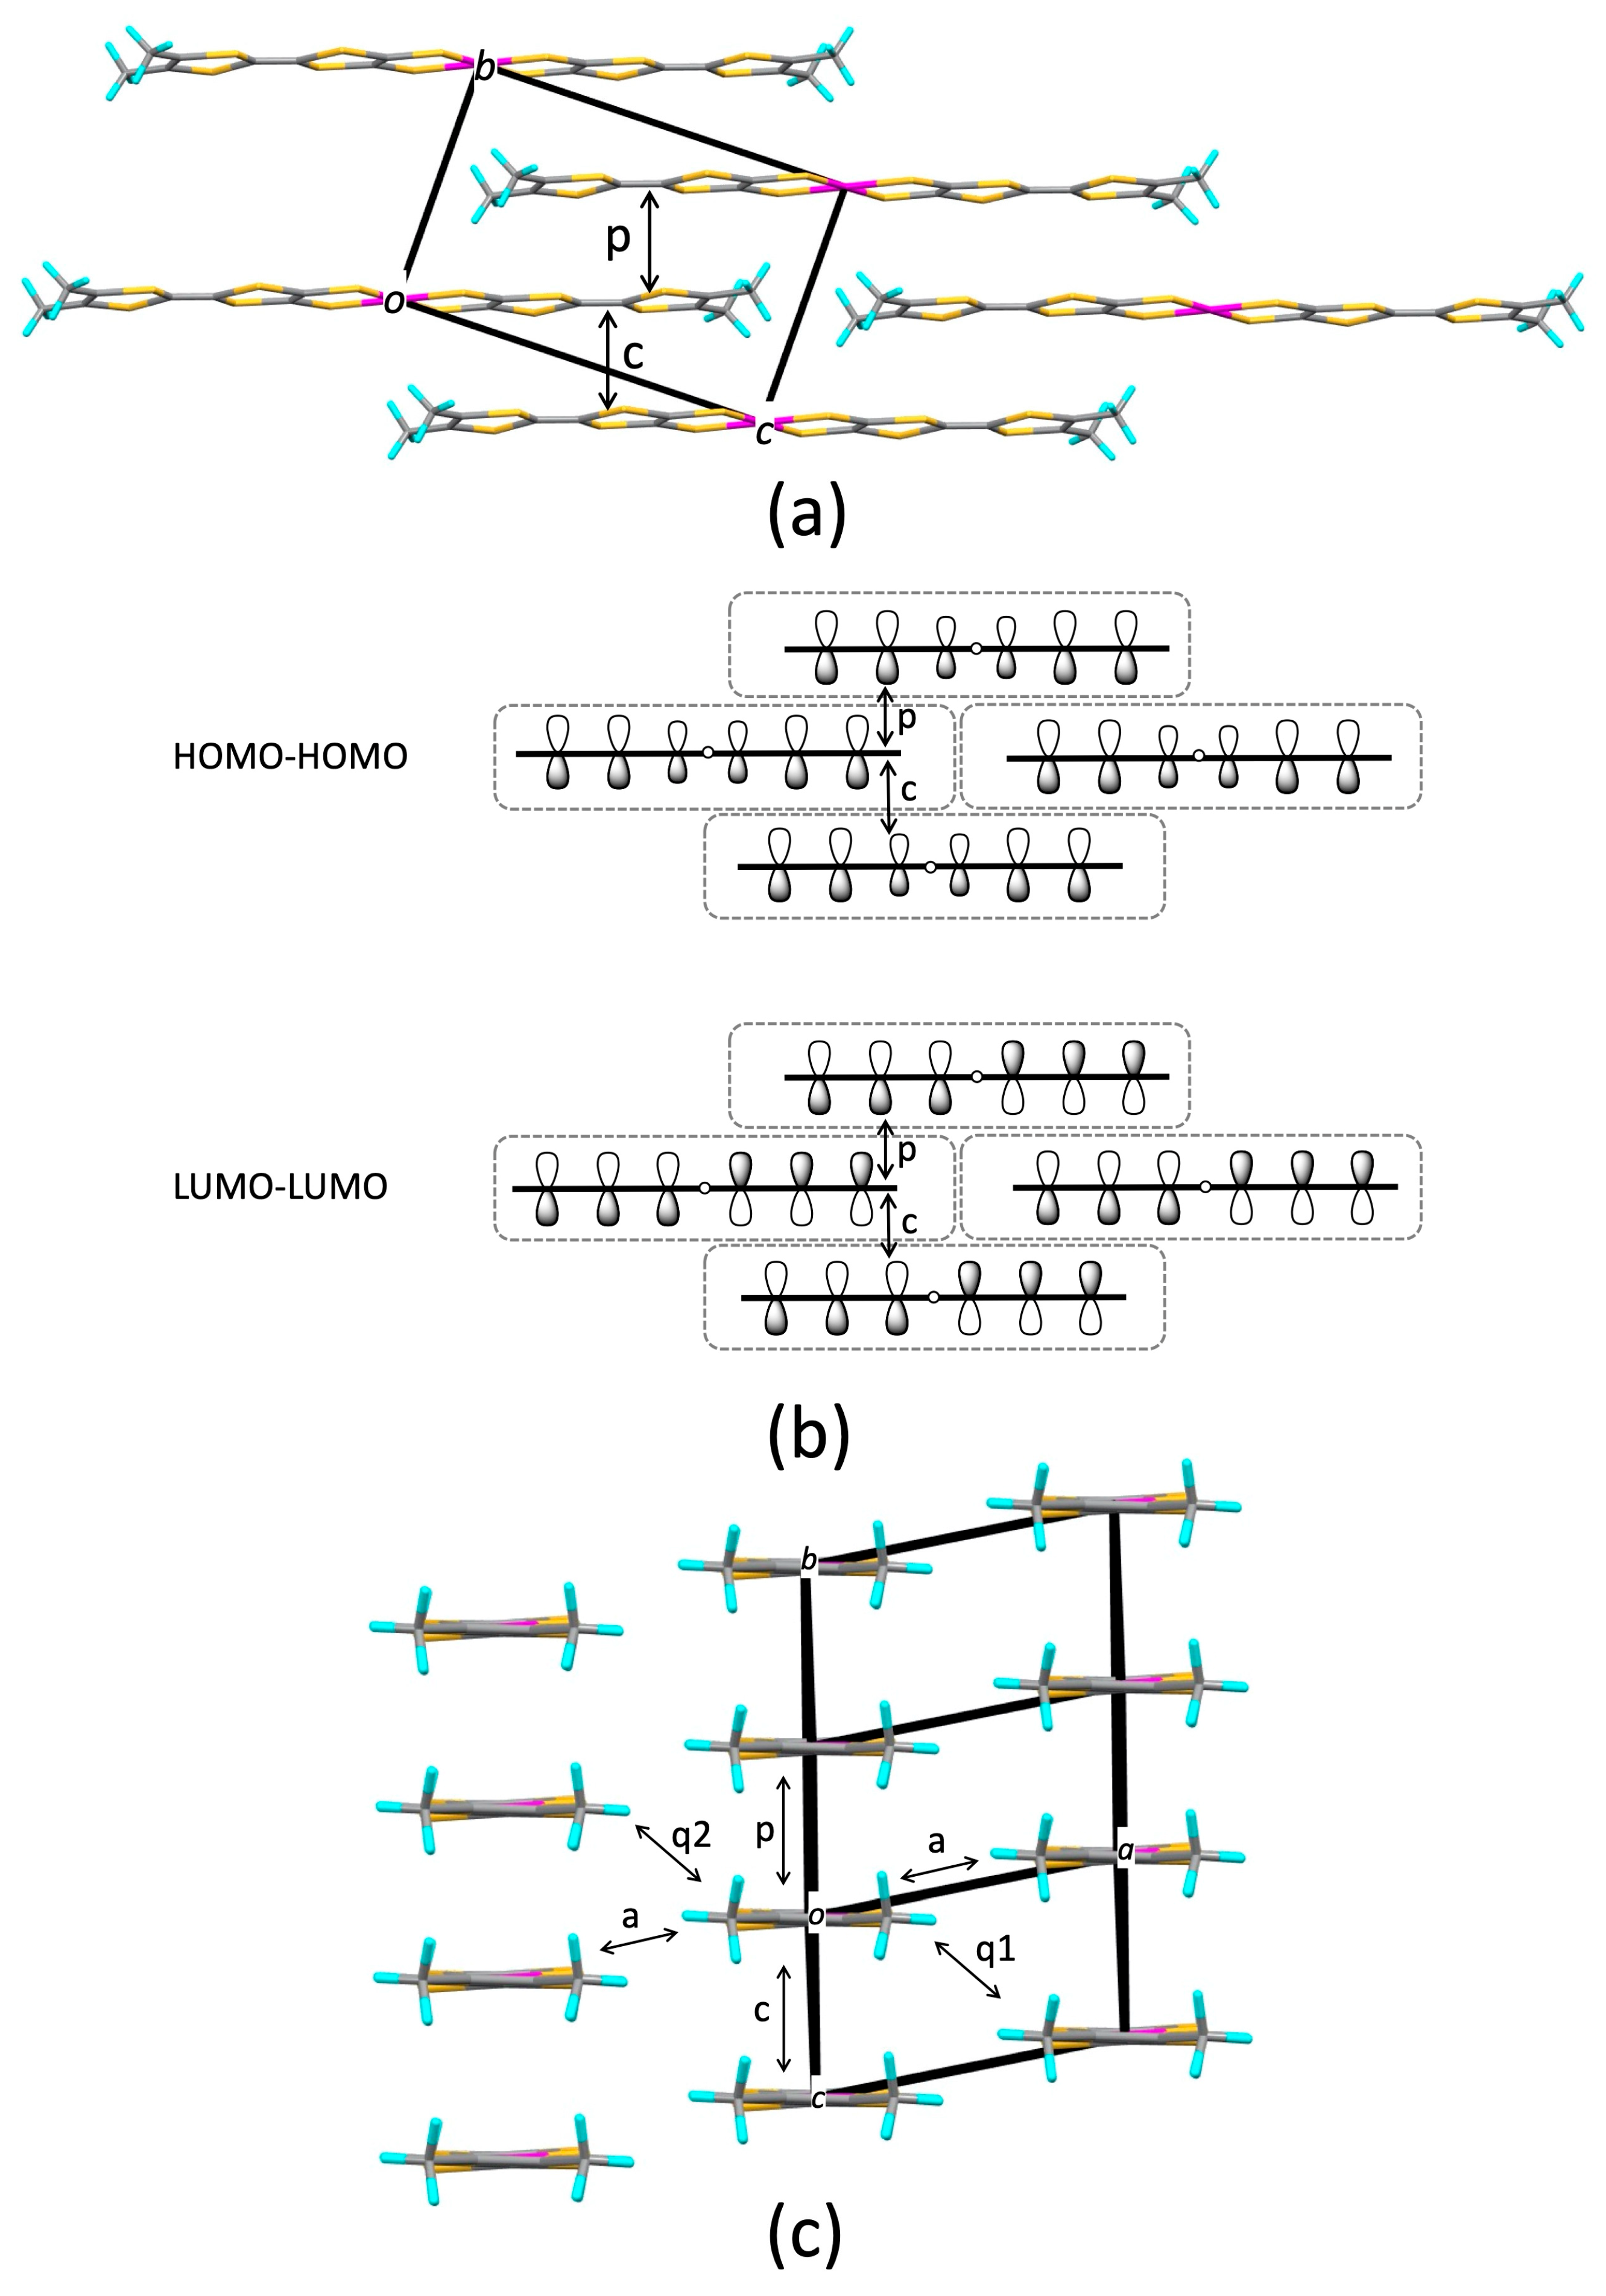
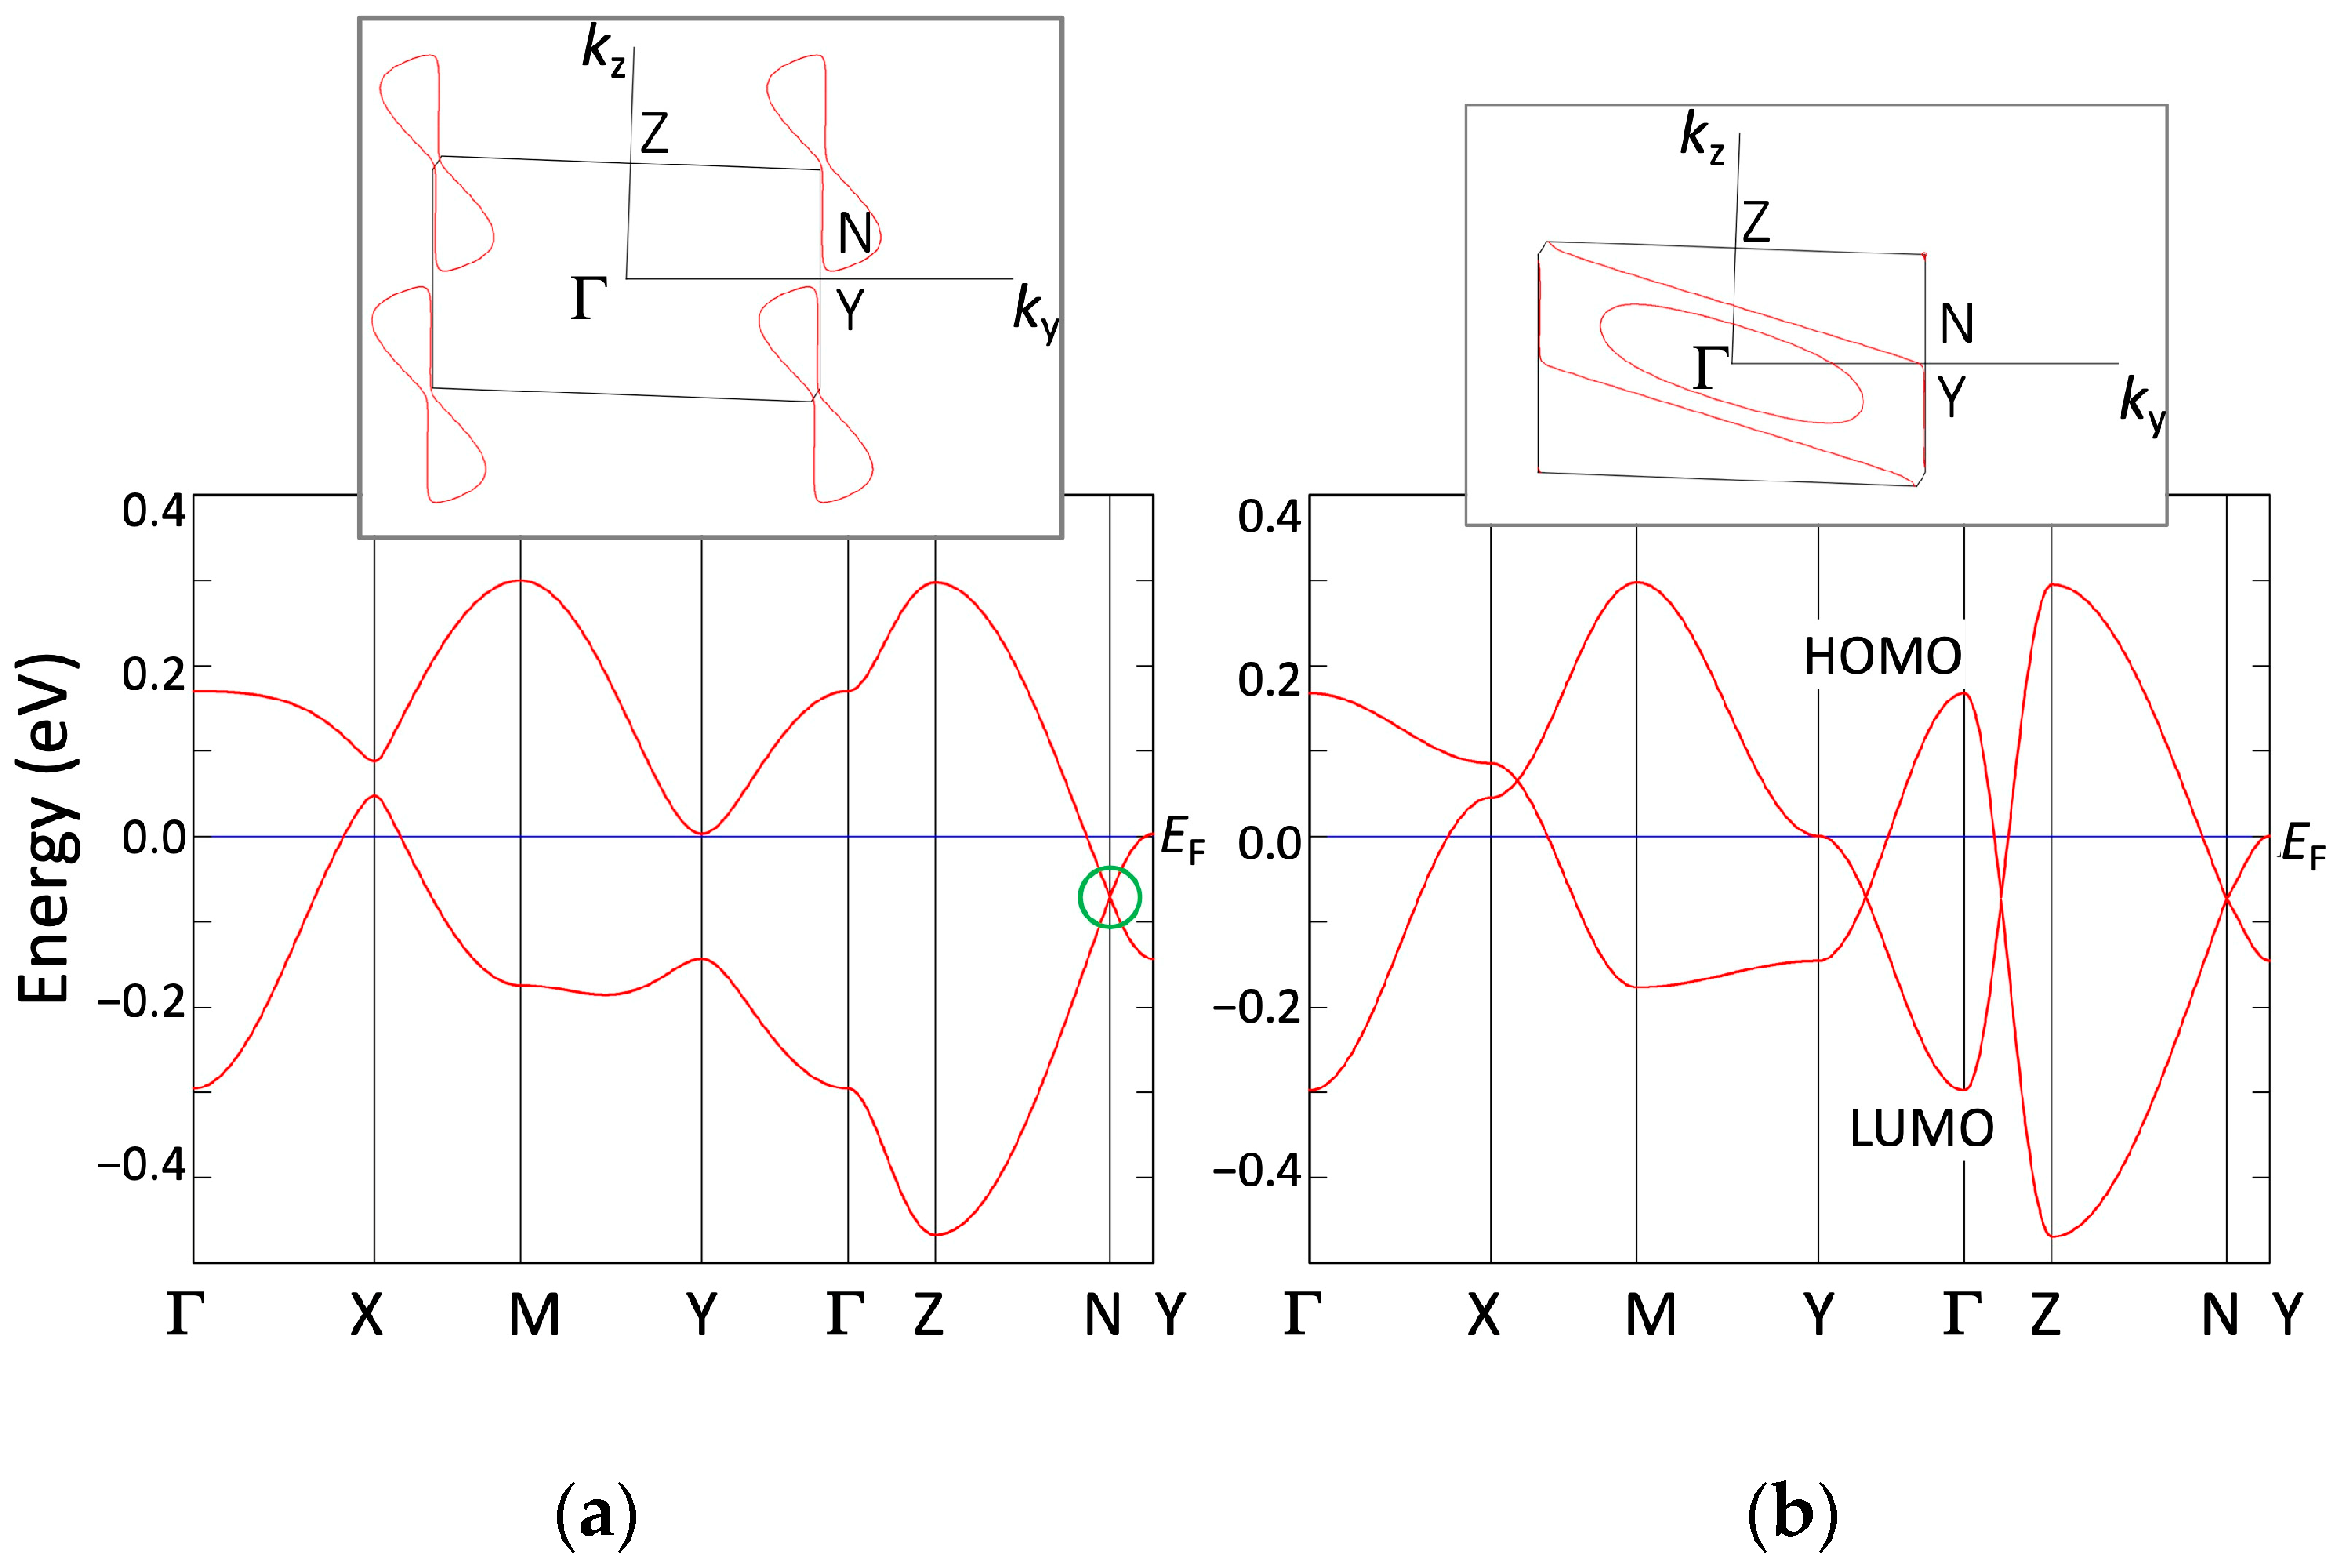
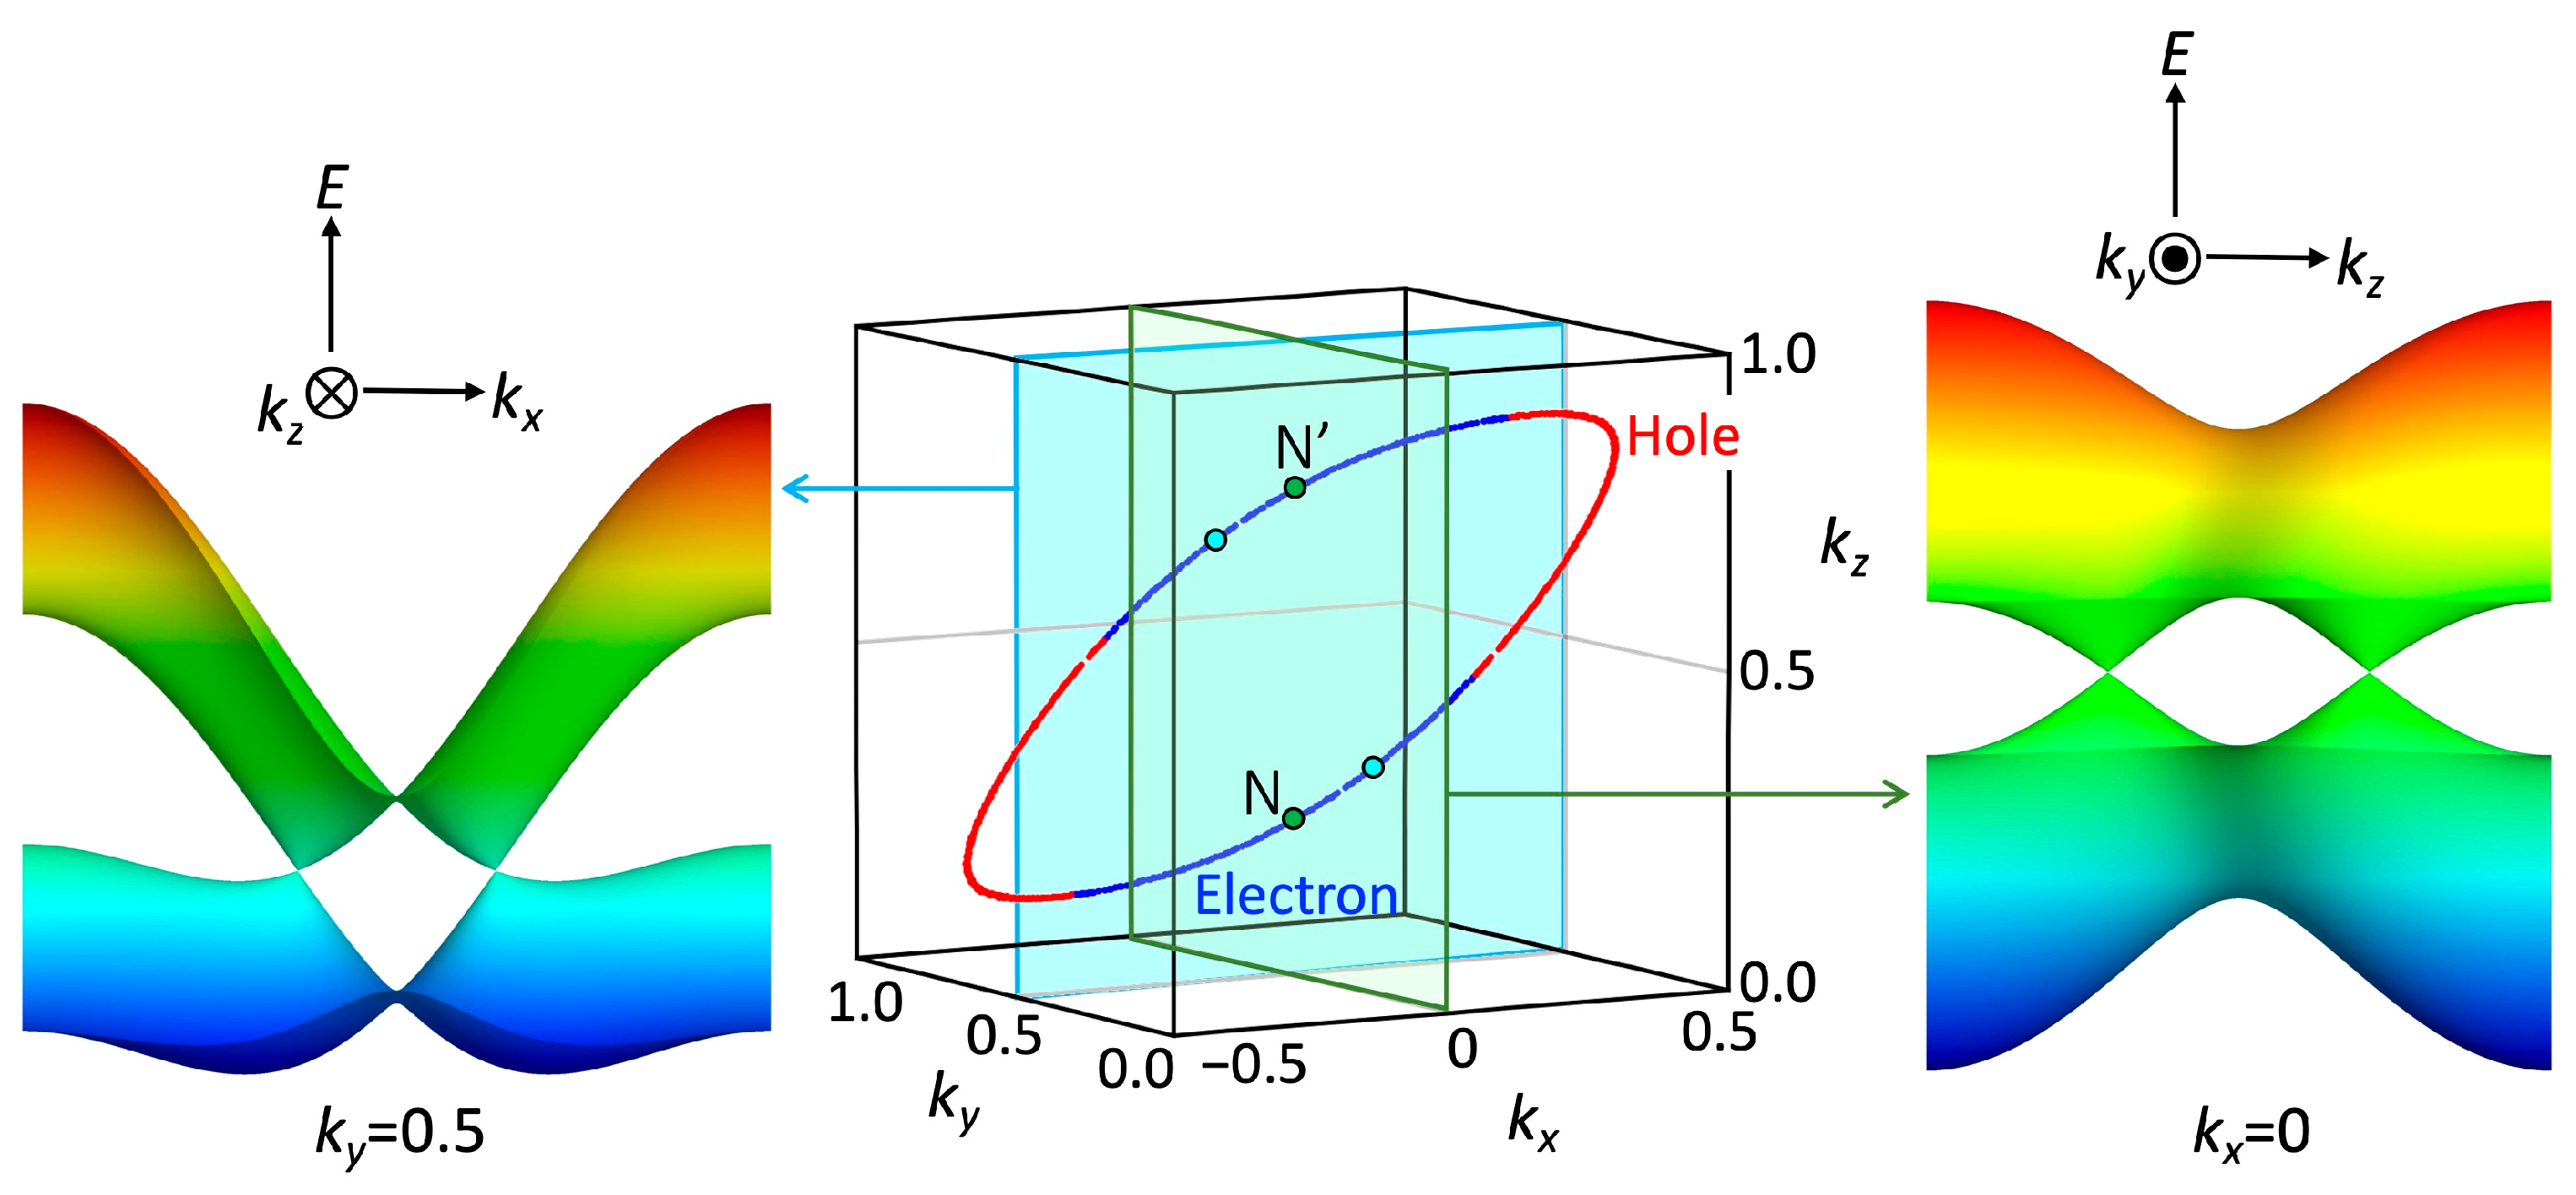
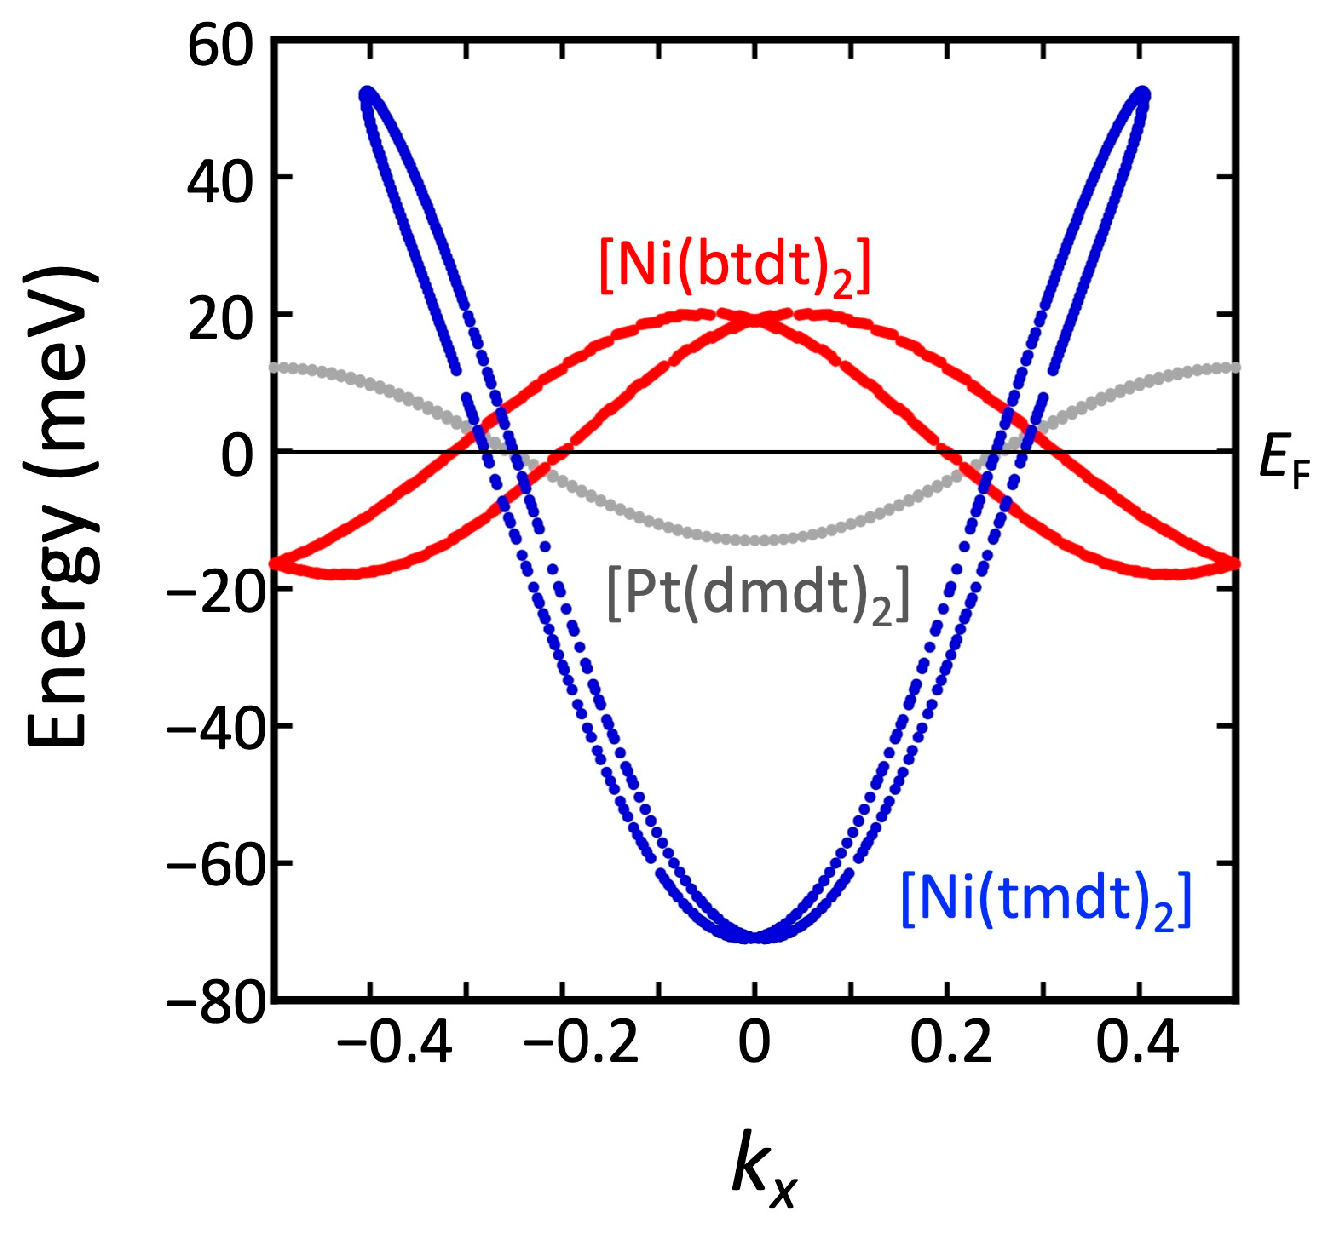
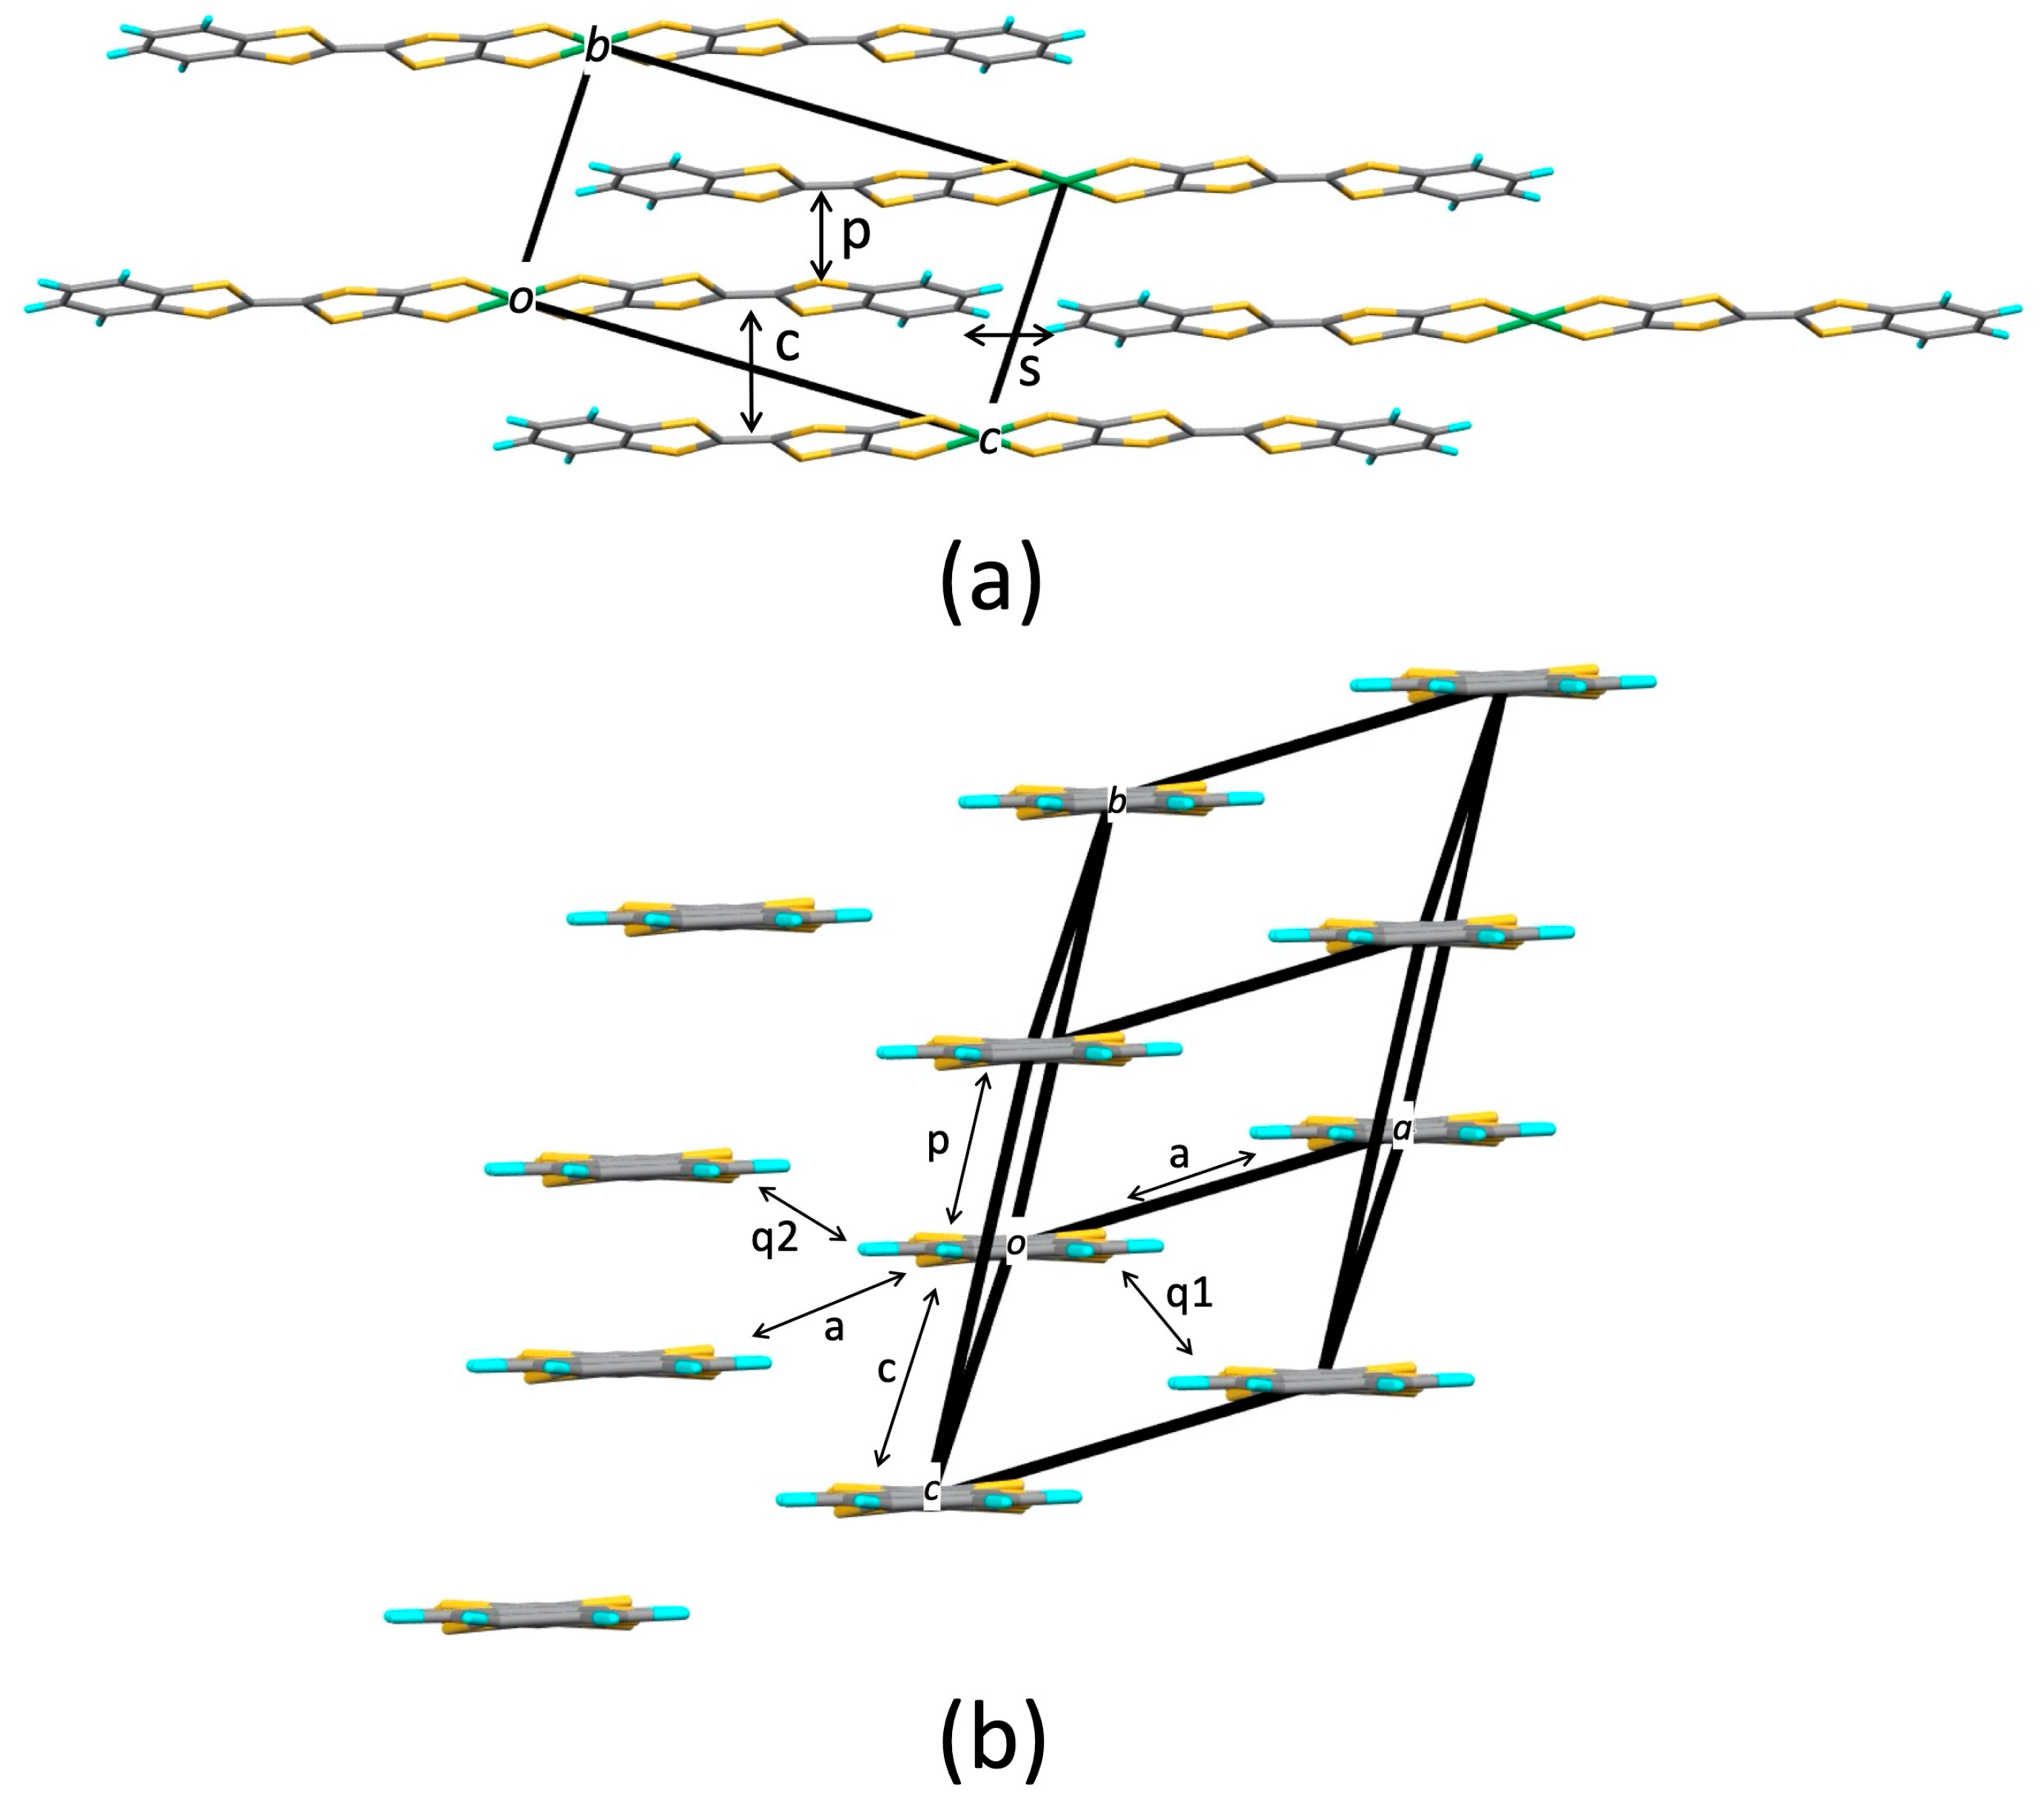
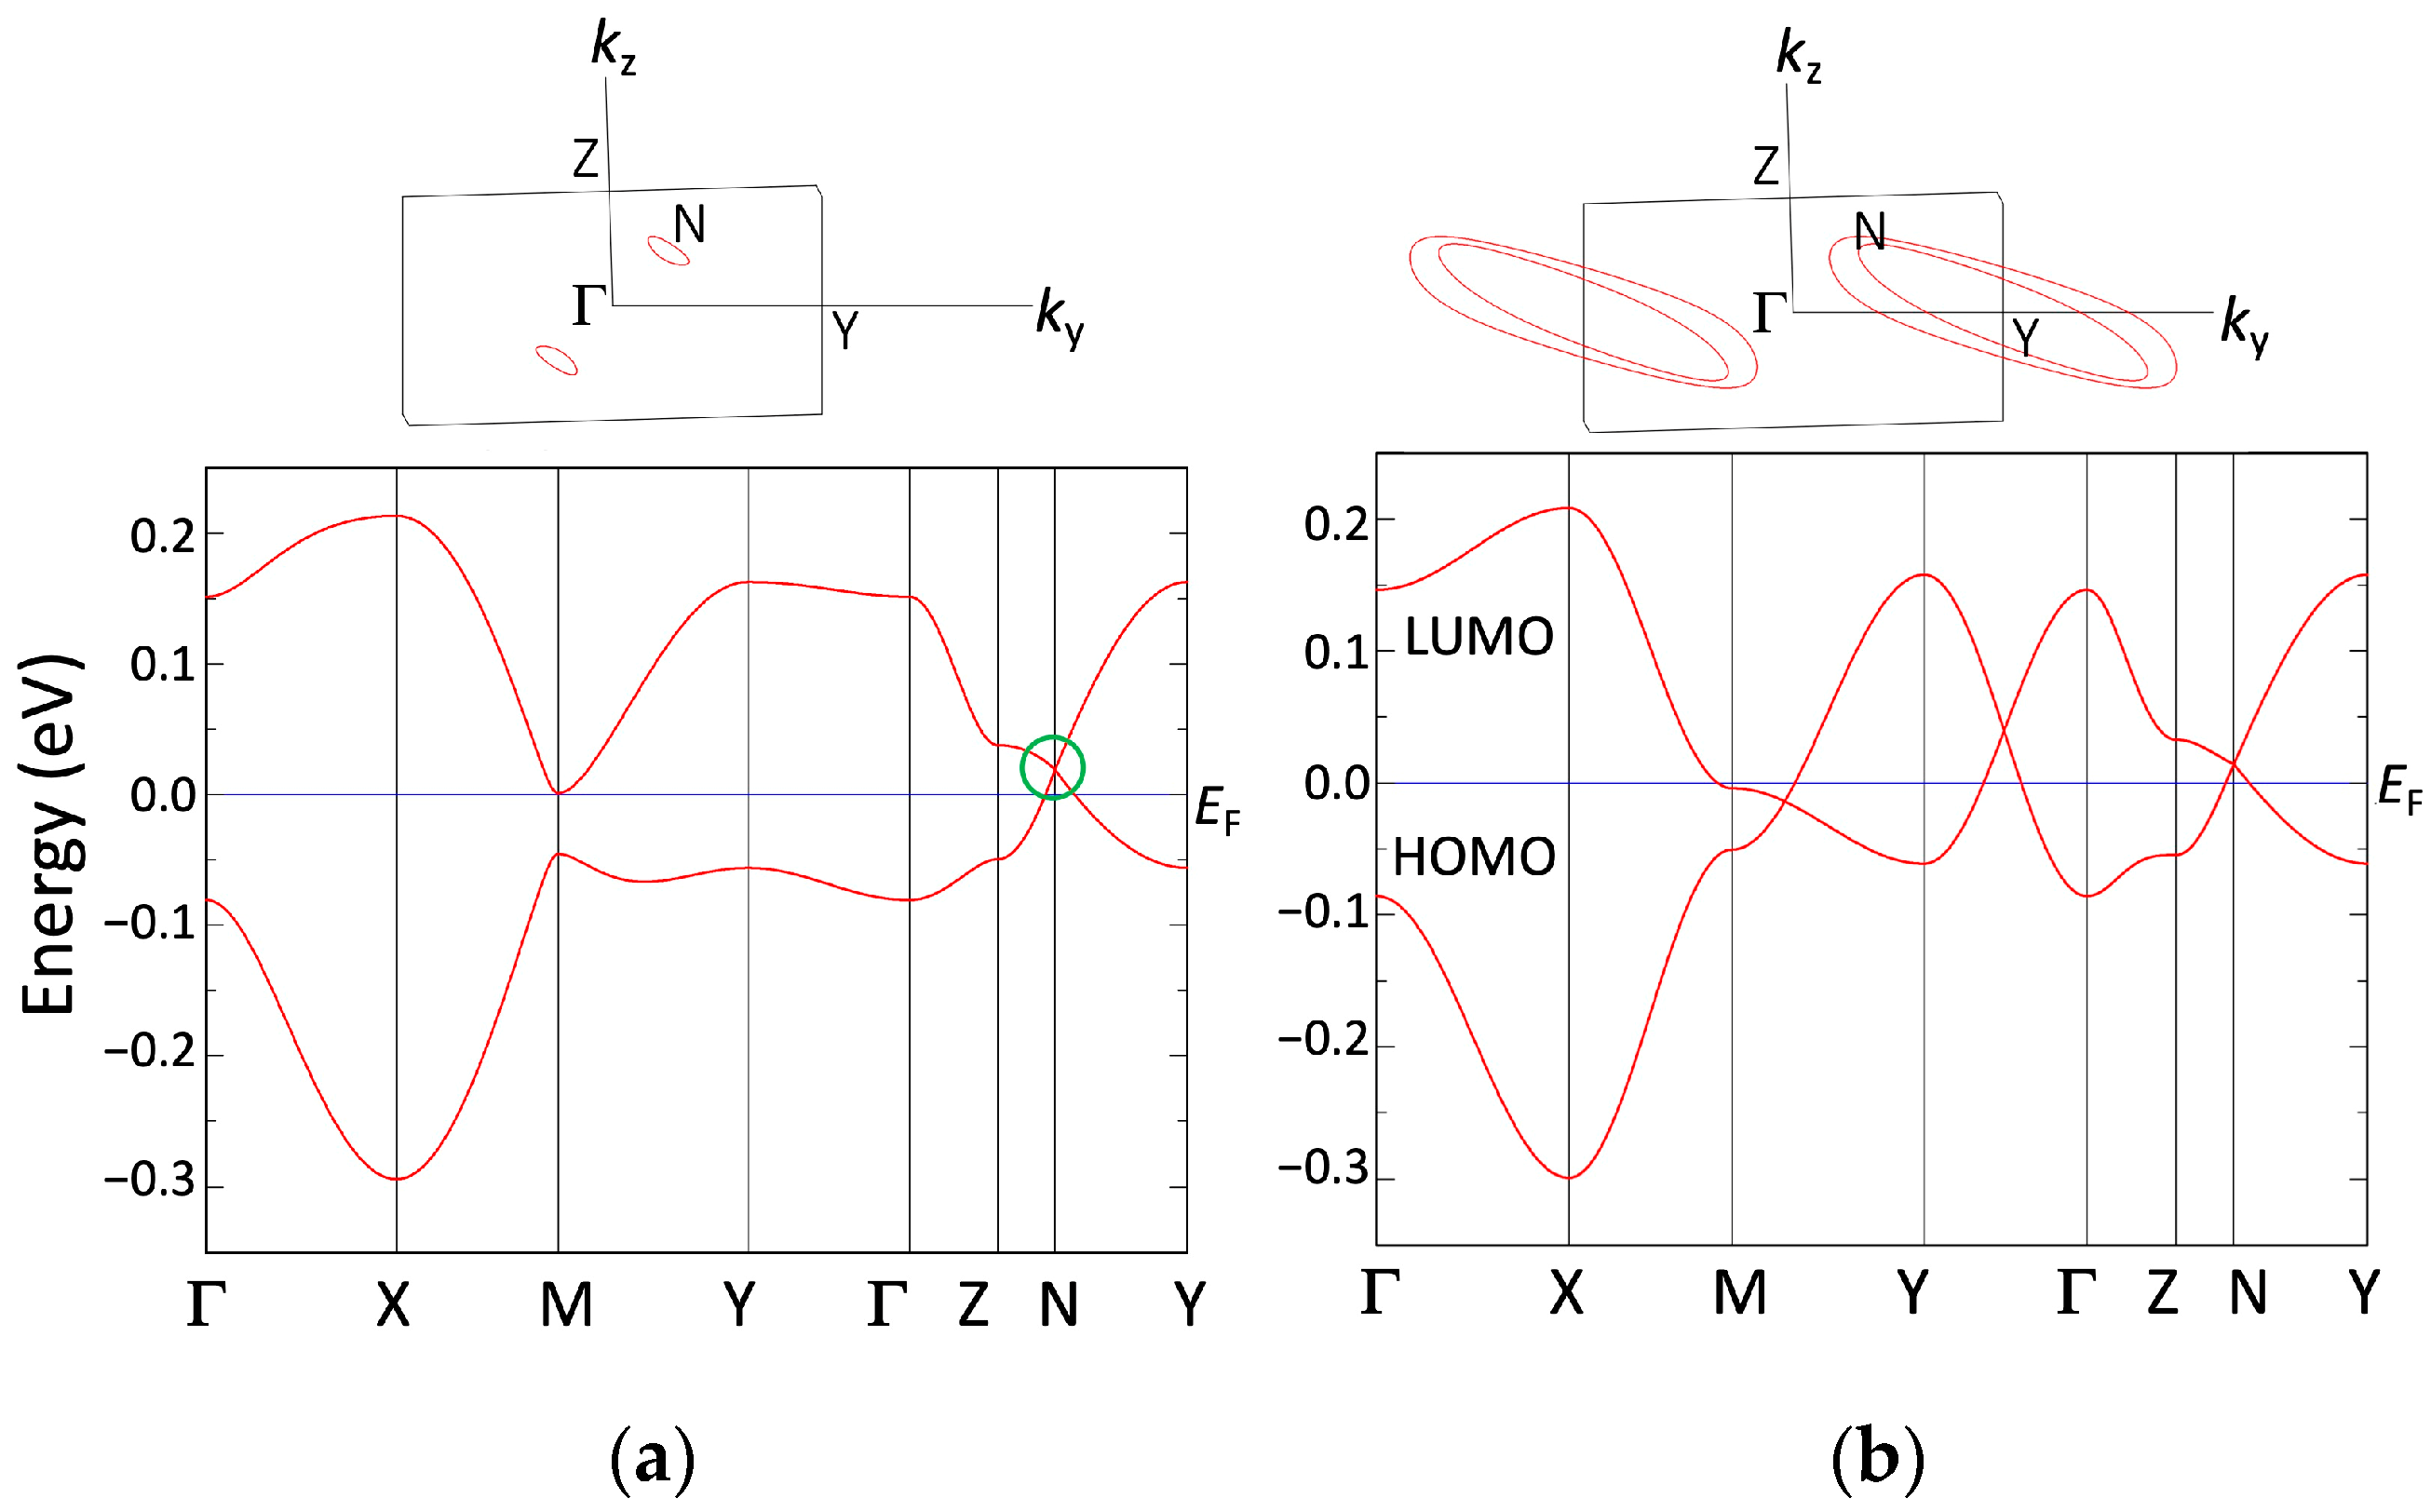
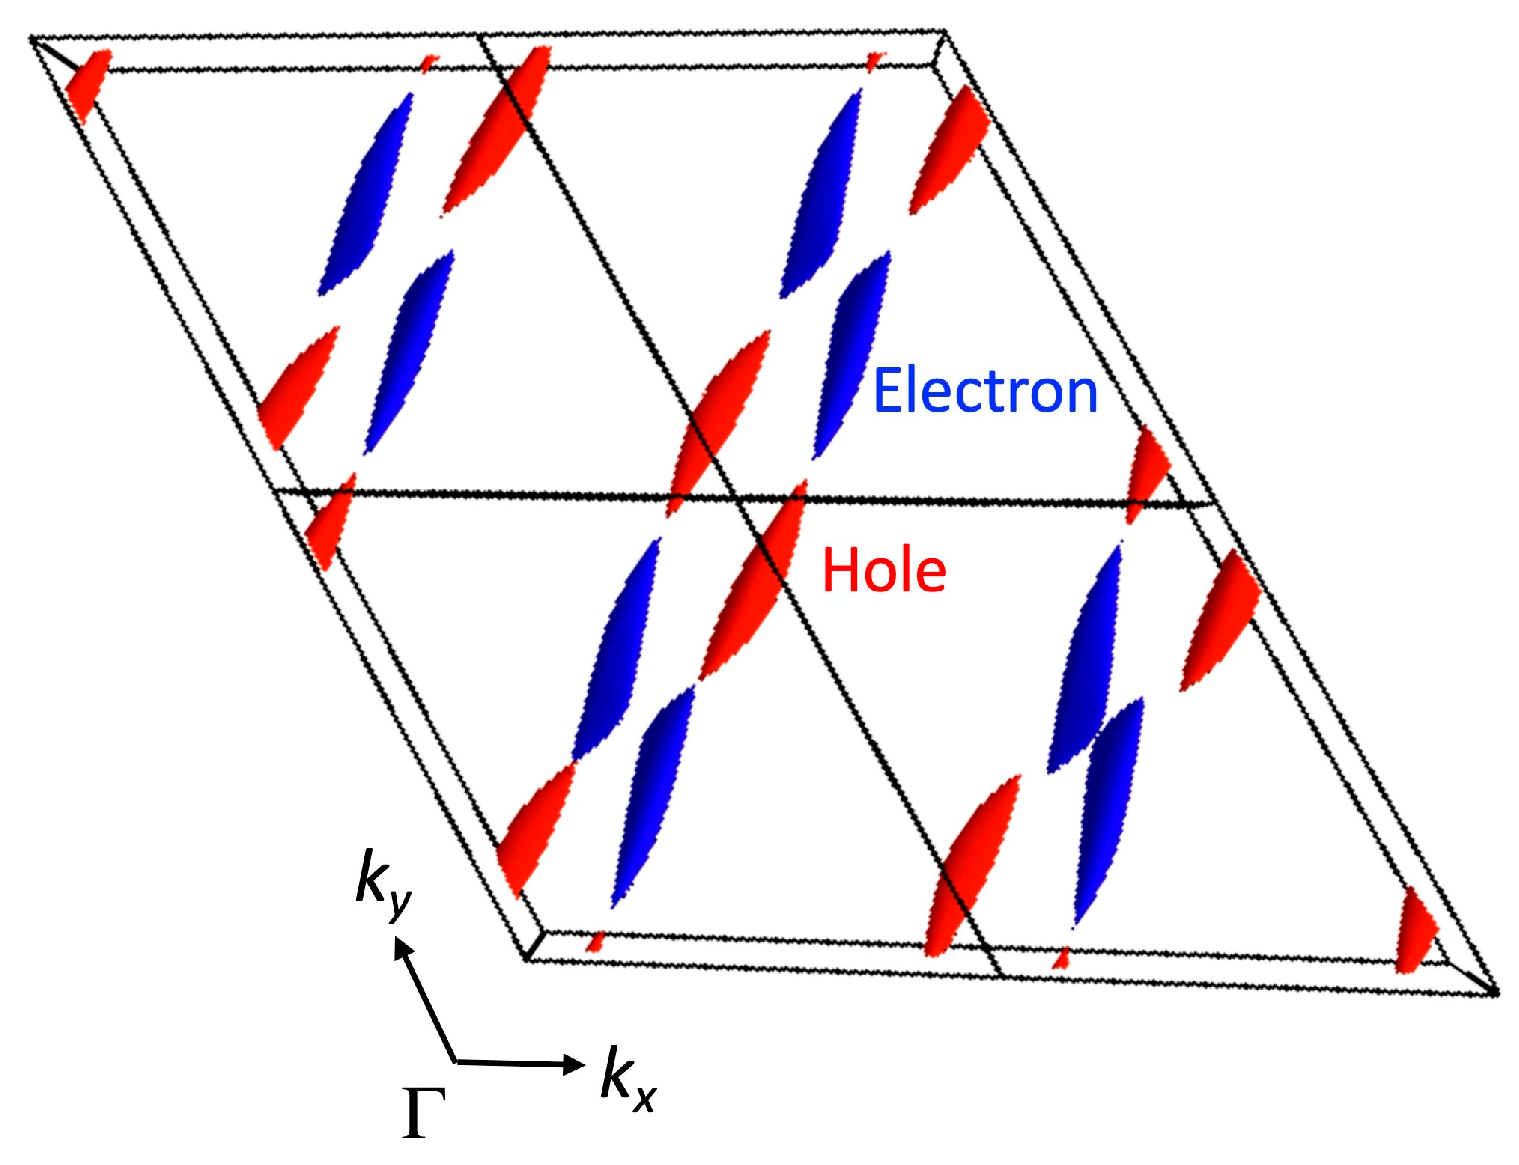
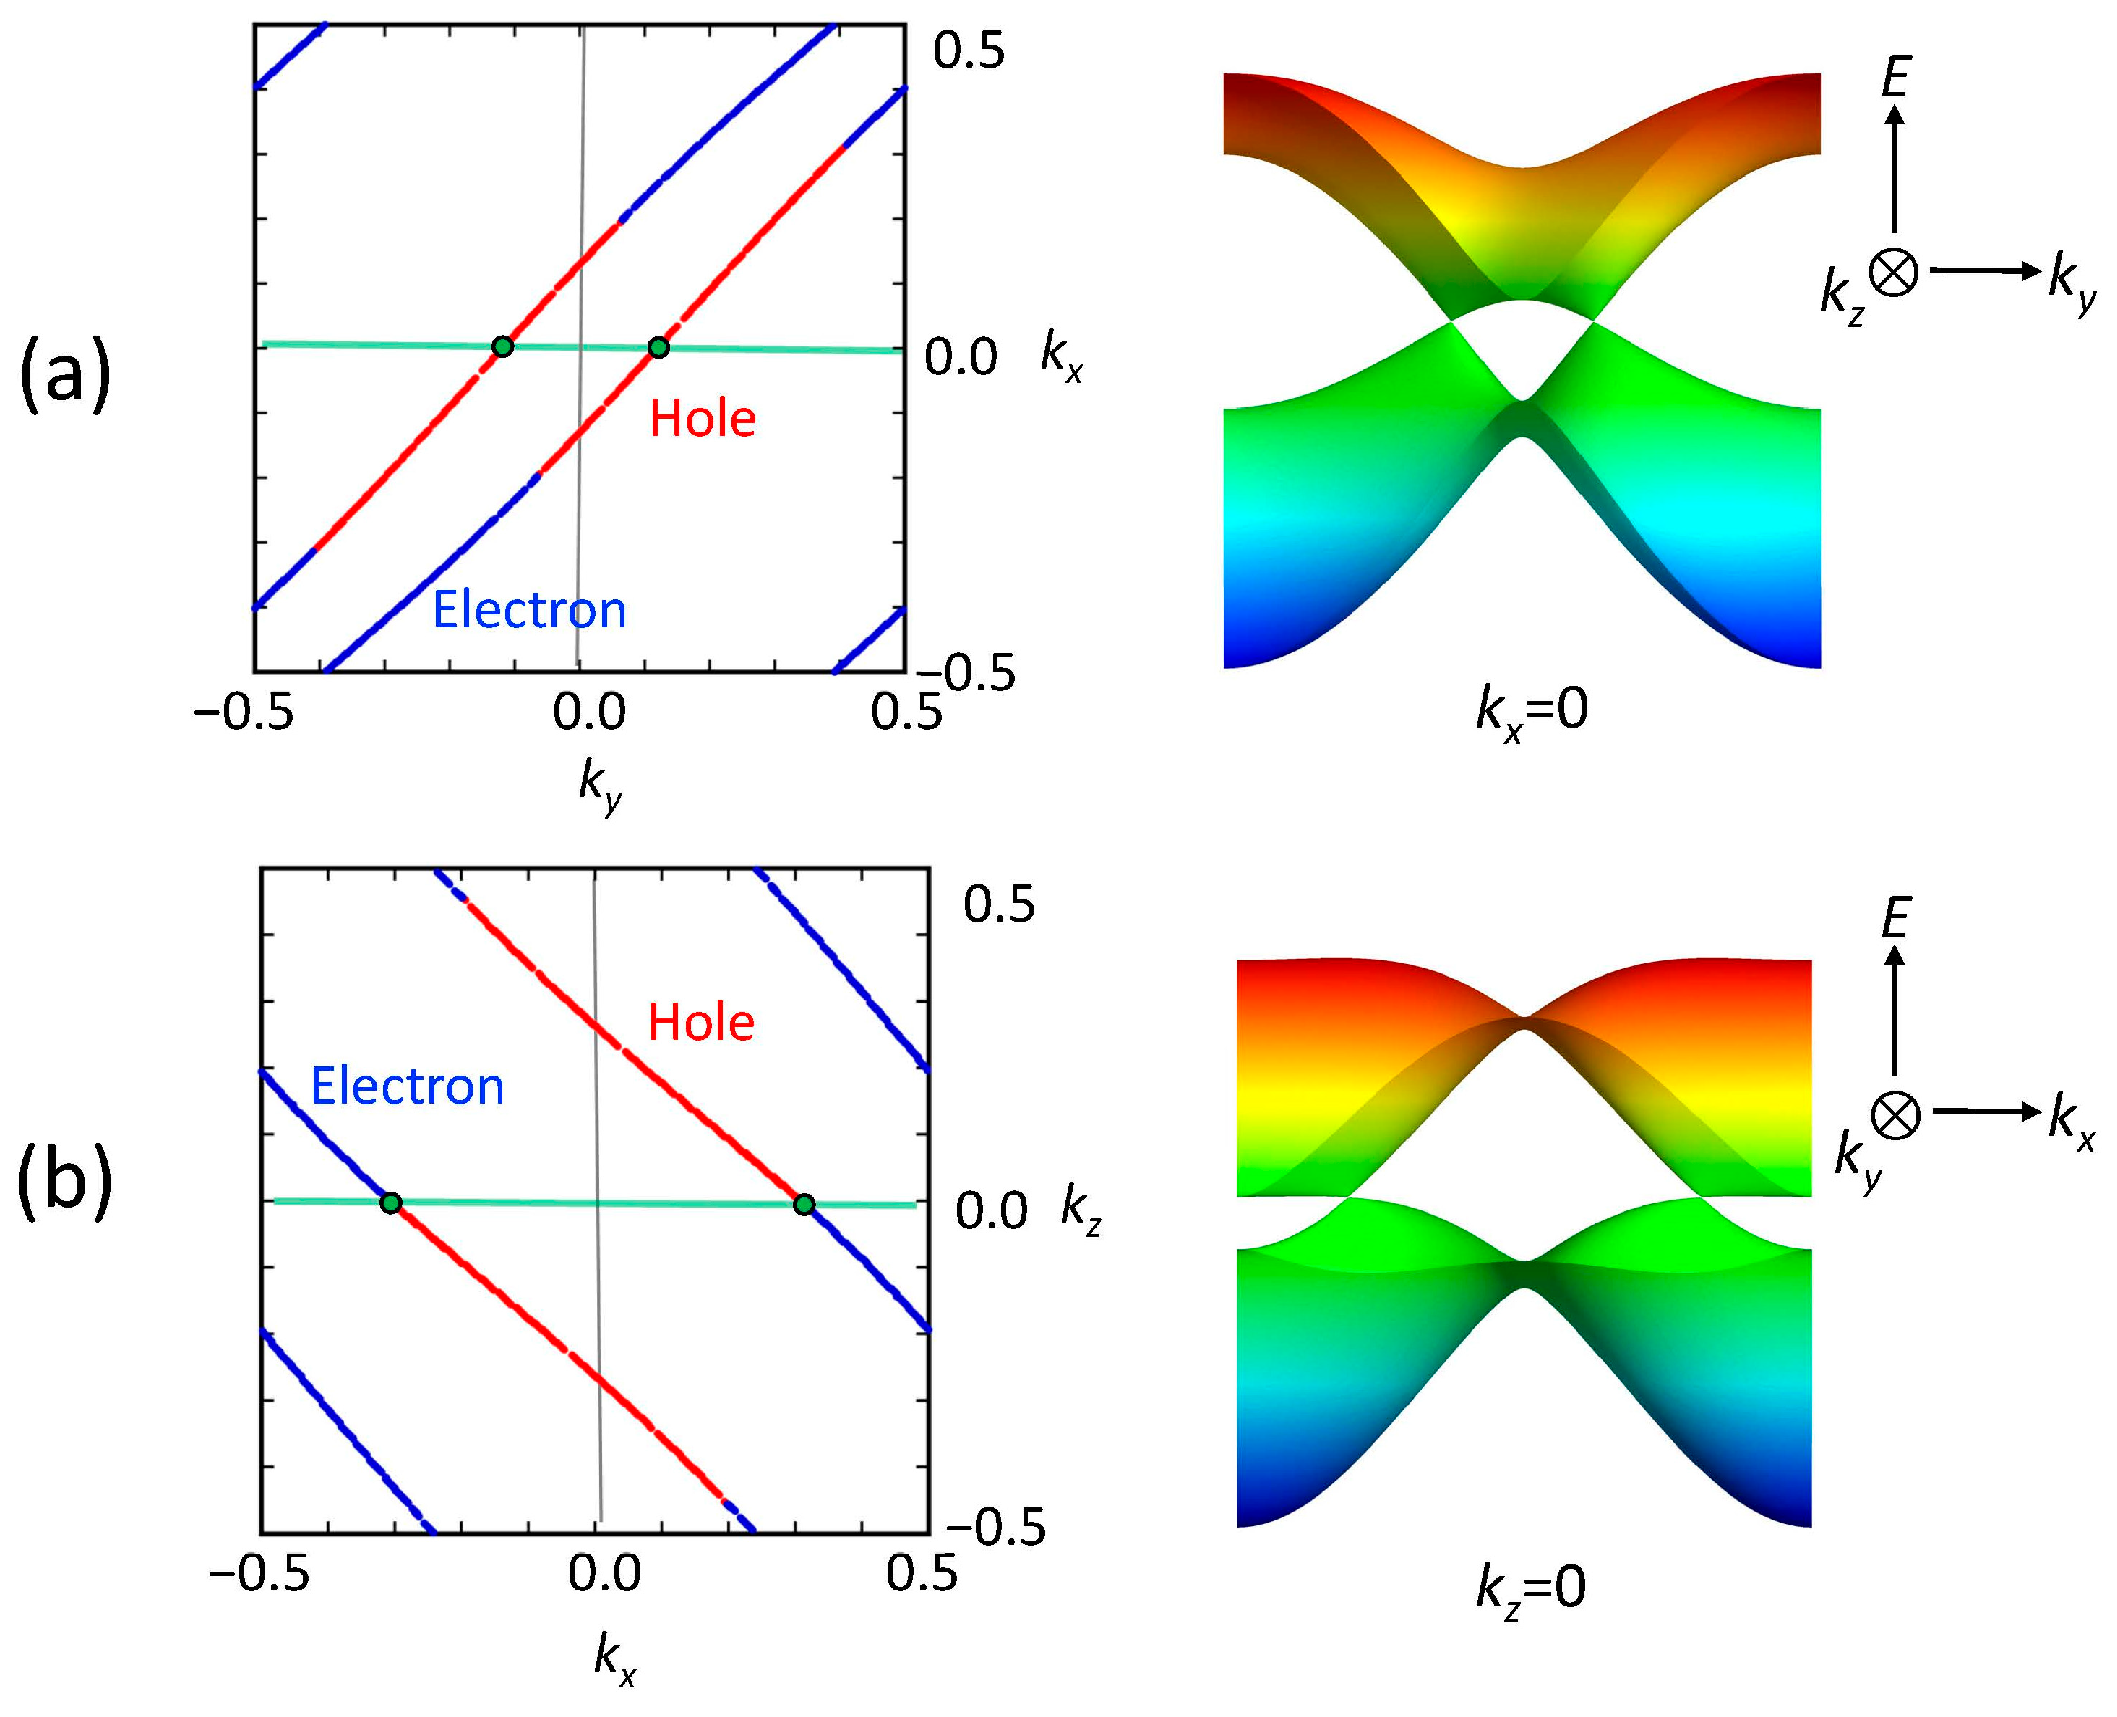
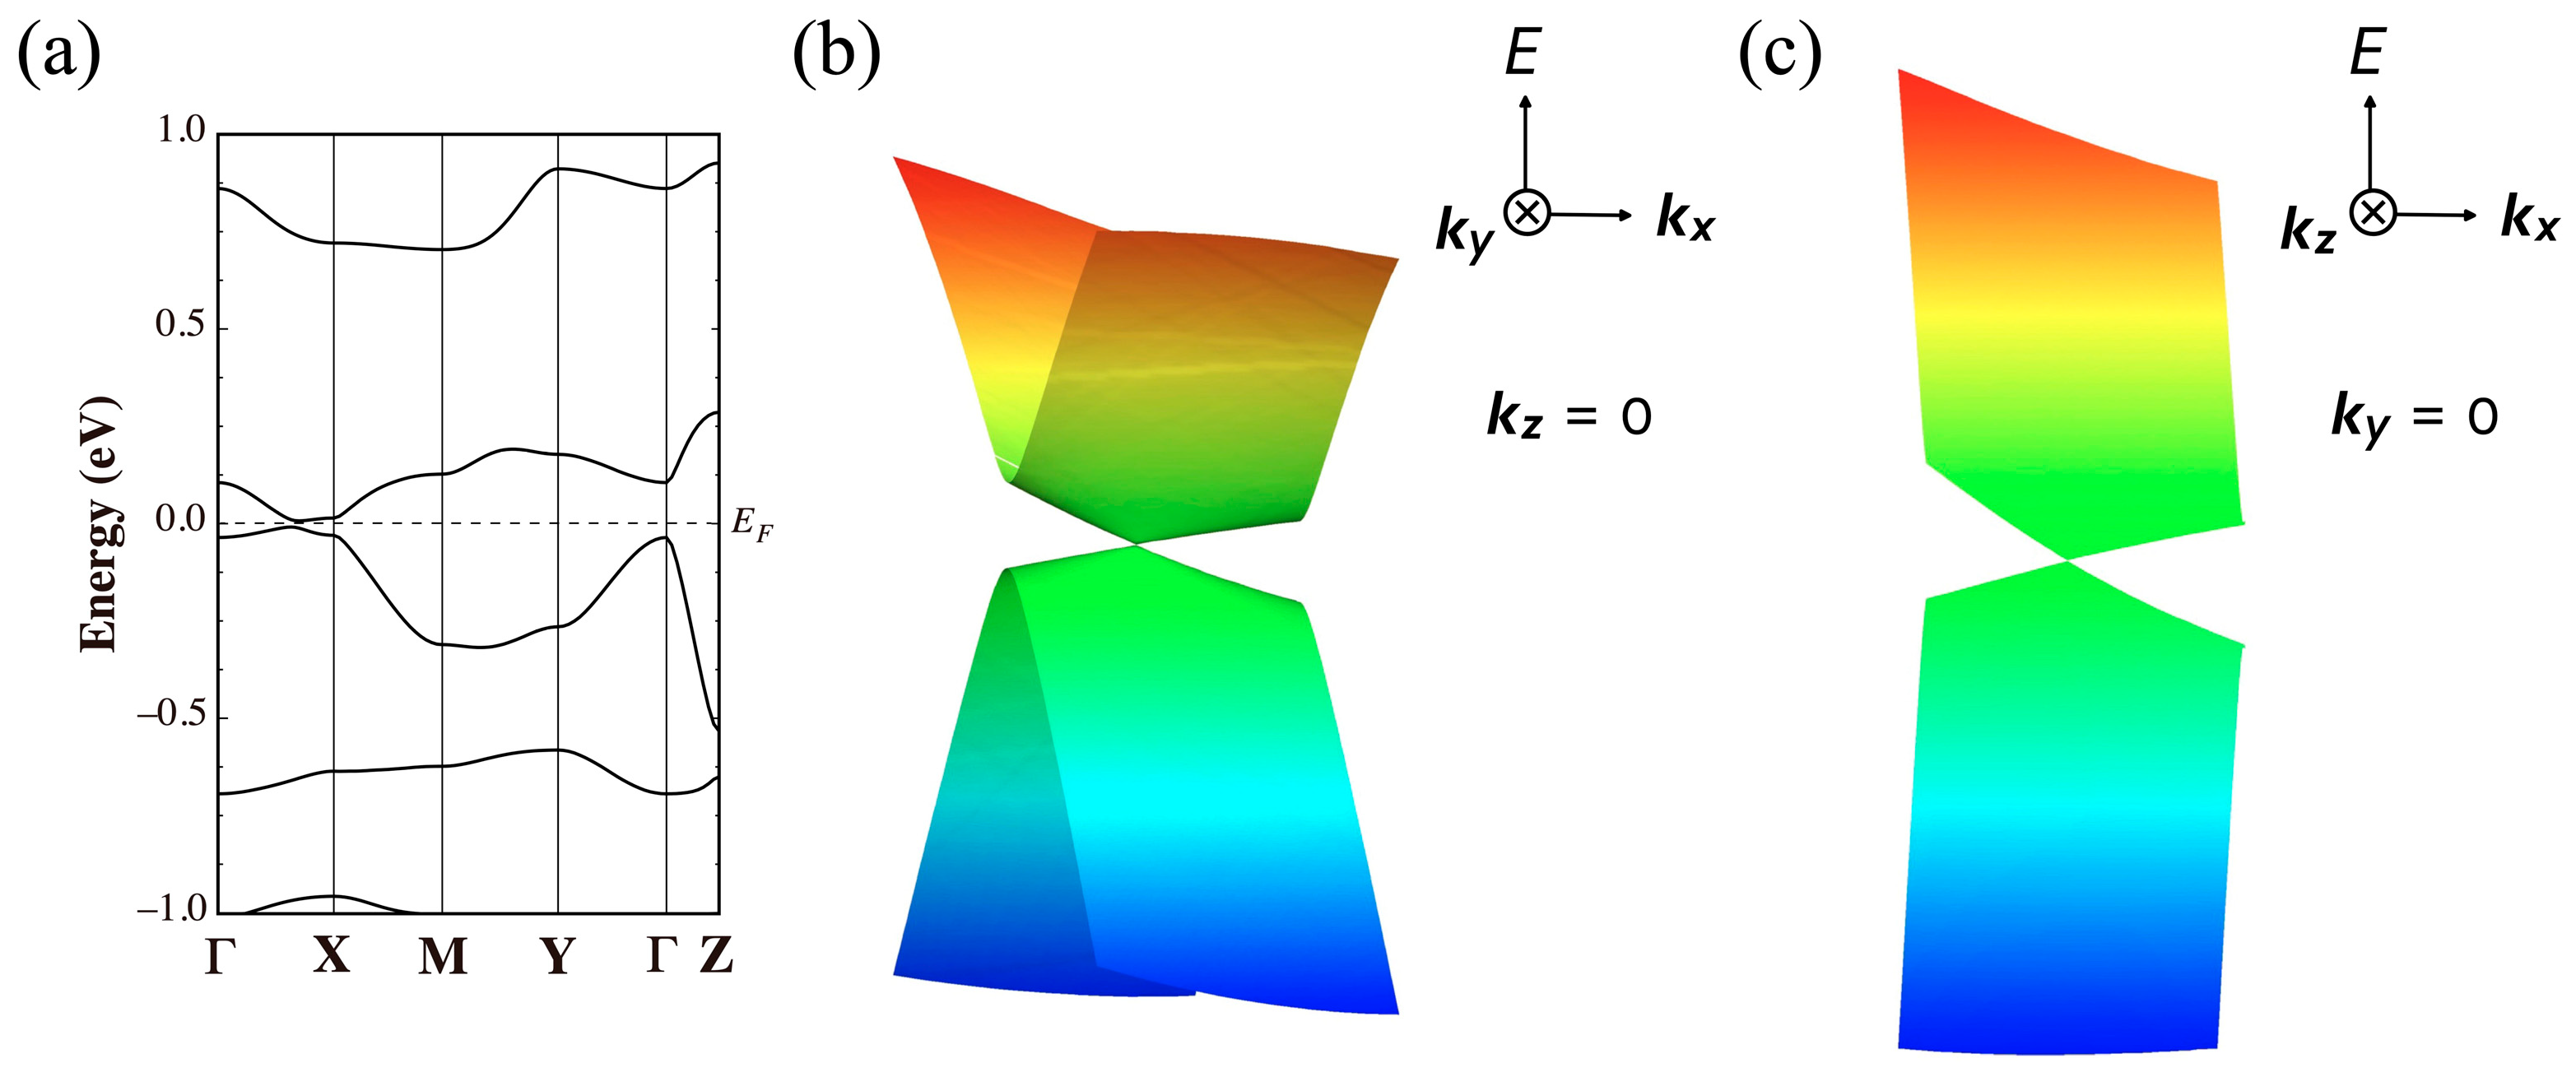
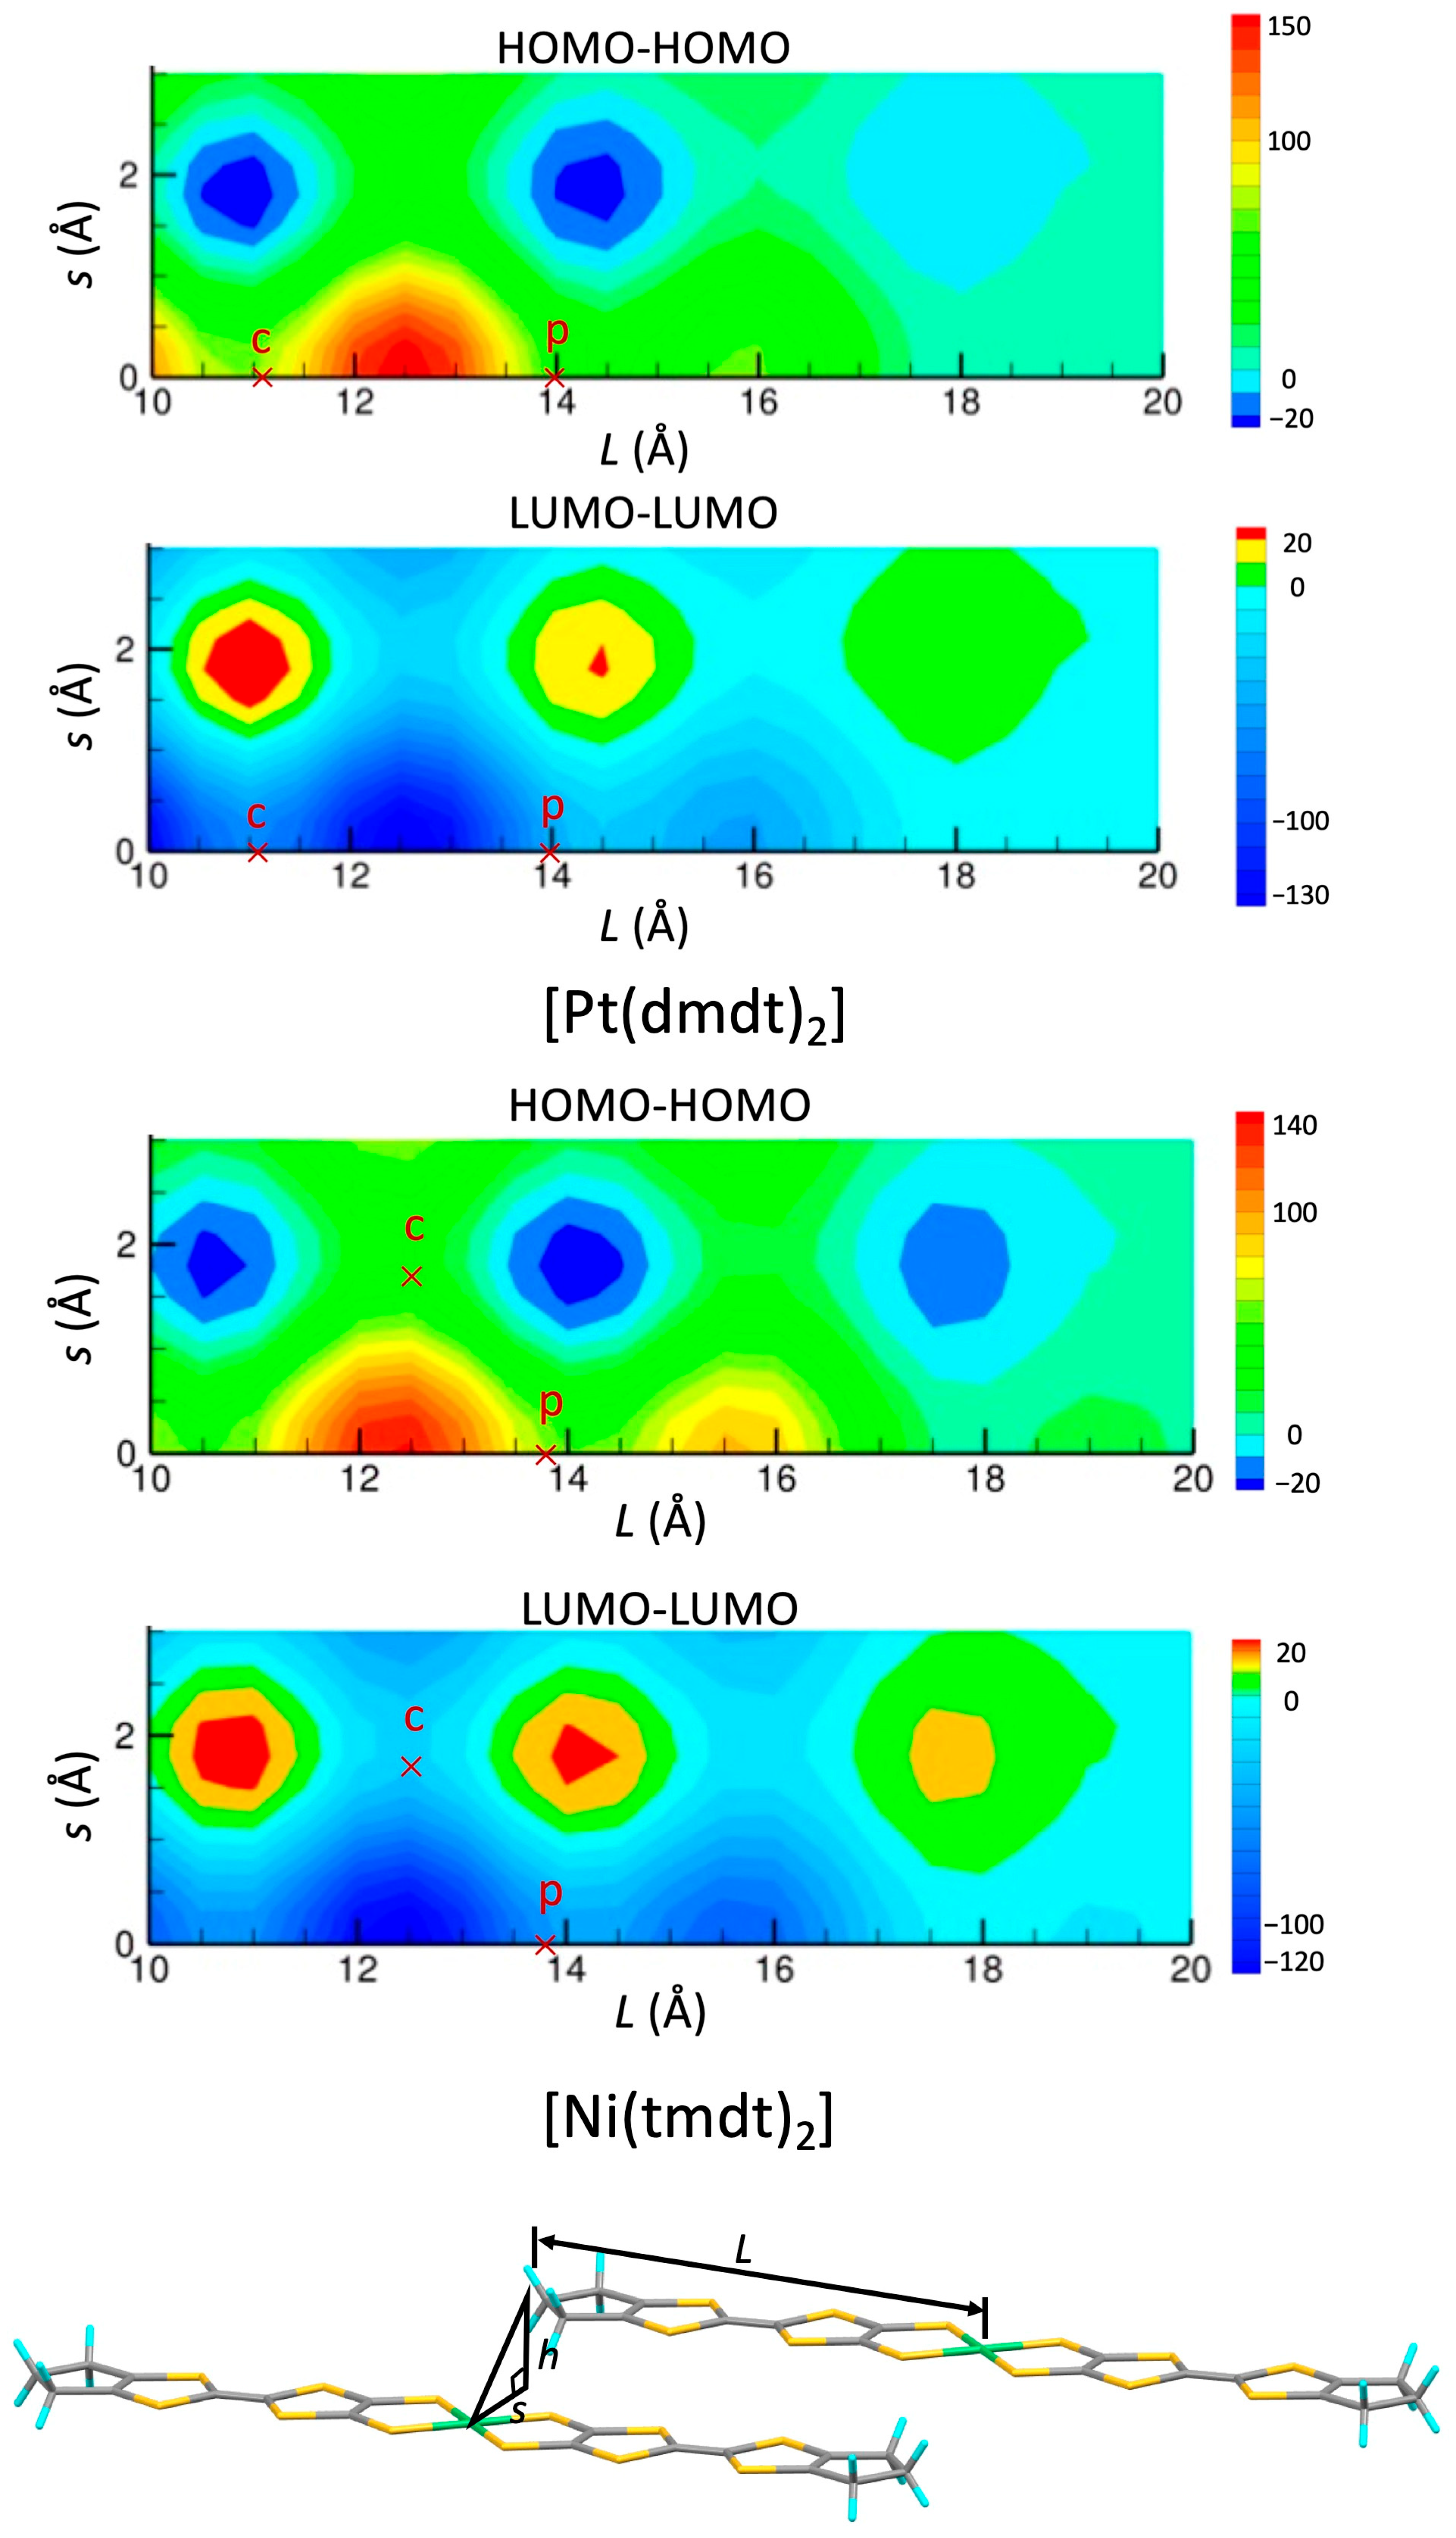
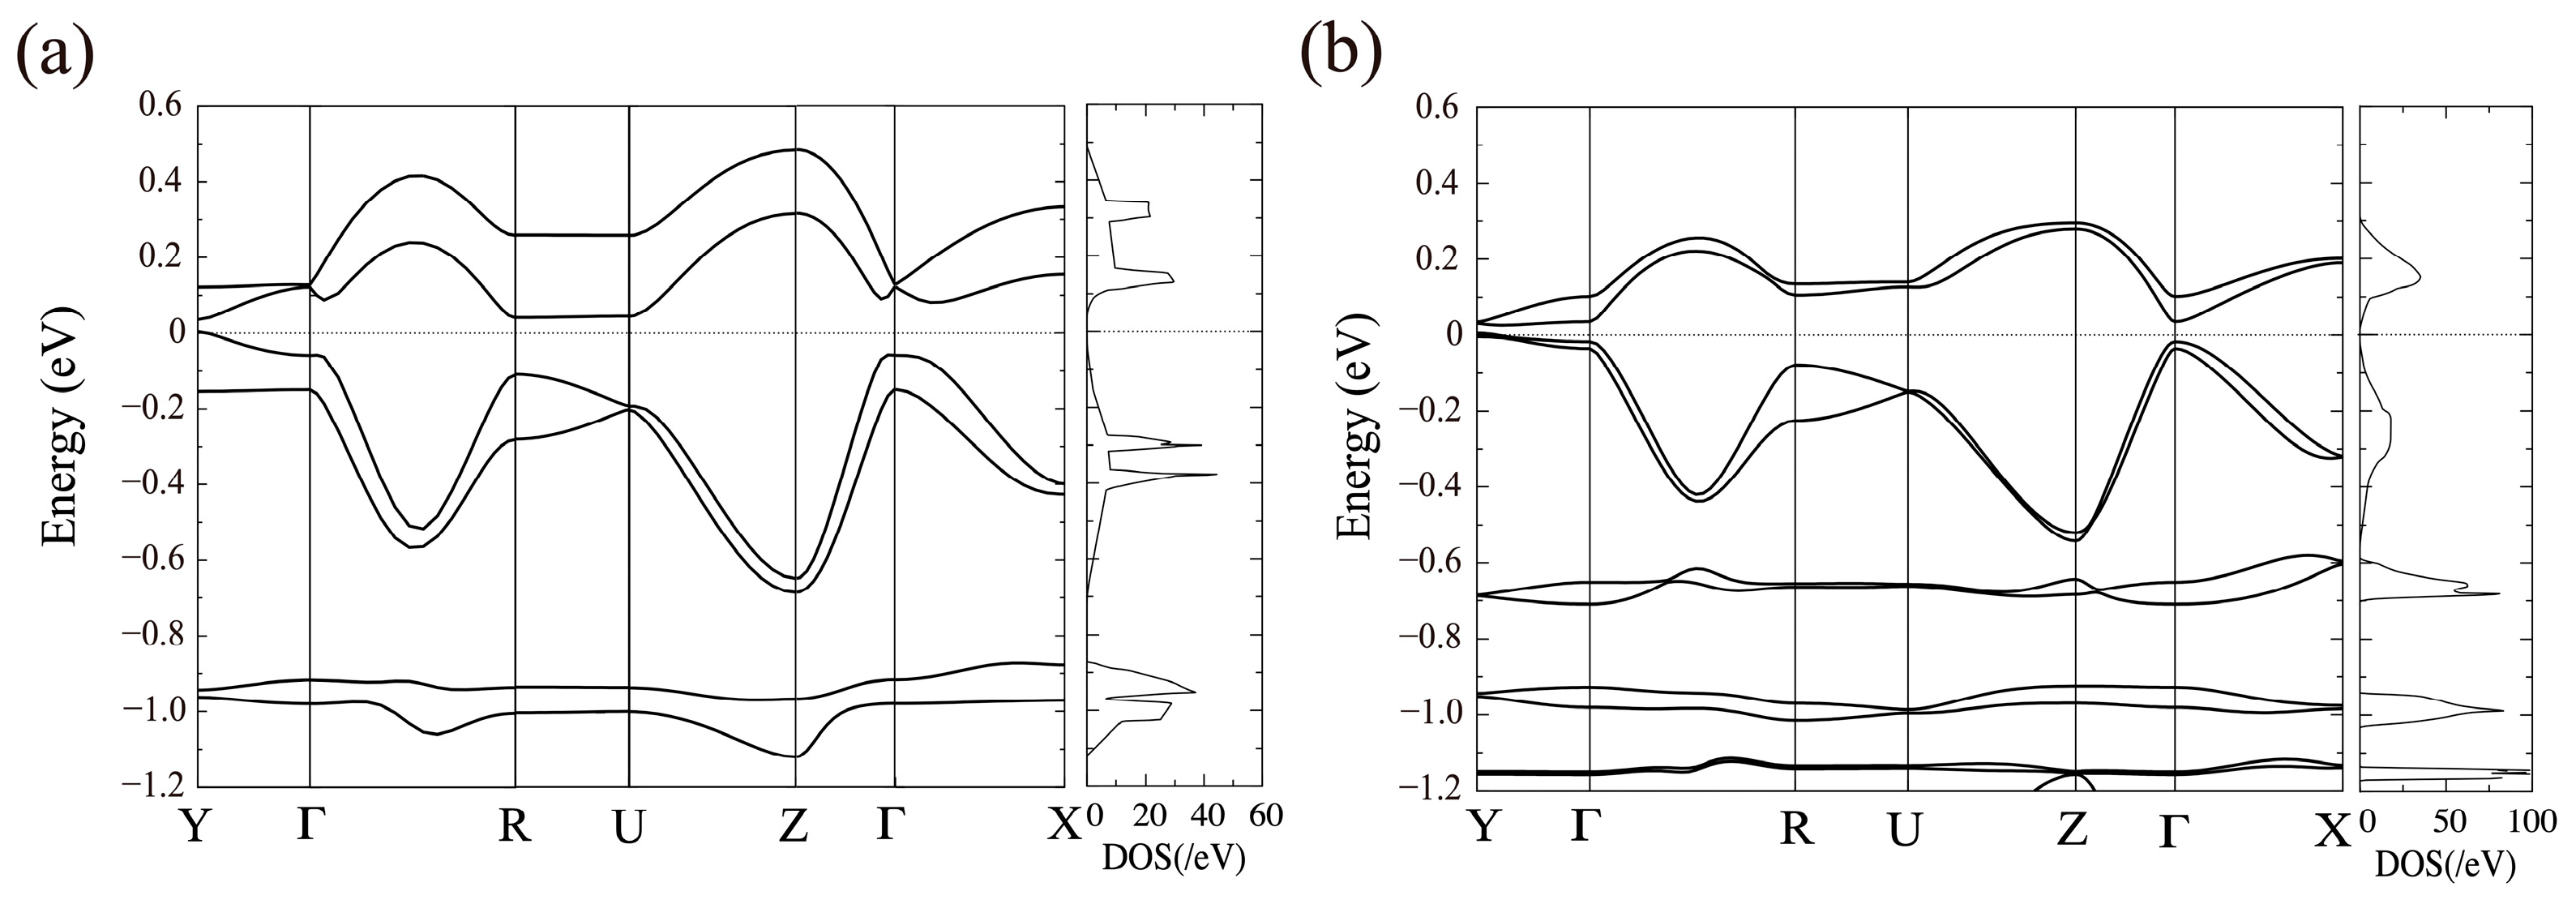
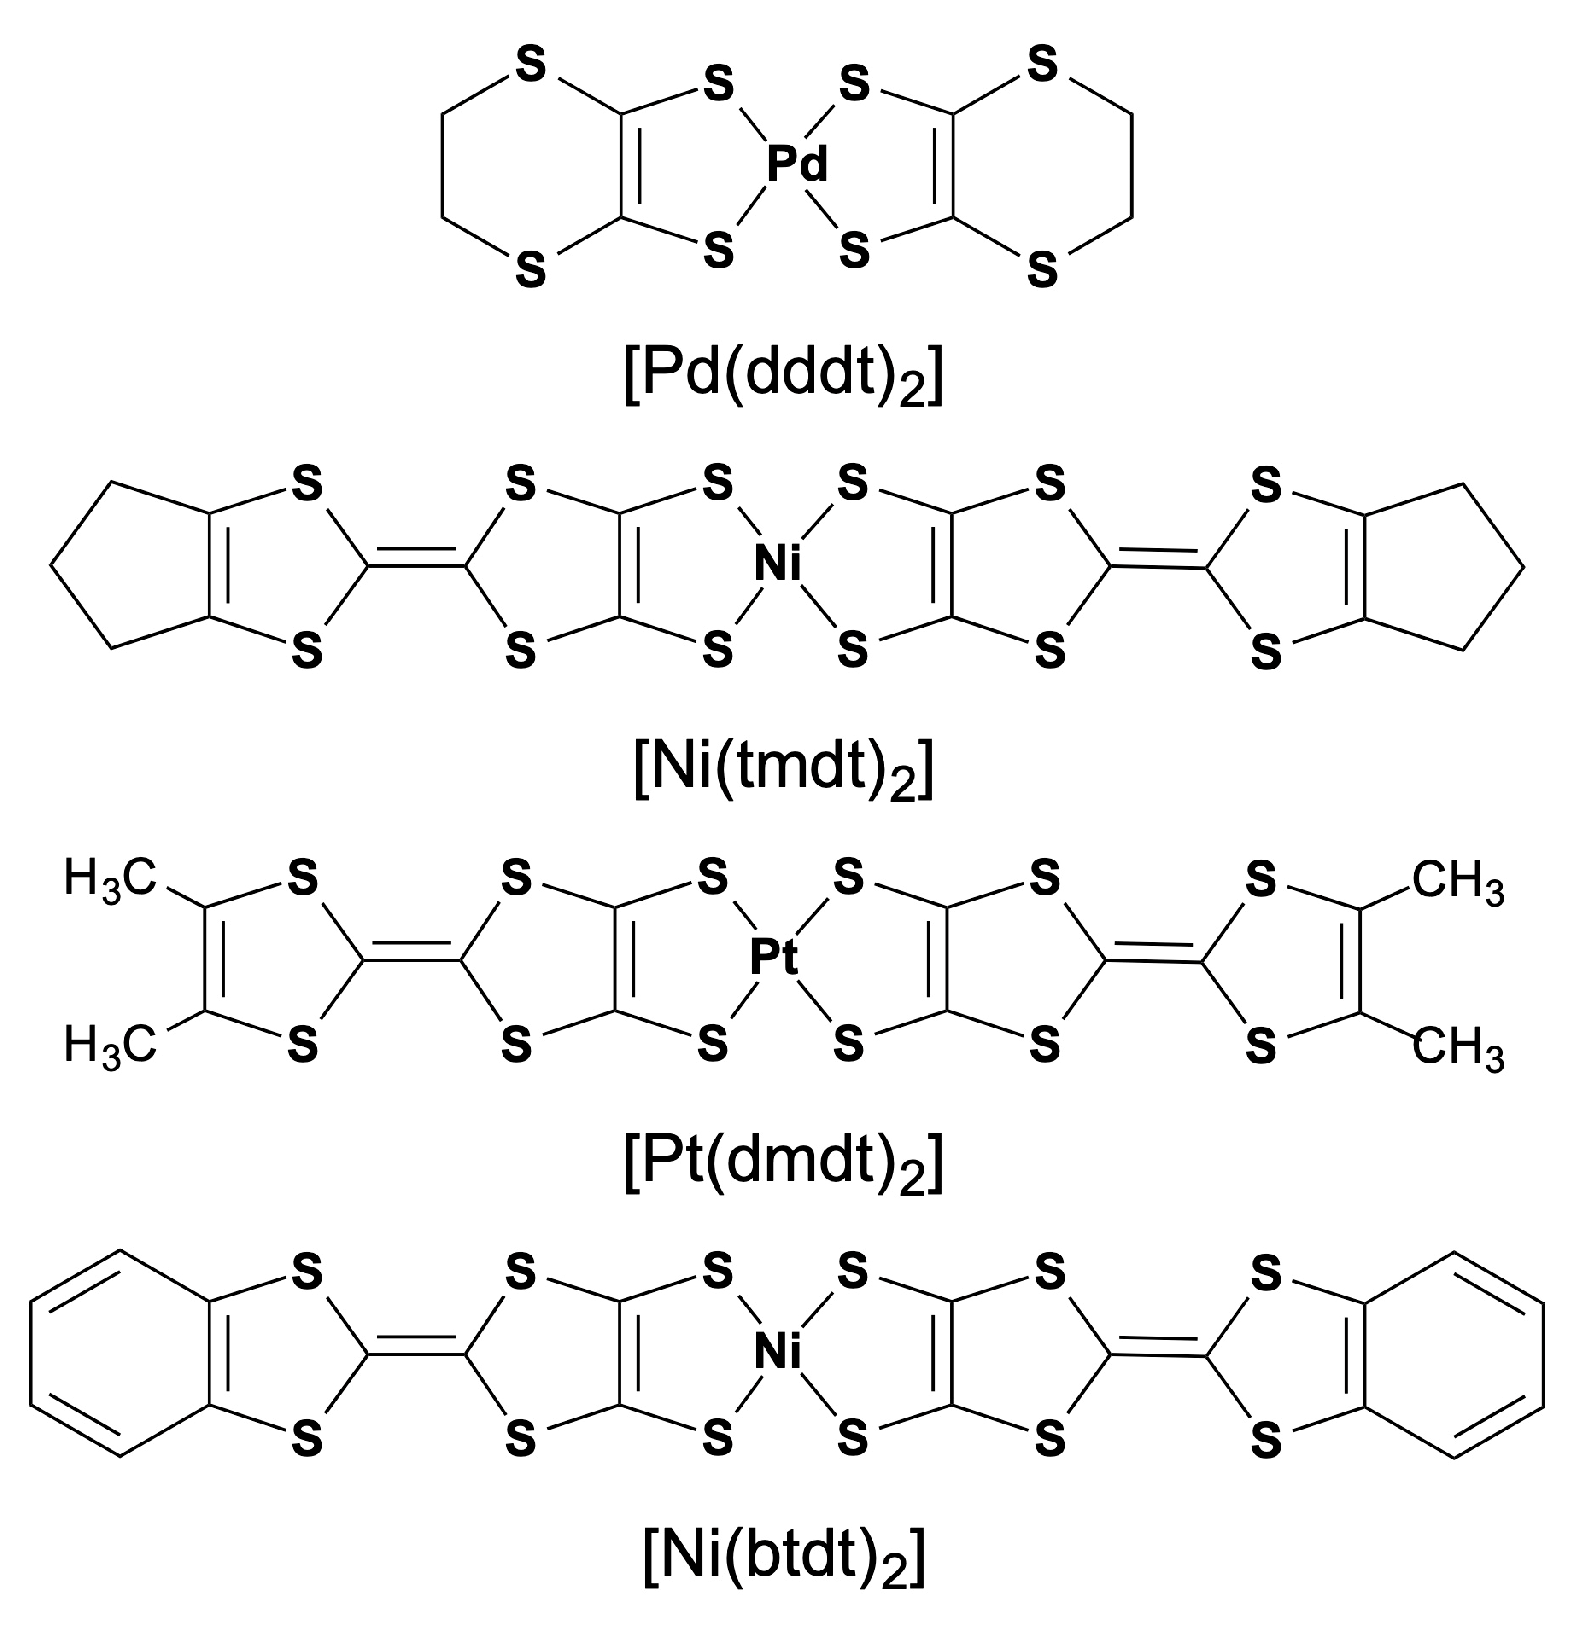
3.1. [Ni(tmdt)2]
3.1.1. Tight-Binding Model

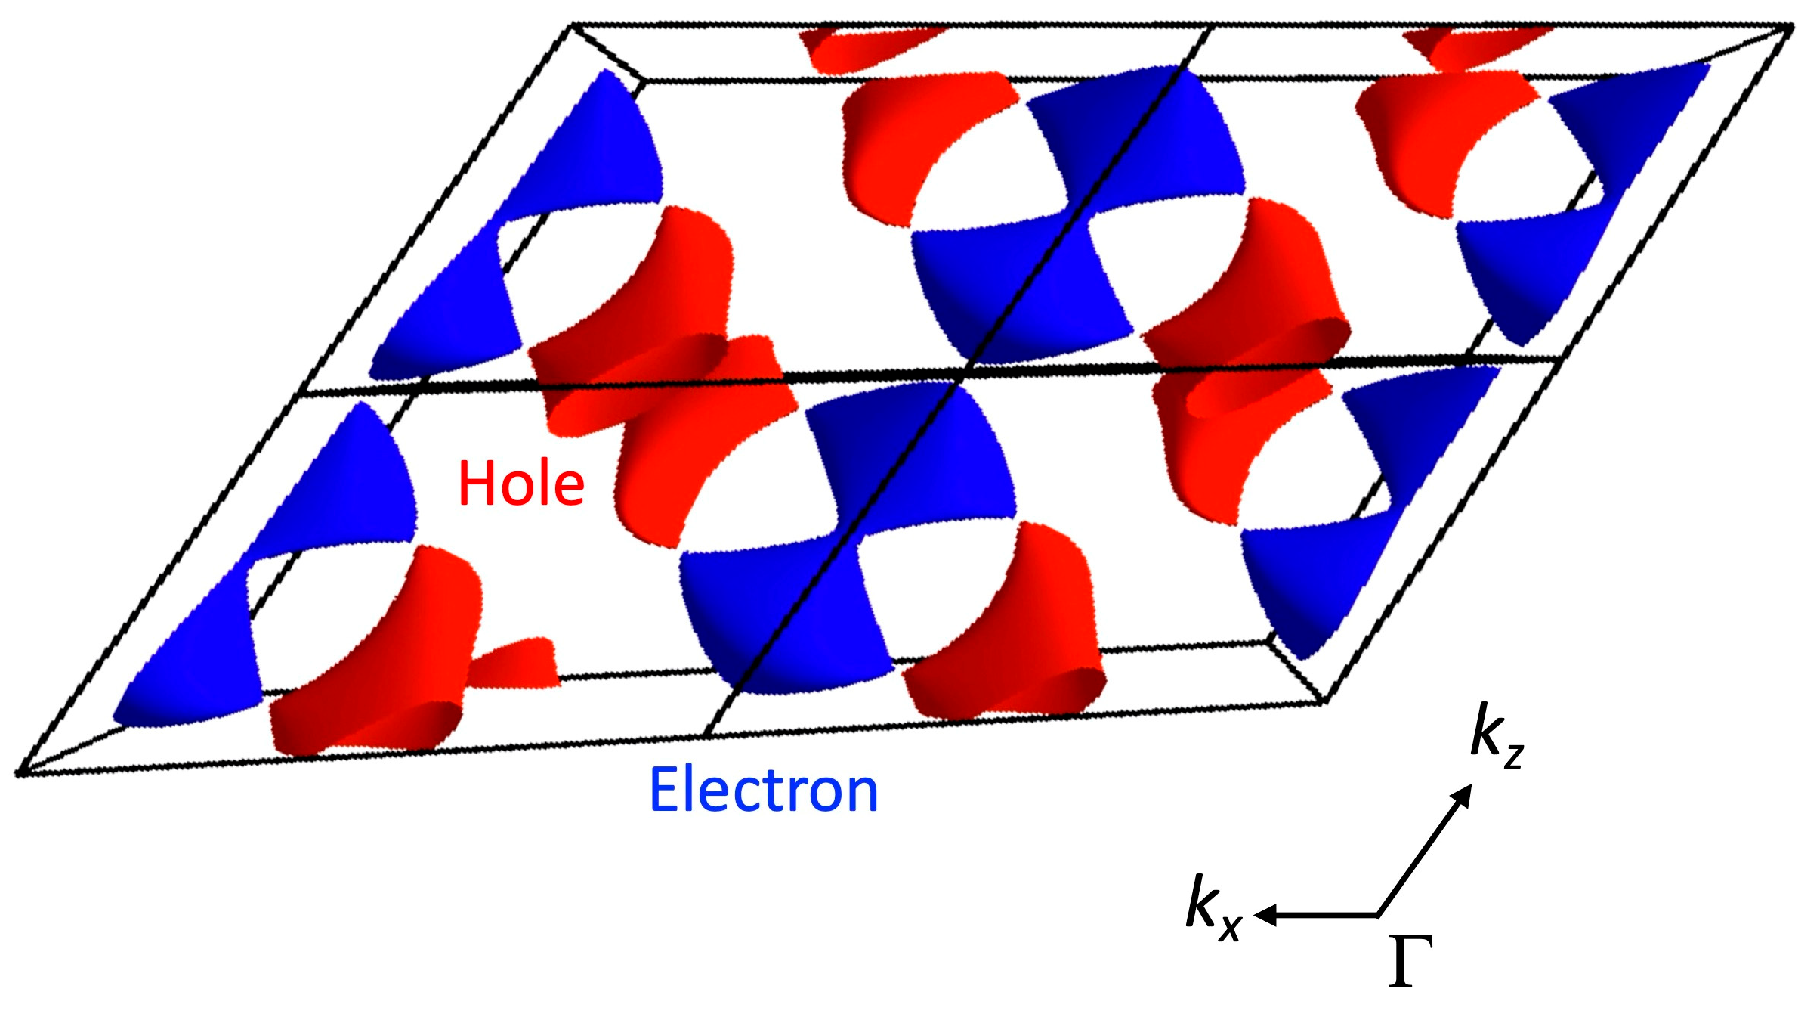
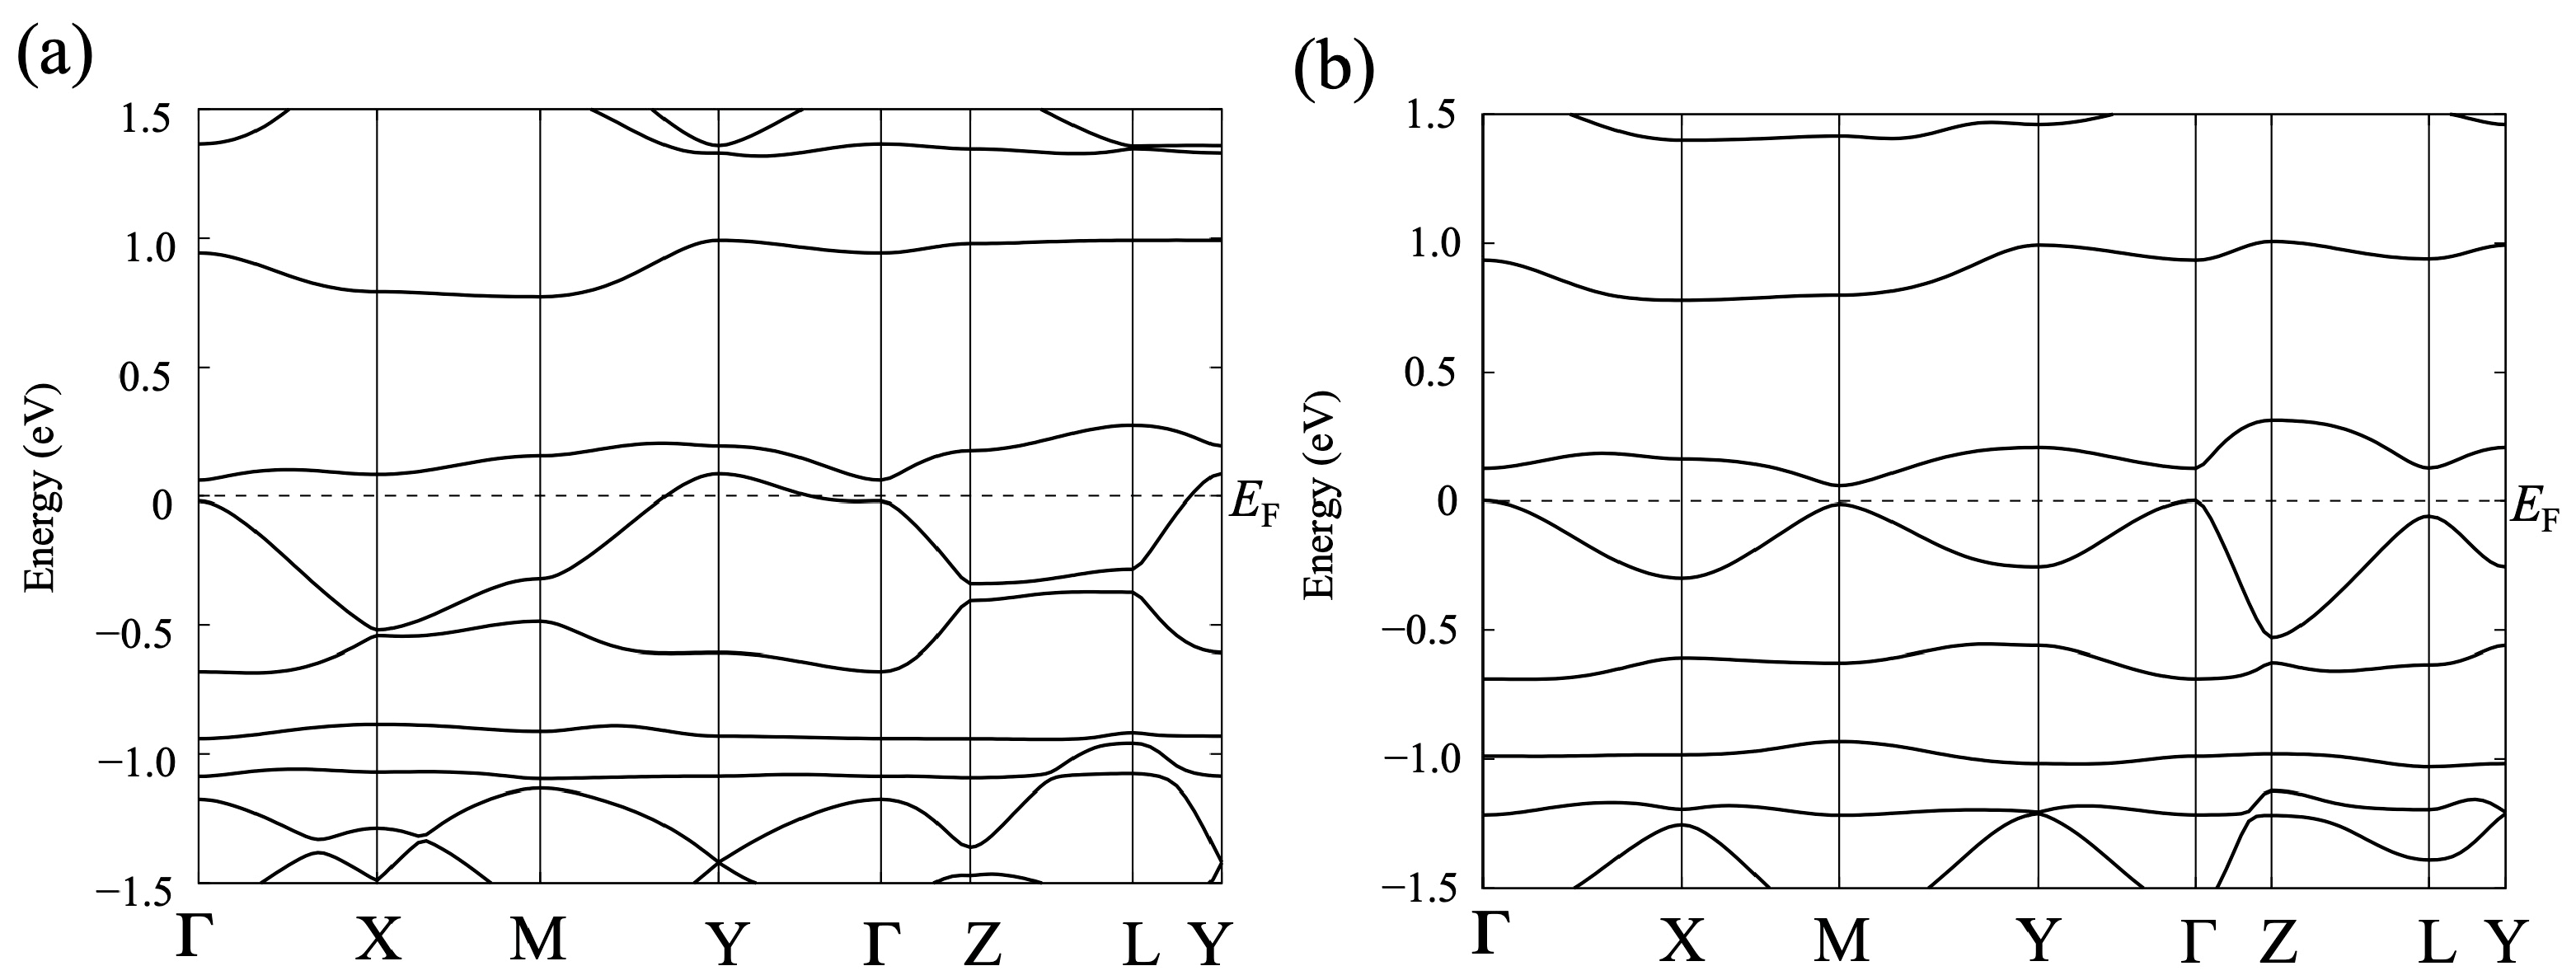
3.1.2. First-Principles DFT Calculations
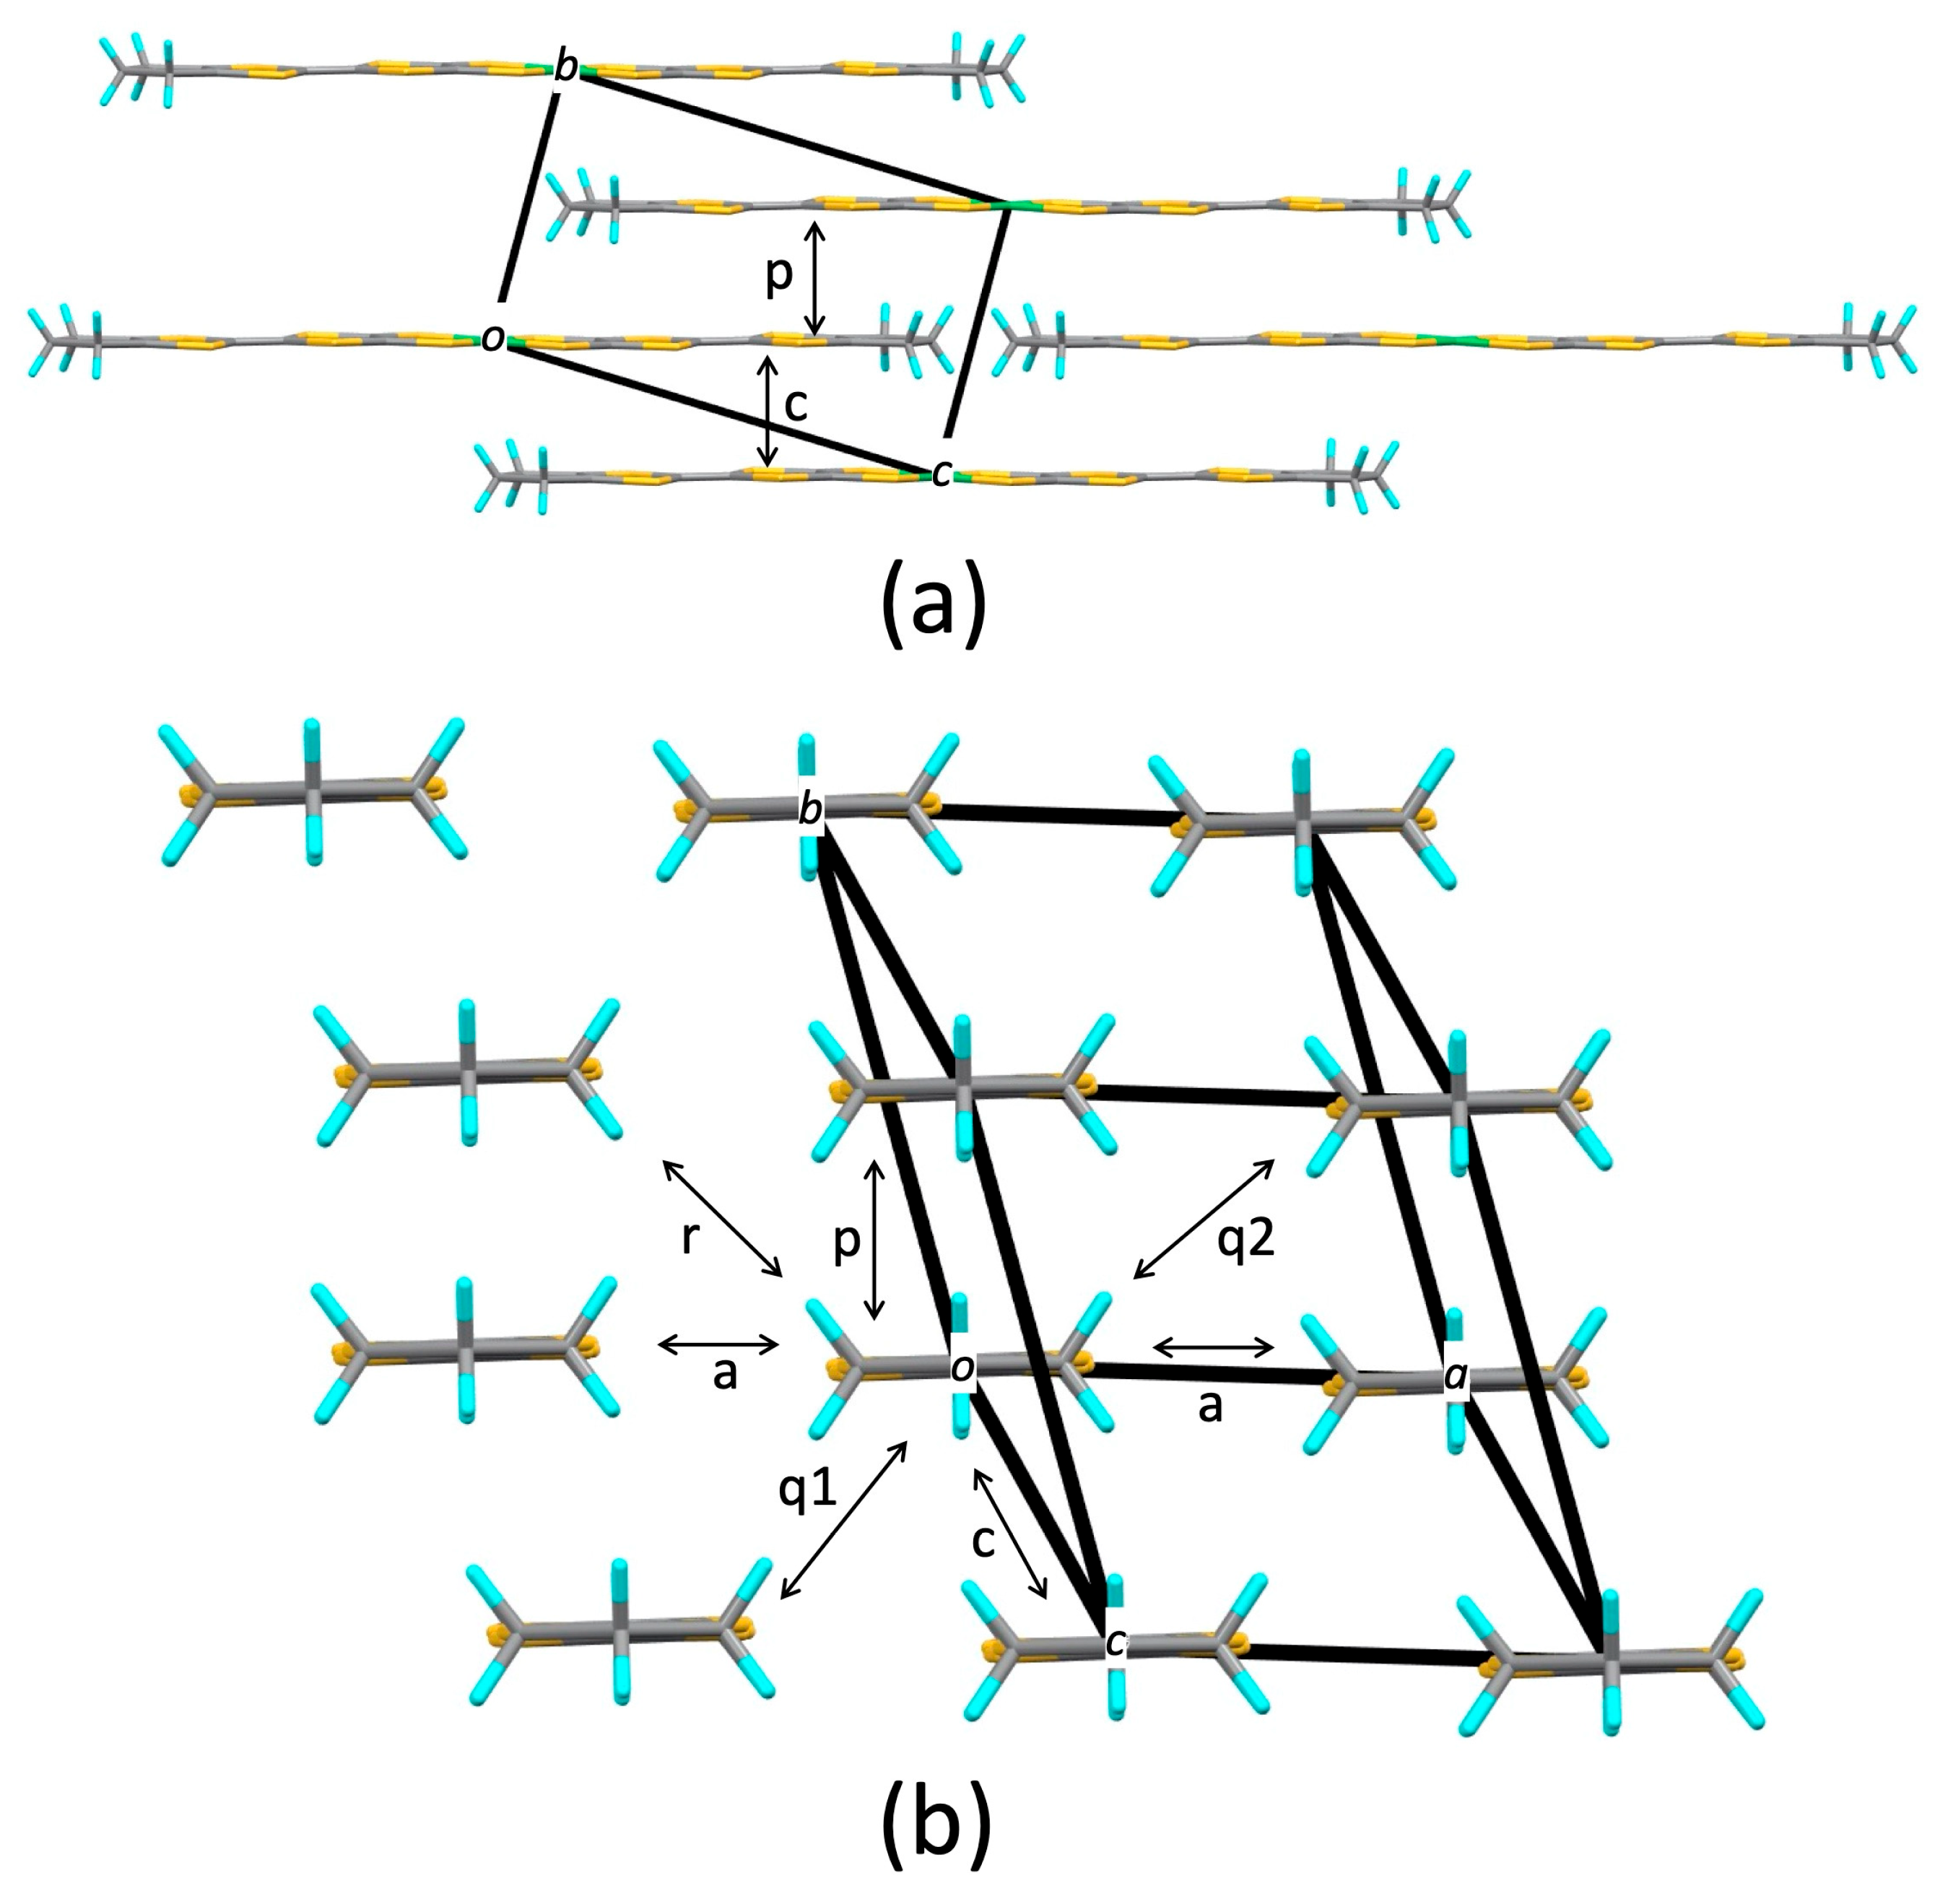
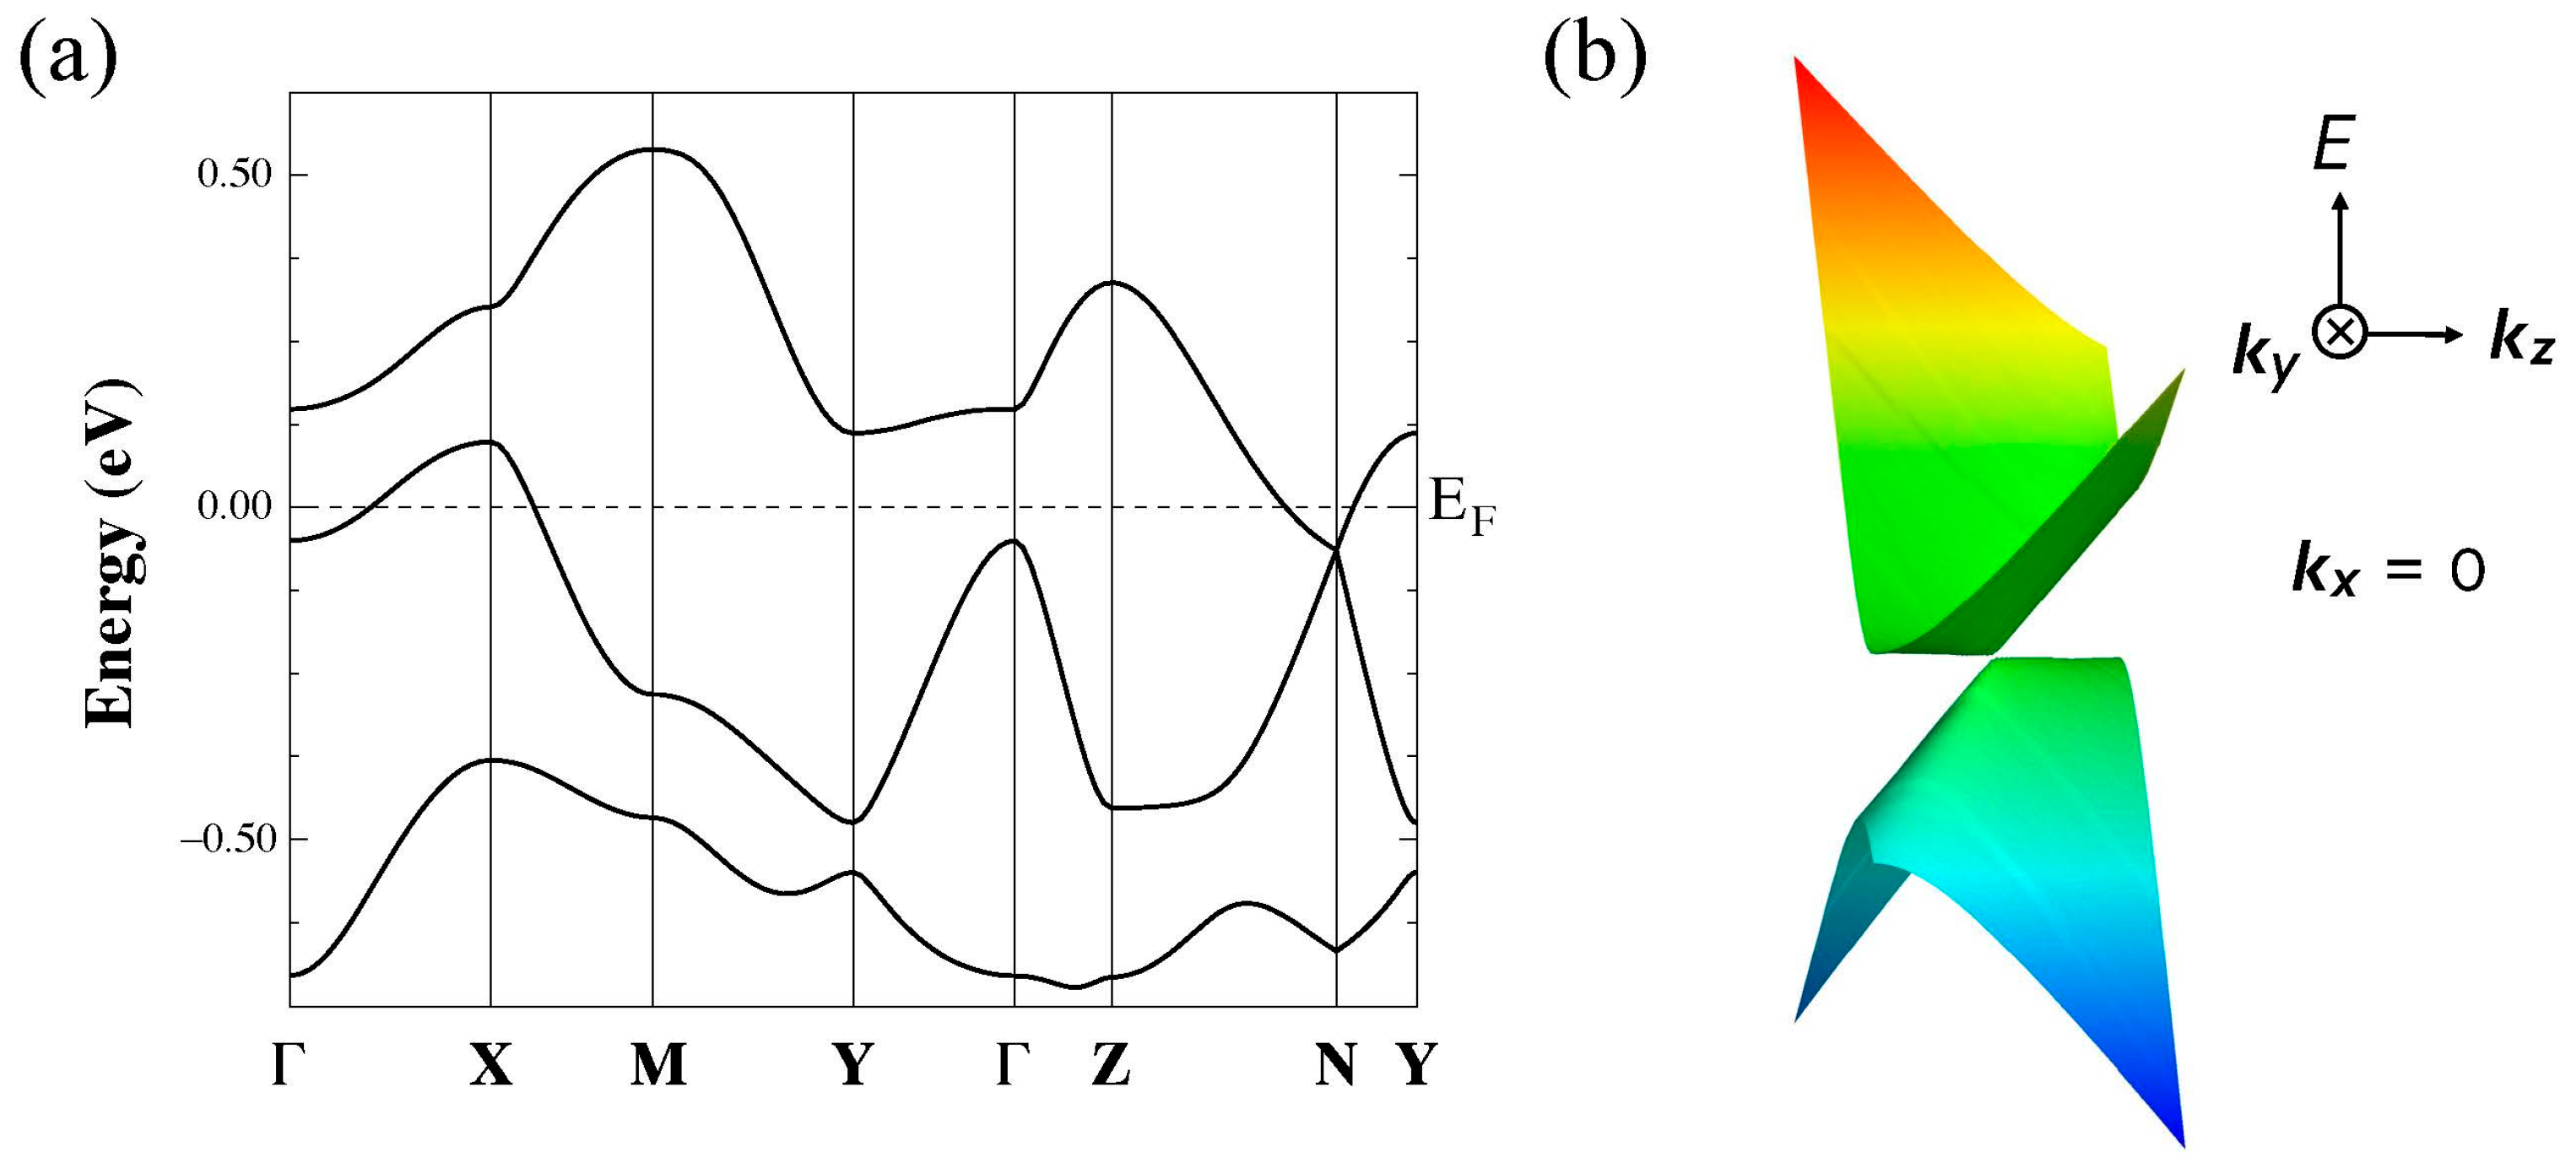
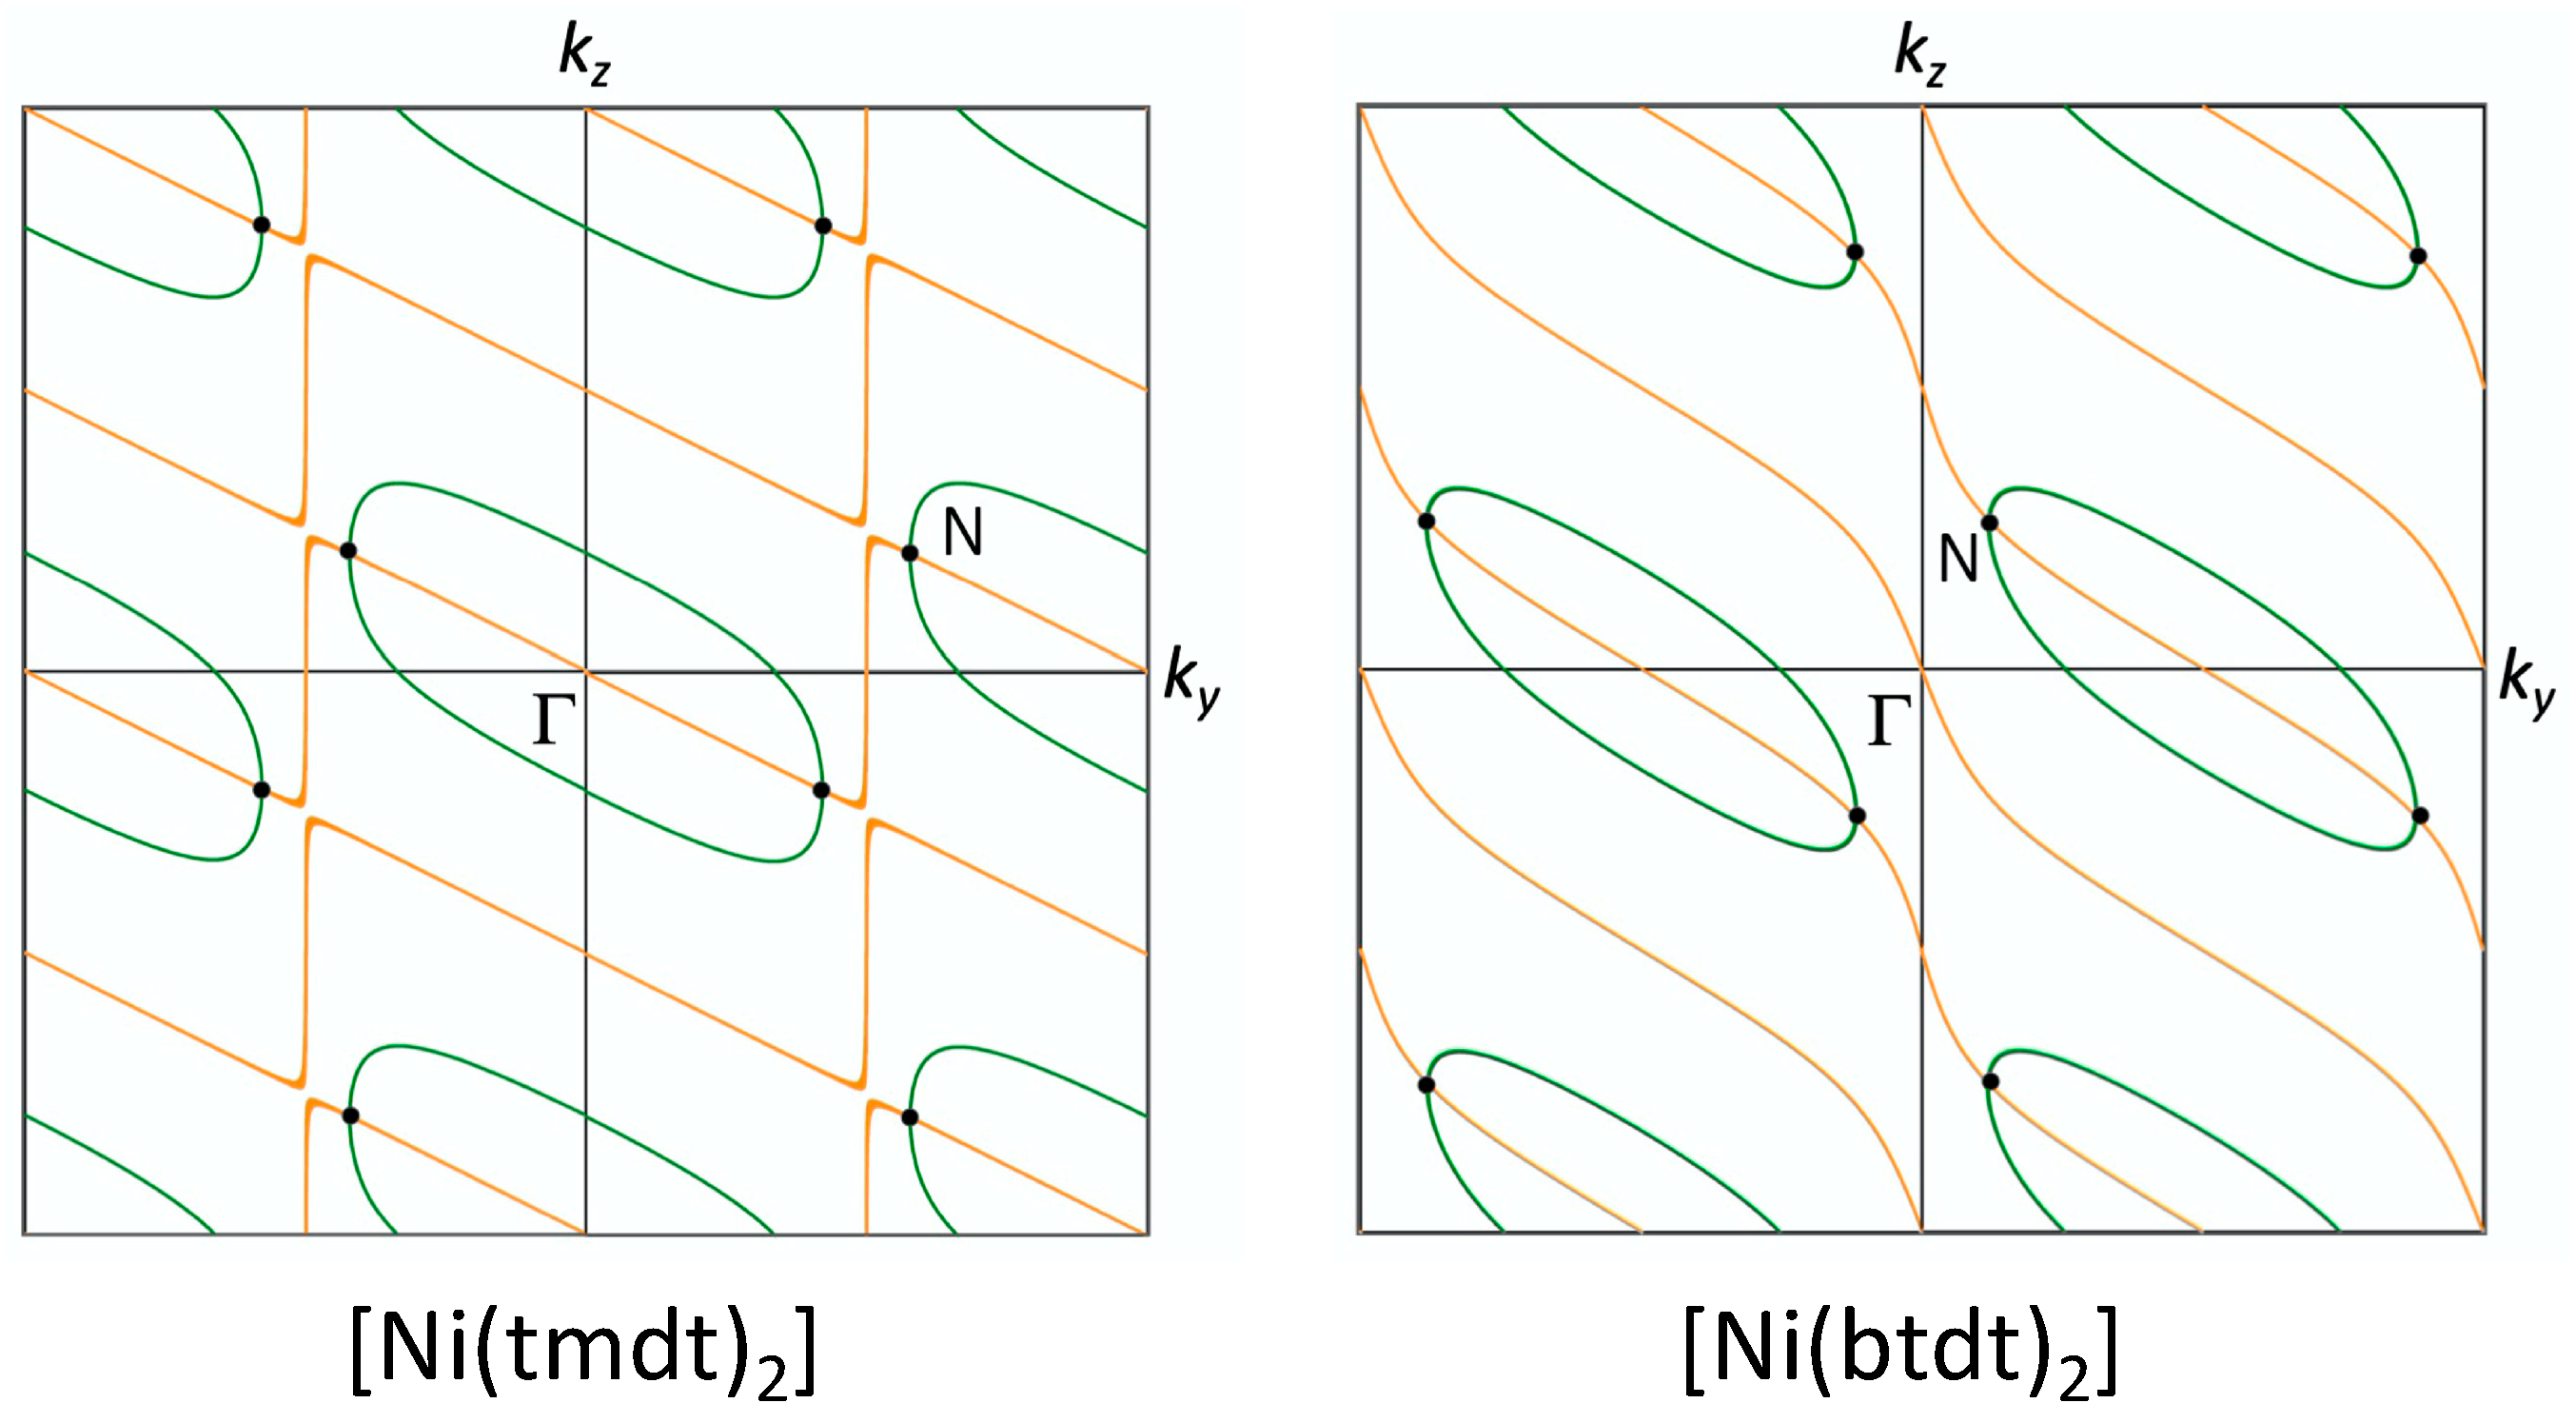
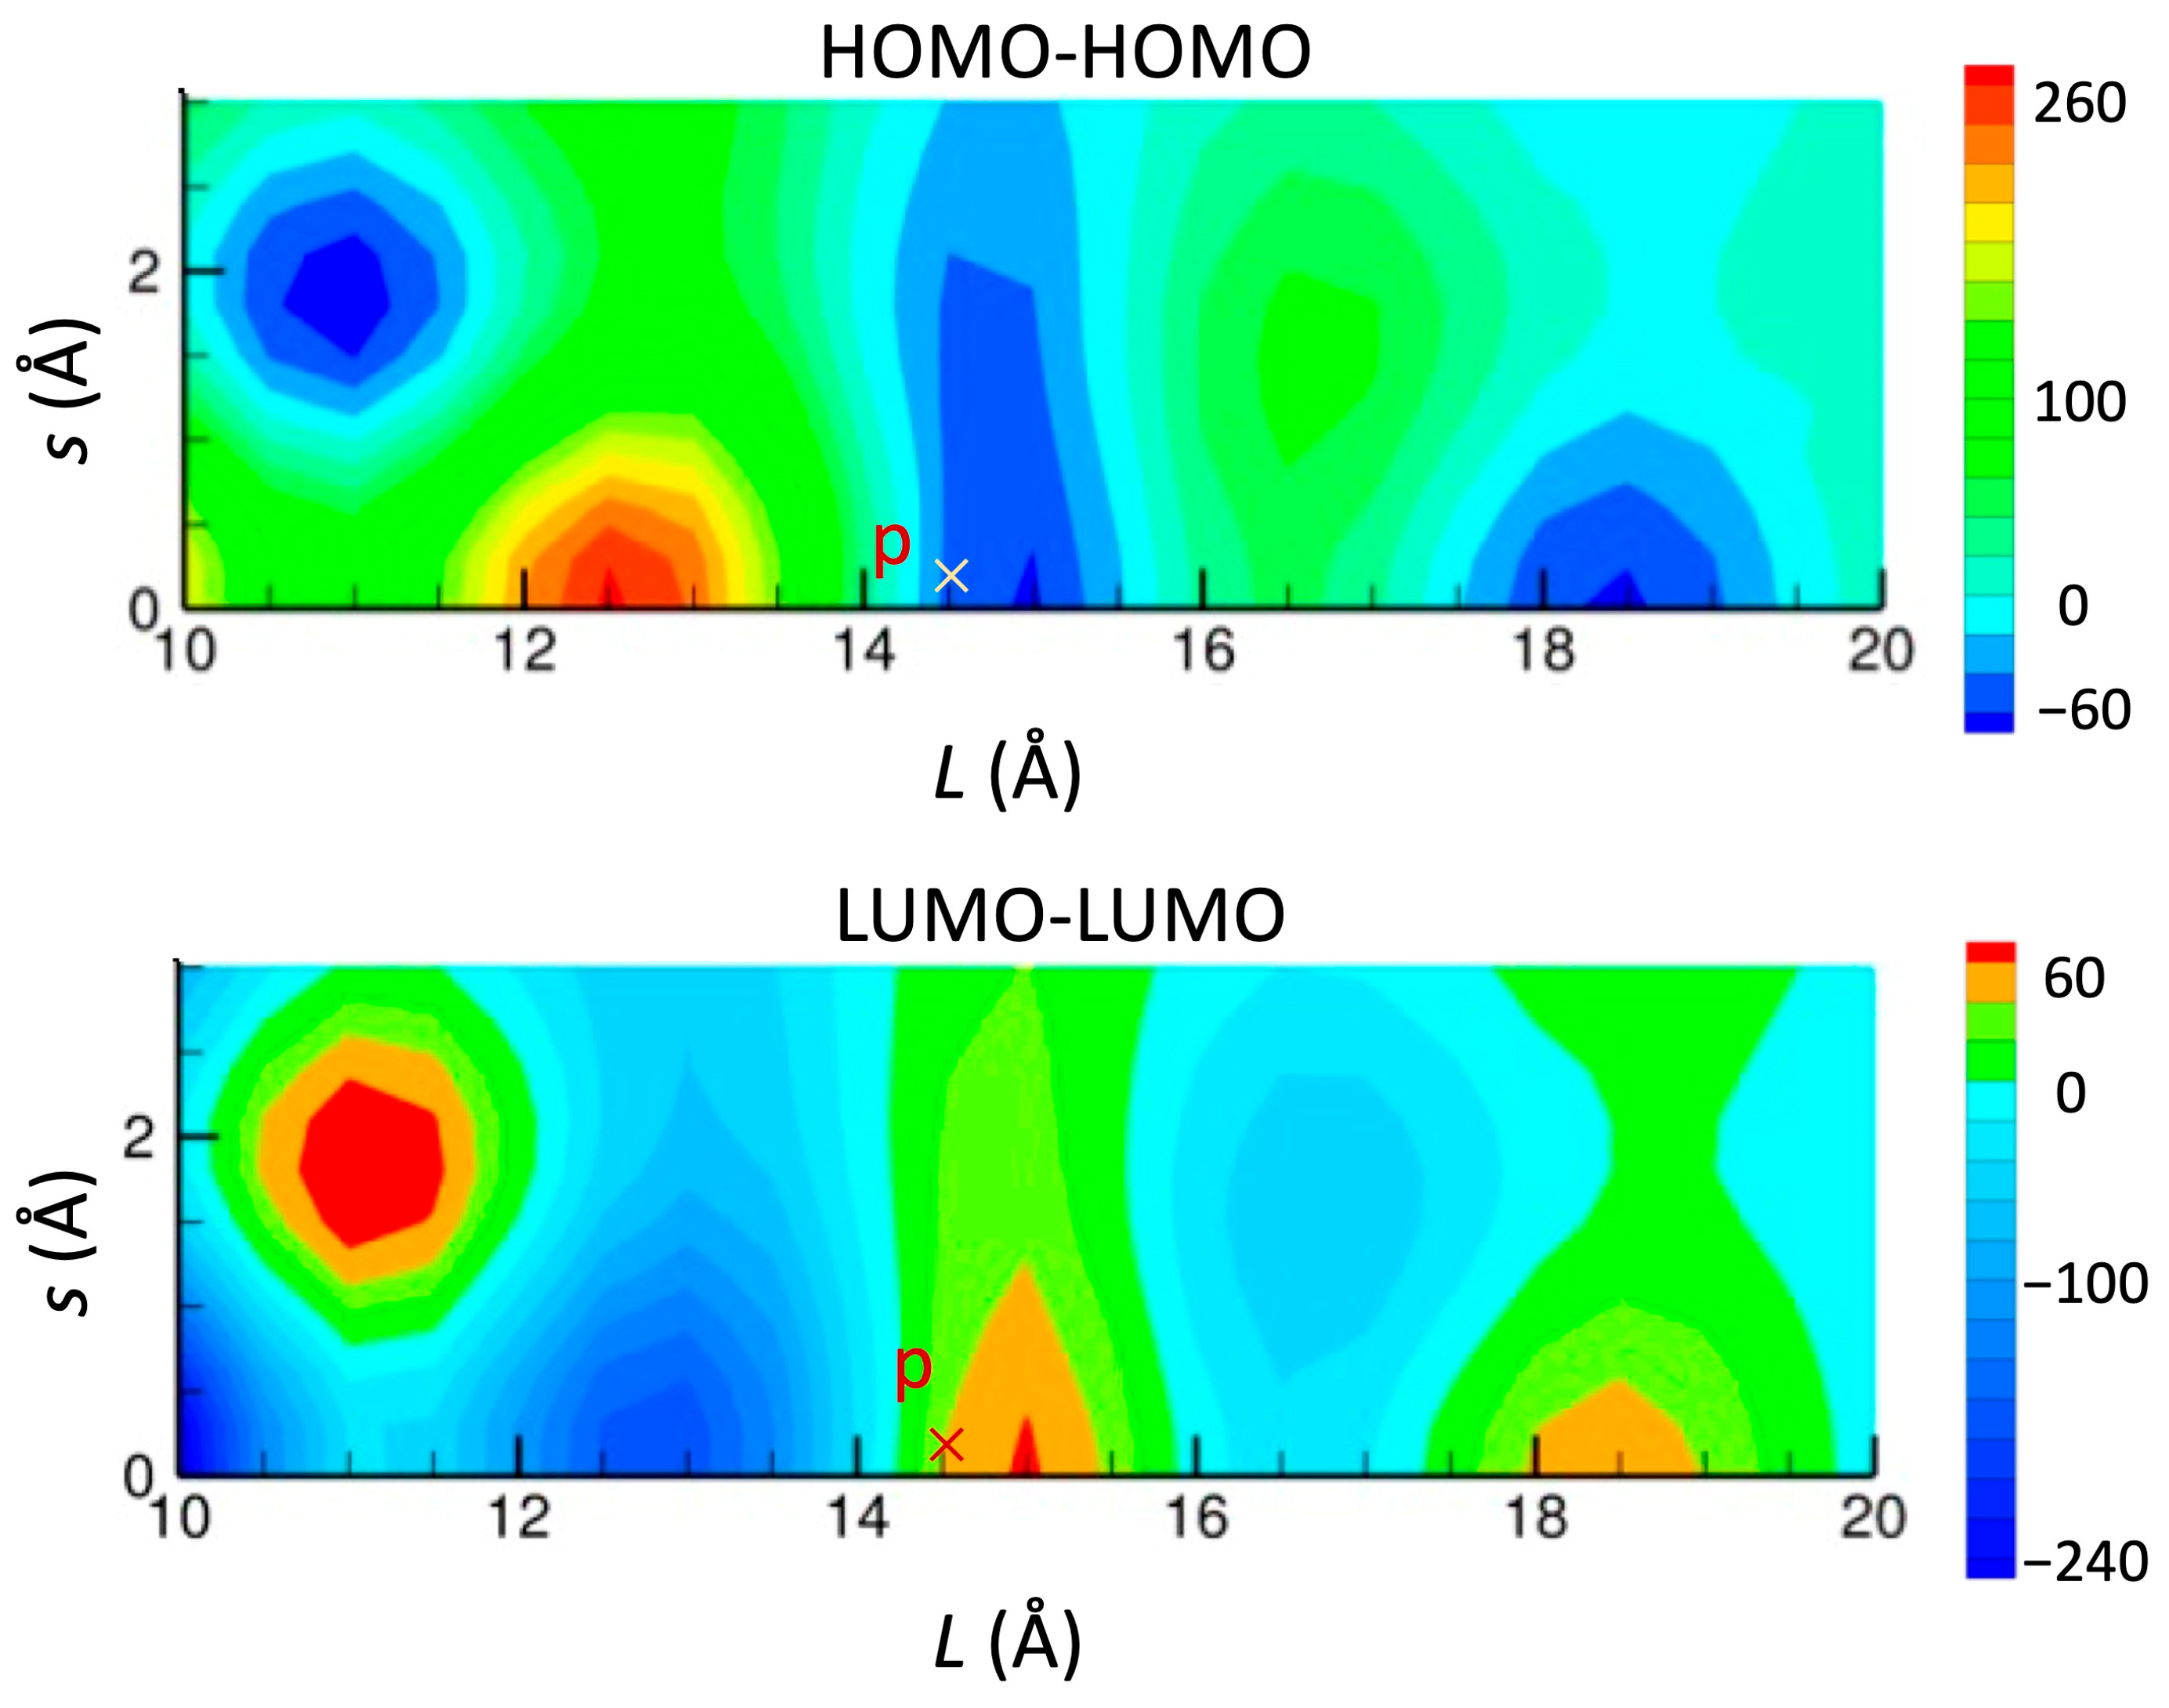
3.2. [Ni(btdt)2]
3.2.1. Tight-Binding Model

3.2.2. First-Principles DFT Calculations

4. Discussion
4.1. Dirac Cone Formation in Single-Component Molecular Conductors


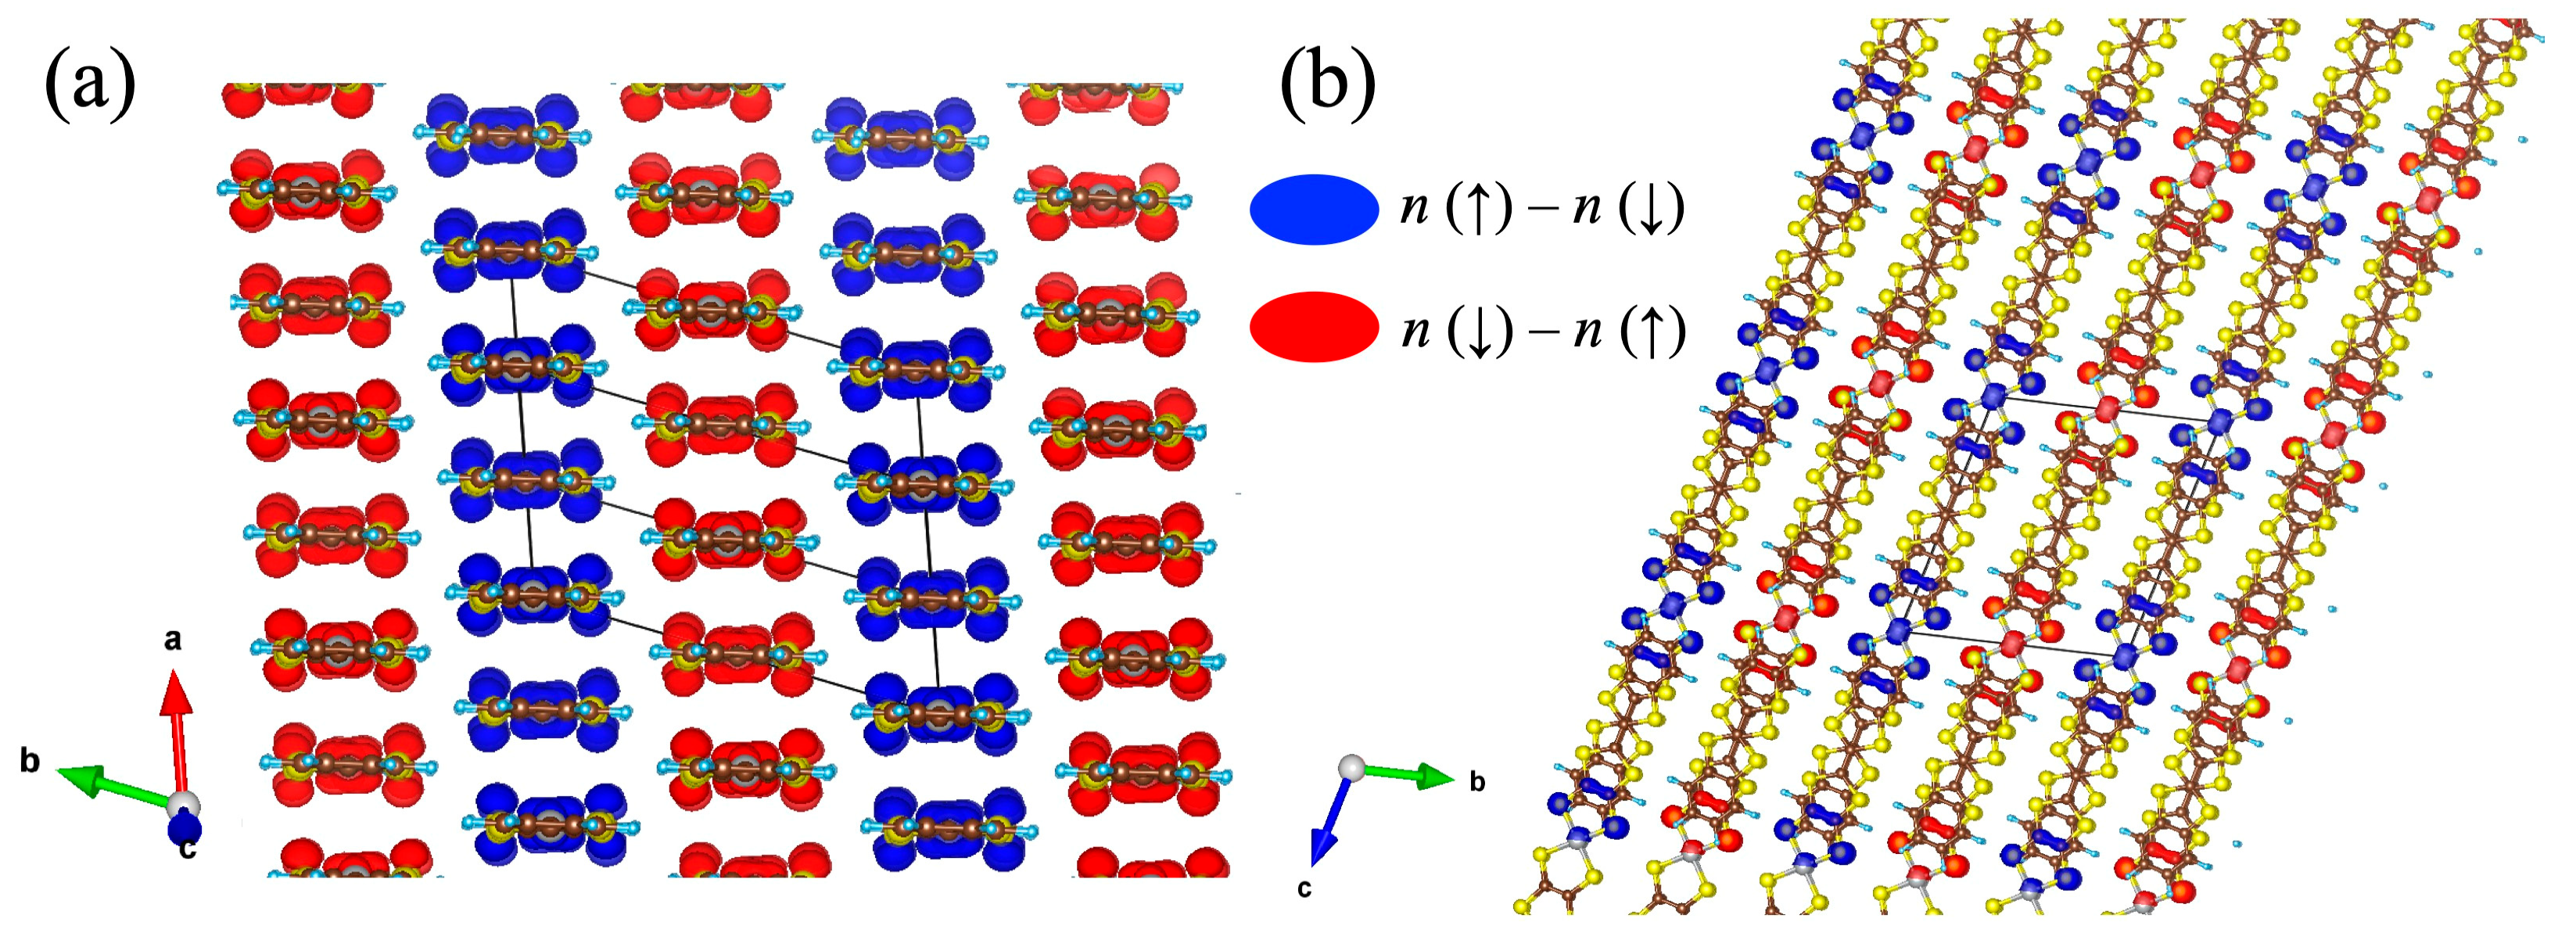
4.2. Spin Ordering in [Ni(btdt)2]: Antiferromagnetic HSE06 Calculations
5. Conclusions
Author Contributions
Funding
Institutional Review Board Statement
Informed Consent Statement
Data Availability Statement
Acknowledgments
Conflicts of Interest
Appendix A. Crystal Data of [Ni(btdt)2] Optimized with the vdw-df2-b86r Functional
| Atom | x | y | z |
| Ni | 0.0000 | 0.0000 | 0.0000 |
| S1 | 0.2206 | −0.0388 | 0.0741 |
| S2 | −0.1432 | 0.1154 | 0.1400 |
| S3 | 0.3365 | 0.0884 | 0.2961 |
| S4 | −0.0134 | 0.2300 | 0.3580 |
| S5 | 0.4602 | 0.2102 | 0.5300 |
| S6 | 0.1176 | 0.3598 | 0.5927 |
| C1 | 0.1804 | 0.0637 | 0.1994 |
| C2 | 0.5499 | 0.3109 | 0.7322 |
| C3 | 0.0192 | 0.1324 | 0.2288 |
| C4 | 0.1948 | 0.1925 | 0.3948 |
| C5 | 0.2495 | 0.2466 | 0.4943 |
| C6 | 0.4262 | 0.3049 | 0.6600 |
| C7 | 0.2691 | 0.3799 | 0.6900 |
| C8 | 0.2393 | 0.4651 | 0.7923 |
| C9 | 0.3672 | 0.4743 | 0.8641 |
| C10 | 0.5199 | 0.3961 | 0.8342 |
| H1 | 0.1208 | 0.5274 | 0.8155 |
| H2 | 0.3477 | 0.5446 | 0.9444 |
| H3 | 0.6189 | 0.4020 | 0.8906 |
| H4 | 0.6678 | 0.2480 | 0.7085 |
References
- Tanaka, H.; Okano, Y.; Kobayashi, H.; Suzuki, W.; Kobayashi, A. A Three-Dimensional Synthetic Metallic Crystal Composed of Single-Component Molecules. Science 2001, 291, 285–287. [Google Scholar] [CrossRef] [PubMed]
- Rovira, C.; Novoa, J.J.; Mozos, J.-L.; Ordejon, P.; Canadell, E. First-principles study of the neutral molecular metal Ni(tmdt)2. Phys. Rev. B 2002, 65, 081104. [Google Scholar] [CrossRef]
- Tanaka, H.; Tokumoto, M.; Ishibashi, S.; Graf, D.; Choi, E.S.; Brooks, J.S.; Yasuzuka, S.; Okano, Y.; Kobayashi, H.; Kobayashi, A. Observation of Three-Dimensional Fermi Surfaces in a Single-Component Molecular Metal, [Ni(tmdt)2]. J. Am. Chem. Soc. 2004, 126, 10518–10519. [Google Scholar] [CrossRef] [PubMed]
- Seo, H.; Ishibashi, S.; Okano, Y.; Kobayashi, H.; Kobayashi, A.; Fukuyama, H.; Terakura, K. Single-Component Molecular Metals as Multiband π–d Systems. J. Phys. Soc. Jpn. 2008, 77, 023714. [Google Scholar] [CrossRef]
- Kobayashi, A.; Fujiwara, E.; Kobayashi, H. Single-Component Molecular Metals with Extended-TTF Dithiolene Ligands. Chem. Rev. 2004, 104, 5243–5264. [Google Scholar] [CrossRef]
- Velho, M.F.G.; Silva, R.A.L.; Belo, D. The quest for single component molecular metals within neutral transition metal complexes. J. Mater. Chem. C 2021, 9, 10591–10609. [Google Scholar] [CrossRef]
- Murakami, S. Phase transition between the quantum spin Hall and insulator phases in 3D: Emergence of a topological gapless phase. New J. Phys. 2007, 9, 356. [Google Scholar] [CrossRef]
- Fang, C.; Weng, H.; Dai, X.; Fang, Z. Topological nodal line semimetals. Chin. Phys. B 2016, 25, 117106. [Google Scholar] [CrossRef]
- Kato, R.; Cui, H.; Tsumuraya, T.; Miyazaki, T.; Suzumura, Y. Emergence of the Dirac Electron System in a Single-Component Molecular Conductor under High Pressure. J. Am. Chem. Soc. 2017, 139, 1770–1773. [Google Scholar] [CrossRef]
- Kato, R.; Cui, H.; Minamidate, T.; Yeung, H.H.-M.; Suzumura, Y. Electronic Structure of a Single-Component Molecular Conductor [Pd(dddt)2] (dddt = 5,6-dihydro-1,4-dithiin-2,3-dithiolate) under High Pressure. J. Phys. Soc. Jpn. 2020, 89, 124706. [Google Scholar] [CrossRef]
- Zhou, B.; Ishibashi, S.; Ishii, T.; Sekine, T.; Takehara, R.; Miyagawa, K.; Kanoda, K.; Nishibori, E.; Kobayashi, A. Single-component molecular conductor [Pt(dmdt)2]—A three-dimensional ambient-pressure molecular Dirac electron system. Chem. Commun. 2019, 55, 3327–3330. [Google Scholar] [CrossRef]
- Kato, R.; Suzumura, Y. A Tight-binding Model of an Ambient-pressure Molecular Dirac Electron System with Open Nodal Lines. J. Phys. Soc. Jpn. 2020, 89, 044713. [Google Scholar] [CrossRef]
- Wen, H.-R.; Li, C.-H.; Song, Y.; Zuo, J.-L.; Zhang, B.; You, X.-Z. Synthesis and Magnetic Properties of a Highly Conducting Neutral Nickel Complex with a Highly Conjugated Tetrathiafulvalenedithiolate Ligand. Inorg. Chem. 2007, 46, 6837–6839. [Google Scholar] [CrossRef]
- Summerville, R.H.; Hoffmann, R. Tetrahedral and other M2L6 transition metal dimers. J. Am. Chem. Soc. 1976, 98, 7240–7254. [Google Scholar] [CrossRef]
- Clementi, E.; Roetti, C. Basis Functions and Their Coefficients for Ground and Certain Excited States of Neutral and Ionized Atoms, Z ≤ 54. At. Data Nucl. Data Tables 1974, 14, 177. [Google Scholar] [CrossRef]
- Wimmer, E.; Krakauer, H.; Weinert, M.; Freeman, A.J. Full-potential self-consistent linearized-augmented-plane-wave method for calculating the electronic structure of molecules and surfaces: O2 molecule. Phys. Rev. B 1981, 24, 864–875. [Google Scholar] [CrossRef]
- Weinert, M. Solution of Poisson’s equation: Beyond Ewald-type methods. J. Math. Phys. 1981, 22, 2433–2439. [Google Scholar] [CrossRef]
- Perdew, J.P.; Burke, K.; Ernzerhof, M. Generalized Gradient Approximation Made Simple. Phys. Rev. Lett. 1996, 77, 3865. [Google Scholar] [CrossRef]
- Tsumuraya, T.; Kato, R.; Suzumura, Y. Effective Hamiltonian of Topological Nodal Line Semimetal in Single-Component Molecular Conductor [Pd(dddt)2] from First-Principles. J. Phys. Soc. Jpn. 2018, 87, 113701. [Google Scholar] [CrossRef]
- Kitou, S.; Tsumuraya, T.; Sawahata, H.; Ishii, F.; Hiraki, K.; Nakamura, T.; Katayama, N.; Sawa, H. Ambient-pressure Dirac electron system in the quasi-two-dimensional molecular conductor α-(BETS)2I3. Phys. Rev. B 2021, 103, 035135. [Google Scholar] [CrossRef]
- Dion, M.; Rydberg, H.; Schröder, E.; Langreth, D.C.; Lundqvist, B.I. Van der Waals Density Functional for General Geometries. Phys. Rev. Lett. 2004, 92, 246401. [Google Scholar] [CrossRef] [PubMed]
- Thonhauser, T.; Cooper, V.R.; Li, S.; Puzder, A.; Hyldgaard, P.; Langreth, D.C. Van der Waals density functional: Self-consistent potential and the nature of the van der Waals bond. Phys. Rev. B 2007, 76, 125112. [Google Scholar] [CrossRef]
- Sabatini, R.; Küçükbenli, E.; Kolb, B.; Thonhauser, T.; Gironcoli, S. Structural evolution of amino acid crystals under stress from a non-empirical density functional. J. Phys. Condens. Matter 2021, 24, 424209. [Google Scholar] [CrossRef] [PubMed]
- Hamada, I. van der Waals density functional made accurate. Phys. Rev. B 2014, 89, 121103(R). [Google Scholar] [CrossRef]
- Giannozzi1, P.; Andreussi, O.; Brumme, T.; Bunau, O.; Nardelli, M.B.; Calandra, M.; Car, R.; Cavazzoni, C.; Ceresoli, D.; Cococcioni, M.; et al. Advanced capabilities for materials modelling with Quantum ESPRESSO. J. Phys. Cond. Matter 2017, 29, 465901. [Google Scholar] [CrossRef]
- Garrity, K.F.; Bennett, J.W.; Rabe, K.M.; Vanderbilt, D. Pseudopotentials for high-throughput DFT calculations. Comput. Mater. Sci. 2014, 81, 446–452. [Google Scholar] [CrossRef]
- Miyazaki, T.; Ohno, T. First-principles study of pressure effects on the molecular solids (CH3)4X[M(dmit)2]2 (X = N, P and M = Ni, Pd). Phys. Rev. B 2003, 68, 035116. [Google Scholar] [CrossRef]
- Heyd, J.; Scuseria, G.E.; Ernzerhof, M. Hybrid functionals based on a screened Coulomb potential. J. Chem. Phys. 2003, 118, 8207–8215, Erratum in J. Chem. Phys. 2006, 124, 219906. [Google Scholar] [CrossRef]
- Heyd, J.; Scuseria, G.E. Efficient hybrid density functional calculations in solids: Assessment of the Heyd–Scuseria–Ernzerhof screened Coulomb hybrid functional. J. Chem. Phys. 2004, 121, 1187–1192. [Google Scholar] [CrossRef]
- Kresse, G.; Hafner, J. Ab initio molecular dynamics for liquid metals. Phys. Rev. B 1993, 47, 558–561. [Google Scholar] [CrossRef]
- Kresse, G.; Hafner, J. Ab initio molecular-dynamics simulation of the liquid-metal–amorphous-semiconductor transition in germanium. Phys. Rev. B 1994, 49, 14251–14269. [Google Scholar] [CrossRef]
- Kresse, G.; Furthmüller, J. Efficient iterative schemes for ab initio total-energy calculations using a plane-wave basis set. Phys. Rev. B 1996, 54, 11169–11186. [Google Scholar] [CrossRef]
- Blöchl, P.E. Projector augmented-wave method. Phys. Rev. B 1994, 50, 17953–17979. [Google Scholar] [CrossRef]
- Kresse, G.; Joubert, D. From ultrasoft pseudopotentials to the projector augmented-wave method. Phys. Rev. B 1999, 59, 1758–1775. [Google Scholar] [CrossRef]
- Kawamura, M. FermiSurfer: Fermi-surface viewer providing multiple representation schemes. Comp. Phys. Commun. 2019, 239, 197. [Google Scholar] [CrossRef]
- Cui, H.B.; Kobayashi, H.; Ishibashi, S.; Sasa, M.; Iwase, F.; Kato, R.; Kobayashi, A. A Single-Component Molecular Superconductor. J. Am. Chem. Soc. 2014, 136, 7619–7622. [Google Scholar] [CrossRef]
- Tsumuraya, T.; Seo, H.; Miyazaki, T. First-principles study of the charge ordered phase in κ−D3(Cat-EDT-TTF/ST)2: Stability of π-electron deuterium coupled ordering in hydrogen-bonded molecular conductors. Phys. Rev. B 2020, 101, 045114. [Google Scholar] [CrossRef]
- Tsumuraya, T.; Seo, H.; Miyazaki, T. First-Principles Study on the Stability and Electronic Structure of the Charge-Ordered Phase in α-(BEDT-TTF)2I3. Crystals 2021, 11, 1109. [Google Scholar] [CrossRef]
- Lv, Z.; Xu, H.; Xu, W.; Peng, B.; Zhao, C.; Xie, M.; Lv, X.; Gao, Y.; Hu, K.; Fang, Y.; et al. Quasi-Topological Intercalation Mechanism of Bi0.67NbS2 Enabling 100 C Fast-Charging for Sodium-Ion Batteries. Adv. Energy Mater 2023, 2300790. [Google Scholar] [CrossRef]
- Xiao, W.; Kiran, G.K.; Yoo, K.; Kim, J.-H.; Xu, H. The Dual-Site Adsorption and High Redox Activity Enabled by Hybrid Organic-Inorganic Vanadyl Ethylene Glycolate for High-Rate and Long-Durability Lithium–Sulfur Batteries. Small 2023, 19, 2206750. [Google Scholar] [CrossRef]
- Momma, K.; Izumi, F. VESTA 3 for three-dimensional visualization of crystal, volumetric and morphology data. J. Appl. Crystallogr. 2011, 44, 1272–1276. [Google Scholar] [CrossRef]


| Transfer Integral | H-H | L-L | H-L |
|---|---|---|---|
| tp | 53.4 | −49.8 | 51.7 |
| tc | 67.1 | −62.9 | 64.9 |
| ta | −6.2 | −6.5 | 0.3 |
| tq1 | 8.2 | −7.4 | 7.8 |
| tq2 | 8.2 | −7.7 | 7.9 |
| Transfer Integral | H-H | L-L | H-L |
|---|---|---|---|
| tp | 72.0 | −68.8 | 70.5 |
| tc | 33.9 | −26.7 | 30.1 |
| ta | −32.8 | −33.1 | 0.6 |
| tq1 | 46.9 | −46.9 | 46.9 |
| tq2 | 3.6 | −3.2 | 3.4 |
| tr | 2.8 | −2.6 | 2.7 |
| Transfer Integral | H-H | L-L | H-L |
|---|---|---|---|
| tp | −59.8 | 51.0 | −55.5 |
| tc | 6.6 | 2.5 | 1.7 |
| ta | 7.9 | 9.6 | 0.2 |
| tq1 | 44.8 | −24.5 | 34.2 |
| tq2 | 0.6 | −0.6 | 0.6 |
| ts | −1.7 | 1.5 | −1.6 |
Disclaimer/Publisher’s Note: The statements, opinions and data contained in all publications are solely those of the individual author(s) and contributor(s) and not of MDPI and/or the editor(s). MDPI and/or the editor(s) disclaim responsibility for any injury to people or property resulting from any ideas, methods, instructions or products referred to in the content. |
© 2023 by the authors. Licensee MDPI, Basel, Switzerland. This article is an open access article distributed under the terms and conditions of the Creative Commons Attribution (CC BY) license (https://creativecommons.org/licenses/by/4.0/).
Share and Cite
Kato, R.; Tsumuraya, T. Dirac Cone Formation in Single-Component Molecular Conductors Based on Metal Dithiolene Complexes. Magnetochemistry 2023, 9, 174. https://doi.org/10.3390/magnetochemistry9070174
Kato R, Tsumuraya T. Dirac Cone Formation in Single-Component Molecular Conductors Based on Metal Dithiolene Complexes. Magnetochemistry. 2023; 9(7):174. https://doi.org/10.3390/magnetochemistry9070174
Chicago/Turabian StyleKato, Reizo, and Takao Tsumuraya. 2023. "Dirac Cone Formation in Single-Component Molecular Conductors Based on Metal Dithiolene Complexes" Magnetochemistry 9, no. 7: 174. https://doi.org/10.3390/magnetochemistry9070174
APA StyleKato, R., & Tsumuraya, T. (2023). Dirac Cone Formation in Single-Component Molecular Conductors Based on Metal Dithiolene Complexes. Magnetochemistry, 9(7), 174. https://doi.org/10.3390/magnetochemistry9070174