Article

Steady-State and Dynamic Rheological Properties of a Mineral Oil-Based Ferrofluid

1
School of Applied Technology, China University of Labor Relations, Beijing 100048, China
2
School of Mechatronics and Vehicle Engineering, Beijing University of Civil Engineering and Architecture, Beijing 100044, China
3
School of Mechanical, Electronic and Control Engineering, Beijing Jiaotong University, Beijing 100044, China
*
Author to whom correspondence should be addressed.
Magnetochemistry 2022, 8(9), 100; https://doi.org/10.3390/magnetochemistry8090100
Submission received: 1 August 2022 / Revised: 2 September 2022 / Accepted: 10 September 2022 / Published: 13 September 2022
(This article belongs to the Special Issue Advanced Applications of Magnetic Field-Responsive Fluid)

Abstract

:
In this study, nanoparticles were suspended in L-AN32 total loss system oil. The thixotropic yield behavior and viscoelastic behavior of ferrofluid were analyzed by steady-state and dynamic methods and explained according to the microscopic mechanism of magneto-rheology. The Herschel–Bulkley (H–B) model was used to fit the ferrofluid flow curves, and the observed static yield stress was greater than the dynamic yield stress. Both the static and dynamic yield stress values increased as the magnetic field increased, and the corresponding shear thinning viscosity curve increased more significantly as the magnetic field strength increased. The amplitude scanning results show that the linear viscoelastic region (LVE) is reached when the shear stress is 10%. The frequency scanning results showed that the storage modulus increased with the increase of the frequency at first. The storage modulus increased steadily at a higher frequency range, while the loss modulus increased slowly at the initial stage and rapidly at the later stage. In the amplitude sweep and frequency sweep experiments, the energy storage modulus and loss modulus are enhanced with the decrease of temperature. These findings are helpful to better understand the microscopic mechanism of magneto-rheology of ferrofluids, and also provide guidance for many practical applications.

1. Introduction

Ferrofluid (FF) is a kind of smart nano-functional material under the magnetic field, which is a suspension system composed of soft magnetic particles, non-magnetic base carrier liquids, and surfactant. The diameter of magnetic particles is generally about 10 nm, and each particle has its own magnetic moment, the value of which is proportional to the volume of the magnetic particle and depends on the saturation magnetization strength of the material. In addition, particles not only participate in Brownian motion, but also tend to congregate into different aggregates. Under an applied magnetic field of moderate intensity, the rheological, hydrodynamic, diffusive, and optical properties of FF all varied dramatically [1,2]. FF have high academic value and a wide range of application prospects—it can be applied to heat exchangers [3], ultra-low friction bearing [4,5], temperature sensor [6], and seal [7]. Therefore, the study of their related properties is a challenging topic.
Under the action of magnetic field, the morphology of FF changes greatly from liquid state to quasi-solid and this change is reversible. This process is called the magnetorheological effect, which can be explained as: when in a state without a magnetic field, all the magnetic tiny particles are capsuled by a surfactant composed of longer molecular chains. The van der Waals force between the long molecular chains of the active agent will hinder the combined aggregation of magnetic particles, so that the magnetic particles are evenly distributed in the base liquid and the apparent rheological behavior is Newton fluid. When a magnetic field is applied, the magnetic particles in the FF are magnetized into magnetic dipoles attracted to each other under the action of the external magnetic field, which will converge along the direction of the magnetic field. The columnar structure is gradually synthesized by shear yield stress and the apparent rheological behavior is Bingham fluid [8,9].
Due to the above characteristics, FFs have a wide range of applications in the automotive industry and other professional projects, such as shock absorbers, clutches, brakes, and dampers [6,10,11,12]. In recent years, researchers have also discovered the potential applications of FFs in the biomedical field, such as magnetically targeted drug therapy and magnetic hyperthermia of cancer cells; In addition, FFs are applied to realize the flexible movement of the soft robots by controlling the magnetic structure changes in the changing magnetic field, so that it makes deep-sea and deep-space exploration possible.
Li et al. [13] studied the rheological properties of a perfluoropolyether-based ferrofluid. Based on the chain model of magnetic particles and the viscosity-temperature characteristics of the base carrier liquid, the different mechanisms of the influence of temperature on the magnetic viscosity effect are discussed. They only discussed the magneto-viscous effect of ferrofluid, but not the viscoelasticity, and the rheological properties were not fully explained.
Paul et al. [14] concluded that non-Newtonian behavior manifested itself as more pronounced as the magnetic field increased. They also performed steady-state rheological measurements and fitted the experimental data with the Herschel–Bulkley (H–B) model to calculate the yield stress. There is good consistency between the experimental data and the fitted data. Moreover, they concluded that the yield stress of the FF improved significantly as the particle loading and magnetic field increased. However, they only analyzed the static yield stress, not the dynamic yield stress, and ignored the possible influence of shear history on the yield stress.
In this paper, a ferrofluid with a volume fraction of 7.26% using L-AN32 as the carrier fluid is presented and its rheological properties are systematically studied. The yield stress and viscoelasticity of ferrofluid were studied by static and dynamic methods. The magnetic field intensity dependence of ferrofluid yield stress and viscosity and the temperature dependence of ferrofluid viscoelasticity are analyzed. A comparative experiment was designed to compare the flow curve and viscosity curve of L-AN32-based ferrofluid in the magnetic field range (0 mT–200 mT). Using the H–B model to fit the flow curve, the yield stress was calculated, and the static yield stress was greater than the dynamic yield stress. In addition, the amplitude scanning and frequency scanning experimental data of L-AN32-based ferrofluid in the temperature range (−2 °C–35 °C) were compared to obtain the mechanism of temperature on ferrofluid viscoelasticity.

2. Experiment

2.1. Materials

The preparation of the FF in this paper mainly consisted of two parts. Firstly, the magnetic nano Fe3O4 particles were prepared by coprecipitation method, and then the Fe3O4 particles were uniformly dispersed in the base carrier.
Due to the ease of preparation and biocompatibility of Fe3O4 particles, Fe3O4 was selected as a magnetic particle in this paper. The ratio of the reactants, the reaction temperature, and the PH in the reaction process were strictly controlled by the co-precipitation method [15], so that Fe3O4 magnetic particles with good crystallization, suitable particle diameter, and satisfactory saturation magnetization intensity can be obtained. Finally, the magnetic particles obtained after drying were X-ray Diffraction (XRD) analyzed. According to Debye–Scherrer expression [16], the particle diameter of Fe3O4 was 9.8 nm.
D = K   λ B   cos θ
where D is the average thickness of the grain perpendicular to the crystal plane direction; B denotes the measured sample diffraction peak half-height width; θ is the Bragg diffraction angle; λ is the X-ray wavelength.
The Fe3O4 particle size distribution was further analyzed by transmission electron microscopy (TEM). As shown in Figure 1, the diameter of Fe3O4 particles was approximately normal. The average diameter of Fe3O4 particles was 10.25 nm, and the standard deviation was 2.11 nm, among which the larger diameter of magnetic particles above 13 nm accounted for only 10%.
The L-AN32 total loss system oil produced by China Petroleum and Chemical Corporation was selected as the base carrier fluid for the experiment in this article. As shown in Table 1, the total loss system oil belonged to the hydrogenation mineral base oil, and its main component was hydrocarbons. According to GB443-1989 dynamic viscosity standard, it can be divided into 10 L-AN series full system loss oil [17].

2.2. Preparation Process

FF preparation process: the previously obtained Fe3O4 particles were added to the base carrier liquid containing oleic acid and some dispersion additives were added. The FF was heated and stirred in the water bath, followed by ultrasonic waves to make the gathered Fe3O4 particles evenly dispersed. When the liquid was layered under the action of a strong magnetic field, we chose the upper stable black liquid. The density, zero magnetic field viscosity, saturation magnetization intensity, particle volume fraction, and other parameters of the L-AN32-based FF prepared in this paper were measured and the statistics are shown in Table 2.
The MCR 302 high-precision rotary rheometer produced by Anton Paar (Graz, Austria) with the MRD170 magnetic (Anton Paar, Graz, Austria) field module was used in this paper to measure complex rheological characteristics. The rheometer has a minimum controllable torque of 1 nN∙m and a minimum point time of 1 ms. It can accurately measure the rheological properties of samples in the temperature range of −20 °C to 170 °C, ensuring the accurate measurement of complex rheological properties such as viscoelasticity and thixotropy of FFs in the magnetic field.
Rheological measurements are divided into two types: steady state shear and oscillatory shear. Steady-state shear test includes testing the variation of static (dynamic) shear stress and viscosity with shear rate under different magnetic induction. The temperature is constant at 21 °C, the shear rate range is 0–100 s−1, and the magnetic induction intensities are 0, 24, 48, 74, 100, 124, 150, 174, 200 mT, respectively. Steady-state shear uses a cone plate with a diameter of 20 mm and a cone of 1°. The rheological measurement gap is 0.2 mm.
The oscillatory shear test includes: testing the change of energy storage modulus and loss modulus with shear strain amplitude at different temperatures (−2, 2, 7, 12, 16, 21, 26, 30, 35 °C), the angular frequency is constant at 6 rad/s, and the shear strain amplitude ranges from 0.01% to 100%. Testing the law of energy storage modulus and loss modulus changing with strain frequency, the shear strain amplitude is 1 %, and the angular frequency range is 0–16 rad/s. A 20 mm parallel plate was used for oscillatory shear with a measured gap of 0.2 mm.
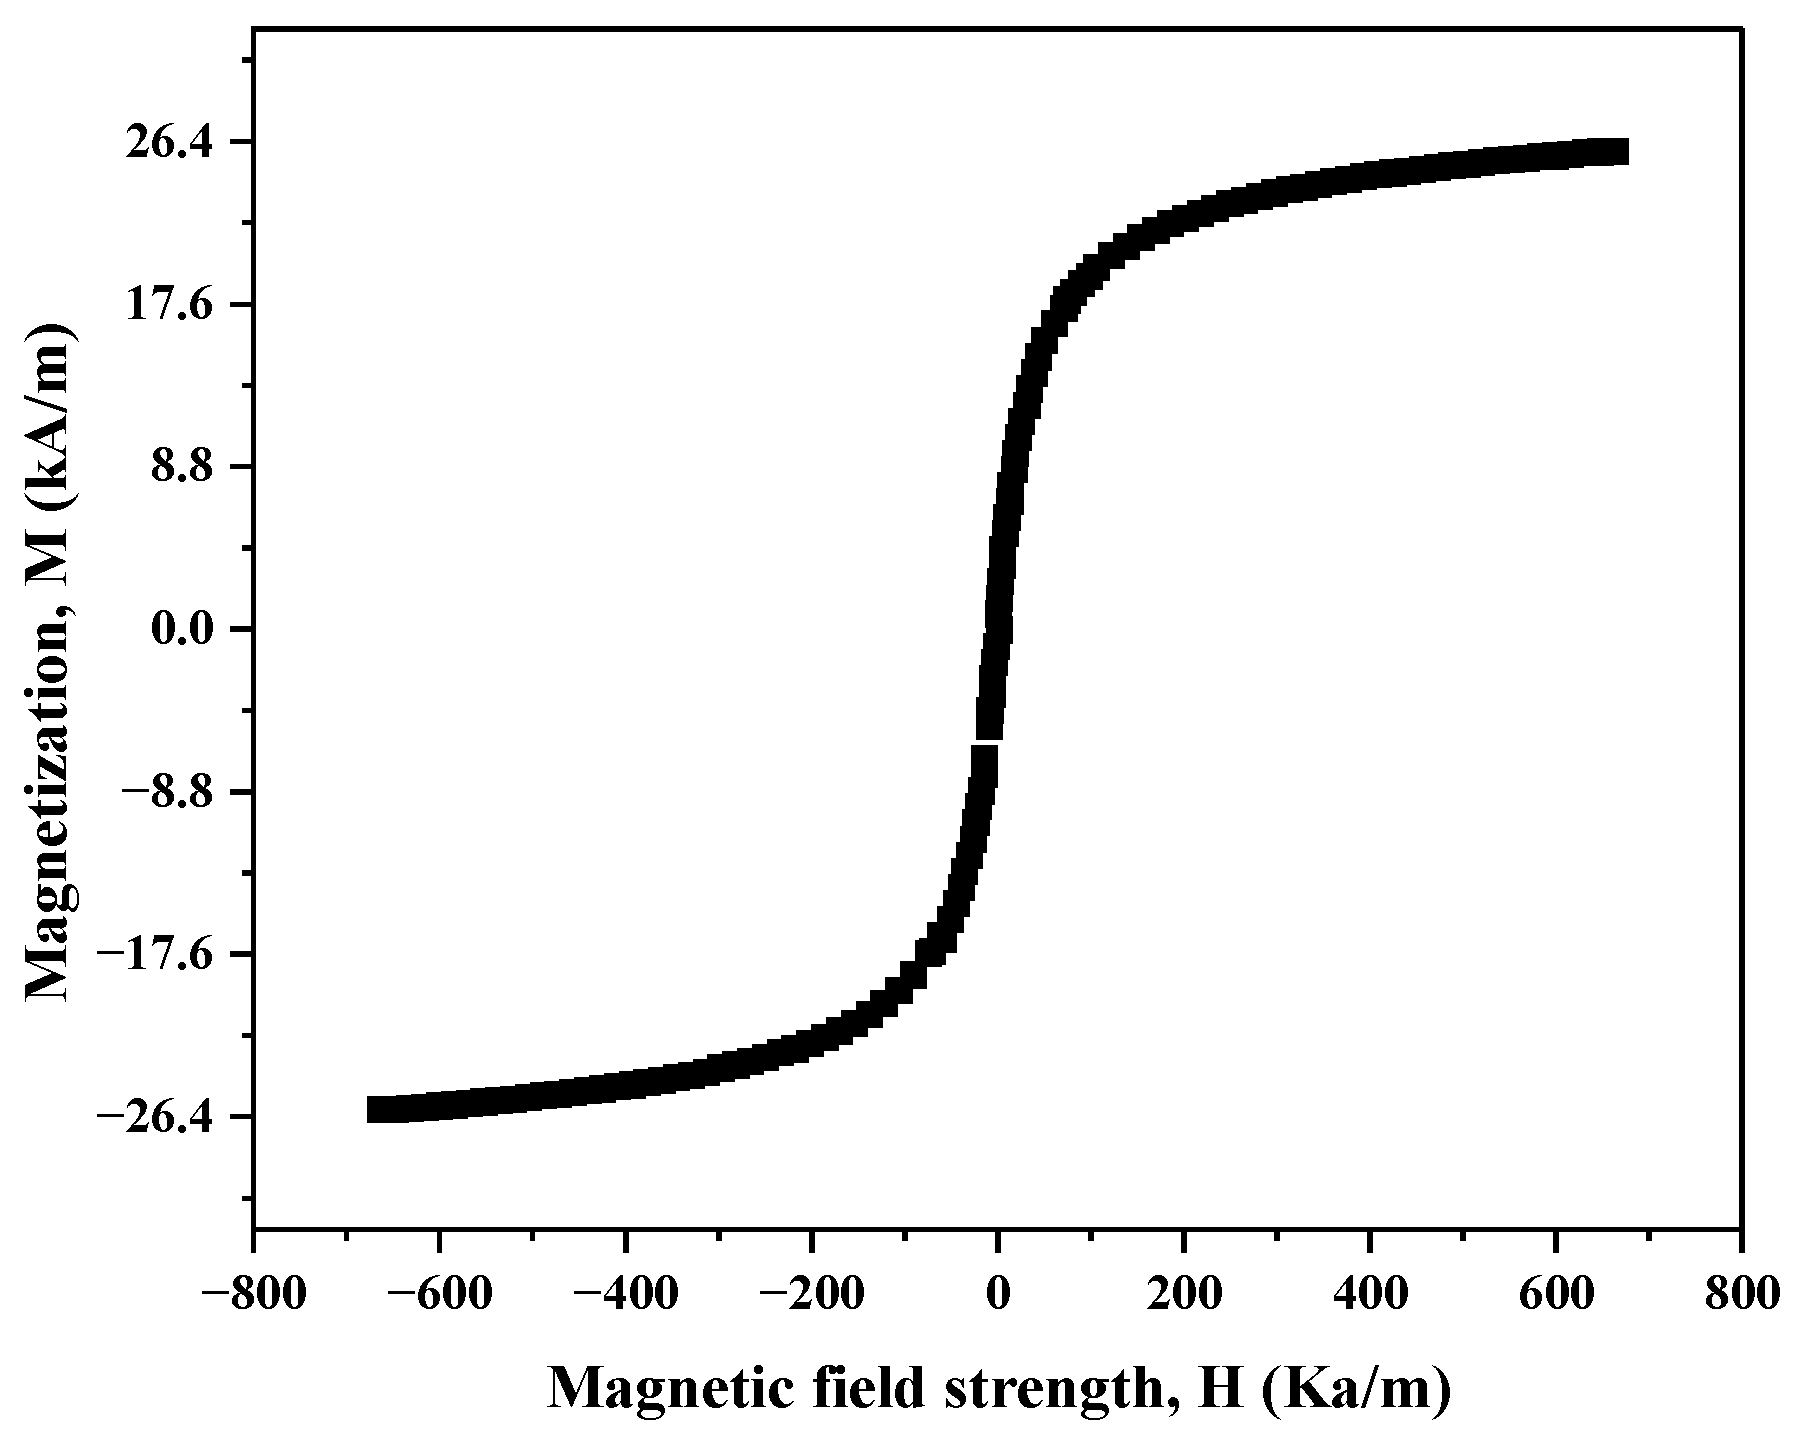
Magnetization curves of samples were drawn by means of A vibrating sample Magnetometer (VSM), as shown in Figure 2. It can be seen that there is no obvious coercivity and remanence in the hysteresis loop, which indicates that the Fe3O4 magnetic particles are mainly small particles with single magnetic domain, and the content of large particles with multi-magnetic domain is very small.

3. Results and Discussion

3.1. Static and Dynamic Yield Stresses Analysis

The yield process of FF is a process of thixotropy, which exhibits the restorative properties of thixotropy when it is rotating or oscillating. When in the same external environment, the static yield stress is much higher than the dynamic yield stress, and the yield stress value increases with the strength of the magnetic field [18]. Static yield stress refers to the minimum shear stress required when the internal structural stable state of the FF is destroyed and the steady-state flow occurs. The dynamic yield stress represents the minimum shear stress of the continuous and stable flow of the FF after the internal structure has been destroyed. If the static yield stress is the same as the dynamic yield stress, the fluid is a simple yield fluid. Conversely, fluids with different values are thixotropic yield fluids, where the static yield stress is much greater than the dynamic yield stress, because its internal microstructure constitutes have different microscopic evolution paths in different experimental environments.
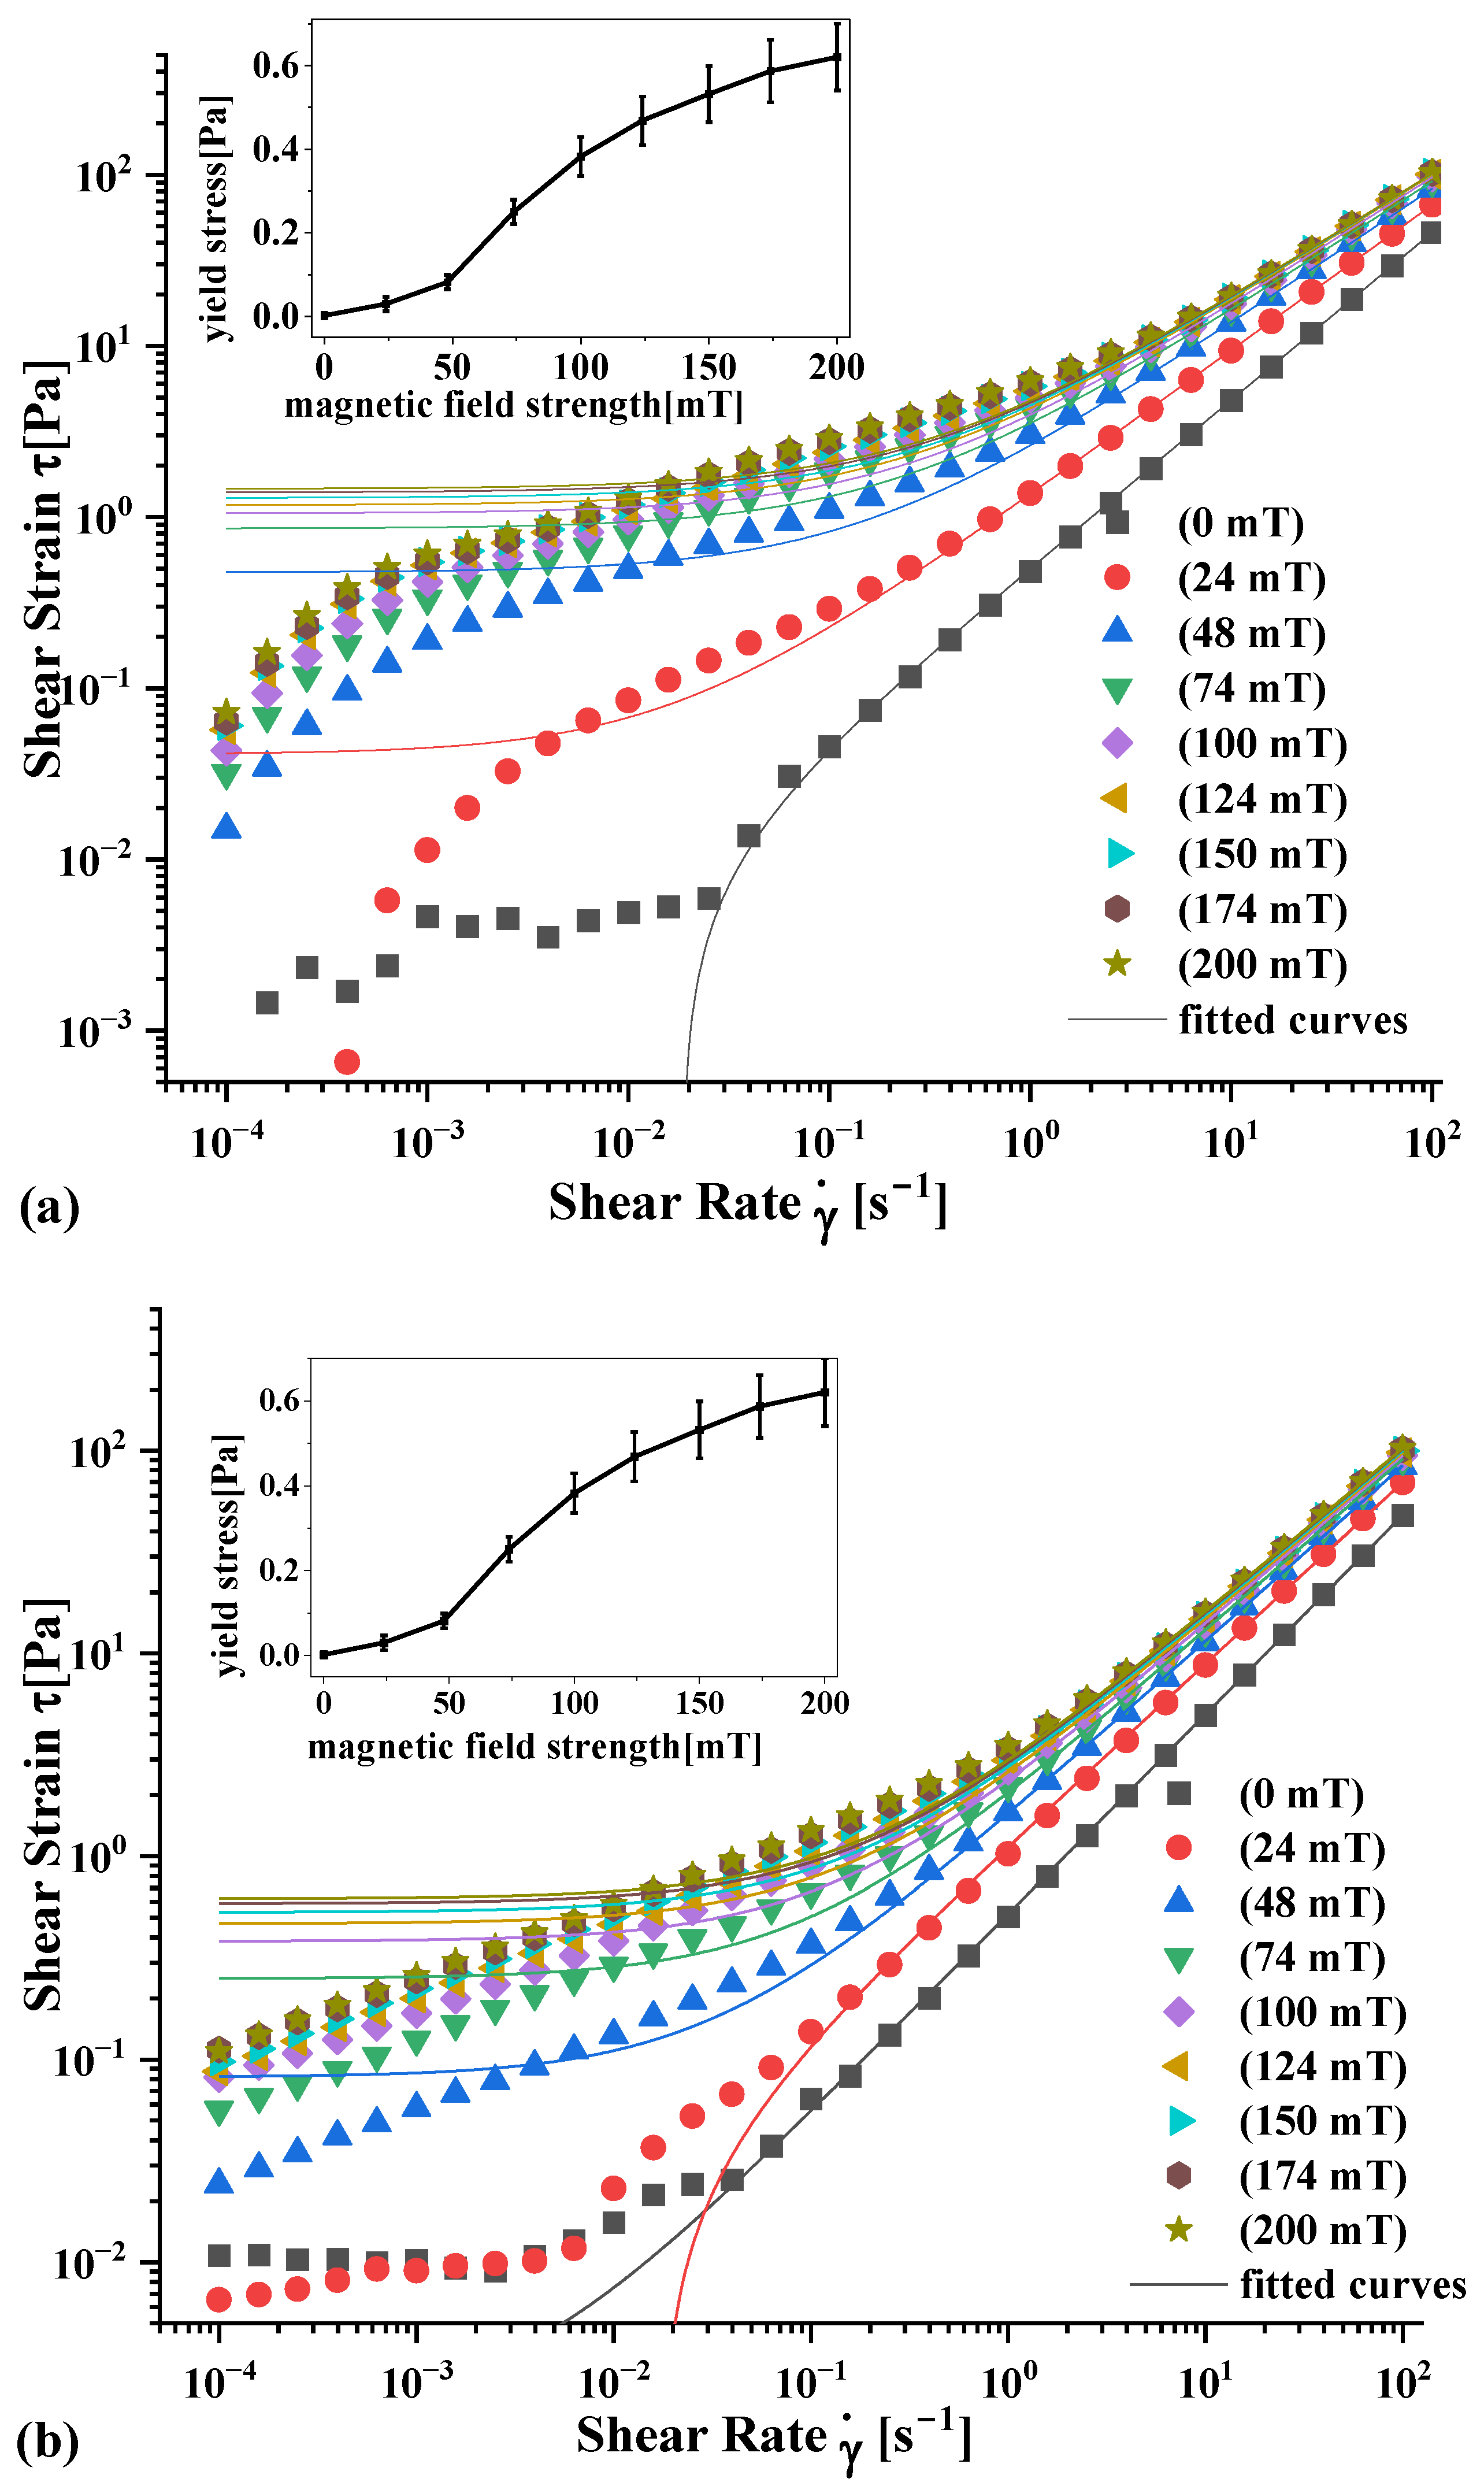
At the temperature of 21 °C, the static (shear rate from low to high) and dynamic (shear rate from high to low) flow curves of the FF are measured. Different curves in each plot correspond to different magnetic field strengths as shown in Figure 3. Prior to experimental measurements, samples are left to stand for 600 s under a magnetic field or pre-sheared for 90 s at a shear rate of 100 s−1.
It can be seen from the experimental results that different magnetic field strength corresponds to different flow curves, and shear stress increases with the increase of magnetic field strength. The flow curve changes significantly between 0 mT and 48 mT, and the curve greater than 48 mT tends to be stable. It indicates that the magnetic interaction between particles of FFs increases greatly under the magnetic field strength of 0–48 mT, which is manifested as the overall upward shift of the flow curve. When the flow curve is larger than 48 mT, the magnetic interaction between the internal structures of the FF reaches a saturation state, and the distance between the curves is shortened or even overlaps with each other. The magnitude of the static flow curve change is more complex than that of the dynamic flow curve, which means that the FF is a thixotropic yield fluid and the evolution paths of the internal microstructure of the thixotropic yield fluid under different measurement environments are also different.
As can be seen from Figure 3a, the slope of the static flow curve is constantly changing, and there is a clear characteristic of secondary shear thinning. This is due to the different static and dynamic failure mechanisms, resulting in different shear stresses even under the same shear rate and other external conditions. At the small shear rates, FFs have a strong columnar structure inside that can keep their internal structure stable, while the tiny shear stresses exist due to the presence of micro-flow of base carrier fluid between the columnar structures. When the shear rate gradually increases, a small number of columnar and chain structures appear to detach from the liquid surface and participate in the flow. At this time the liquid flow rate is accelerated, and the slope of the curve rises, that is, the first shear thinning occurs. After that, as the shear rate continues to increase, more and more columnar structures participate in the flow inside the FF and its bias stress tensor component increases so that the macroscopic viscosity of the liquid increases, and the slope of the curve is slowed. Finally, when the columnar structure inside the FF undergoes macroscopic flow, the columnar structure eventually becomes a single-chain structure, and the corresponding partial stress tensor component is also reduced, and the second shear thinning occurs. Since the length of the columnar and chain structures is proportional to the increase in shear rate, this shear thinning will continue.
In Figure 3b, the dynamic flow curve basically keeps rising on the shear slope, which is due to the fact that the FF equilibrium structure has been destroyed before the start of the experiment. Its internal microstructure is not conducive to being combined with the liquid surface in the case of shear flow, and a stable columnar and chain structure appears. With the reduction of the shear rate, the internal microstructure is only manifested as an increase in size and quantity. At this time the viscosity becomes larger, and the flow curve shows the classic simple shear thinning characteristics. It can be seen that for the thixotropic yield fluid, the shear history has a greater effect on the flow curve, so yield stress cannot be regarded as a constant value. A comparative analysis of Figure 3a,b shows that the rheological properties of the FF are significantly affected by the shear history, which further indicates that the FF is thixotropic.
In this paper, the data of the experimental curve are fitted by the H–B model. Its equation is as follows
  τ = τ 0 + k γ ˙ n
where, τ is the shear stress, γ ˙ is the shear rate, τ0 is the yield stress, k and n are adjustable model parameters.
The relationship between magnetic field strength and yield stress is shown in the embedded figure in Figure 3. When the shear rate is small, the experimental data do not agree with the H–B model. However, when a certain shear rate is reached, the fitting condition is good, and the yield phenomenon occurs. Table 3 shows the yield stresses and the H–B model fitting parameters for FF at various magnetic flux densities. In the case of the same external factors, static yield stress is much higher than dynamic yield stress, and different evolution paths result in the change of yield stress value. Because the viscosity of the sample varies with the shear rate, the yield stress value increases. The internal microstructure of FFs undergoes aging and shear rebirth. In order to further study the microstructure evolution mechanism during the thixotropic yield of FFs, the corresponding viscosity values of FFs are analyzed below.

3.2. Viscosity Analysis

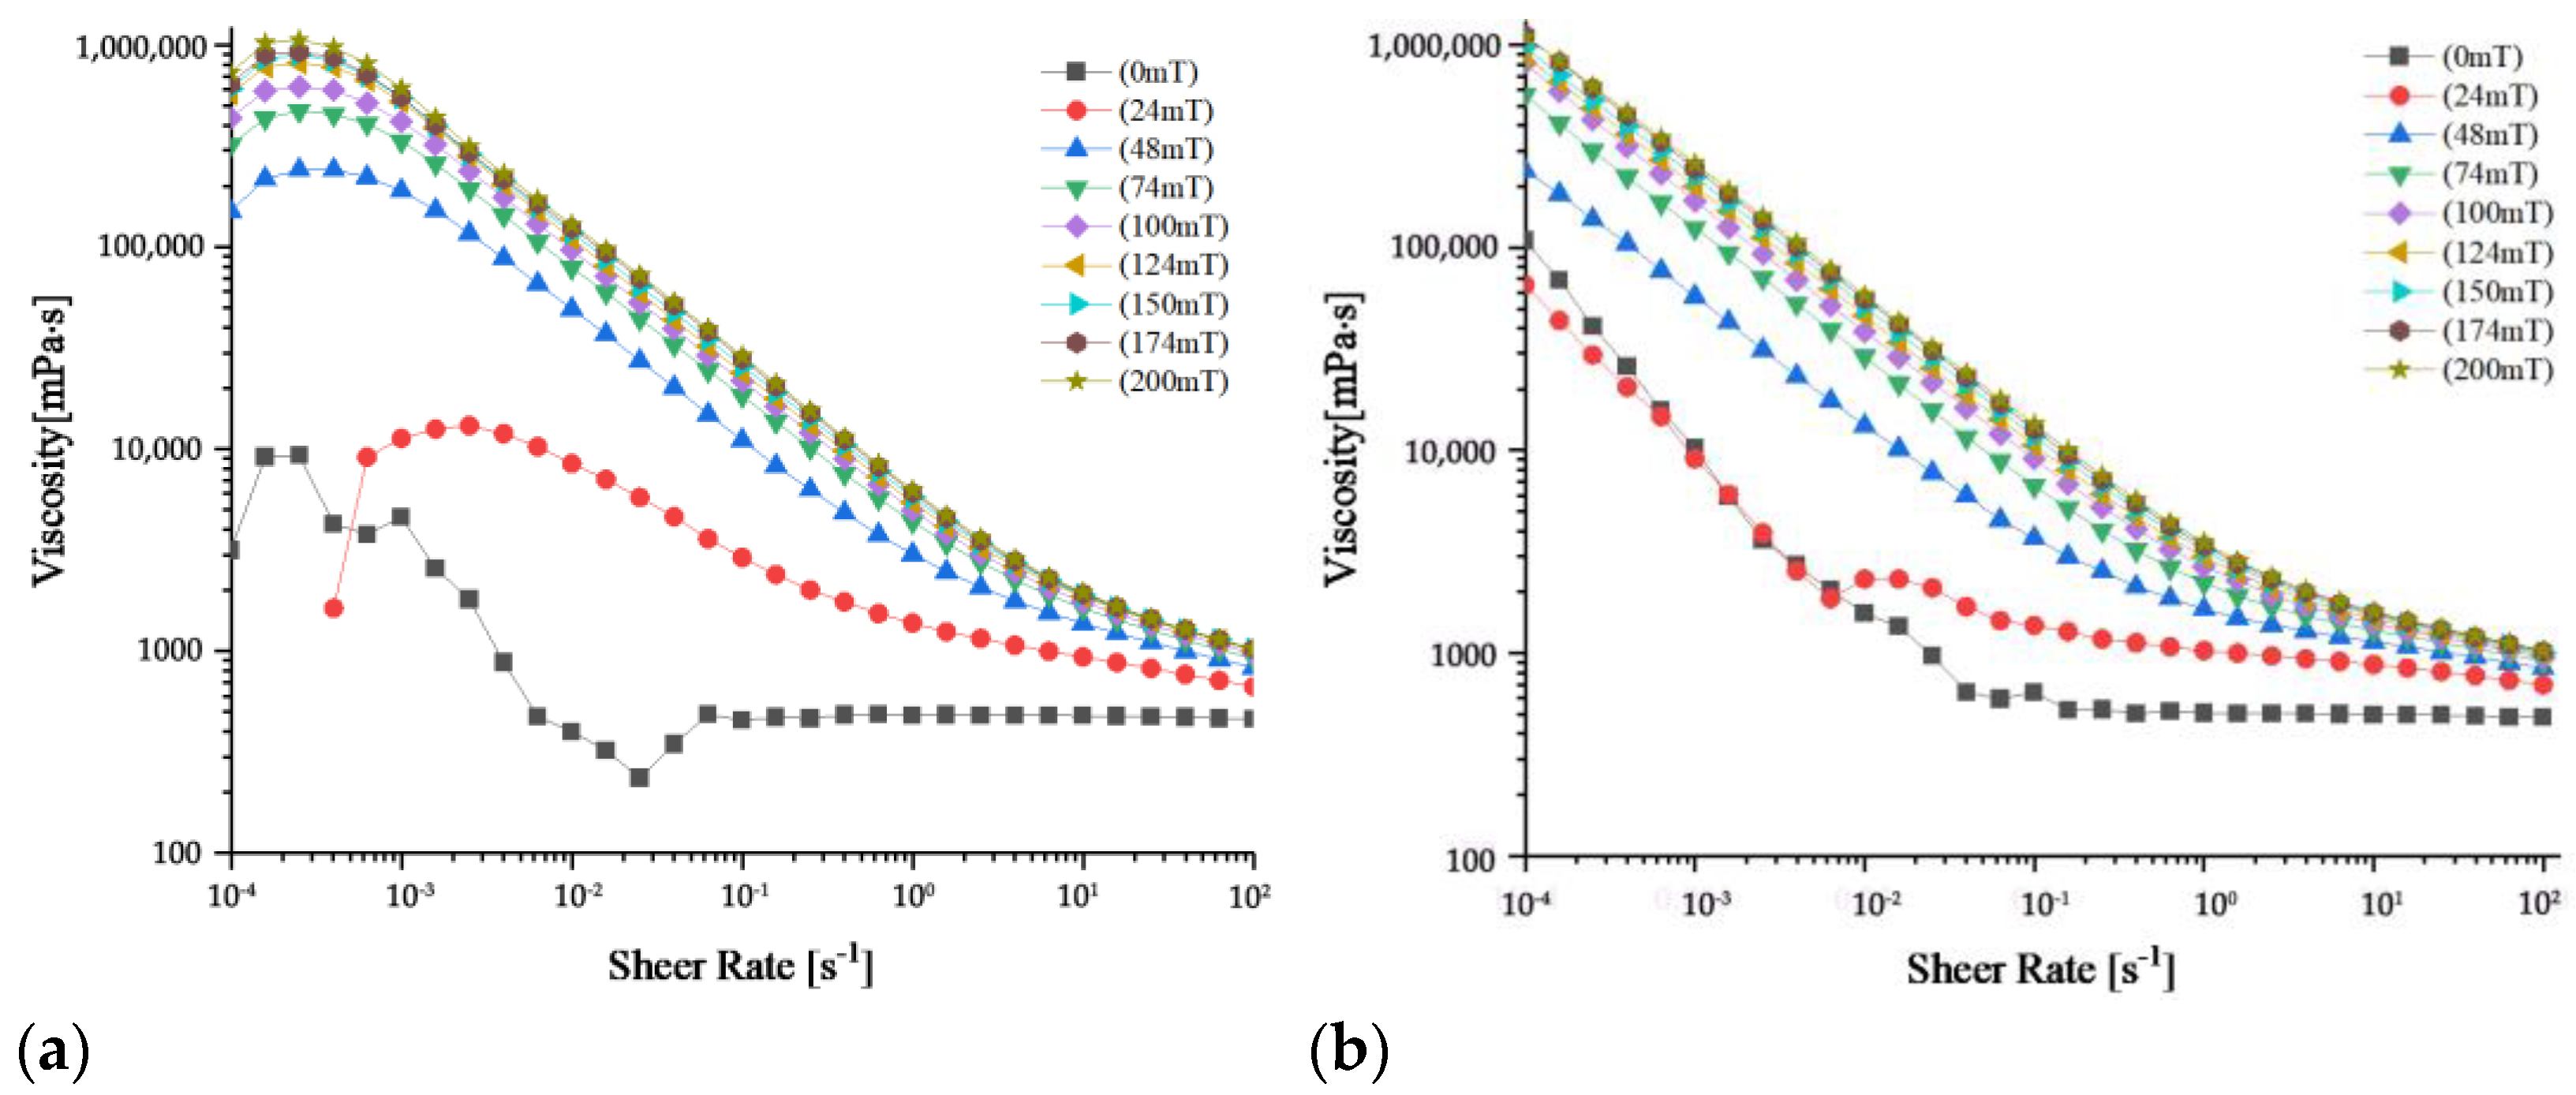
In order to further analyze the flow characteristics of FFs under static and dynamic measurement methods, this experiment measures the curves of the viscosity of FFs with shear rate under different magnetic field intensities. Figure 4 shows the viscosity curve of the FFs as a function of shear under different constant magnetic field intensities at a temperature of 20 °C. The FF samples in Figure 4a,b are pretreated similar to static and dynamic tests prior to testing: the samples in Figure 4a are first placed statically for 600 s under a magnetic field, while the samples in Figure 4b are pre-sheared at a shear rate of 100 s−1 for 90 s before testing. As the shear rate increases, the microstructure composition and macroscopic rheological properties of the FFs change dramatically with the shear rate.
From the experimental results, it can be seen that the viscosity curve is basically in line with the previous judgment of the thixotropy of the FF flow curve. When the magnetic field strength is less than 48 mT, the viscosity difference of each curve is obvious, while when the magnetic field strength is greater than 48 mT, the difference between the curves is small. The static viscosity curve is more complex than the dynamic viscosity curve. Because of thixotropy, the microscopic evolution path of the FFs is different. At low shear rates, the viscosity remains high due to the disordered arrangement and aggregation of magnetic particles, creating significant flow resistance under magnetic field [19].
As can be seen in Figure 4a, the viscosity curve of the FFs measured by the static method is displayed as a single-peak shape. The reason is that the FFs in an equilibrium state eventually form a columnar structure connecting the upper and lower measurement surfaces, and when a certain shear rate is generated, the columnar structure produces a consistent orientation change in a short period of time, which is manifested as a rise in viscosity. However, as the shear rate increases, this ascent process does not last long, at which point the viscosity begins to decrease, resulting in the formation of peaks in the viscosity curve. When the shear stress is less than static yield stress, there is not macroscopic fluid flow of the FFs. When the shear stress exceeds the static yield stress, the FFs begin to flow and the viscosity suddenly decreases [20]. When the shear rate is small, some of the columnar structures separated from the measurement surface are gradually and completely separated under stress and participate in macroscopic flow, but the interaction between the columnar structures involved in the flow and the remaining structures, at this time, increases the obstacle to macroscopic flow and the viscosity becomes larger. When all the columnar structures participate in the flow, they gradually decompose due to hydrodynamics and the viscosity begins to decrease. When the shear destruction effect of the fluid on the structure is balanced with the interaction between the magnetic field on the particles or structure, the internal structure of the FFs remains stable, so that the viscosity curve eventually tends to be horizontal.
In Figure 4b, the viscosity curves of the FFs under different magnetic field strengths show a continuous decline, representing the gradual refinement and continuous shear thinning of the internal structure of the FFs. In the initial stage of the experiment, the viscosity of the FFs decreases sharply, which is due to the pre-shearing. In this stage, there is no large microstructure to hinder the shear flow and the viscosity decreases with the increase of the shear rate. In the second half of the experiment, under the action of high flow rate, the microstructure within the FFs is basically decomposed and destroyed and the decline rate of viscosity of the FFs slows down. As the internal structure of the FFs is finally split into individual particles, it is finally stabilized at a certain shear rate, where the higher the magnetic field strength, the greater the shear rate that needs to be stabilized. By comparing the two figures, it can be found that, first of all, in different pretreatment cases, the viscosity change curve is not the same, which is determined by its different microscopic evolution paths and affected significantly by the shear history, reflecting the thixotropy of the magnetic material. Secondly, at the same shear rate, the greater the magnetic field strength, the higher the viscosity of the FFs. The shear thinning characteristics are caused by the interaction between particles and the viscous shear effect of the base carrier liquid. The higher the magnetic field, the more complex the microstructure formed, the stronger the resistance to the shear flow and the higher the viscosity at this time. Each viscosity curve in the picture ends up in the same horizontal line, which is due to the fact that FFs reach a consistent microscopic form when the magnetic field is strong enough and the shear rate is large enough. In summary, the non-Newtonian properties of FFs become significant as the strength of the magnetic field increases.

3.3. Viscoelastic Behavior of FFs

The dynamic viscoelasticity of FFs at different temperatures is studied by oscillating shear theory and experimental methods. The frequency scanning experiments of FFs at different temperatures prove that the energy storage modulus (G′) and loss modulus (G”) of FFs are related to ambient temperature. The complete frequency sweep modulus curve of liquids at different ambient temperatures is measured by the principle of strain rate frequency superposition, and the relaxation mechanism of the internal microstructure of FFs can be inferred from the scan curve. When the temperature increases, the average molecular kinetic energy of particles in the FFs increases and the system heat fluctuation effect and the Brownian motion of the particles will intensify. The microstructure com-position and macroscopic rheological properties of the FFs change significantly with the change in temperature.

3.3.1. Amplitude Scanning Analysis

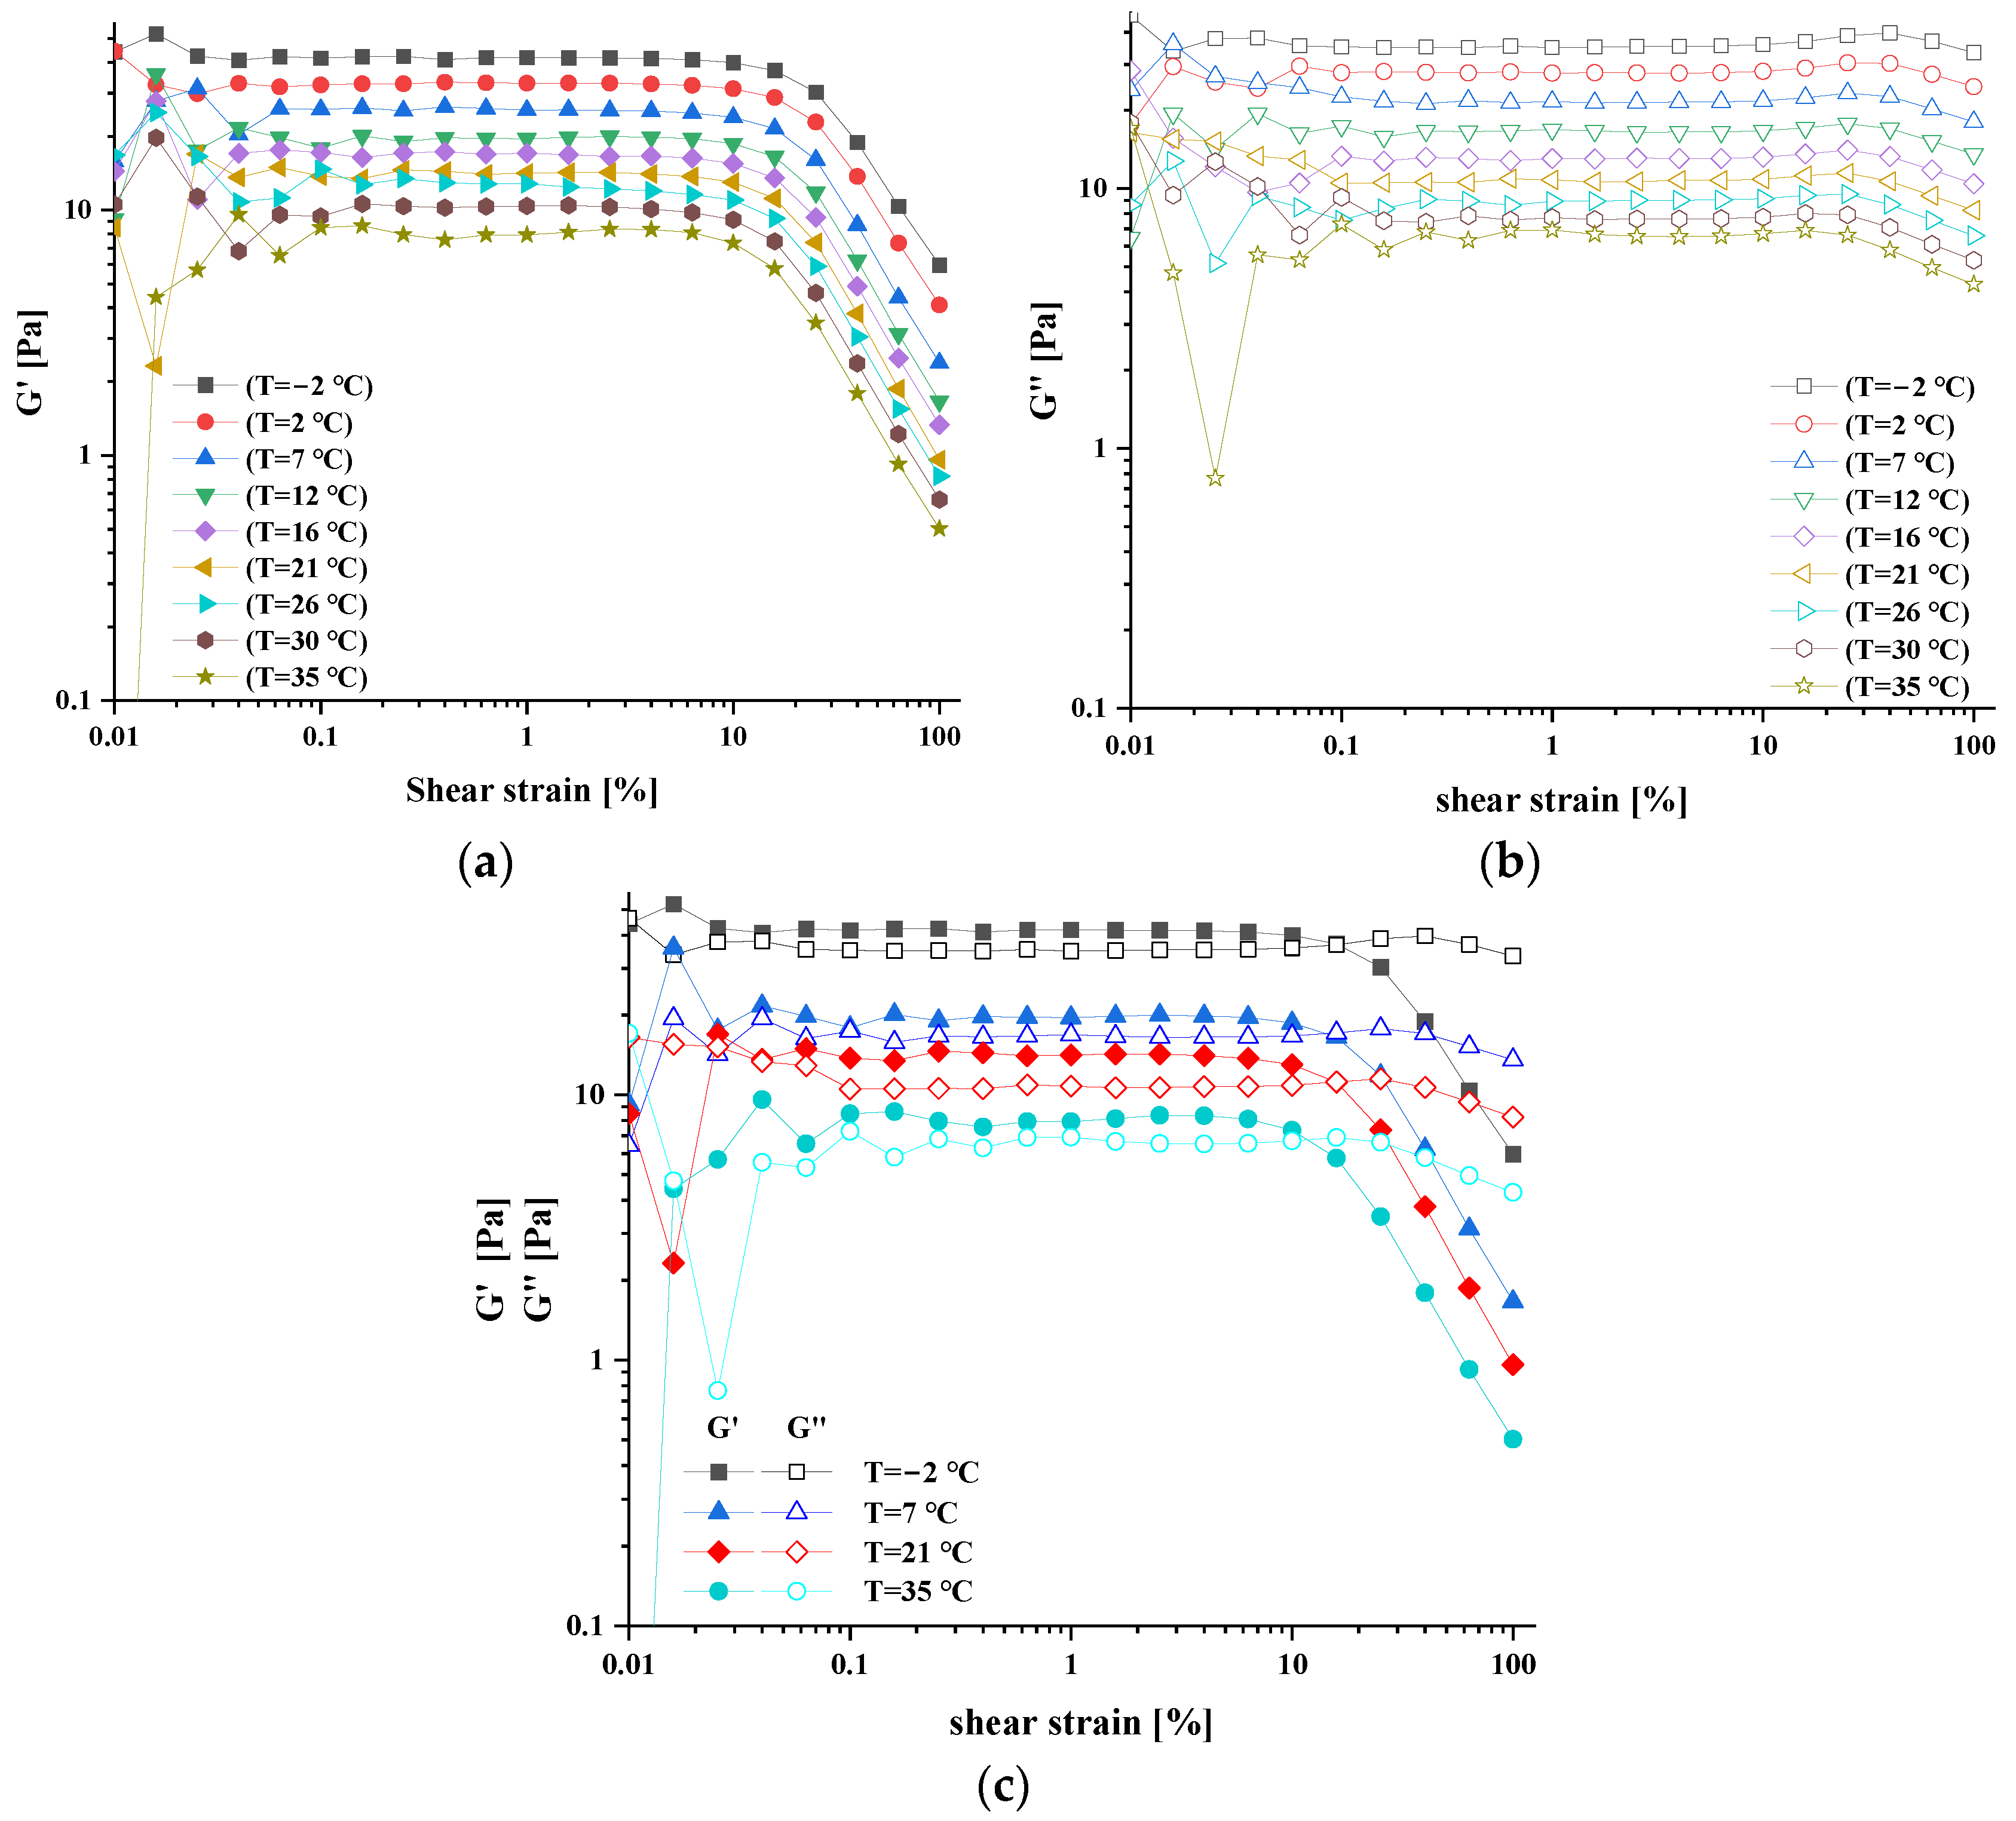
The storage modulus(G′) and loss modulus(G”) of the FFs measured at different temperatures as a function of strain amplitude are shown in Figure 5. The sample is pre-sheared at a shear rate of 500 s−1 for 5 min to eliminate the effect of strain history. To form an equilibrium structure, the FFs need to be placed in magnetic field for 10 min. In the strain–amplitude scan test, the magnetic field intensity is 100 mT and the oscillation frequency is 6 rad/s, where the strain increases from 0.01% to 100%.
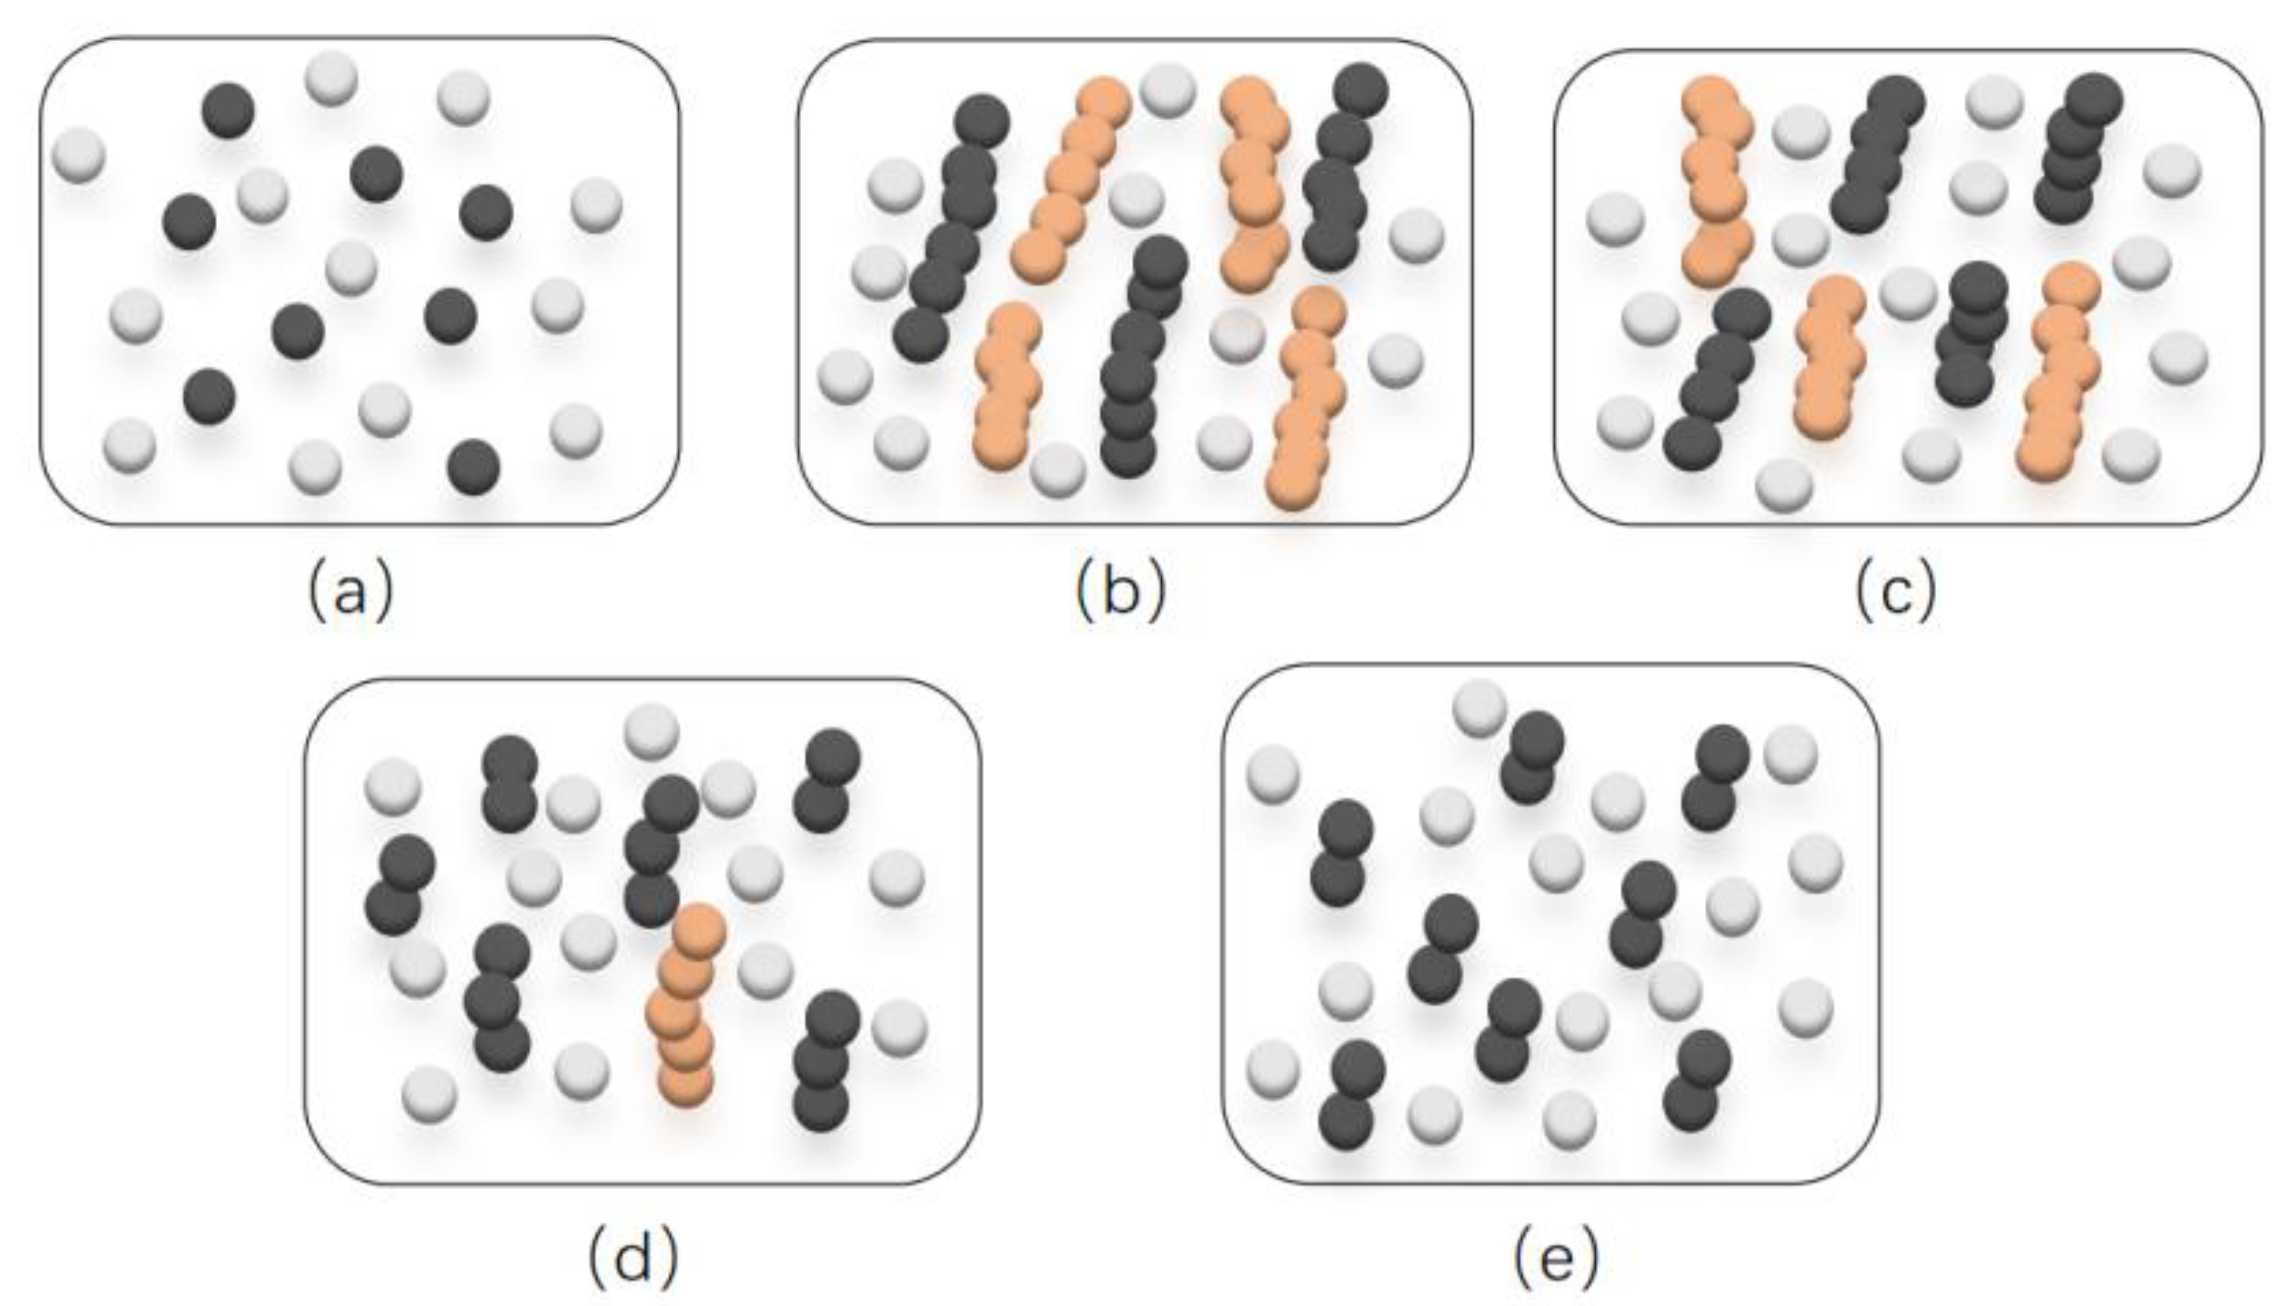
When the shear strain is less than 10%, the viscoelastic modulus is independent of strain, and this region is called the LVE region. The effect of the increase of the applied shear strain on the G′ and G″ can be analyzed through its microscopic schematic diagram, as shown in Figure 6 [21]. The black is the magnetic particles, the white is the non-magnetic carrier fluid molecule, and the yellow is the energy storage modulus. In static equilibrium, FFs behave as a Newtonian fluid, freely composed of all magnetic particles and carrier fluid molecules, as shown in Figure 6a. Under the action of magnetic fields, FFs contain long chains, short chains of carriers, and free molecules, as shown in Figure 6b. When the strain is very small, G′ > G″, and elastic behavior dominates sticky behavior. When the strain increases, G′ decreases [22] because the distance between the particles increases with the increase of the shear strain, weakening the chain structure of the FFs. In Figure 6c. the long chain eventually cracks into short chains, G′ = G″, the FFs change from a low strain viscoelastic solid to a high strain viscoelastic liquid. The stress at this intersection is called the yield stress in amplitude sweep mode. In Figure 6d., as the strain becomes larger, the long chain is significantly destroyed, and the short chain and free particles increase, G′ is further reduced. In Figure 6e., under very high strain, the long chain is completely destroyed, the magnetic particles are finely dispersed to obtain the viscous material, indicating the advantage of the viscous modulus, and the internal chain structure of the FFs is usually destroyed in the nonlinear region.
The value of the energy storage modulus and loss modulus of the FFs decreases with the increase of temperature, which is due to the increase in the free energy of the internal chain structure of the FFs with the increase of the temperature, the internal column structure of the FFs is more easily separated from the surface of the fixture, and the number and the size of the column structure in the FFs decrease with the increase of temperature. Multiple modulus curves measured by FFs at different temperatures are approximately equally proportionally distributed.
From the curve shape of Figure 5a,b, the energy storage modulus and loss modulus decrease with the increase of amplitude, indicating the dependence of the storage modulus on the strain amplitude caused by the destruction and reorganization of the magnetic particle network. FF modulus curve in low amplitude remained relatively stable within the scope of the very typical LVE region. Because the FFs have a columnar structure that connects the upper and lower measurement surfaces of the fixture, the FFs are very stable and firm in the oscillation shear, and a greater deflection angle can occur without separation from the measurement fixture surface. When the amplitude is small, the energy storage modulus of the FFs is higher than the loss modulus, and the microstructure inside the FFs is mainly composed of a large columnar mechanism, at which time the FFs exhibit the characteristics of a solid. As the amplitude gradually increases, the interior of the FFs gradually becomes smaller, resulting in a significant reduction in the modulus of elasticity, and eventually changes to a fluid-based feature when the amplitude is large.
In Figure 5c, comparing the energy storage modulus and loss modulus curve, the LVE region of the FFs decrease with the increase of temperature because with the increase in temperature the heat fluctuation effect and the Brownian motion of the magnetic particles are aggravated, which is manifested as the rapid movement of the magnetic particles in the base carrier liquid, making it more difficult to form a chain structure. For the reasons above, when the temperature is relatively high, the chain structure inside the FFs is reduced. When the temperature gradually decreases, the thermal movement weakens and the liquid fluidity slows down, which is conducive to the accumulation of FFs in a strong magnetic field to form more chain structures, in turn further hinders the flow of FFs, and makes it easier for magnetic particles in a free state to attach to the chain structure, accelerating the formation of chain structures.
Because of the strong magnetic recovery force of the chain structure, the microstructure can be allowed to deflect in a small range. When greater than this interval, a small number of microstructures begin to separate or slip, resulting in an unrecoverable viscous flow of the test sample, at which point G′ is greatly reduced. The intersection of the curve G′ and the curve G″ represents the transition point at which the sample begins to flow, and when the amplitude is below that point, the FFs exhibit the characteristics of a solid or gel-like substance, and at the point where the amplitude exceeds this point, the FFs are dominated by the viscosity loss characteristics of the fluid. It can be known that the loss modulus G″ produces a peak near the intersection point, which corresponds to the dissipation of energy generated when the internal column structure of the FFs is separated from the upper and lower surfaces of the measuring fixture, and in the last stage of the curve, both the curve G′ and the curve G″ decrease, which is due to the decrease in the number and size of the columnar structure with the increase of the strain rate.

3.3.2. Frequency Scanning Analysis

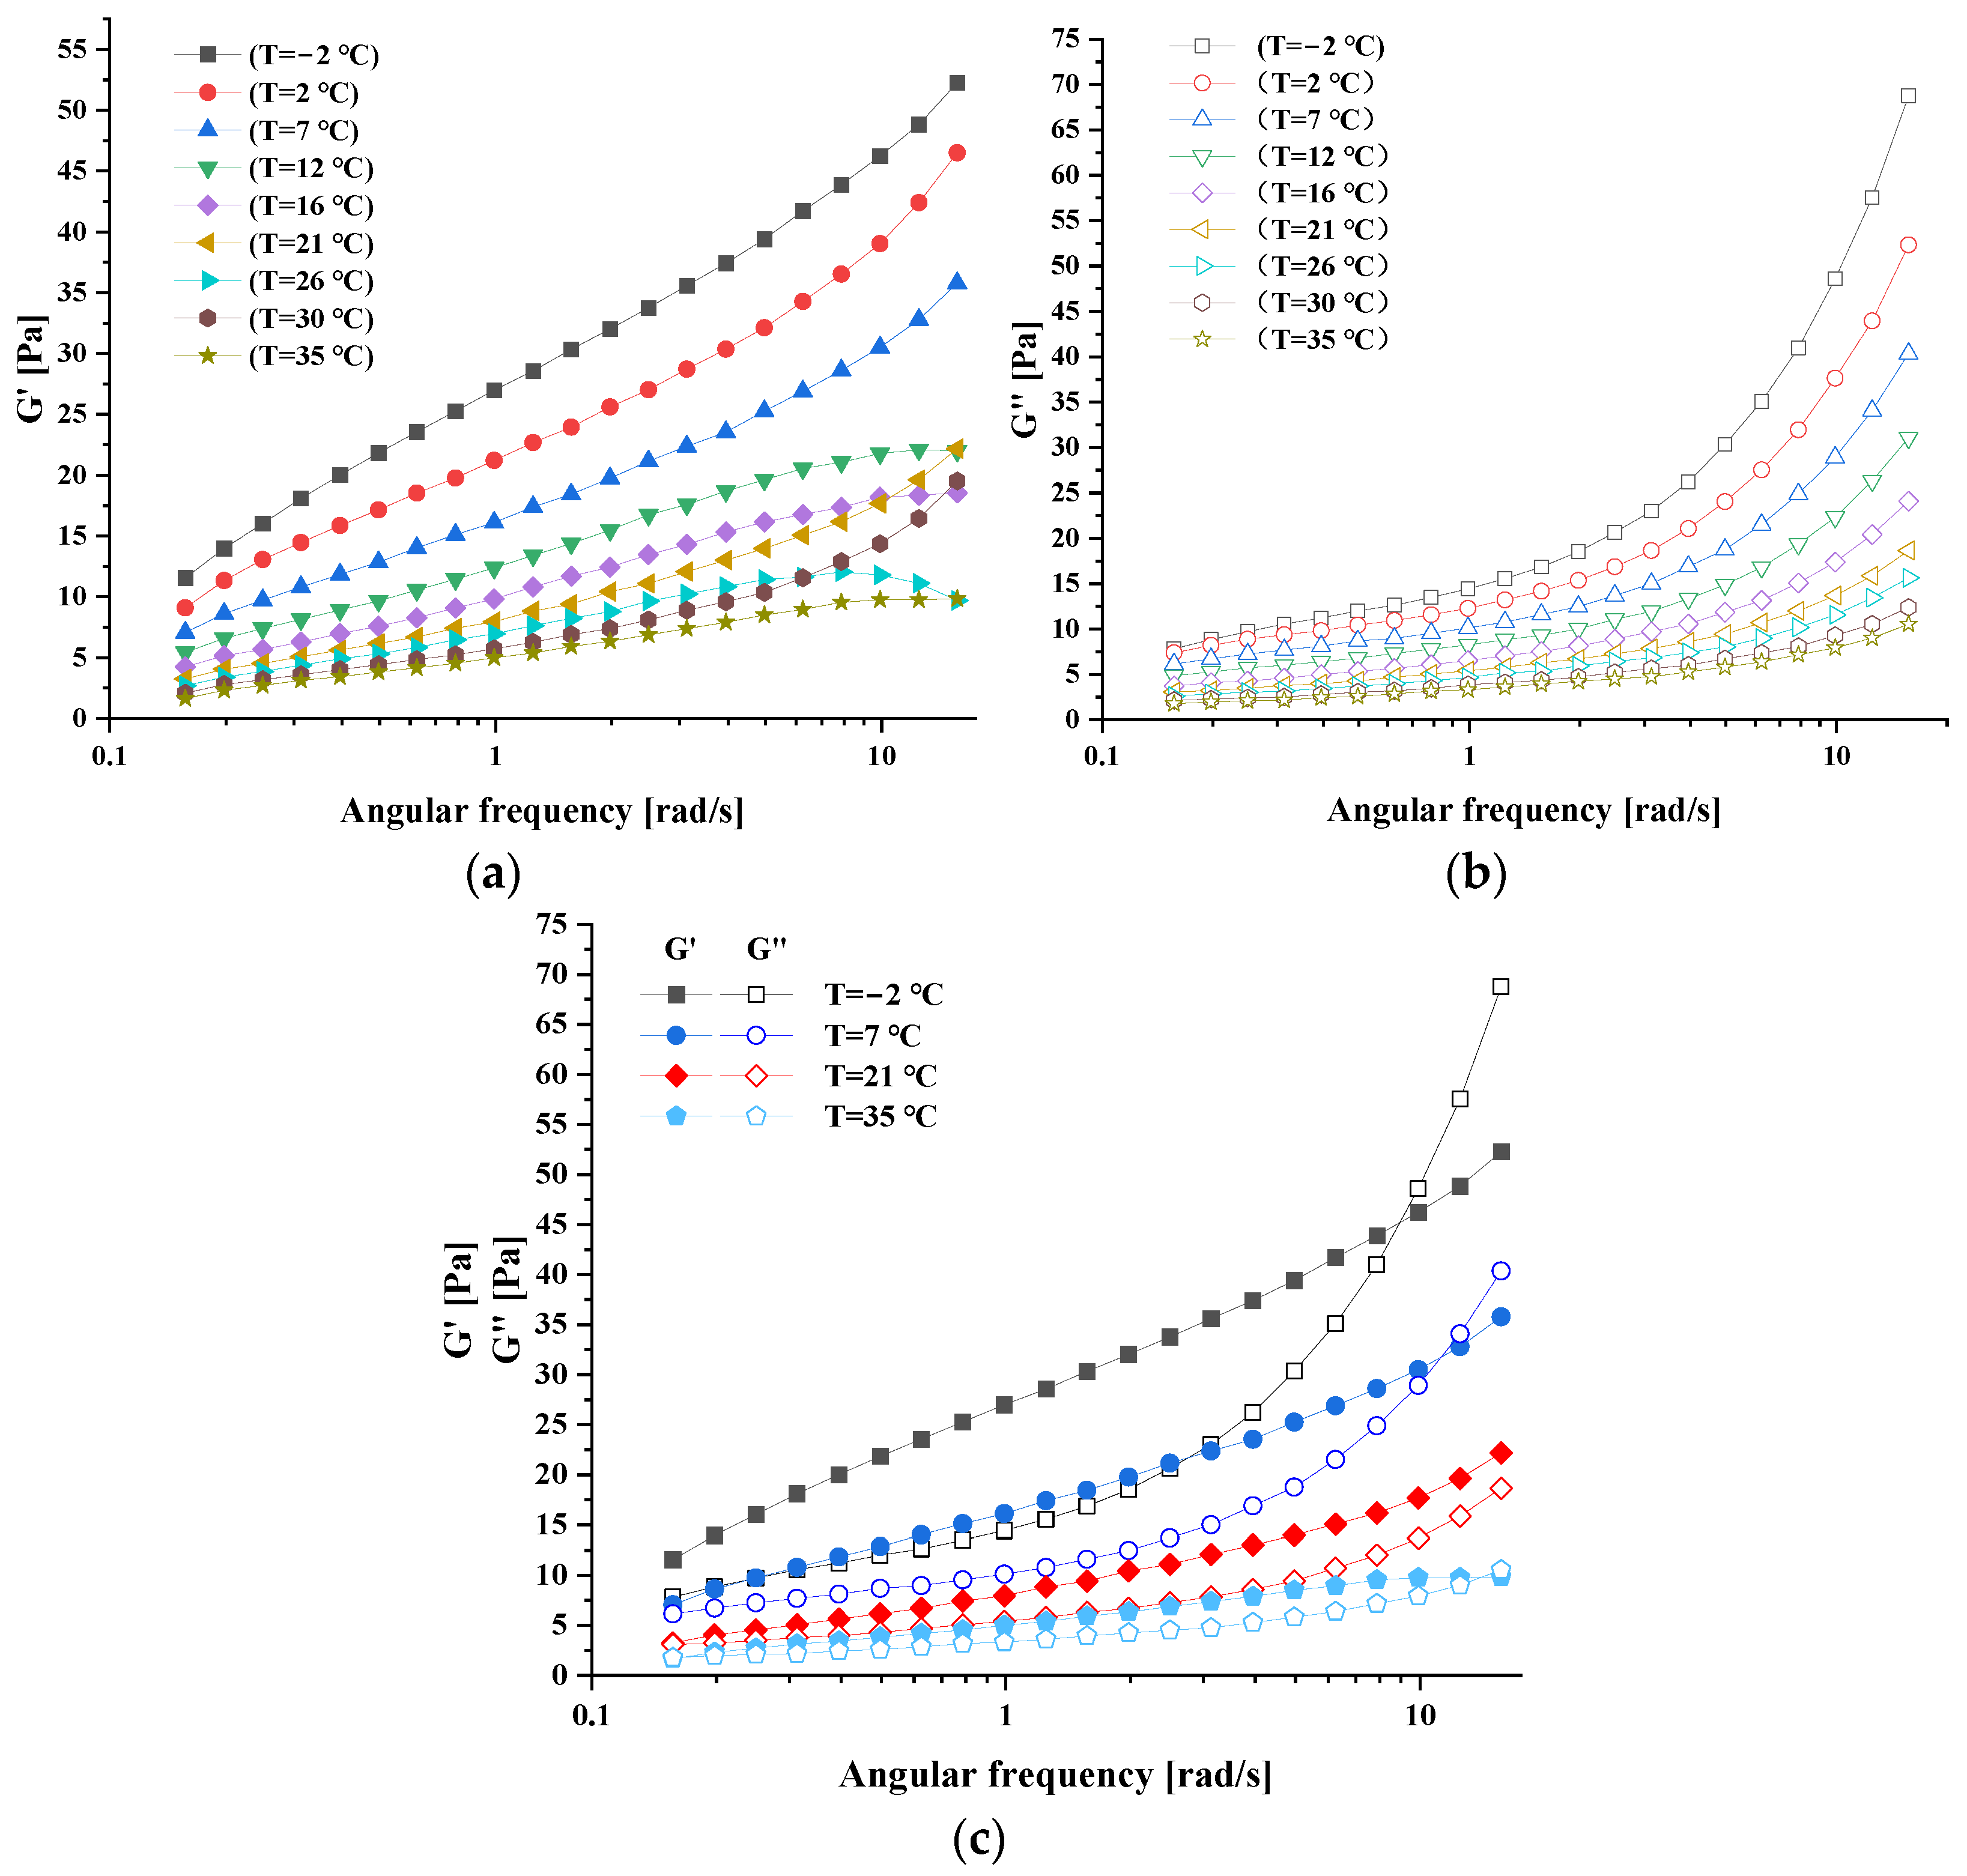
Figure 7 shows the curve of the energy storage modulus and the loss modulus measured by FFs at different temperatures. Prior to test measurement, the sample is pre-sheared at a shear rate of 500 s−1 for 5 min, which can remove the influence of the strain history. Finally, the sample is static in the magnetic field for 10 min to form the equilibrium structure. The experiment selects a constant amplitude of 1%, and the test magnetic field strength is 100 mT, in which the angular frequency changes from low to high or from high to low.
As shown in Figure 7, it can be clearly seen that the lower the temperature, the higher the energy storage modulus and loss modulus, and as the vibration frequency increases, the gap between the curves is getting wider. The slope of the energy storage modulus curve remains basically unchanged, while the slope of the loss modulus curve has been increasing. Under the influence of shear oscillation, the orientation of the internal chain structure of the FFs is distributed along the shear direction [11]. Frequency intensity leads to an increase in entanglement in the matrix because the deformation of the molecular chains does not keep up with the shear force. As can be seen from Figure 7a,b, in the initial stage of the experiment, G″ > G′, the internal microstructure of the FFs can be sufficiently relaxed, so complex fluids exhibit the characteristic of viscous loss. It can be seen from the change trajectory of the curve that the oscillation frequency gradually becomes larger, so that the small amount of microstructure inside the FFs cannot be relaxed in time, which is manifested as a significant increase in G′ representing the sample elasticity. In the medium frequency range, the curves of G′ and G″ maintain steady growth. At the end of the curves, G″ is much higher than G′, which is related to the strong dissipation between the internal structures of complex fluids under high-frequency oscillation conditions.
The oscillation frequency at the first intersection of the FF modulus in Figure 7c is basically the same, indicating that the temperature in the low frequency range does not have much effect on the relaxation time of the internal structure of the FFs. At a lower oscillation frequency, the first intersection point of curve G′ and curve G″ represents the liquid–solid transition frequency of the fluid, which is the reciprocal of the characteristic relaxation time of the internal structure of the complex fluid. The intersection point marks the formation of a large columnar structure with a larger modulus of lower temperatures. At very high frequencies, the curves of G′ and G″ rise rapidly, where G″ is more intense and the curves intersect again. The microstructure inside the FFs is undergoing glass transition, which indicates that at high oscillation frequencies, the FFs mainly exist in a glassy form, that is, there is a high viscosity and elasticity at the same time [23,24]. The energy storage modulus is always lower than the loss modulus. This is due to the strong dissipation effect between the internal structures of complex fluids under high-frequency oscillation conditions. The size and quantity of the internal columnar structure of FFs are small, so that they are always in a viscous fluid state during the frequency increase process.

4. Conclusions

The rheological properties of L-AN32-based ferrofluid are studied systematically. The experimental results show that under different magnetic fields, both static stress and dynamic yield stress increase with the increase of magnetic field intensity, while static stress is much higher than dynamic yield stress. L-AN32-based ferrofluid has the characteristics of secondary shear thinning, showing a strong thixotropic behavior. The static yield stress obtained by the H–B model is much larger than the dynamic yield stress. The comparison of viscosity curves further proves that the shear history has a great influence on the rheological properties of magnetic liquids. In the amplitude sweep and frequency sweep experiments, it is observed that the storage modulus G′ and loss modulus G″ decrease with the increase of temperature. The reason behind it is attributed to the formation and destruction of chain structure or column structure with temperature.

Author Contributions

Conceptualization, H.W.; Writing—original draft, H.W.; Formal analysis, H.W.; Methodology, Y.M.; Writing—review & editing, Y.M. and J.D.; Resources, Z.L. and H.C.; Project administration, Z.L., H.C.; Supervision, Z.L., H.C. and J.D. All authors have read and agreed to the published version of the manuscript.

Funding

This work was financially supported by Research Project of China University of Labor Relations, with grant number 22XYJS022; Second Batch of New Engineering Research and Practice Projects of the Ministry of Education, with grant number E-XTYR20200608; National major scientific research instrument development project, with grant number 51927810; Beijing Jiaotong University Talent Fund, with grant number M21RC00130; Beijing Natural Science Foundation, with grant number 2222072; Fundamental Research Funds for the Central Universities, with grant number 2022JBMC032; Foundation of Key Laboratory of Vehicle Advanced Manufacturing, Measuring and Control Technology (Beijing Jiaotong University), Ministry of Education, China, with grant number M21GY1300050.

Institutional Review Board Statement

Not applicable.

Informed Consent Statement

Not applicable.

Data Availability Statement

Not applicable.

Conflicts of Interest

The authors declare no conflict of interest.

References

  1. Ronzova, A.; Sedlacik, M.; Cvek, M. Magnetorheological fluids based on core–shell carbonyl iron particles modified by various organosilanes: Synthesis, stability and performance. Soft Matter. 2021, 17, 1299–1306. [Google Scholar] [CrossRef] [PubMed]
  2. Maurya, C.S.; Sarkar, C. Rheological response of soft flake-shaped carbonyl iron water-based MR fluid containing iron nanopowder with hydrophilic carbon shell. Rheol. Acta 2021, 60, 277–290. [Google Scholar] [CrossRef]
  3. Pathak, S.; Jain, K.; Kumar, P.; Wang, X.; Pant, R.P. Improved thermal performance of annular fin-shell tube storage system using magnetic fluid. Appl. Energy 2019, 239, 1524–1535. [Google Scholar] [CrossRef]
  4. Pathak, S.; Zhang, R.; Gayen, B.; Kumar, V.; Zhang, H.; Pant, R.P.; Wang, X. Ultra-low friction self-levitating nanomagnetic fluid bearing for highly efficient wind energy harvesting. Sustain. Energy Technol. Assess. 2022, 52, 102024. [Google Scholar] [CrossRef]
  5. Pathak, S.; Zhang, R.; Bun, K.; Zhang, H.; Gayen, B.; Wang, X. Development of a novel wind to electrical energy converter of passive ferrofluid levitation through its parameter modelling and optimization. Sustain. Energy Technol. Assess. 2021, 48, 101641. [Google Scholar] [CrossRef]
  6. Pathak, S.; Jain, K.; Kumar, V.; Pant, R.P. Magnetic fluid based high precision temperature sensor. IEEE Sens. J. 2017, 17, 2670–2675. [Google Scholar] [CrossRef]
  7. Li, Z.; Li, D.; Chen, Y.; Yang, Y.; Yao, J. Influence of viscosity and magnetoviscous effect on the performance of a magnetic fluid seal in a water environment. Tribol. Trans. 2018, 61, 367–375. [Google Scholar] [CrossRef]
  8. Cvek, M.; Mrlik, M.; Pavlinek, V. A rheological evaluation of steady shear magnetorheological flow behavior using three-parameter viscoplastic models. J. Rheol. 2016, 60, 687–694. [Google Scholar] [CrossRef]
  9. Maurya, C.S.; Sarkar, C. Rheological and creep and recovery behavior of carbonyl iron water-based magnetorheological gel using laponite as an additive and oleic acid as a surfactant. Rheol. Acta 2022, 61, 99–110. [Google Scholar] [CrossRef]
  10. Zhu, S.; Li, D.; Wang, Z. Research on FF seal and mechanical seal combined sealing technology. Funct. Mater. 2017, 48, 2192–2196. [Google Scholar]
  11. Kumar, V.; Rana, A.; Yadav, M.S.; Pant, R.P. Size-induced effect on nano-crystalline CoFe2O4. J. Magn. Magn. Mater. 2008, 320, 1729–1734. [Google Scholar] [CrossRef]
  12. Noorjahan, G.A.; Jain, K.; Pathak, S.; Pant, R.P. Dipolar interaction and magneto-viscoelasticity in nanomagnetic fluid. Nanosci. Nanotechnol. 2017, 17, 1–6. [Google Scholar] [CrossRef]
  13. Li, Z.; Yao, J.; Li, D. Research on the rheological properties of a perfluoropolyether based ferrofluid. J. Magn. Magn. Mater. 2017, 424, 33–38. [Google Scholar] [CrossRef]
  14. Paul, G.; Das, P.K.; Manna, I. Synthesis, characterization and studies on magneto-viscous properties of magnetite dispersed water based nanofluids. J. Magn. Magn. Mater. 2016, 404, 29–39. [Google Scholar] [CrossRef]
  15. Bai, L.; Zhang, Z.L.; Xu, L.F. Preparation and properties of Fe3O4@SiO2 silicone oil based FF. J. Funct. Mater. 2017, 48, 11103–11107. [Google Scholar]
  16. Kim, D.K.; Zhang, Y.; Kehr, J.; Klason, T.; Bjelke, B.; Muhammed, M. Characterization and MRI study of surfactant-coated superparamagnetic nanoparticles administered into the rat brain. J. Magn. Magn. Mater. 2001, 225, 256–261. [Google Scholar] [CrossRef]
  17. Li, D. Research on the Theory and Application of Magnetic Fluid; Northern Jiaotong University: Beijing, China, 1996; pp. 24–28. [Google Scholar]
  18. Dinkgreve, M.; Paredes, J.; Denn, M.M.; Bonn, D. On different ways of measuring “the” yield stress. J. Non-Newton. Fluid Mech. 2016, 238, 233–241. [Google Scholar] [CrossRef]
  19. Wang, G.; Ma, Y.; Tong, Y.; Dong, X. Synthesis, characterization and magnetorheological study of 3-aminopropyltriethoxysilane-modified Fe3O4 nanoparticles. Smart Mater. Struct. 2016, 25, 035028. [Google Scholar] [CrossRef]
  20. de Vicente, J.; Vereda, F.; Segovia-Gutiérrez, J.P.; del Puerto Morales, M.; Hidalgo-Álvarez, R. Effect of particle shape in magnetorheology. J. Rheol. 2010, 54, 1337–1362. [Google Scholar] [CrossRef]
  21. Mishra, A.; Pathak, S.; Kumar, P.; Singh, A.; Jain, K.; Chaturvedi, R.; Singh, D.; Basheed, G.A.; Pant, R.P. Measurement of static and dynamic magneto-viscoelasticity in facile varying pH synthesized CoFe2O4-based magnetic fluid. IEEE Trans. Magn. 2019, 55, 1–7. [Google Scholar] [CrossRef]
  22. Fan, Y.; Xie, L.; Yang, W.; Sun, B. Magnetic field dependent viscoelasticity of a highly stable magnetorheological fluid under oscillatory shear. J. Appl. Phys. 2021, 129, 204701. [Google Scholar] [CrossRef]
  23. Zhu, Y.; Ivey, M.L.; Sheaffer, P.; Pousset, J.; Liu, J. Magnetic field-induced phase transitions in ferrofluid emulsion. Int. J. Mod. Phys. B 1996, 10, 2973–2981. [Google Scholar] [CrossRef]
  24. Lacoste, D.; Lubensky, T.C. Phase transitions in a ferrofluid at magnetic-field-induced microphase separation. Phys. Rev. E 2001, 64, 041506. [Google Scholar] [CrossRef] [Green Version]
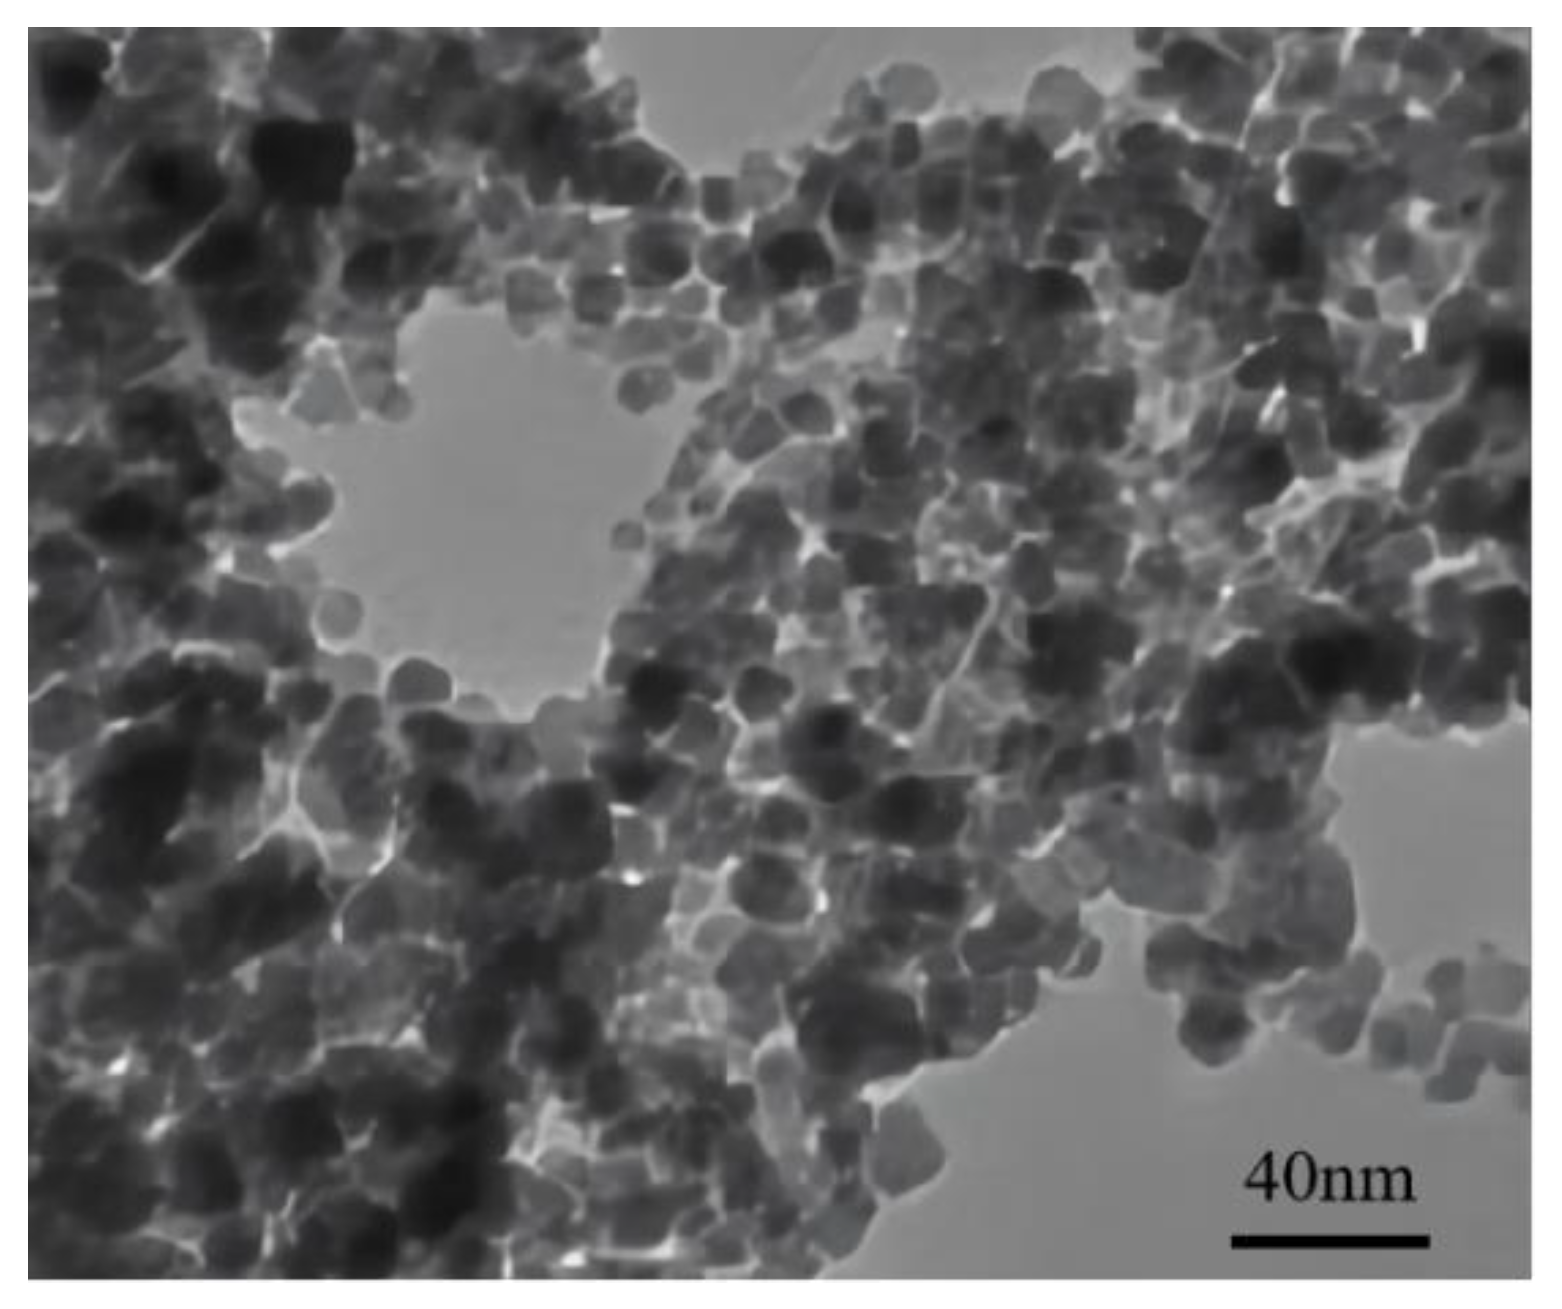
Figure 1. TEM images of the prepared Fe3O4 particles.
Magnetochemistry 08 00100 g001
Figure 2. Magnetization curve of ferrofluid.
Magnetochemistry 08 00100 g002
Figure 3. Static and dynamic flow curves and yield stresses of FFs under different magnetic field strengths: (a) Scanning shear rate from low to high; (b) Shear rate from high to low scanning.
Magnetochemistry 08 00100 g003
Figure 4. The viscosity of the FF in different initial states under different magnetic field strengths evolves with the shear rate: (a) Placed under the magnetic field for 600 s before the experiment; (b) 90 s pre-shear with a shear rate of 100 s−1.
Magnetochemistry 08 00100 g004
Figure 5. Amplitude scanning modulus curve of magnetic liquid at different temperatures: (a) storage modulus curve; (b) loss modulus curve; (c) control of the intersection of the two curves.
Magnetochemistry 08 00100 g005
Figure 6. Schematic of the microscopic process of applying a magnetic field and strain: (a) equilibrium state; (b) the state in which a magnetic field is applied; (c) the state in which the strain is applied; (d) the state of increasing strain; (e) the state of the ultimate strain. “Reprinted/adapted with permission from Ref. [21]. 2019, Mishra, A.; Pathak, S.; Kumar, P.; Singh, A.; Jain, K.; Chaturvedi, R.; Singh, D.”.
Magnetochemistry 08 00100 g006
Figure 7. Frequency scanning modulus curve of FF at different temperatures: (a) storage modulus curve; (b) loss modulus curve; (c) comparison of the intersection points of the two curves.
Magnetochemistry 08 00100 g007
Table 1. Basic physical parameters of L-AN32 base carrier.
Kinematical Viscosity mPa·s (40 °C) Flash Point °CPour Point °CDensity g/cm3 (25 °C)
32208−310.865
Table 2. Physical parameters of L-AN32-based FFs.
Density
g/cm3 (25 °C)
Zero Magnetic Field Viscosity mPa·s (40 °C)Saturation Magnetization kA/mParticle Volume Fraction %
1.249341.424.457.26
Table 3. The fit parameters and decision coefficient(R2) obtained using the H–B model.
Fitting Parameter/M.F.Static ParameterDynamic Parameter
τ 0
[Pa]
k nR2 τ 0
[Pa]
k nR2
0 mT0.010.510.9810.0020.520.980.9999
24 mT0.041.330.850.99990.031.140.890.9999
48 mT0.482.150.790.99970.081.550.880.9999
74 mT0.862.680.760.99920.251.810.850.9999
100 mT1.052.920.760.9990.382.000.840.9999
124 mT1.173.160.750.99890.472.140.830.9998
150 mT1.293.210.750.99860.532.240.820.9997
174 mT1.393.260.740.99830.592.310.820.9997
200 mT1.463.320.740.99820.622.360.820.9997
Publisher’s Note: MDPI stays neutral with regard to jurisdictional claims in published maps and institutional affiliations.