Article

ESR Investigations of the Submicron LiFe1−xMnxPO4 Systems

1
Kazan E. K. Zavoisky Physical-Technical Institute, Federal Research Center “Kazan Scientific Center of the Russian Academy of Sciences”, Sibirsky Tract 10/7, 420029 Kazan, Russia
2
Institute of Physical and Theoretical Chemistry, University of Bonn, Wegelerstr. 12, 53115 Bonn, Germany
3
Institute of Solid State Chemistry and Mechanochemistry, Siberian Branch of Russian Academy of Sciences, 18 Kutateladze, 630128 Novosibirsk, Russia
*
Author to whom correspondence should be addressed.
Magnetochemistry 2022, 8(7), 74; https://doi.org/10.3390/magnetochemistry8070074
Submission received: 30 June 2022 / Revised: 15 July 2022 / Accepted: 18 July 2022 / Published: 21 July 2022
(This article belongs to the Section Magnetic Materials)

Abstract

:
Magnetic properties of the submicron carbon-coated LiFe1−xMnxPO4 (x = 0, 0.01, 0.1) systems were investigated using the electron spin resonance (ESR) method. The observed ESR signal consisted of two broad resonance lines with a Lorentzian line shape for all samples. The temperature dependence character of the integral intensity of these lines changed significantly with increasing manganese concentration, indicating a change in the nature of the magnetic interactions between the manganese and iron ions. We suggest that the noticeable capacity loss observed in the LiFe1−xMnxPO4 systems with increasing Mn content can be explained by the random distribution of Mn ions and changes to the type of magnetic ordering in these systems, despite the attractiveness of the electrochemical Mn2+/Mn3+ pair compared with Fe+2/Fe+3.

1. Introduction

Phospho-olivines were proposed as positive-electrode materials for rechargeable lithium batteries several decades ago [1], and today, they are already widely used in commercial lithium-ion batteries for mobile devices, energy storage power stations, and other applications. Among the different phospho-olivines, the lithium-iron phospho-olivine enables the utilization of 95% of the theoretical capacity (170 mAh/g) at room temperature [2,3] and has environmental and cost advantages. However, the significant limitation for the further commercial application of these phospho-olivines is their rapid capacity degradation at extreme low and high temperatures. Some accelerated fading mechanisms of LiFePO4/C batteries at room temperature and under extreme temperatures, and the progress made in the modification strategies, are discussed in [4,5]. The increased ohmic resistance due to the growth of the solid electrolyte interface, the reduced reaction kinetics of Li+ due to the complication of the energy pathway between the LiFePO4/FePO4 phases during the lithium extraction/insertion process at low temperatures, and the limited ionic diffusion rate in the electrolyte can cause the degradation of LiFePO4/C batteries at low temperatures [5]. The physical properties of lithium-iron phospho-olivines have also been intensively theoretically studied. Recent achievements in first-principles studies of LiFePO4 cathode materials are discussed in [6], including findings on the structure, electronic properties, Li-ion transport characteristics, mechanical stability, and thermodynamic properties that can provide a better understanding of the modification direction for olivine-type materials. Among others, the ion substitution method (on either Li or Fe sites) can be considered as one of the directions for modification [7]. While the most favorable intrinsic defect in LiFePO4 is the Li-Fe “anti-site” pair, in which a Li ion and an Fe ion are interchanged, LiFePO4 is not tolerant to aliovalent doping on energetic grounds, and favorable low energies are found only for divalent dopants on the Fe site (such as Mn) [8].
A general overview of the structural features, typical electrochemical behavior, delithiation/lithiation mechanisms, and thermodynamic properties of LiFe1−yMnyPO4 (0.5 ≤ y < 1.0), as well as recent developments in the improvement of the electrochemical performance of LiFe1−yMnyPO4-based materials, are summarized in [9], including the selection of the synthetic methods, nanostructuring, surface coating, optimizing Fe/Mn ratios and particle morphologies, and others. In addition to the above-mentioned work, the impact of carbon coating on the specific surface area and the discharge profiles of LiFe0.5Mn0.5PO4 were investigated in [10]; the influence of different Fe/Mn ratios on the morphology and the electrical and electrochemical performances of LiFe1−yMnyPO4/C nanofiber composites were analyzed in [11]; the effects of the intensity of high-energy ball-milling on the porous structure and electrochemistry of LFMP/C were studied in [12]; and the influences of the synthesis method and morphology on the electrochemical properties have been observed by comparing (i) mechanochemical and solvothermal methods [13], (ii) the sol-gel route combined with freeze drying [14] and high-energy ball-milling-assisted sol-gel methods [15], (iii) the rheological phase method [16], and others.
It is known from the literature that, in some synthesis methods (e.g., the solvothermal method), LiFe1−xMnxPO4 samples have two different phases: LiFePO4 and LiMnPO4, which are randomly stacked and characterized by a pronounced structural distortion of the MO6 (M = Fe or Mn) octahedral, with the best electrochemical performance exhibited by the LiFe0.75Mn0.25PO4 sample [17]. The thermodynamic behavior of Mn-doped LiFePO4 cathodes was also recently examined through first-principles simulations using the multi-phase object Li(MnyFe1−y)PO4-(MnyFe1−y)PO4 [18]. The investigation of LiFe1−yMnyPO4/C (y = 0–0.3) nanocomposites demonstrated that samples with a low manganese content are characterized by increased conductivity and enhanced charge/discharge capacity, especially at high current density, and the regions with an inhomogeneous distribution of divalent and trivalent manganese ions are formed in LixFe0.7Mn0.3PO4 [19].
Here, we present a detailed investigation of LiFe1−xMnxPO4 using the electron spin resonance method. It is well known that the electron spin resonance (ESR) method is a highly sensitive experimental technique that allows us to detect resonance signals from objects which cannot be registered either by X-ray structural analysis or by electron microscopy, and that offers us the possibility of studying magnetic phase separation. The detailed XRD, Mössbauer, and NMR spectroscopy, and the magnetic susceptibility measurements of carbon-coated LiFe1−xMnxPO4 (0 ≤ x ≤ 1) samples, which were synthesized by the same method as the one studied in this work, are presented in [20]. In this work, we focus on submicron carbon-coated LiFe1−xMnxPO4 samples with low manganese concentrations (x = 0.01, 0.1), in addition to the initial LiFePO4.

2. Experimental Results

The LiFe1−xMnxPO4 samples were prepared by the mechanochemically assisted carbothermal reduction of Li2CO3, Fe2O3, MnO2, and (NH4)2HPO4 using the high-energy planetary mill, as described in [20,21]. Electron spin resonance (ESR) measurements were carried out using the continuous wave (CW) EPR spectrometer BER-218S (Bruker, Germany) at the frequency of 9.58 GHz (X-band) in the temperature range from 7 K to 300 K. The modulation of the applied magnetic field was used to detect the first derivative of the absorption power dP/dH in order to increase the signal-to-noise ratio of the experiment. The modulation frequency was 100 kHz and the modulation amplitude was 10 Oe.
The ESR spectra of the initial LiFePO4 and manganese-substituted LiFe1−xMnxPO4 (x = 0.01, 0.1) samples measured at different temperatures are presented in Figure 1. The intensity of some experimental spectra was multiplied for clarity: at low temperatures for the LiFe1−xMnxPO4 (x = 0 and 0.01) samples, and at high temperatures for the LiFe0.9Mn0.1PO4 samples, respectively, indicating the different behavior of the integral intensity of the ESR spectra with a change in temperature. Figure 2 shows the concentration evolution of the ESR spectra at a fixed temperature. One can see that the ESR spectra have a similar line shape for all samples at room temperature, and they are very different at T = 50 K.
In all temperature ranges, the ESR spectra of the LiFe1−xMnxPO4 samples can be described by the sum of two exchange-narrowed resonance lines, which is well fitted by the asymmetric Lorentzian line shape that includes the circular components of the exciting linearly polarized microwave with the resonance at the reversed magnetic field −H0 [22]:
d P d H = d d H Δ H + α H H 0 Δ H 2   + H H 0 2 + Δ H α H + H 0 Δ H 2   + H + H 0 2
Equation (1) includes both absorption and dispersion, where α denotes the dispersion-to-absorption (D/A) ratio. It should be noted that α was taken equal to zero to describe the experimental data. Equation (1) should be used when the linewidth ΔH is on the same order of magnitude as the resonance field H0 [23,24], which was also observed in the investigated samples. The fitted ESR spectrum was calculated as the sum of Equation (1) multiplied by the amplitude (A) of line 1 and line 2, respectively.
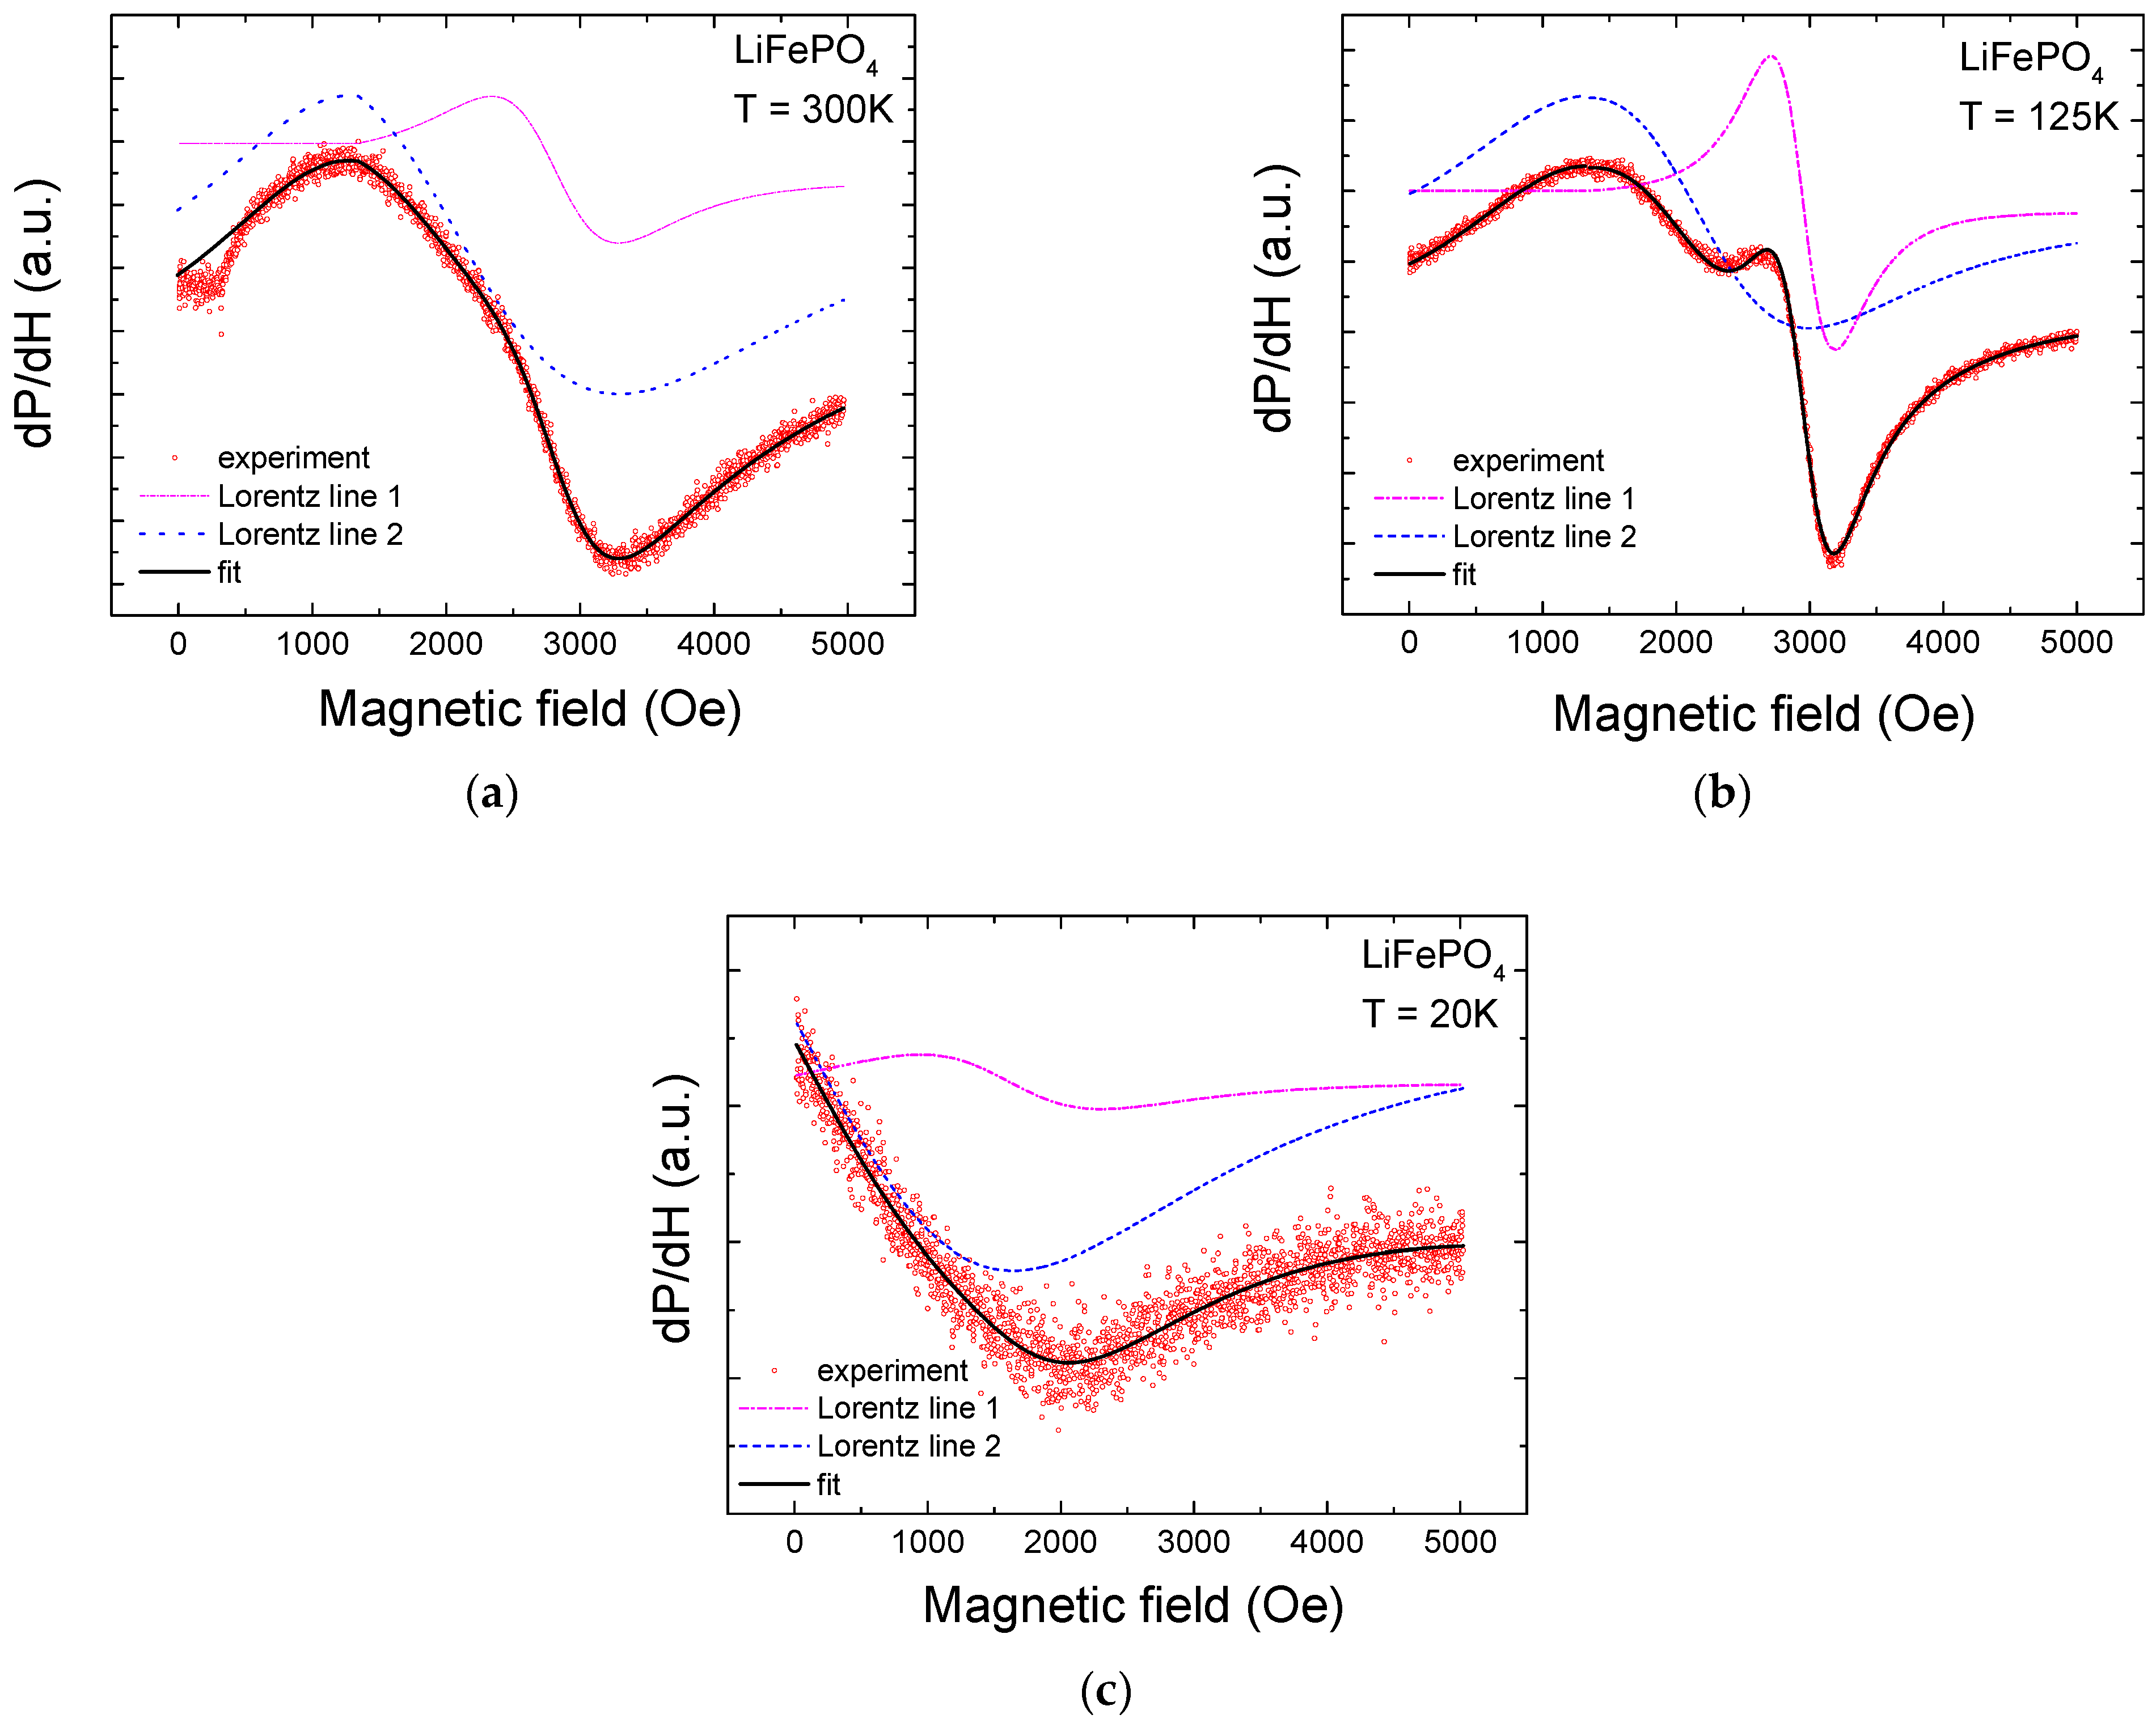
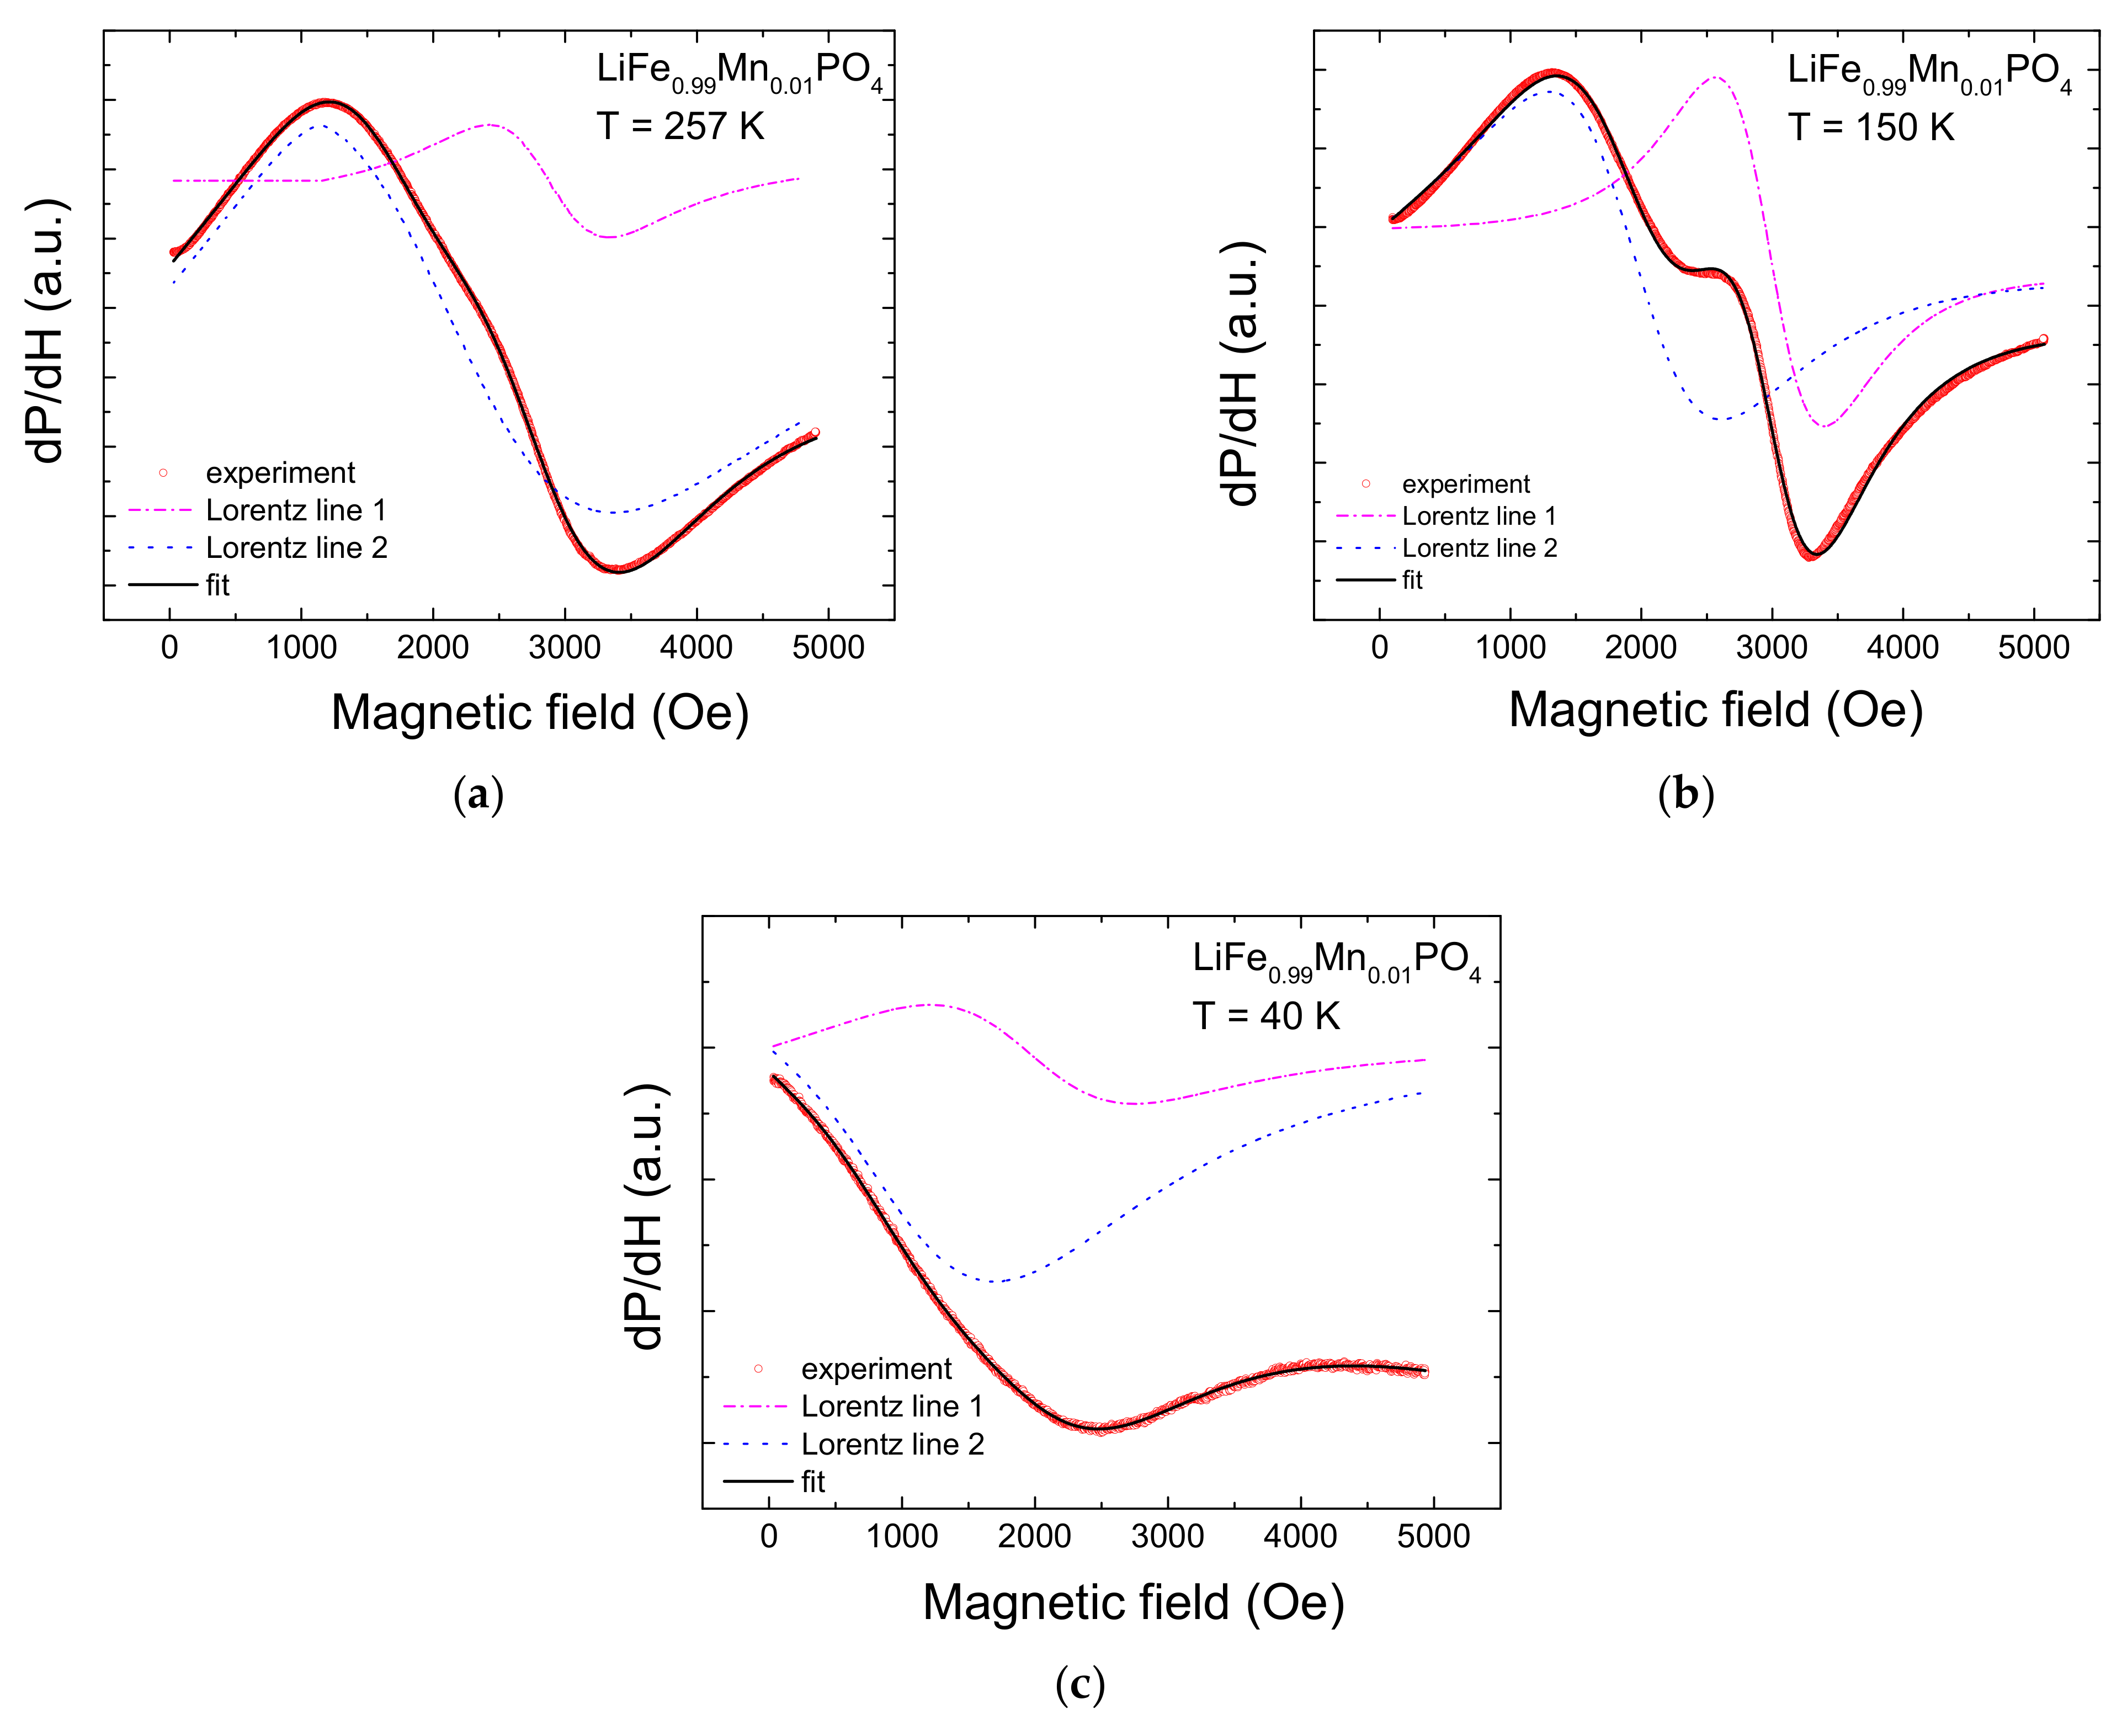
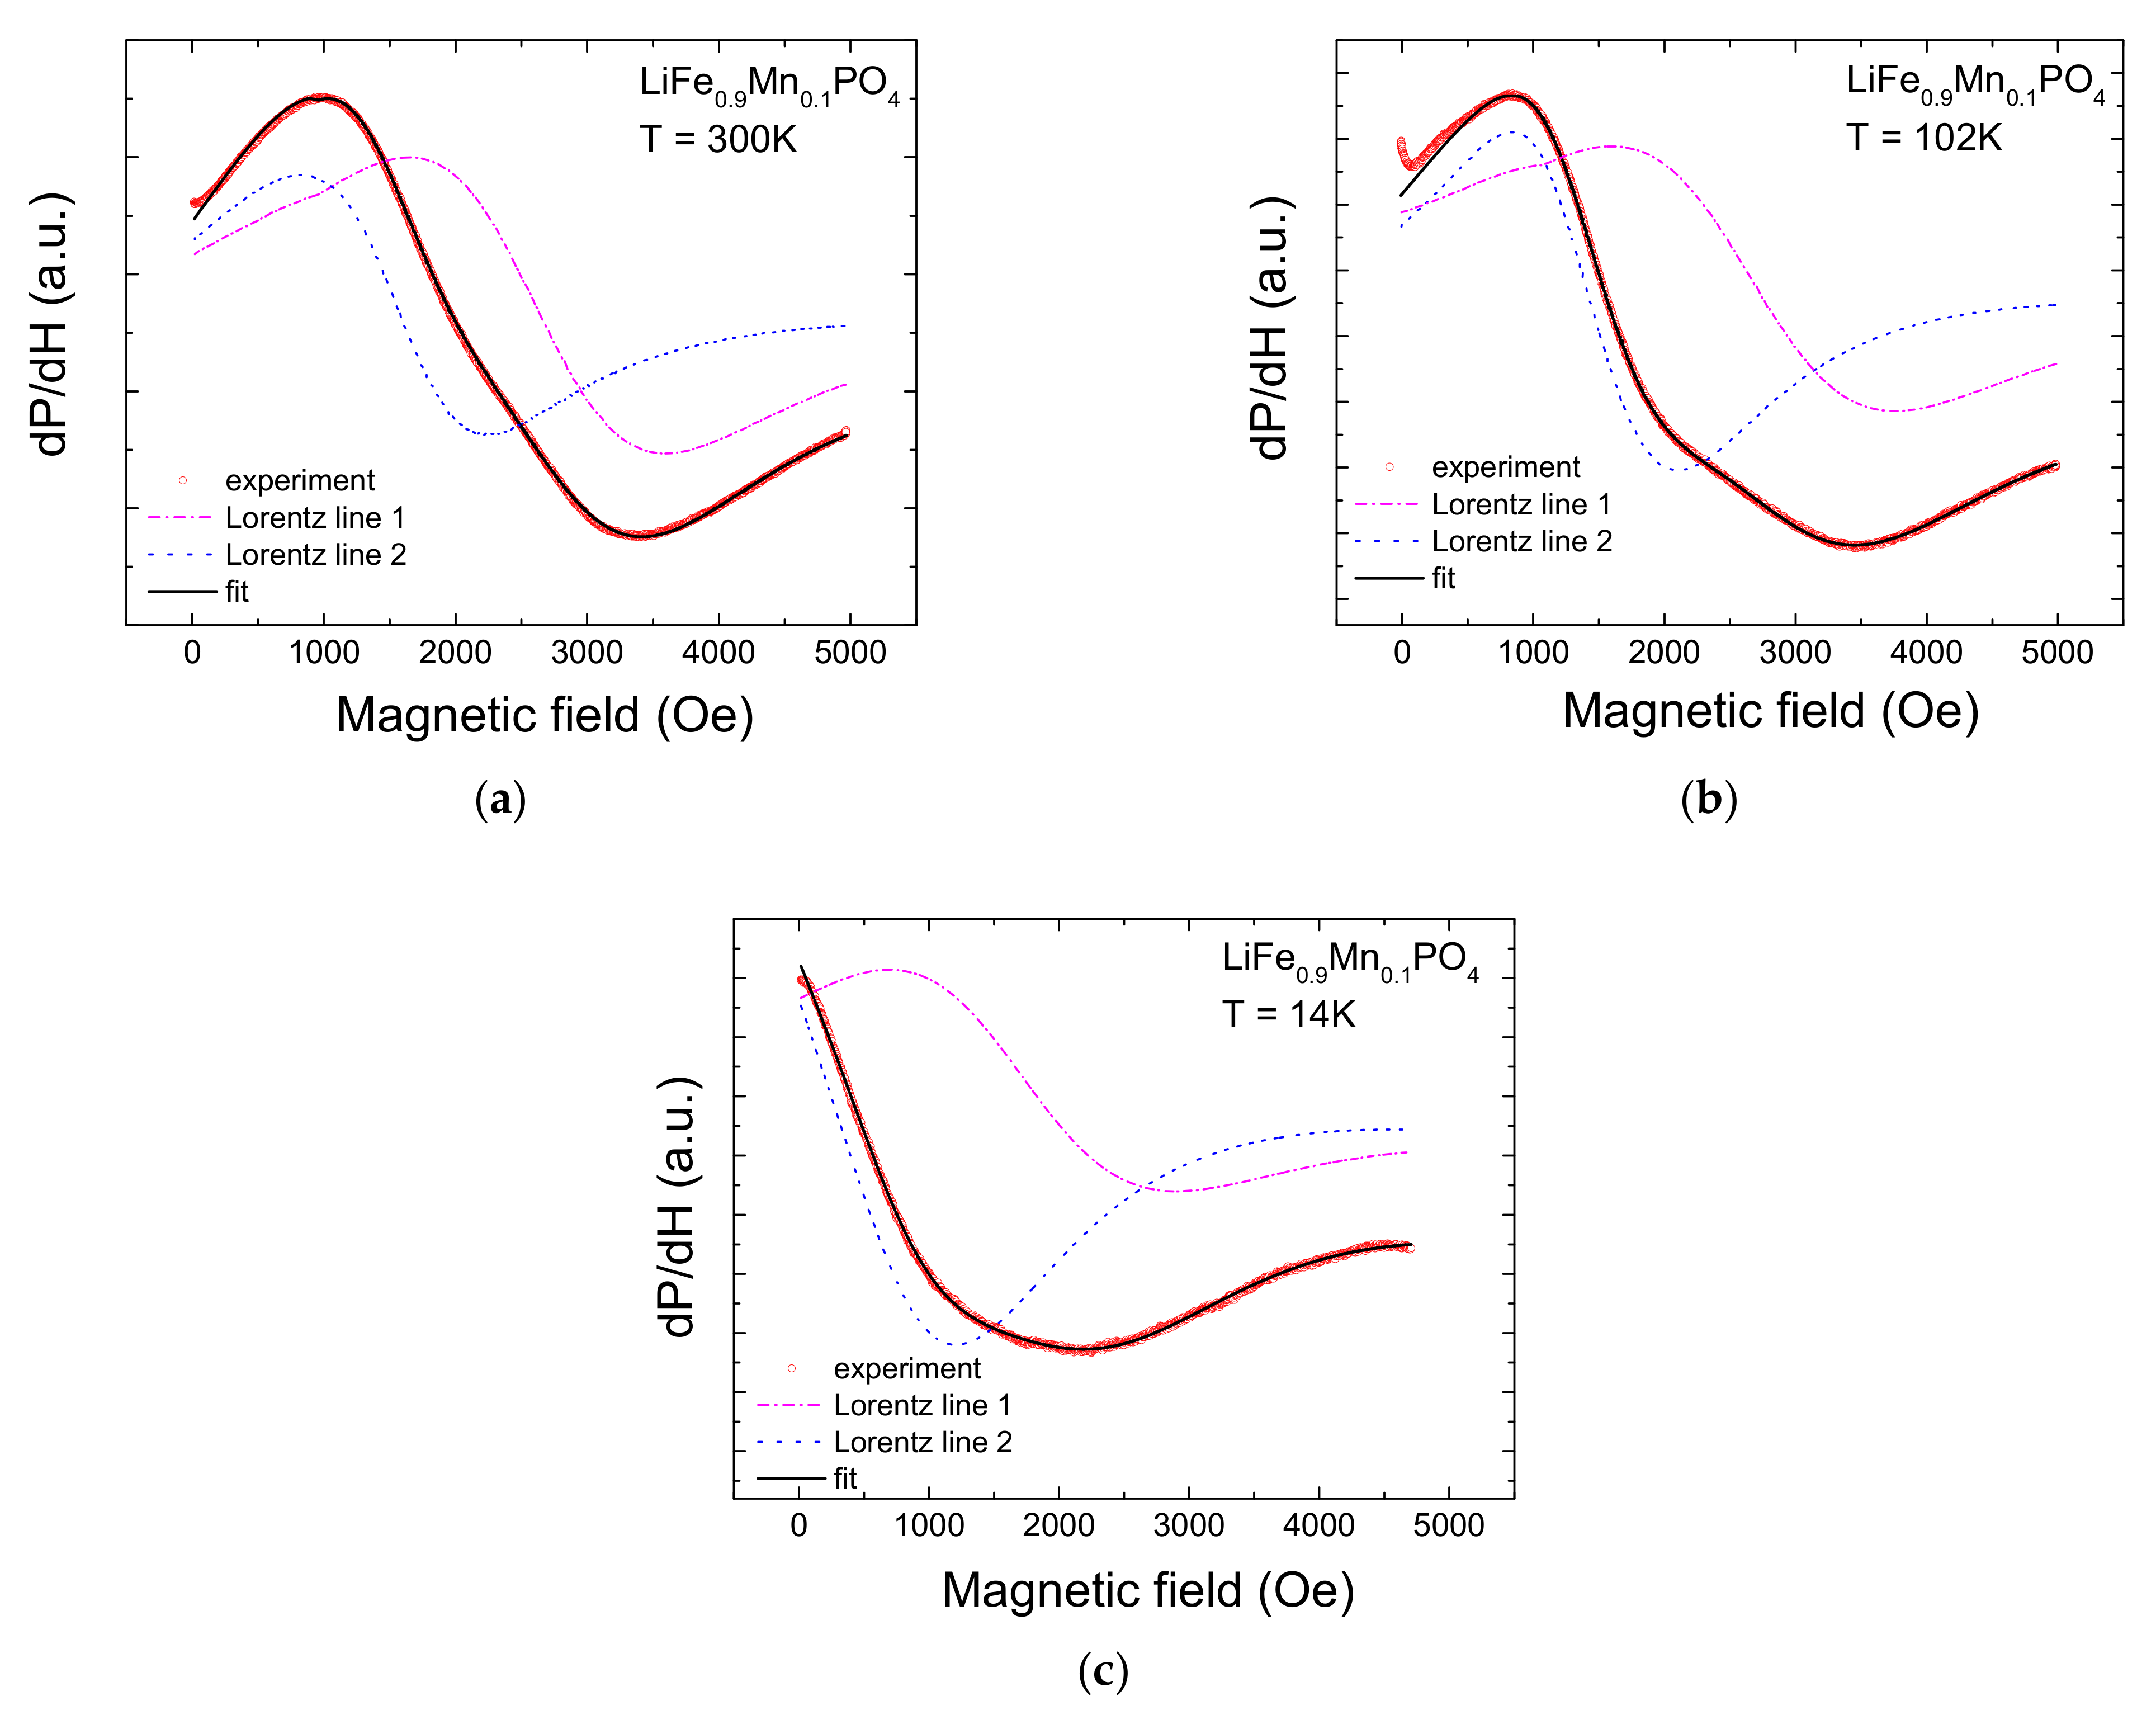
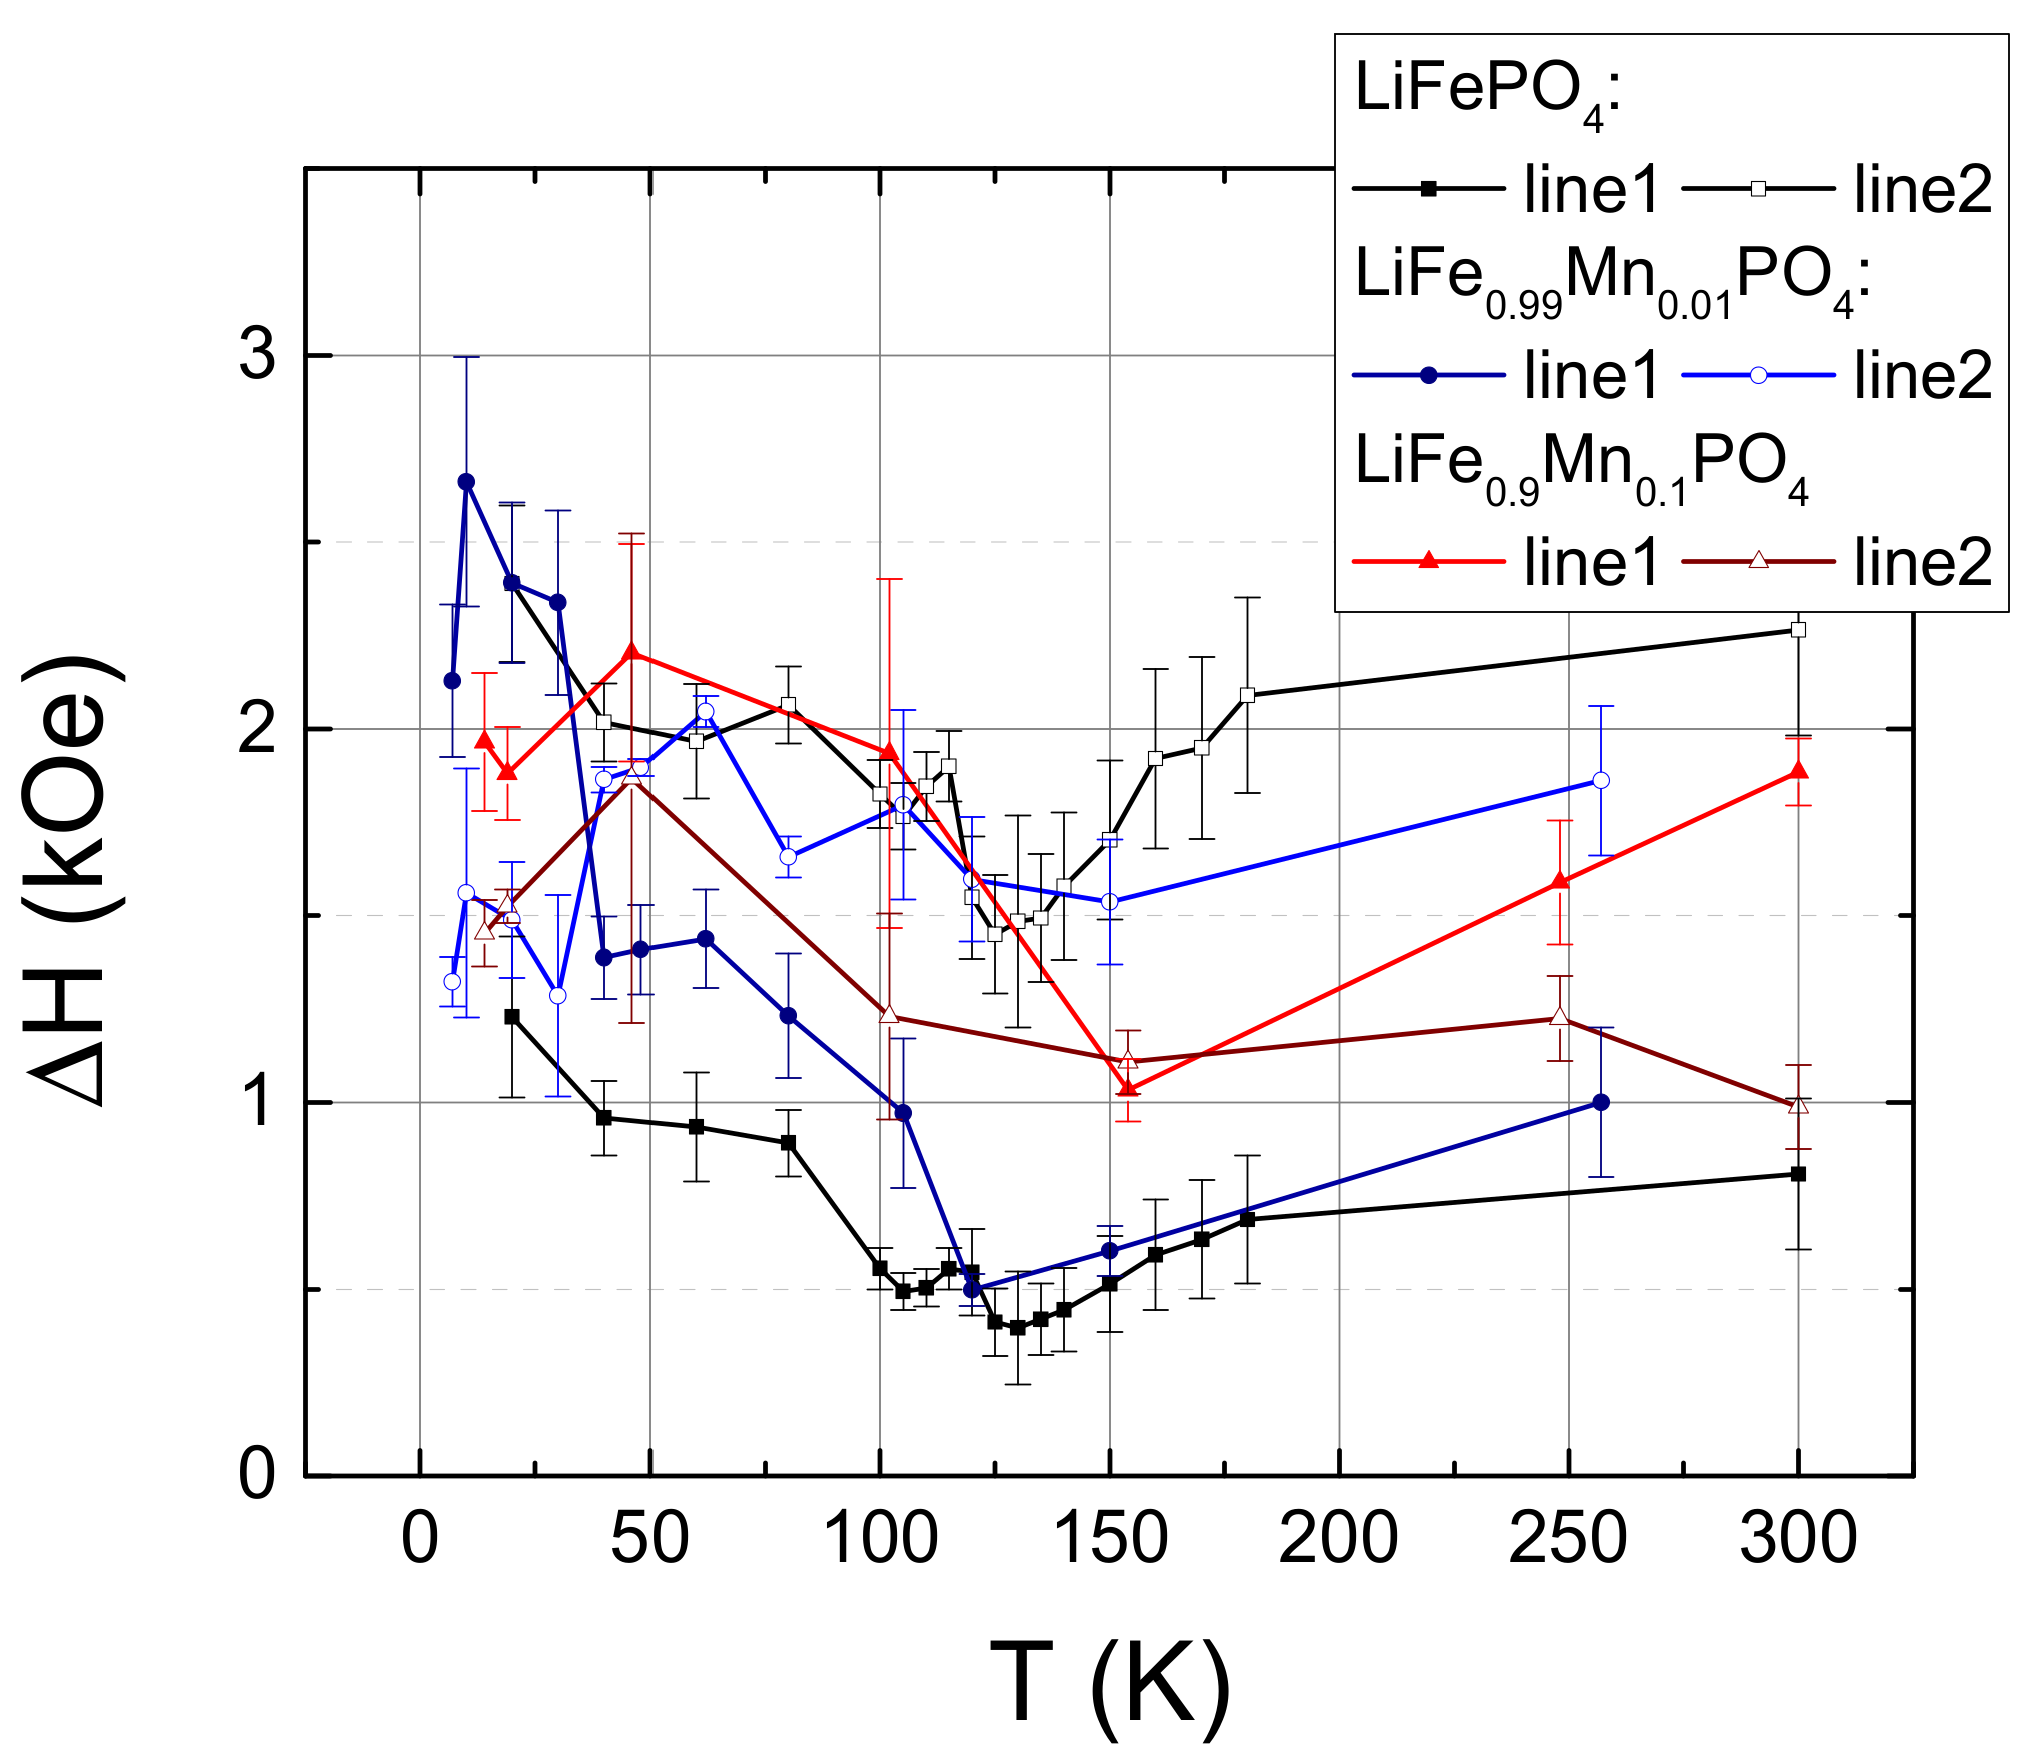
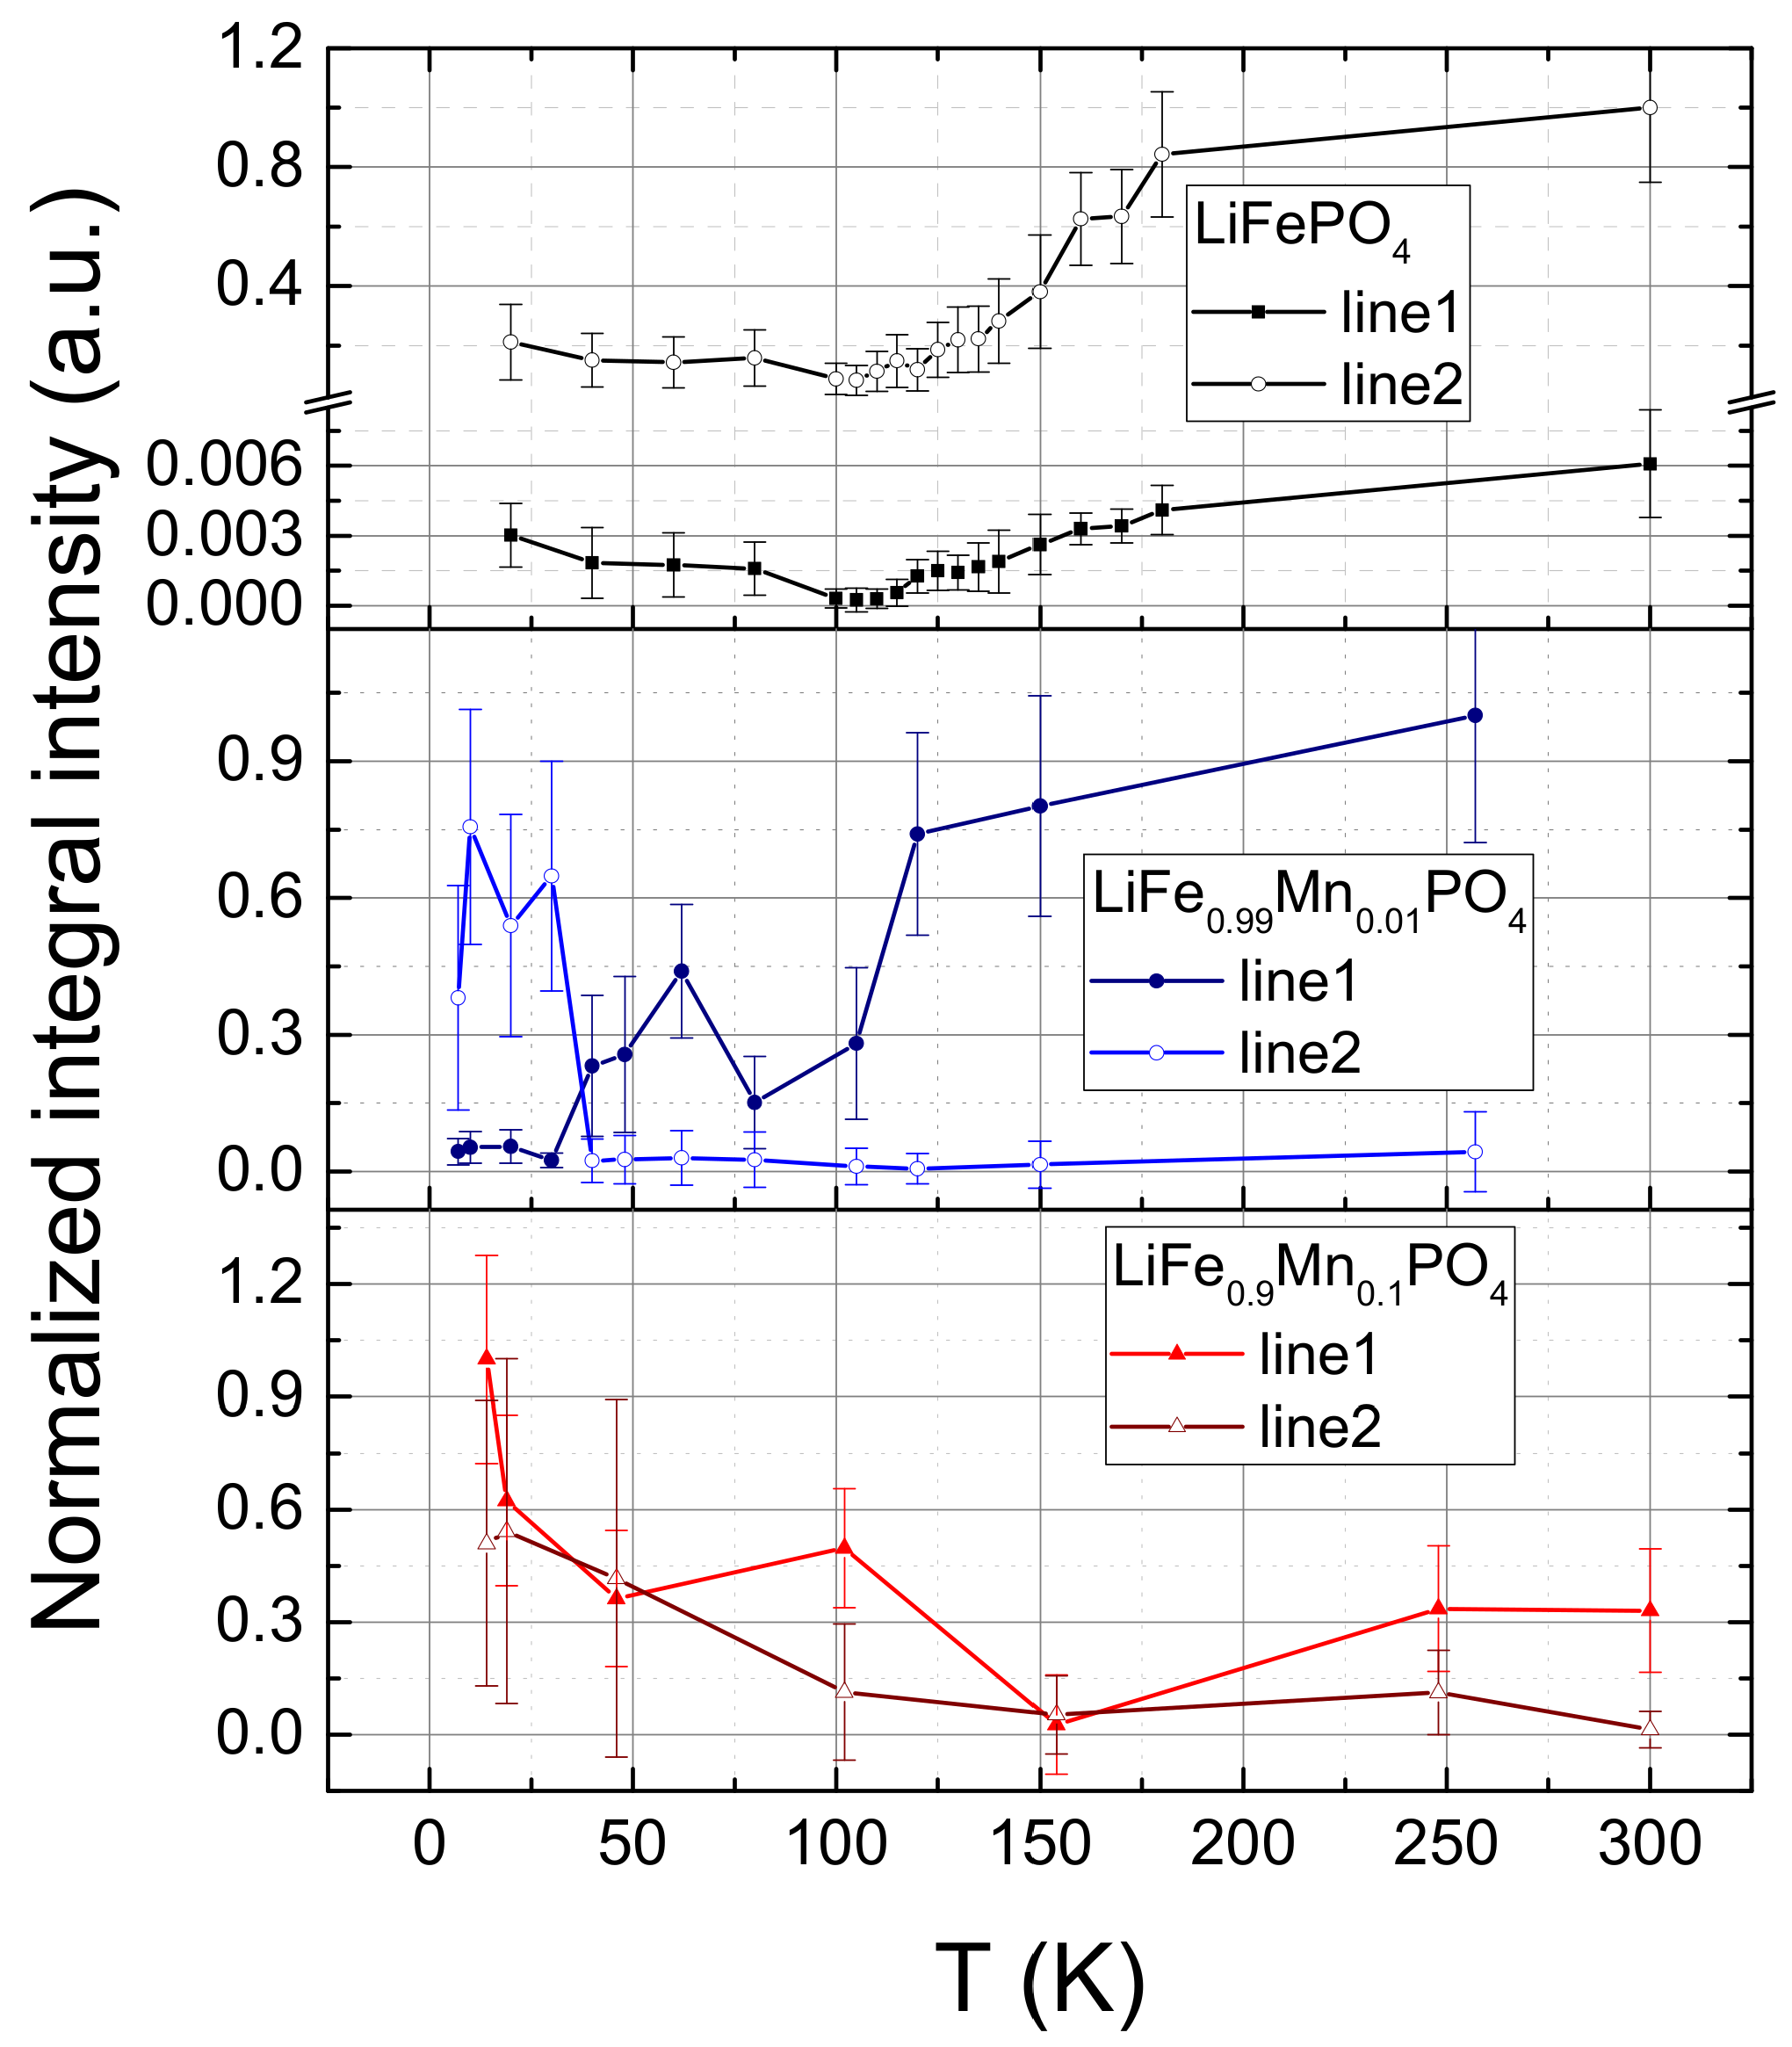
The decomposition details of the magnetic resonance spectra are given in Figure 3, Figure 4 and Figure 5 for LiFe1−xMnxPO4 with x = 0, 0.01 and 0.1, respectively. Temperature dependencies of the ESR spectra parameters (g-factors, linewidth ΔH, and normalized integral intensity I) are shown in Figure 6, Figure 7 and Figure 8, respectively; g-factors were obtained as g = hν/μB·Hres (ν—X-band frequency, μB—Bohr magneton, H0—resonance field). The normalized integral intensity was obtained as the integral intensity I = A∙ΔH2 (A—signal amplitude, ΔH—ESR linewidth) divided by the maximum value of the two lines Imax in order to compare the integrated intensities of the two components of the ESR spectrum with one another. It should be noted that, due to the large values of the ESR linewidth, the spectra parameters can be determined with an error: each ESR spectrum was fitted by several algorithms and using several sets of initial ESR parameters. As a result, several sets (3–5) of ESR parameters were obtained for the same spectrum, which correlated with one another qualitatively and had some quantitative dispersion. The average values of the ESR parameters are shown in Figure 6, Figure 7 and Figure 8 together with an error that was obtained as the standard deviation from the mean.

3. Discussion

It is necessary to start with a discussion of the nature of the ESR signals in the investigated samples. In the case of the ideal stoichiometry of LiFePO4, all iron ions should have the Fe2+ valence state and the electronic configuration 3d6 (5D, L = 2, S = 2). In an octahedral field, the ground orbital state of Fe2+ is a triplet Γ5 if the 3d6 configuration is considered as one electron over a half-filled shell. Due to the spin-orbit coupling, the orbital triplet is fivefold spin-degenerated, and it splits in the triplet, quintet, and septet. The triplet is the lowest level, and its wave functions are a mixture of the eigenfunctions for the orbital moment and spin moment [25]. The absence of the fine structure of Fe2+ ions in the ESR spectra of LiFe1−xMnxPO4 (x = 0, 0.01, 0.1) can be associated with the presence of exchange interactions between the spins of iron ions. Exchange interactions between the magnetic ions in such magnetically concentrated compounds leads to the merging of the fine structure lines into a single exchange-narrowed absorption line [25].
Experimentally, the ESR spectrum of Fe2+ ions is difficult to detect, and it was observed in the diluted MgO: Fe2+ system [26], where the magnesium oxide has a face-centered cubic structure and each magnesium (iron) atom is located in the octahedral oxygen environment. It was shown that the ground triplet gives rise to a first-order Zeeman splitting in an external magnetic field, and the electron spin resonance spectrum of Fe2+ in MgO consists of the narrow resonance line (g-factor g = 3.428 and linewidth ΔH = 10 Oe) and broad resonance line (ΔH = 450 Oe) with the same g-factor value. It was suggested that the broad resonance line in MgO: Fe2+ is the result of the aggregation of iron ions in certain areas of the crystal that leads to the dipolar broadening of this line. The random distortions of the crystal structure in the vicinity of Fe2+ ions should also be taken into account [27]. The recent study of the LiMnPO4 and LiFePO4 systems by means of the ESR method enabled the detection of the resonance spectrum of Mn2+ ions, while the resonance signal from Fe2+ was not registered. The absence of the ESR signal from Fe2+ in LiFePO4 is associated with the short relaxation times of iron ions, leading to the extreme broadening of the line [28].
Here, we suggest that we managed to observe the ESR signal due to divalent iron ions in the octahedral oxygen environment in all investigated samples. This signal is marked as line 2 in Figure 3, Figure 4, Figure 5, Figure 6, Figure 7 and Figure 8 and has a g-factor of approximately 3.5 or higher (Figure 6). Because the LiFe1−xMnxPO4 (x = 0, 0.01, 0.1) systems investigated here are magnetically concentrated systems, the ESR absorption linewidth is predominantly determined by the dipole–dipole and the exchange interactions between the magnetic ions. The broadening of the ESR absorption lines by dipolar interaction ΔHdd was calculated using the method of moments [29] and can be estimated using the expression:
Δ H d d 2 = 3 5 g 2 β 2 S S + 1 k = 1 N 1 r k 6
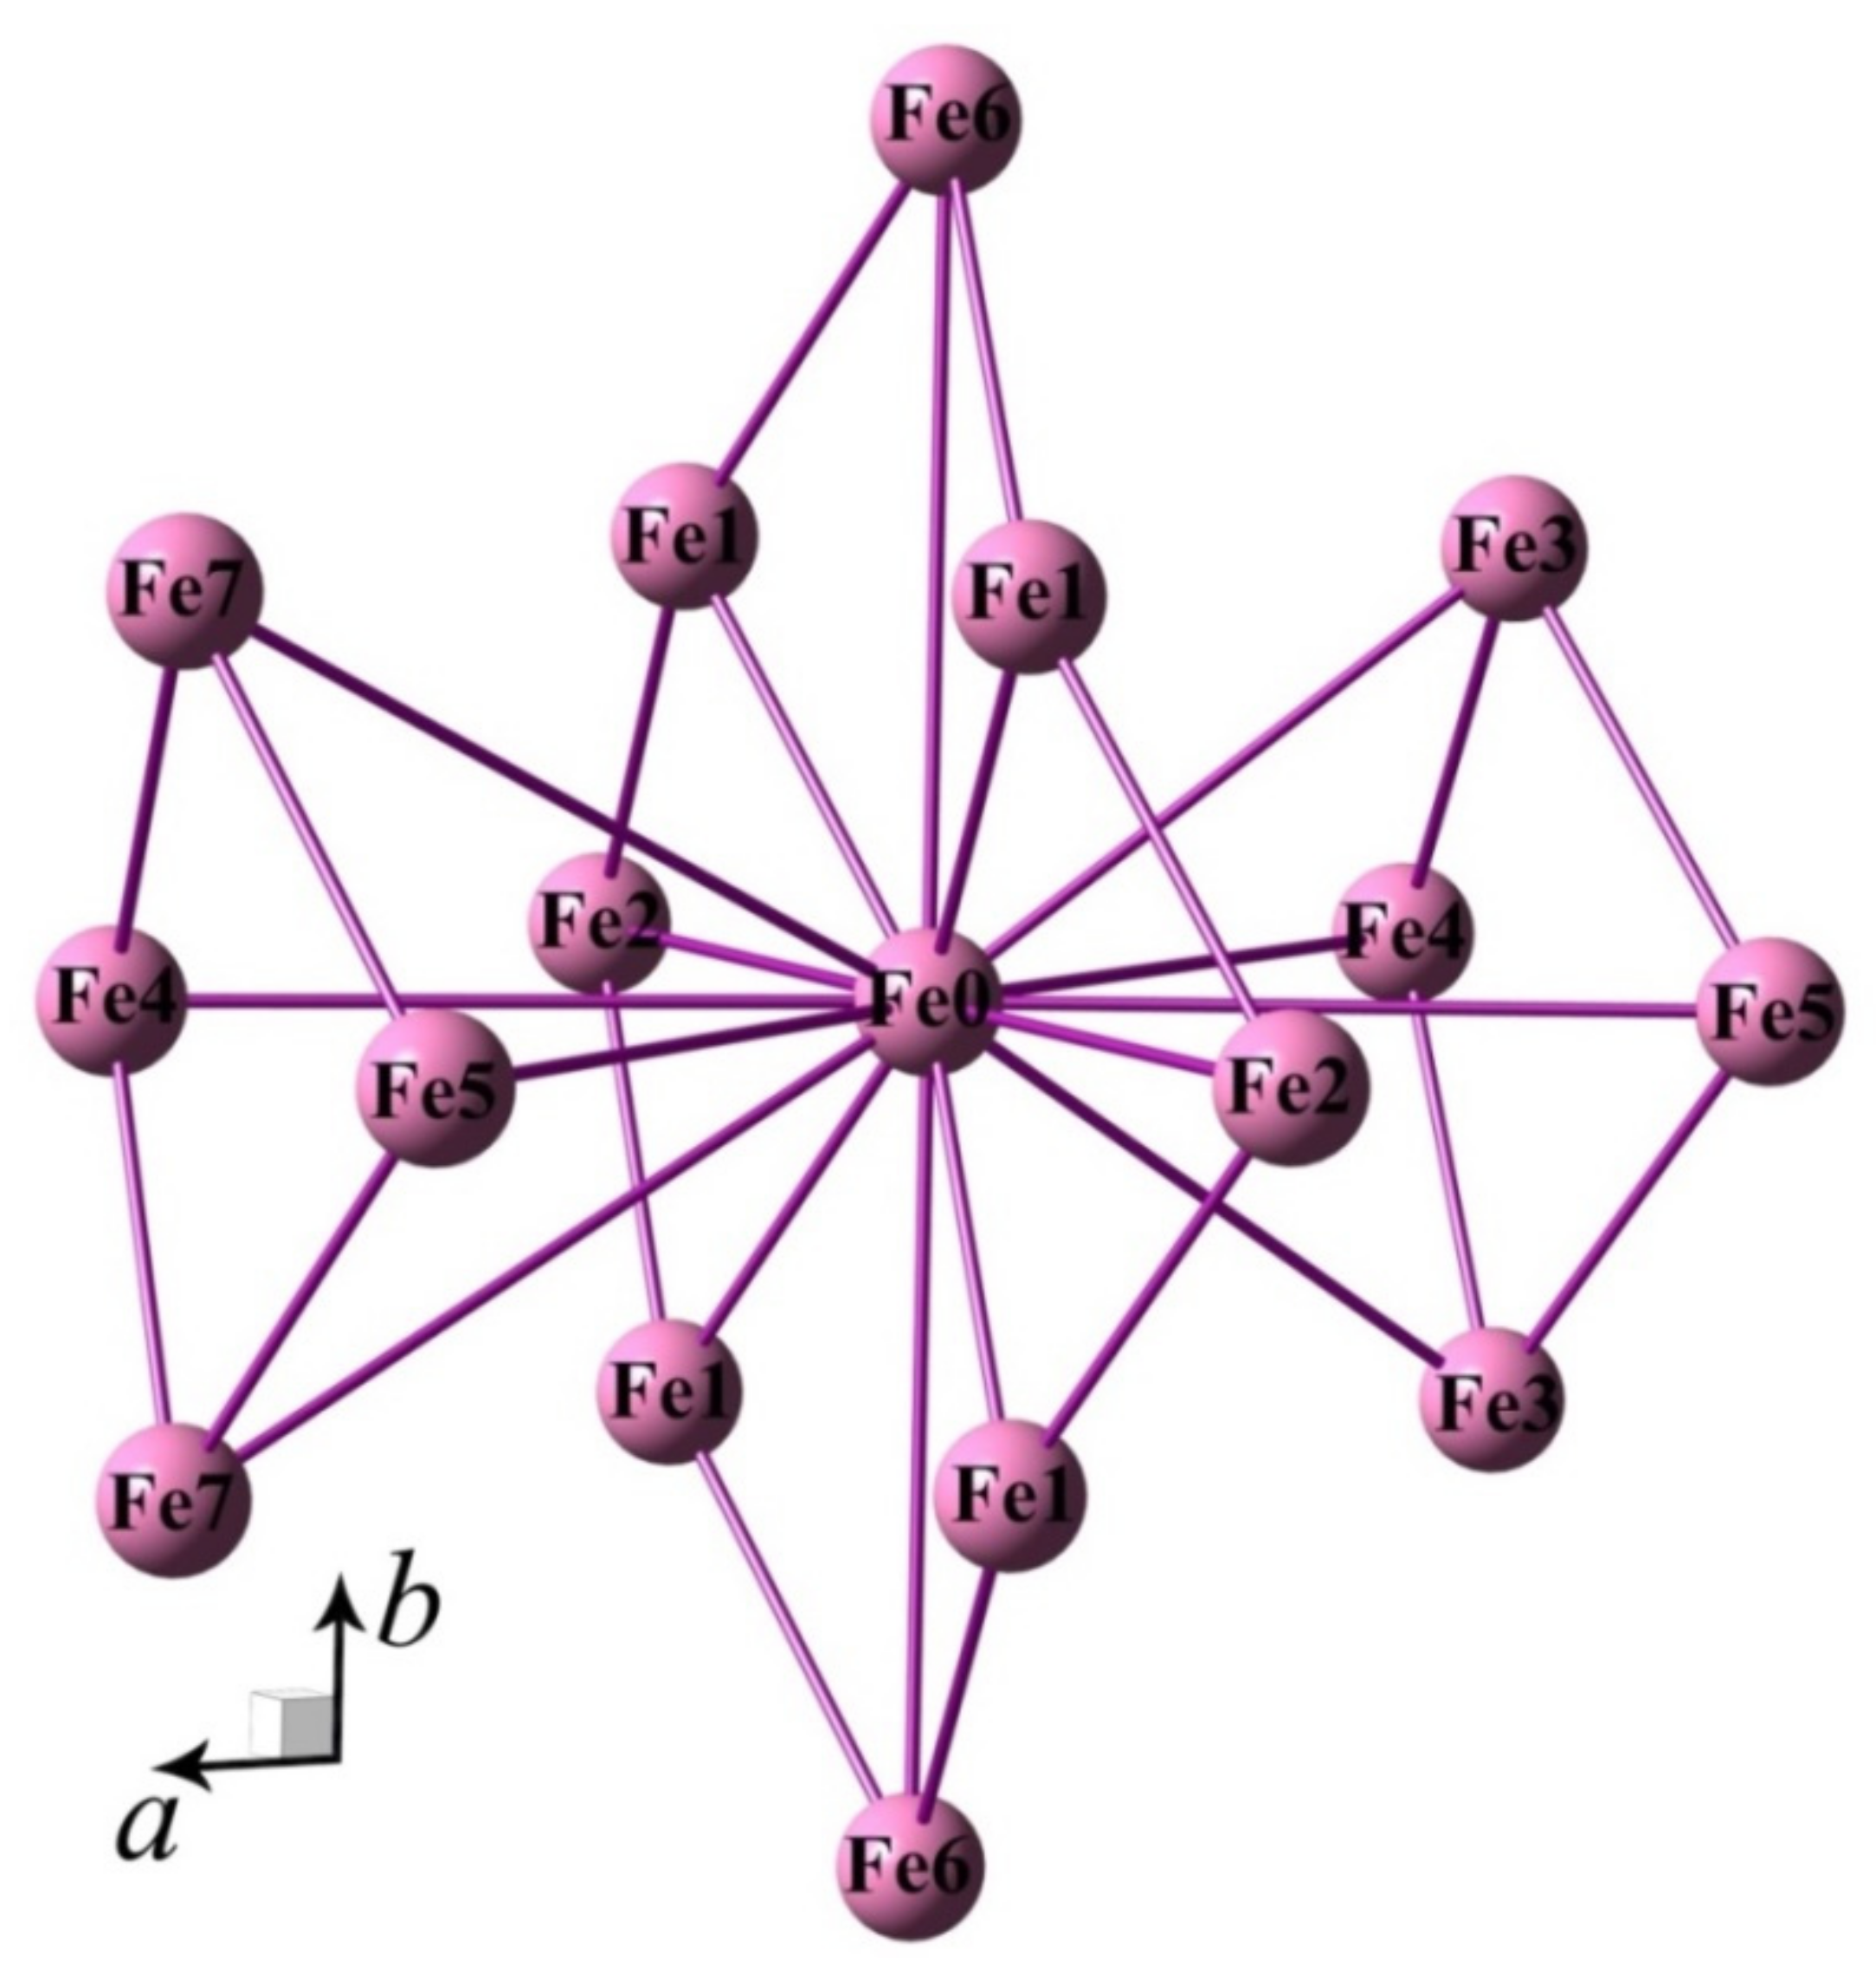
where g is the g-factor of the magnetic ion, β is the Bohr magneton, S is the spin of the magnetic ion, N is the number of the nearest neighboring magnetic ions, and rk is the distance between the nearest neighboring magnetic ions. It is known from the literature [8,30,31] that the crystal structure of LiFePO4 is orthorhombic and belongs to the Pnma space group (No. 62). The lattice parameters are a = 10.35 Å, b = 6.01 Å, and c = 4.67 Å, the number of nearest neighboring Fe2+ ions is N = 16, and the distance between the magnetic ions varies between 3.863 Å and 6.571 Å (Figure 9). Thus, at room temperature, for g ≈ 3.5 (Figure 6) and S = 2 (Fe2+, 3d6), the estimation using Equation (2) gives the linewidth value due to the dipole–dipole interaction ΔHdd ≈ 2510 Oe. One could expect the slight decrease in the ΔHdd value, due to the decrease in the spin value S in Equation (1), if the Fe2+ ions are not in the high-spin state (S = 1). We can see that the estimated ΔHdd is of the same order of magnitude as the experimental values for the initial LiFePO4 (Figure 7); thus, there is no strong exchange interaction which can lead to the exchange-narrowing of the ESR line, as was observed in the case of the other cathode material, Na3V2(PO4)3 [32]. At the same time, the estimated ΔHdd is higher than the experimental values for the LiFe1−xMnxPO4 (x = 0.01, 0.1) samples (Figure 7); thus, the exchange interaction occurs and leads to the exchange-narrowing of the ESR line. The value of the exchange interaction can be estimated using the formula [33]:
Δ H = Δ H d d 2 H e x
where ΔH is the experimentally observed linewidth and Hex is the exchange field. Taking into account the estimated value of ΔHdd ≈ 2510 Oe and the average value of the experimentally observed linewidth ΔH ≈ 1200 Oe, one can obtain the exchange field value at room temperature Hex ≈ 5.3 kOe, which gives the exchange integral value J ~ μBHex/kB ≈ 0.4 K, where μB and kB are the Bohr magneton and the Boltzmann constant, respectively.
As regards the origin of the second line (line 1 in Figure 3, Figure 4, Figure 5, Figure 6, Figure 7 and Figure 8), it is known from the literature that the single isotropic resonance line with g = 2.245 was detected in the ZnS: Fe2+ system, where the Fe2+ ions are located in the tetrahedral environment [26]. The experimentally observed g-factor for line 1 is close to g = 2.245; thus, one can suggest that the Fe ions can interchange with phosphorus ions and take their place in the PO4 tetrahedron. However, it is more likely that this signal is observed from the magnetically correlated regions that form around (i) the Fe3+ (3d5, S = 5/2) ions, which appear due to the lithium non-stoichiometry, or (ii) the Mn2+ (3d5, S = 5/2) ions in LiFe1−xMnxPO4 (x = 0.01, 0.1). The presence of iron-based superparamagnetic nanoparticles was previously evidenced in LiFePO4 using ESR and magnetization measurements [34]. The presence of Fe3+ ions and the random Mn distribution in LixFe1−yMnyPO4 during the initial stages of charging were evidenced using the Mössbauer spectroscopy measurements [19]. The lithium non-stoichiometry in another type of cathode material for lithium-ion batteries, leading to the appearance of mixed-valence magnetic ions, was previously detected using the ESR method [35,36].
As can be seen from Figure 1, Figure 2, Figure 3, Figure 4, Figure 5, Figure 6, Figure 7 and Figure 8, the doping with manganese ions has significant effects on the ESR line shape and the temperature behavior of the ESR parameters, especially integral intensity. From Figure 1, one can see that the spectrum becomes well resolved, and the two lines in the ESR spectrum can be clearly observed with decreasing temperature from room temperature down to 100 K. Below this temperature, the linewidth increases significantly when approaching the phase transition temperature [37,38,39]. It is known that LiFePO4 transforms into a collinear antiferromagnetic ground state below TN = 50−52 K [28,31,34], while FePO4 undergoes the antiferromagnetic order at Néel temperature TN = 125 K [31,34]. One can suggest that magnetically correlated regions formed around Fe3+ have an ordering temperature close to that of FePO4; therefore, one can see a change in the temperature dependences of all ESR parameters near this temperature (Figure 6, Figure 7 and Figure 8). For the highest concentration of manganese in LiFe0.9Mn0.1PO4, one can observe the increase in the ESR signal intensity with decreasing temperature, whereas in the LiFe1−xMnxPO4 (x = 0, 0.01) samples, the opposite behavior was observed (Figure 1 and Figure 8). One can see that the introduction of manganese ions does not lead to the appearance of a third resonance signal in the ESR spectra, but it does change the magnitude and type of magnetic ordering in the magnetically correlated regions in the LiFe0.9Mn0.1PO4 samples compared to the others.

4. Conclusions

ESR measurements were performed on the polycrystalline submicron carbon-coated LiFe1−xMnxPO4 system. Two resonance signals were observed in all samples: (i) the ESR signal due to divalent iron ions in the octahedral oxygen environment, with the high value of the ESR linewidth due to the dipole–dipole interaction, and (ii) the ESR signal from the magnetically correlated regions formed near Fe3+. The introduction of manganese ions does not lead to the appearance of a third resonance signal in the ESR spectra. The temperature dependence character of the integral intensity of observed resonance lines changes significantly with increasing manganese concentration, indicating a change in the nature of the magnetic interactions in the LiFe1−xMnxPO4 systems. We suggest that the noticeable capacity loss which was observed in the LiFe1−xMnxPO4 systems when replacing iron ions with manganese ions can be explained by the random distribution of Mn ions and changes to the type of magnetic ordering in these systems, despite the attractiveness of the electrochemical Mn2+/Mn3+ pair compared with Fe+2/Fe+3. At the same time, we do not exclude the possibility that, with an increase in the concentration of Mn ions, when the percolation channels, on the basis of the Mn2+/Mn3+ pairs, become essential, the electrochemical performance of such systems can be improved.

Author Contributions

Conceptualization, T.G., S.K. and N.S.; methodology, T.G., N.K. and N.S.; investigation, D.A. and A.Y.; writing—original draft preparation, T.G.; writing—review and editing, T.G., S.K. and N.S. All authors have read and agreed to the published version of the manuscript.

Funding

This research was funded by the financial support from the government assignment for the FRC Kazan Scientific Center of RAS.

Data Availability Statement

Not applicable.

Conflicts of Interest

The authors declare no conflict of interest. The funders had no role in the design of the study, the collection, analysis, or interpretation of data, the writing of the manuscript, or the decision to publish the results.

References

  1. Padhi, A.K.; Nanjundaswamy, K.S.; Goodenough, J.B. Phospho-olivines as positive-electrode materials for rechargeable lithium batteries. J. Electrochem. Soc. 1997, 144, 1188–1194. [Google Scholar] [CrossRef]
  2. Yamada, A.; Chung, S.C.; Hinokuma, K. Optimized LiFePO4 for Lithium Battery Cathodes. J. Electrochem. Soc. 2001, 148, A224–A229. [Google Scholar] [CrossRef]
  3. Huang, H.; Yin, S.-C.; Nazarz, L.F. Approaching Theoretical Capacity of LiFePO4 at Room Temperature at High Rates. Electrochem. Solid-State Lett. 2001, 4, A170–A172. [Google Scholar] [CrossRef]
  4. Yuan, L.X.; Wang, Z.H.; Zhang, W.X.; Hu, X.L.; Chen, J.T.; Huang, Y.H.; Goodenough, J.B. Development and challenges of LiFePO4 cathode material for lithium-ion batteries. Energy Environ. Sci. 2011, 4, 269–284. [Google Scholar] [CrossRef]
  5. Zhu, S.; Huang, A.; Xu, Y. Improving Methods for better Performance of Commercial LiFePO4/C Batteries. Int. J. Electrochem. Sci. 2021, 16, 210564. [Google Scholar] [CrossRef]
  6. Zhao, Q.; Zhang, S.; Hu, M.; Wang, C.; Jiang, G. Recent Advances in LiFePO4 Cathode Materials for Lithium-Ion Batteries. First-Principles Research. Int. J. Electrochem. Sci. 2021, 16, 211226. [Google Scholar] [CrossRef]
  7. Hebert, A.; McCalla, E. The role of metal substitutions in the development of Li batteries, part I: Cathodes. Mater. Adv. 2021, 2, 3474–3518. [Google Scholar] [CrossRef]
  8. Islam, M.S.; Driscoll, D.J.; Fisher, C.A.J.; Slater, P.R. Atomic-Scale Investigation of Defects, Dopants, and Lithium Transport in the LiFePO4 Olivine-Type Battery Material. Chem. Mater. 2005, 17, 5085–5092. [Google Scholar] [CrossRef]
  9. Deng, Y.; Yang, C.; Zou, K.; Qin, X.; Zhao, Z.; Chen, G. Recent Advances of Mn-Rich LiFe1−yMnyPO4 (0.5 ≤ y <1.0) Cathode Materials for High Energy Density Lithium Ion Batteries. Adv. Energy Mater. 2017, 7, 1601958. [Google Scholar] [CrossRef]
  10. Bograchev, D.A.; Volfkovich, Y.M.; Sosenkin, V.E.; Podgornova, O.A.; Kosova, N.V. The Influence of Porous Structure on the Electrochemical Properties of LiFe0.5Mn0.5PO4 Cathode Material Prepared by Mechanochemically Assisted Solid-State Synthesis. Energies 2020, 13, 542. [Google Scholar] [CrossRef] [Green Version]
  11. Hagen, R.V.; Lorrmann, H.; Möller, K.-C.; Mathur, S. Electrospun LiFe1−yMnyPO4/C Nanofiber Composites as Self-Supporting Cathodes in Li-Ion Batteries. Adv. Energy Mater. 2012, 2, 553–559. [Google Scholar] [CrossRef]
  12. Kosova, N.V.; Podgornova, O.A.; Volfkovich, Y.M.; Sosenkin, V.E. Optimization of the cathode porosity via mechanochemical synthesis with carbon black. J. Solid State Electrochem. 2021, 25, 1029–1037. [Google Scholar] [CrossRef]
  13. Kosova, N.V.; Podgornova, O.A.; Gutakovskii, A.K. Different electrochemical responses of LiFe0.5Mn0.5PO4 prepared by mechanochemical and solvothermal methods. J. Alloys Compd. 2018, 742, 454–465. [Google Scholar] [CrossRef]
  14. Liu, L.; Cao, Z.; Cui, Y.; Ke, X.; Zeng, G.; Liu, J.; Liu, D.; Li, Q.; Lai, J.; Shi, Z.; et al. Nanocomposites LiMnxFe1−xPO4/C synthesized via freeze drying assisted sol-gel routine and their magnetic and electrochemical properties. J. Alloys Compd. 2019, 779, 339–346. [Google Scholar] [CrossRef]
  15. Liu, L.; Chen, G.; Du, B.; Cui, Y.; Ke, X.; Liu, J.; Guo, Z.; Shi, Z.; Zhang, H.; Chou, S. Nano-sized cathode material LiMn0.5Fe0.5PO4/C synthesized via improved sol-gel routine and its magnetic and electrochemical properties. Electrochim. Acta 2017, 255, 205–211. [Google Scholar] [CrossRef]
  16. Shen, H.; Xiang, W.; Shi, X.; Zhong, B.; Liu, H. Hierarchical LiMn0.5Fe0.5PO4/C nanorods with excellent electrochemical performance synthesized by rheological phase method as cathode for lithium ion battery. Ionics 2016, 22, 193–200. [Google Scholar] [CrossRef]
  17. Huang, W.; Tao, S.; Zhou, J.; Si, C.; Chen, X.; Huang, W.; Jin, C.; Chu, W.; Song, L.; Wu, Z. Phase Separations in LiFe1−xMnxPO4: A Random Stack Model for Efficient Cathode Materials. J. Phys. Chem. C 2014, 118, 796–803. [Google Scholar] [CrossRef]
  18. Phan, A.T.; Gheribi, A.E.; Chartrand, P. Coherent and para-equilibrium phase transformations in Mn-doped-LiFePO4 cathode materials: Implications for lithium ion battery performances. J. Alloys Compd. 2020, 838, 155550. [Google Scholar] [CrossRef]
  19. Novikova, S.; Yaroslavtsev, S.; Rusakov, V.; Chekannikov, A.; Kulova, T.; Skundin, A.; Yaroslavtsev, A. Behavior of LiFe1-yMnyPO4/C cathode materials upon electrochemical lithium intercalation/deintercalation. J. Power Sources 2015, 300, 444–452. [Google Scholar] [CrossRef]
  20. Kosova, N.V.; Devyatkina, E.T.; Slobodyuk, A.B.; Petrov, S.A. Submicron LiFe1−yMnyPO4 solid solutions prepared by mechanochemically assisted carbothermal reduction: The structure and properties. Electrochim. Acta 2012, 59, 404–411. [Google Scholar] [CrossRef]
  21. Kosova, N.V.; Devyatkina, E.T.; Petrov, S.A. Fast and Low Cost Synthesis of LiFePO4 Using Fe3+ Precursor. J. Electrochem. Soc. 2010, 157, A1247–A1252. [Google Scholar] [CrossRef]
  22. Joshi, J.P.; Bhat, S.V. On the analysis of broad Dysonian electron paramagnetic resonance spectra. J. Magn. Reson. 2004, 168, 284–287. [Google Scholar] [CrossRef] [PubMed]
  23. Bykov, E.O.; Gavrilova, T.P.; Yatsyk, I.V.; Gilmutdinov, I.F.; Parfenov, V.V.; Kurbakov, A.I.; Eremina, R.M. Structural and magnetic properties of Yb1−xSrxMnO3. Ceram. Int. 2019, 45, 10286–10294. [Google Scholar] [CrossRef]
  24. Nigmatullina, I.I.; Parfenov, V.V.; Eremina, R.M.; Gavrilova, T.P.; Yatsyk, I.V. ESR and Mössbauer Spectroscopic Study of Sr-Doped Ytterbium Ferromanganites. Phys. Solid State 2018, 60, 936–942. [Google Scholar] [CrossRef]
  25. Abragam, A.; Bleaney, B. Electron Paramagnetic Resonance of Transition Ions; Oxford University Press: Oxford, UK, 1970; Mir: Moscow, Russia, 1972; Volume 1. [Google Scholar]
  26. Low, W.; Weger, M. Paramagnetic Resonance and Optical Spectra of Divalent Iron in Cubic Fields. II. Experimental Results. Phys. Rev. 1960, 118, 1130–1136. [Google Scholar] [CrossRef]
  27. Low, W.; Weger, M. Paramagnetic Resonance and Optical Spectra of Divalent Iron in Cubic Fields. I. Theory. Phys. Rev. 1960, 118, 1119–1130. [Google Scholar] [CrossRef]
  28. Arčon, D.; Zorko, A.; Dominko, R.; Jagličič, Z. A comparative study of magnetic properties of LiFePO4 and LiMnPO4. J. Phys. Condens. Matter 2004, 16, 5531–5548. [Google Scholar] [CrossRef]
  29. Van Vleck, J.H. The Dipolar Broadening of Magnetic Resonance Lines in Crystals. Phys. Rev. 1948, 74, 1168–1183. [Google Scholar] [CrossRef]
  30. Andersson, A.S.; Kalska, B.; Häggström, L.; Thomas, J.O. Lithium extraction/insertion in LiFePO: An X-ray diffraction and Mössbauer spectroscopy study. Solid State Ion. 2000, 130, 41–52. [Google Scholar] [CrossRef]
  31. Rousse, G.; Rodriguez-Carvajal, J.; Patoux, S.; Masquelier, C. Magnetic Structures of the Triphylite LiFePO4 and of Its Delithiated Form FePO4. Chem. Mater. 2003, 15, 4082–4090. [Google Scholar] [CrossRef]
  32. Nizamov, F.A.; Togulev, P.N.; Abdullin, D.R.; Khantimerov, S.M.; Balaya, P.; Suleimanov, N.M. Antisite Defects and Valence State of Vanadium in Na3V2(PO4)3. Phys. Solid State 2016, 58, 475–480. [Google Scholar] [CrossRef]
  33. Anderson, P.W.; Weiss, P.R. Exchange Narrowing in Paramagnetic Resonance. Rev. Mod. Phys. 1953, 25, 269–276. [Google Scholar] [CrossRef]
  34. Ait-Salah, A.; Dodd, J.; Mauger, A.; Yazamib, R.; Gendron, F.; Julien, C.M. Structural and Magnetic Properties of LiFePO4 and Lithium Extraction Effects. Z. Anorg. Allg. Chem. 2006, 632, 1598–1605. [Google Scholar] [CrossRef]
  35. Gavrilova, T.; Khantimerov, S.; Cherosov, M.; Batulin, R.; Lyadov, N.; Yatsyk, I.; Deeva, Y.; Turkin, D.; Chupakhina, T.; Suleimanov, N. Magnetic properties of Li3V2(PO4)3/Li3PO4 composite. Magnetochemistry 2021, 7, 64. [Google Scholar] [CrossRef]
  36. Gavrilova, T.P.; Khantimerov, S.M.; Fatykhov, R.R.; Yatsyk, I.V.; Cherosov, M.A.; Lee, H.S.; Vishwanathan, R.; Saravanan, K.; Suleimanov, N.M. Magnetic properties and vanadium oxidation state in α-Li3V2(PO4)3/C composite: Magnetization and ESR measurements. Solid State Commun. 2021, 323, 114108. [Google Scholar] [CrossRef]
  37. Deisenhofer, J.; Eremina, R.M.; Pimenov, A.; Gavrilova, T.; Berger, H.; Johnsson, M.; Lemmens, P.; Krug von Nidda, H.-A.; Loidl, A.; Lee, K.-S.; et al. Structural and magnetic dimers in the spin-gapped system CuTe2O5. Phys. Rev. B 2006, 74, 174421. [Google Scholar] [CrossRef] [Green Version]
  38. Seidov, Z.; Gavrilova, T.P.; Eremina, R.M.; Svistov, L.E.; Bush, A.A.; Loidl, A.; Krug von Nidda, H.-A. Anisotropic exchange in LiCu2O2. Phys. Rev. B 2017, 95, 224411. [Google Scholar] [CrossRef] [Green Version]
  39. Gavrilova, T.P.; Yagfarova, A.R.; Deeva, Y.A.; Yatsyk, I.V.; Gilmutdinov, I.F.; Cherosov, M.A.; Vagizov, F.G.; Chupakhina, T.I.; Eremina, R.M. Iron oxidation state in La0.7Sr1.3Fe0.7Ti0.3O4 and La0.5Sr1.5Fe0.5Ti0.5O4 layered perovskites: Magnetic properties. J. Phys. Chem. Solids 2021, 153, 109994. [Google Scholar] [CrossRef]
Figure 1. Electron spin resonance spectra of LiFe1−xMnxPO4: (a) x = 0, (b) x = 0.01, and (c) x = 0.1 at different temperatures. The intensity of some experimental spectra was multiplied for clarity.
Magnetochemistry 08 00074 g001
Figure 2. ESR spectra of LiFe1−xMnxPO4 at the temperatures of (a) 300 K and (b) 50 K.
Magnetochemistry 08 00074 g002
Figure 3. Decomposition of the ESR spectra of LiFePO4 at different temperatures: (a) T = 300 K, (b) T = 125 K, and (c) T = 20 K.
Magnetochemistry 08 00074 g003
Figure 4. Decomposition of the ESR spectra of LiFe0.99Mn0.01PO4 at different temperatures: (a) T = 257 K, (b) T = 150 K, and (c) T = 40 K.
Magnetochemistry 08 00074 g004
Figure 5. Decomposition of the ESR spectra of LiFe0.9Mn0.1PO4 at different temperatures: (a) T = 300 K, (b) T = 102 K, and (c) T = 14 K.
Magnetochemistry 08 00074 g005
Figure 6. Temperature dependence of the g-factor of resonance signals in LiFe1−xMnxPO4 (x = 0, 0.01, 0.1).
Magnetochemistry 08 00074 g006
Figure 7. Temperature dependence of the ESR linewidth of resonance signals in LiFe1−xMnxPO4 (x = 0, 0.01, 0.1).
Magnetochemistry 08 00074 g007
Figure 8. Temperature dependence of the normalized integral intensity of resonance signals in LiFe1−xMnxPO4 (x = 0, 0.01, 0.1).
Magnetochemistry 08 00074 g008
Figure 9. Crystal structure of LiFePO4: nearest neighboring magnetic ions for Fe2+. Distances between the iron ions are: Fe0–Fe1 = 3.863 Å; Fe0–Fe2 = 4.67 Å; Fe0–Fe3 = 5.428 Å; Fe0–Fe4 = 5.575 Å; Fe0–Fe5 = 5.79 Å; Fe0–Fe6 = 6.01 Å; and Fe0–Fe7 = 6.571 Å.
Magnetochemistry 08 00074 g009
Publisher’s Note: MDPI stays neutral with regard to jurisdictional claims in published maps and institutional affiliations.