
Investigation of the Morphological Structure of Needle-Free Electrospun Magnetic Nanofiber Mats


Abstract
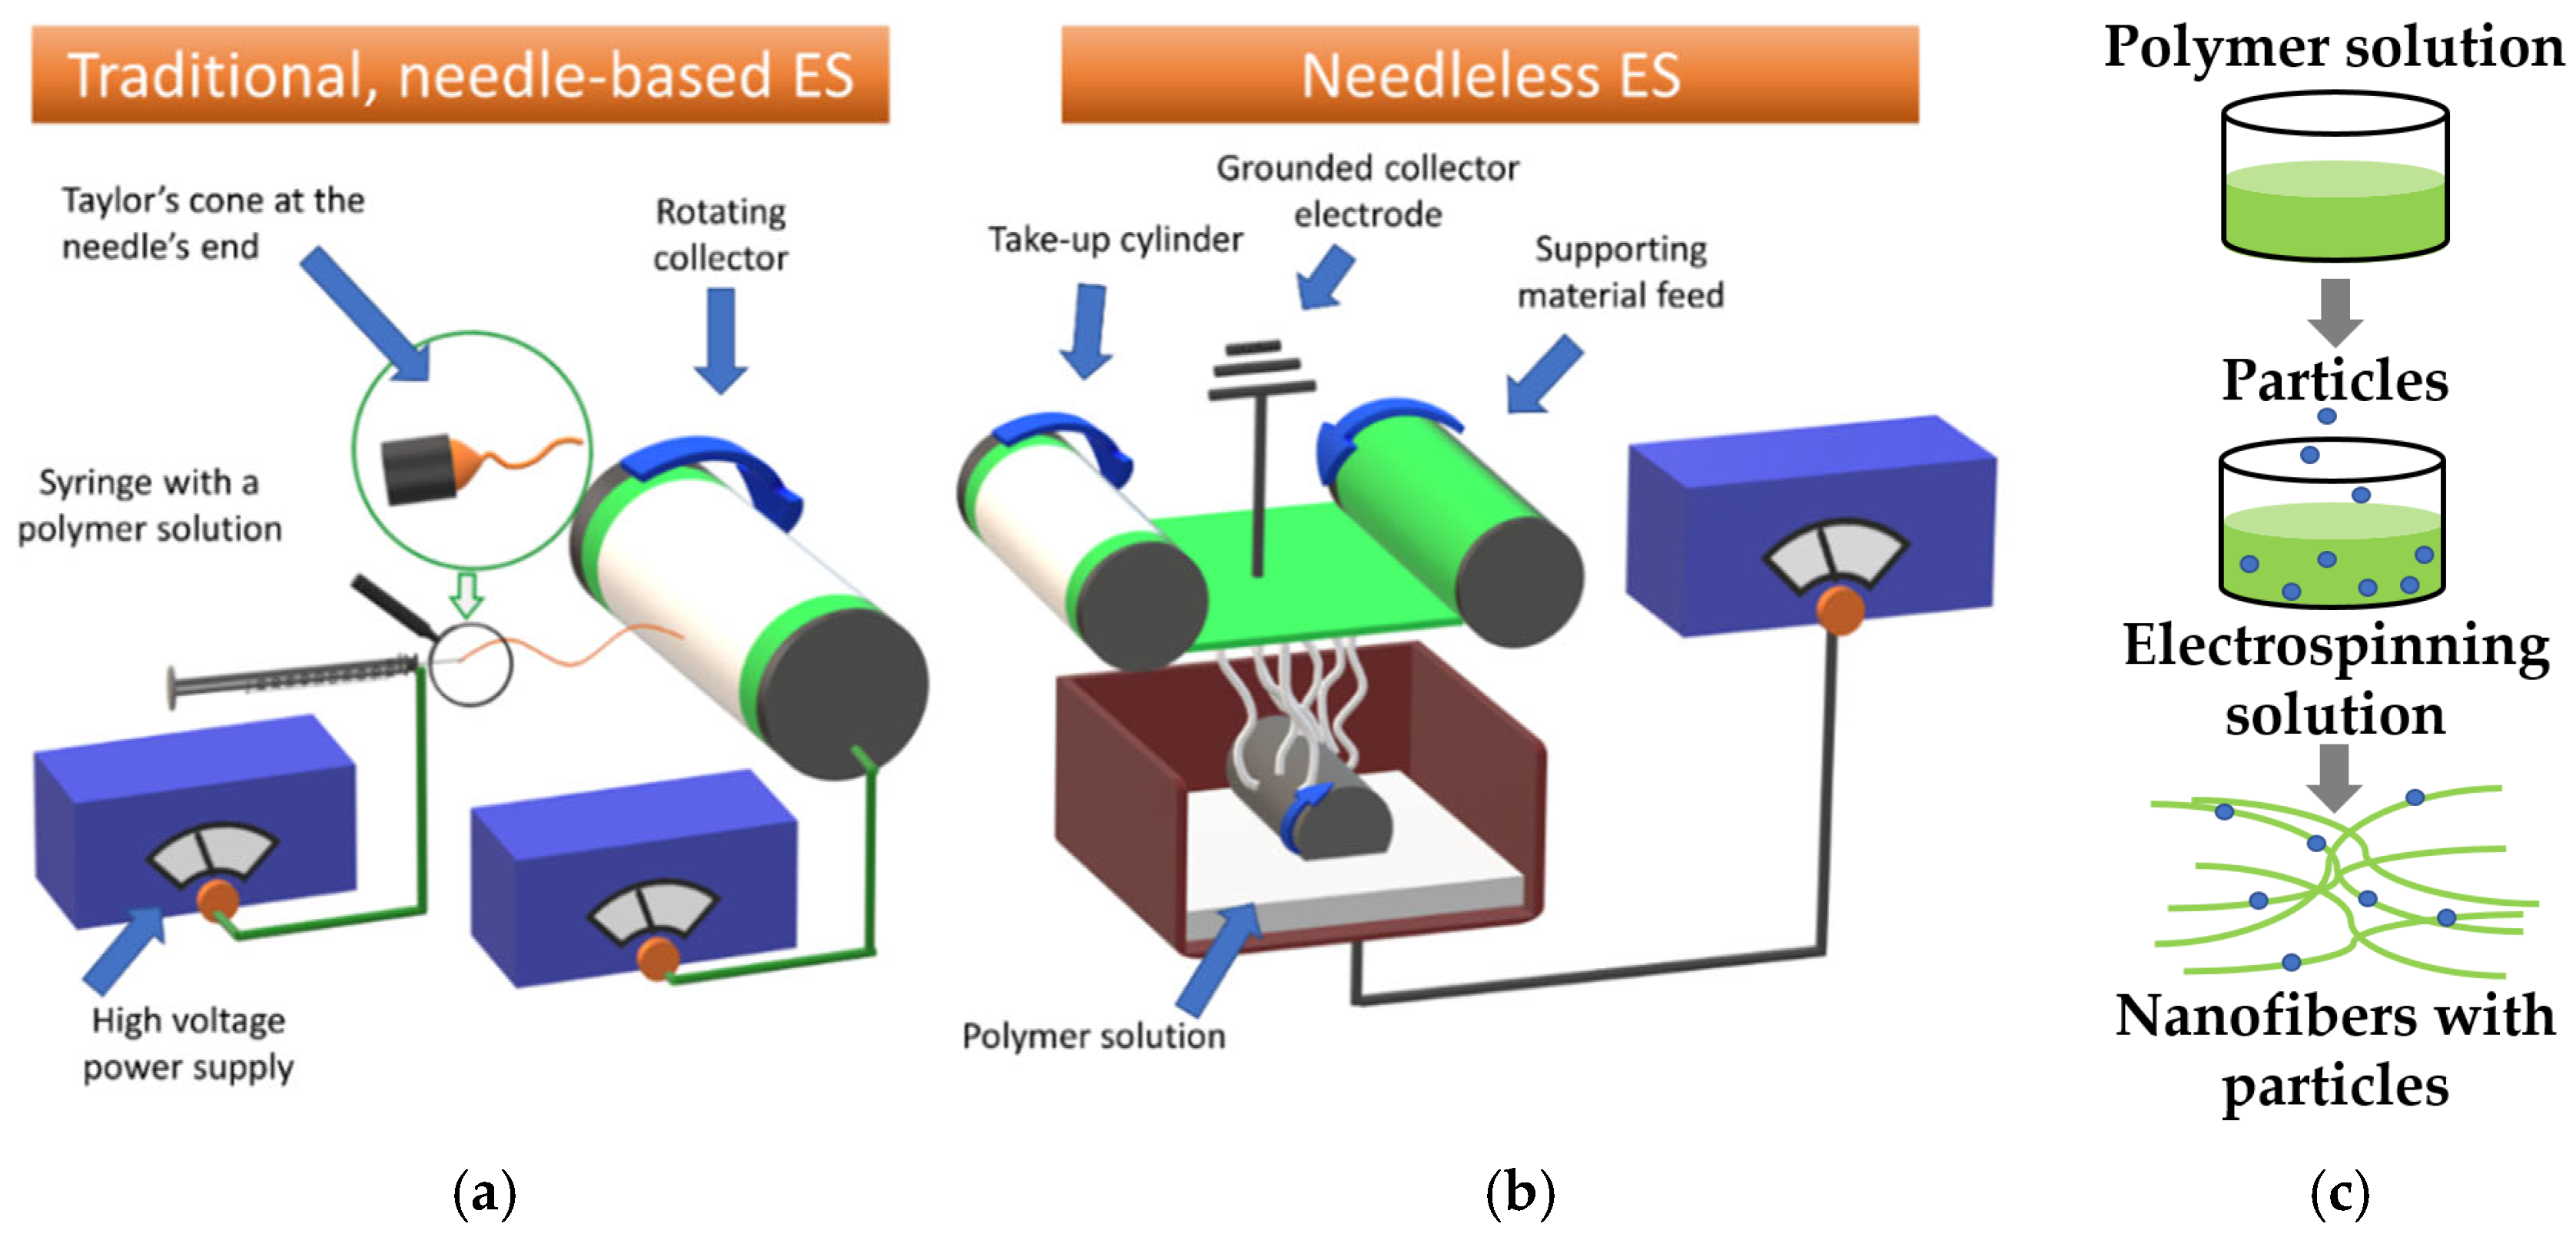
:1. Introduction
2. Materials and Methods
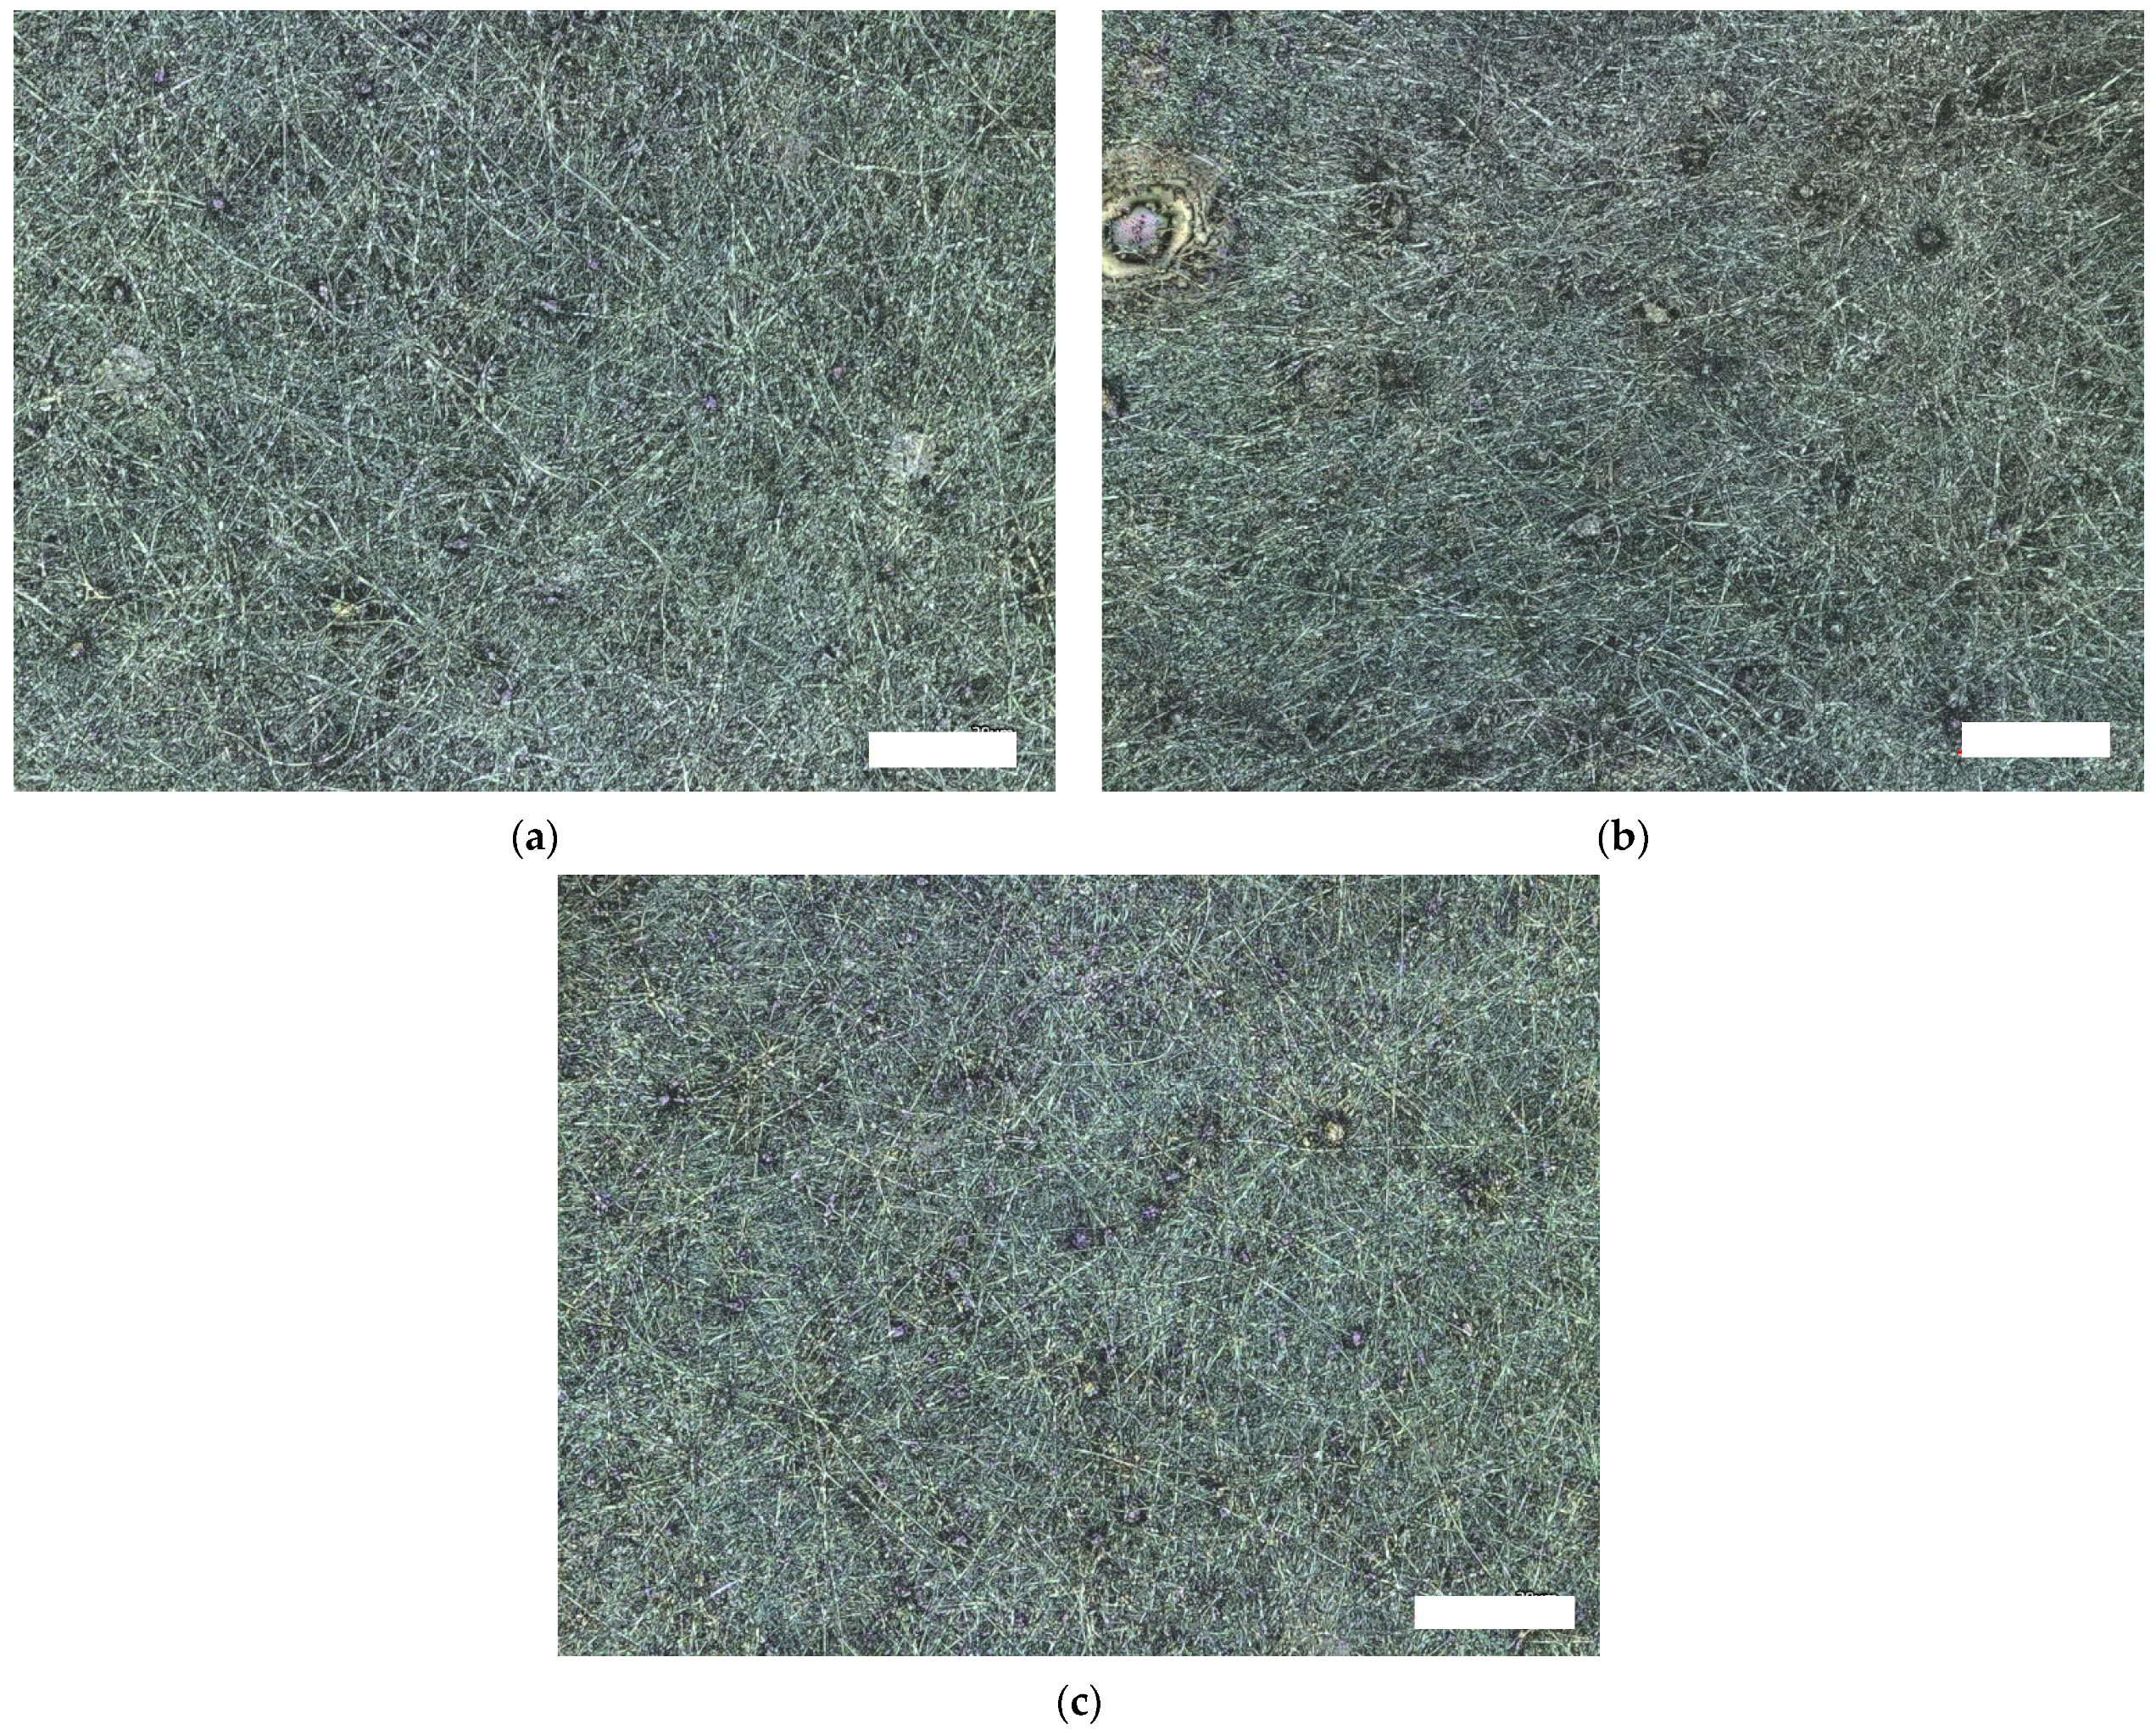
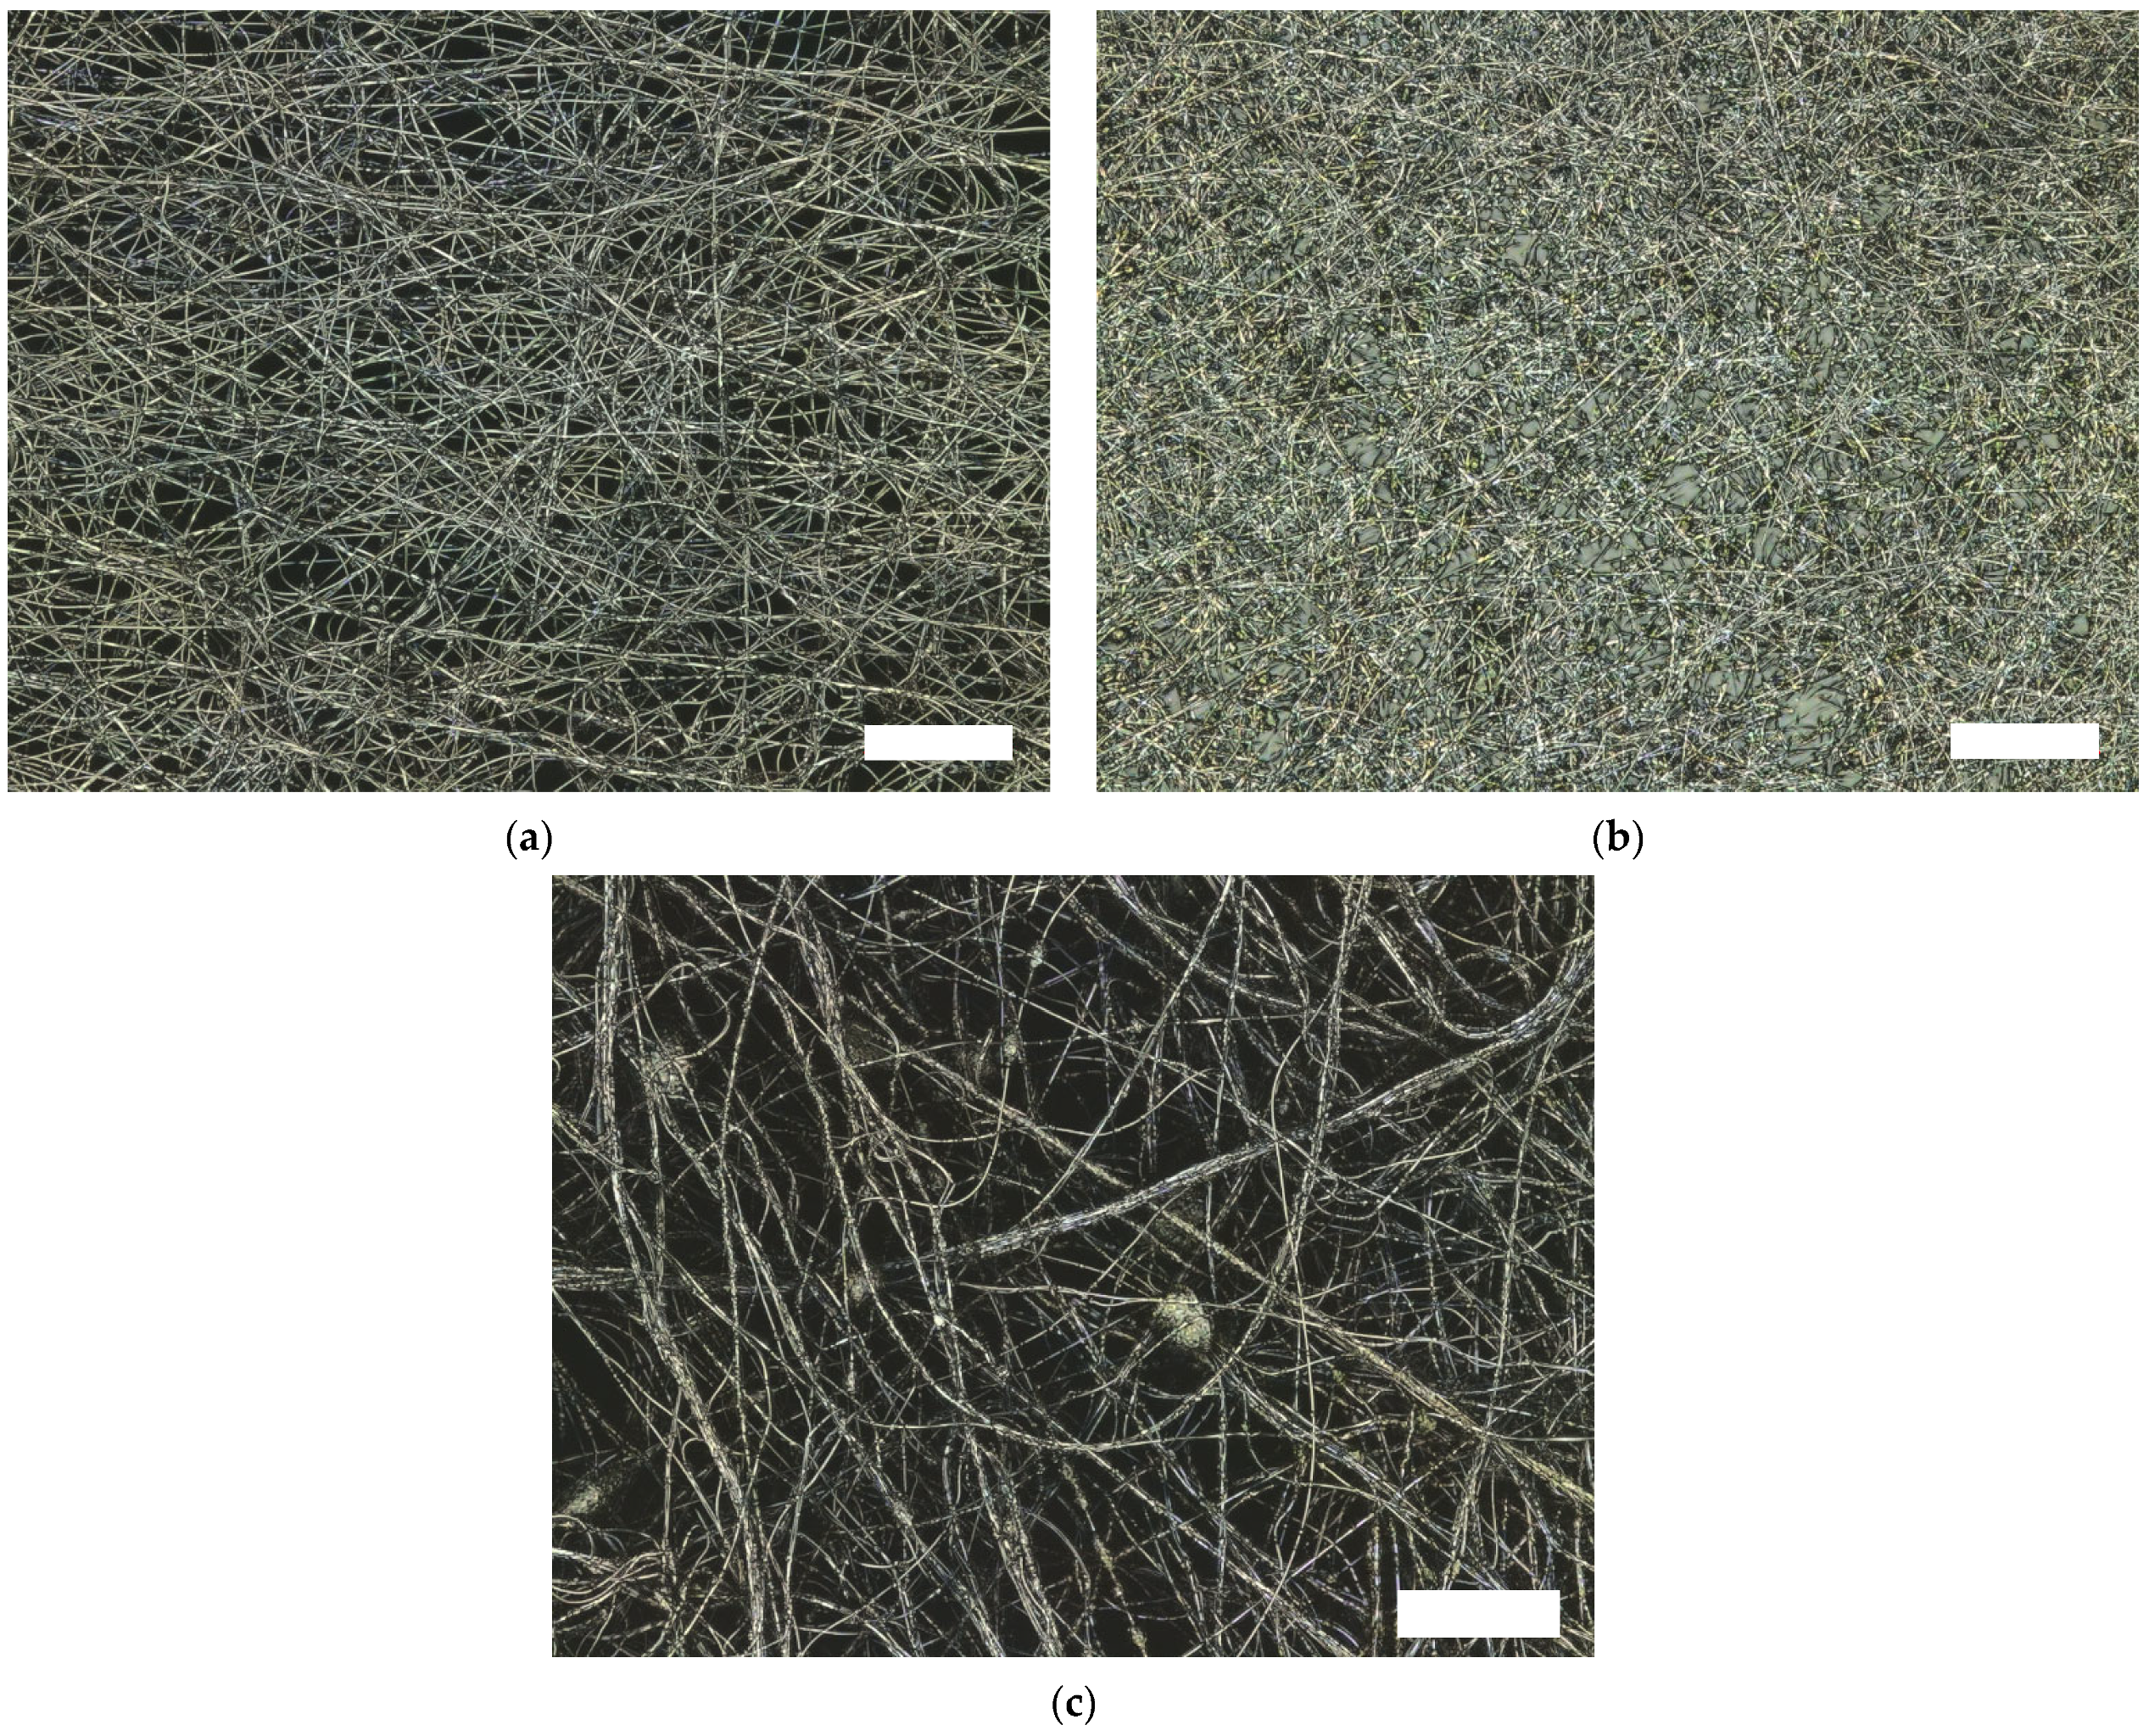
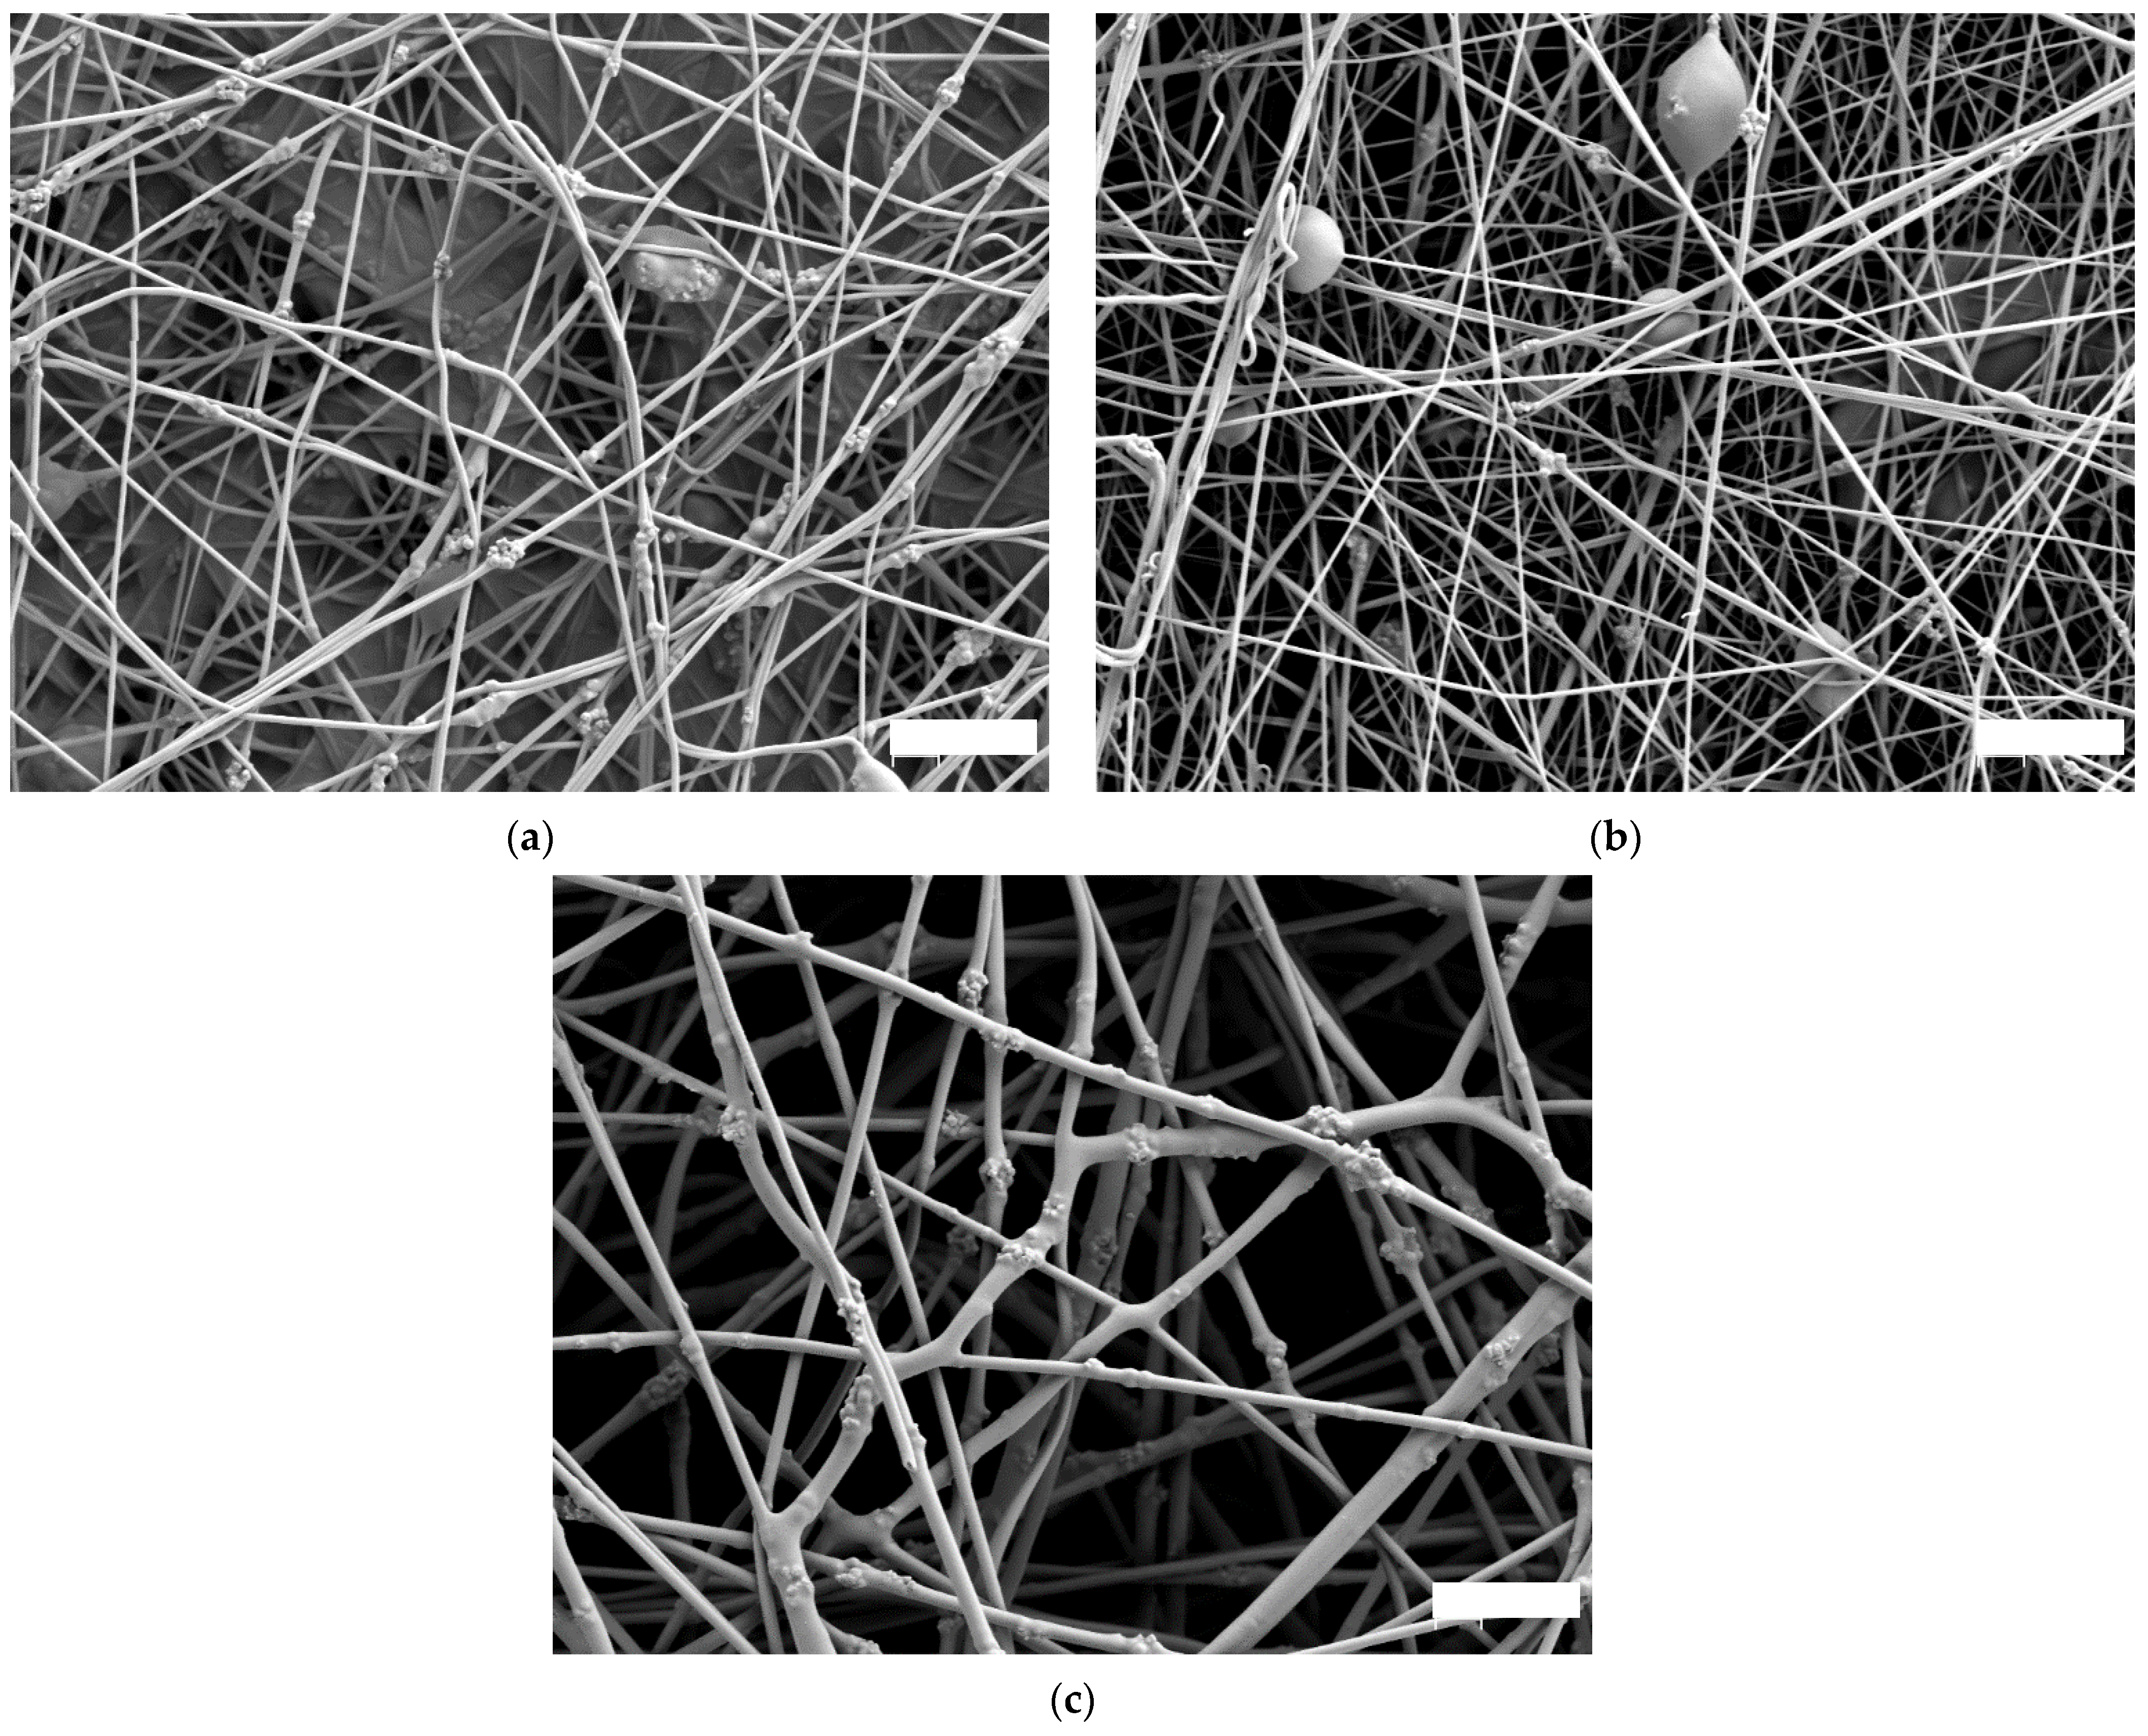
3. Results and Discussion
4. Conclusions
Author Contributions
Funding
Institutional Review Board Statement
Data Availability Statement
Conflicts of Interest
References
- Hellert, C.; Wortmann, M.; Frese, N.; Grötsch, G.; Cornelißen, C.; Ehrmann, A. Adhesion of Electrospun Poly(acrylonitrile) Nanofibers on Conductive and Isolating Foil Substrates. Coatings 2021, 11, 249. [Google Scholar] [CrossRef]
- Klinkhammer, K.; Seiler, N.; Grafahrend, D.; Gerardo-Nava, J.; Mey, J.; Brook, G.A.; Möller, M.; Dalton, P.D.; Klee, D. Deposition of electrospun fibers on reactive substrates for in vitro investigations. Tissue Eng. Part C Methods 2009, 15, 77–85. [Google Scholar] [CrossRef]
- Storck, J.L.; Hellert, C.; Brockhagen, B.; Wortmann, M.; Diestelhorst, E.; Frese, N.; Grothe, T.; Ehrmann, A. Metallic Supports Accelerate Carbonization and Improve Morphological Stability of Polyacrylonitrile Nanofibers during Heat Treatment. Materials 2021, 14, 4686. [Google Scholar] [CrossRef] [PubMed]
- Othman, C.F.E.; Yusof, N.; Hasbullah, H.; Jaafar, J.; Ismail, A.F.; Abdullah, N.; Nordin, N.A.H.S.M.; Aziz, F.; Salleh, W.N.W. Polyacrylonitrile/magnesium oxide-based activated carbon nanofibers with well-developed microporous structure and their adsorption performance for methane. J. Ind. Eng. Chem. 2017, 51, 281–287. [Google Scholar] [CrossRef]
- Trabelsi, M.; Mamun, A.; Klöcker, M.; Sabantina, L. Investigation of metallic nanoparticle distribution in PAN/magnetic nanocomposites fabricated with needleless electrospinning technique. Commun. Dev. Assem. Text. Prod. 2021, 2, 8–17. [Google Scholar] [CrossRef]
- Boyraz, E.; Yalcinkaya, F.; Hruza, J.; Maryska, J. Surface-modified nanofibrous PVDF membranes for liquid separation technology. Materials 2019, 12, 2702. [Google Scholar] [CrossRef] [Green Version]
- Kumar, T.S.M.; Kumar, K.S.; Rajini, N.; Siengchin, S.; Ayrilmis, N.; Rajulu, A.V. A comprehensive review of electrospun nanofibers: Food and packaging perspective. Compos. Part B Eng. 2019, 175, 107074. [Google Scholar] [CrossRef]
- Wehlage, D.; Blattner, H.; Mamun, A.; Kutzli, I.; Diestelhorst, E.; Rattenholl, A.; Gudermann, F.; Lütkemeyer, D.; Ehrmann, A. Cell growth on electrospun nanofiber mats from polyacrylonitrile (PAN) blends. AIMS Bioeng. 2020, 7, 43–54. [Google Scholar] [CrossRef]
- Blachowicz, T.; Ehrmann, A. Spintronics—Theory, Modelling, Devices; De Gruyter: Berlin, Germany, 2019; ISSN1 978-3-11-049063-3. ISSN2 978-3-11-049062-6. [Google Scholar]
- Gomez-Caturla, J.; Ivorra-Martinez, J.; Lascano, D.; Balart, R.; García-García, D.; Dominici, F.; Puglia, D.; Torre, L. Development and evaluation of novel nanofibers based on mango kernel starch obtained by electrospinning. Polym. Test. 2021, 106, 107462. [Google Scholar] [CrossRef]
- Ehrmann, A.; Blachowicz, T. Magnetic Force Microscopy on Nanofibers—Limits and Possible Approaches for Randomly Oriented Nanofiber Mats. Magnetochemistry 2021, 7, 143. [Google Scholar] [CrossRef]
- Mamun, A.; Blachowicz, T.; Sabantina, L. Electrospun Nanofiber Mats for Filtering Applications—Technology, Structure and Materials. Polymers 2021, 13, 1368. [Google Scholar] [CrossRef] [PubMed]
- Moulefera, I.; Trabelsi, M.; Mamun, A.; Sabantina, L. Electrospun carbon nanofibers from biomass and biomass blends—Current trends. Polymers 2021, 13, 1071. [Google Scholar] [CrossRef] [PubMed]
- Zahran, S.M.E.; Abdel-Halim, A.H.; Nassar, K.; Nada, A.A. Fabrication of nanofiltration membrane based on non-biofouling PVP/lecithin nanofibers reinforced with microcrystalline cellulose via needle and needle-less electrospinning techniques. Int. J. Biol. Macromol. 2020, 157, 530–543. [Google Scholar] [CrossRef] [PubMed]
- Blachowicz, T.; Ehrmann, A. Most recent developments in electrospun magnetic nanofibers: A review. J. Eng. Fibers Fabr. 2020, 15, 1558925019900843. [Google Scholar] [CrossRef]
- Grothe, T.; Wehlage, D.; Böhm, T.; Remche, A.; Ehrmann, A. Needleless Electrospinning of PAN Nanofibre Mats. Tekstilec 2017, 4, 290–295. [Google Scholar] [CrossRef]
- Storck, J.L.; Grothe, T.; Mamun, A.; Sabantina, L.; Klöcker, M.; Blachowicz, T.; Ehrmann, A. Orientation of Electrospun Magnetic Nanofibers Near Conductive Areas. Materials 2020, 13, 47. [Google Scholar] [CrossRef] [Green Version]
- Doğan, Y.K.; Demirural, A.; Baykara, T. Single-needle electrospinning of PVA hollow nanofibers for core–shell structures. SN Appl. Sci. 2019, 1, 415. [Google Scholar] [CrossRef] [Green Version]
- Wilk, S.; Benko, A. Advances in Fabricating the Electrospun Biopolymer-Based Biomaterials. J. Funct. Biomater. 2021, 12, 26. [Google Scholar] [CrossRef]
- Lalatonne, Y.; Richardi, J.; Pileni, M. Van der Waals versus dipolar forces controlling mesoscopic organizations of magnetic nanocrystals. Nat. Mater. 2004, 3, 121–125. [Google Scholar] [CrossRef]
- Tanaka, K.; Ishii, J.; Katayama, T. Influence of Magnetite Dispersion on Tensile Properties of Magnetite/PLA Nanofiber Nonwoven Fabrics. Key Eng. Mater. 2019, 827, 190–195. [Google Scholar] [CrossRef]
- Chowdhury, T.; D’Souza, N.; Berman, D. Electrospun Fe3O4-PVDF Nanofiber Composite Mats for Cryogenic Magnetic Sensor Applications. Textiles 2021, 1, 227–238. [Google Scholar] [CrossRef]
- Blachowicz, T.; Döpke, C.; Ehrmann, A. Micromagnetic Simulations of Chaotic Ferromagnetic Nanofiber Networks. Nanomaterials 2020, 10, 738. [Google Scholar] [CrossRef] [Green Version]
- Döpke, C.; Grothe, T.; Steblinski, P.; Klöcker, M.; Sabantina, L.; Kosmalska, D.; Blachowicz, T.; Ehrmann, A. Magnetic Nanofiber Mats for Data Storage and Transfer. Nanomaterials 2019, 9, 92. [Google Scholar] [CrossRef] [PubMed] [Green Version]
- Trabelsi, M.; Mamun, A.; Klöcker, M.; Sabantina, L. Needleless Electrospun Magnetic Carbon Nanofiber Mats for Sensor Applications. Eng. Proc. 2021, 6, 76. [Google Scholar] [CrossRef]
- Trabelsi, M.; Mamun, A.; Klöcker, M.; Moulefera, I.; Pljonkin, A.; Elleuch, K.; Sabantina, L. Magnetic Carbon Nanofiber Mats for Prospective Single Photon Avalanche Diode (SPAD) Sensing Applications. Sensors 2021, 21, 7873. [Google Scholar] [CrossRef] [PubMed]
- Wortmann, M.; Layland, A.S.; Frese, N.; Kahmann, U.; Grothe, T.; Storck, J.L.; Blachowicz, T.; Grzybowski, J.; Hüsgen, B.; Ehrmann, A. On the reliability of highly magnified micrographs for structural analysis in materials science. Sci. Rep. 2020, 10, 14708. [Google Scholar] [CrossRef]
- Fokin, N.; Grothe, T.; Mamun, A.; Trabelsi, M.; Klöcker, M.; Sabantina, L.; Döpke, C.; Blachowicz, T.; Hütten, A.; Ehrmann, A. Magnetic Properties of Electrospun Magnetic Nanofiber Mats after Stabilization and Carbonization. Materials 2020, 13, 1552. [Google Scholar] [CrossRef] [Green Version]
- Sabantina, L.; Hes, L.; Rodríguez-Mirasol, J.; Cordero, T.; Ehrmann, A. Water vapor permeability through PAN nanofiber mat with varying membrane-like areas. Fibres Text. East. Eur. 2019, 133, 12–15. [Google Scholar] [CrossRef]
- Grothe, T.; Brikmann, J.; Meissner, H.; Ehrmann, A. Influence of Solution and Spinning Parameters on Nanofiber Mat Creation of Poly(ethylene oxide) by Needleless Electrospinning. Mater. Sci. 2017, 23, 342–349. [Google Scholar] [CrossRef] [Green Version]
- Sabantina, L.; Wehlage, D.; Klöcker, M.; Mamun, A.; Grothe, T.; García-Mateos, F.J.; Rodríguez-Mirasol, J.; Cordero, T.; Finsterbusch, K.; Ehrmann, A. Stabilization of electrospun PAN/gelatin nanofiber mats for carbonization. J. Nanomater. 2018, 2018, 6131085. [Google Scholar] [CrossRef] [Green Version]
- Mamun, A.; Trabelsi, M.; Klöcker, M.; Sabantina, L.; Großerhode, C.; Blachowicz, T.; Grötsch, G.; Cornelißen, C.; Streitenberger, A.; Ehrmann, A. Electrospun Nanofiber Mats with Embedded Non-Sintered TiO2 for Dye-Sensitized Solar Cells (DSSCs). Fibers 2019, 7, 60. [Google Scholar] [CrossRef] [Green Version]
- Ehrmann, A.; Blachowicz, T. Magnetization reversal asymmetry in a structured ferromagnetic nanoparticle with varying shape anisotropy. J. Magn. Magn. Mater. 2022, 546, 168929. [Google Scholar] [CrossRef]
- Blachowicz, T.; Steblinski, P.; Grzybowski, J.; Ehrmann, A. Domain wall nucleation, propagation and annihilation in coupled bent ferromagnetic nanofibers with rotating local input fields. J. Magn. Magn. Mater. 2022, 546, 168925. [Google Scholar] [CrossRef]
- Mamun, A.; Sabantina, L.; Klöcker, M.; Heide, A.; Blachowicz, T.; Ehrmann, A. Electrospinning Nanofiber Mats with Magnetite Nanoparticles Using Various Needle-Based Techniques. Polymers 2022, 14, 533. [Google Scholar] [CrossRef]
- Mólnar, K.; Szolnoki, B.; Toldy, A.; Vas, L.M. Thermochemical stabilization and analysis of continuously electrospun nanofibers. J. Therm. Anal. Calorim. 2014, 117, 1123–1135. [Google Scholar] [CrossRef]


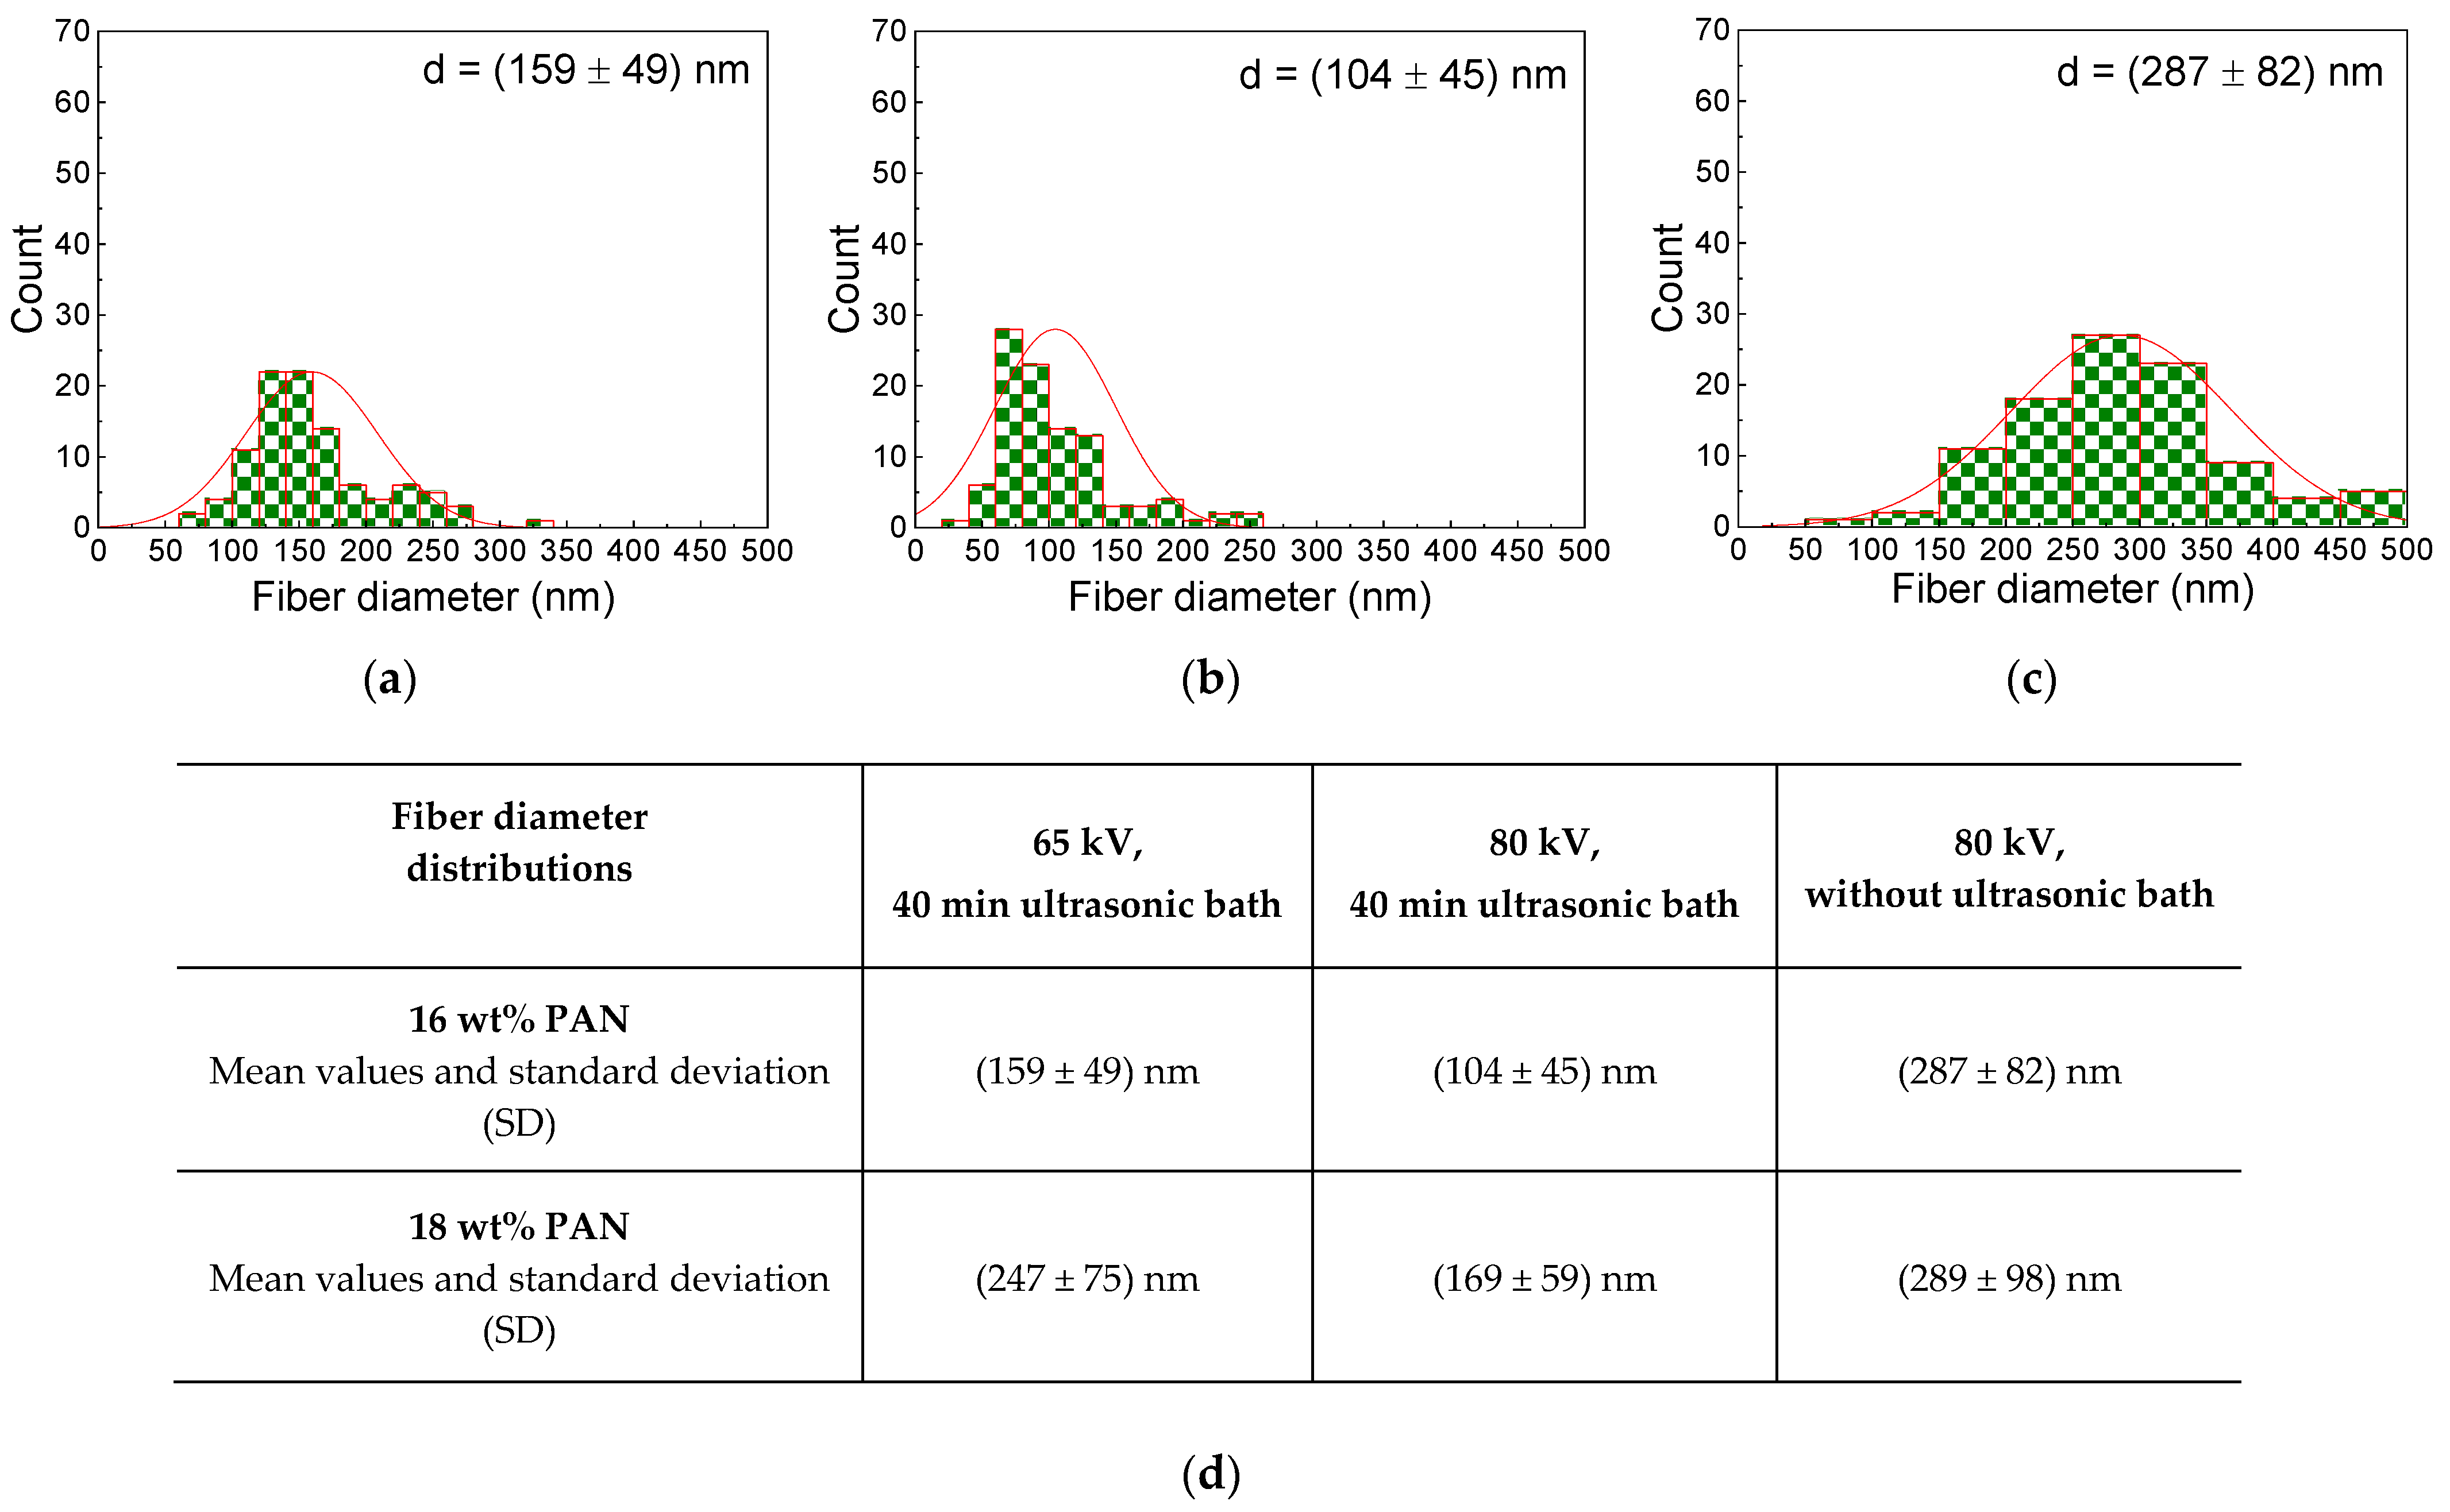
| 14 wt% PAN 16 wt% PAN 18 wt% PAN | High voltage of 65 kV and ultrasonic bath |
| 14 wt% PAN 16 wt% PAN 18 wt% PAN | High voltage of 80 kV and ultrasonic bath |
| 14 wt% PAN 16 wt% PAN 18 wt% PAN | High voltage of 80 kV and without ultrasonic bath |
Publisher’s Note: MDPI stays neutral with regard to jurisdictional claims in published maps and institutional affiliations. |
© 2022 by the authors. Licensee MDPI, Basel, Switzerland. This article is an open access article distributed under the terms and conditions of the Creative Commons Attribution (CC BY) license (https://creativecommons.org/licenses/by/4.0/).
Share and Cite
Mamun, A.; Klöcker, M.; Blachowicz, T.; Sabantina, L. Investigation of the Morphological Structure of Needle-Free Electrospun Magnetic Nanofiber Mats. Magnetochemistry 2022, 8, 25. https://doi.org/10.3390/magnetochemistry8020025
Mamun A, Klöcker M, Blachowicz T, Sabantina L. Investigation of the Morphological Structure of Needle-Free Electrospun Magnetic Nanofiber Mats. Magnetochemistry. 2022; 8(2):25. https://doi.org/10.3390/magnetochemistry8020025
Chicago/Turabian StyleMamun, Al, Michaela Klöcker, Tomasz Blachowicz, and Lilia Sabantina. 2022. "Investigation of the Morphological Structure of Needle-Free Electrospun Magnetic Nanofiber Mats" Magnetochemistry 8, no. 2: 25. https://doi.org/10.3390/magnetochemistry8020025
APA StyleMamun, A., Klöcker, M., Blachowicz, T., & Sabantina, L. (2022). Investigation of the Morphological Structure of Needle-Free Electrospun Magnetic Nanofiber Mats. Magnetochemistry, 8(2), 25. https://doi.org/10.3390/magnetochemistry8020025