Article

Tuning the Spin-Crossover Behaviour in Fe(II) Polymeric Composites for Food Packaging Applications

by
Zoi G. Lada
1,2,
Konstantinos S. Andrikopoulos
1,3,*,
Georgios N. Mathioudakis
1,4,
Zoi Piperigkou
1,5,
Nikos Karamanos
1,5,*,
Spyros P. Perlepes
1,2,* and
George A. Voyiatzis
1
1
Foundation for Research and Technology-Hellas, Institute of Chemical Engineering Sciences, (FORTH/ICE-HT), Stadiou Str. Platani, GR-265 04 Patras, Greece
2
Department of Chemistry, University of Patras, GR-265 04 Rio-Patras, Greece
3
Department of Physics, University of Patras, GR-265 04 Rio-Patras, Greece
4
Department of Materials Science, University of Patras, GR-265 04 Rio-Patras, Greece
5
Biochemistry, Biochemical Analysis & Matrix Pathobiology Research Group, Laboratory of Biochemistry, Department of Chemistry, University of Patras, GR-265 04 Rio-Patras, Greece
*
Authors to whom correspondence should be addressed.
Magnetochemistry 2022, 8(2), 16; https://doi.org/10.3390/magnetochemistry8020016
Submission received: 23 December 2021 / Revised: 18 January 2022 / Accepted: 21 January 2022 / Published: 25 January 2022

Abstract

:
Although the spin-crossover (SCO) phenomenon is well documented, tuning the SCO behaviour remains a challenging task. This could be mainly attributed to the ‘delicate’ nature of the phenomenon; cooperativity expressed through differences in particle size and morphologies, and electrostatic interactions could significantly affect the process. The goal of the present effort is dual bearing both scientific and technological interest. Firstly, to examine the technological potential of SCO complexes by incorporating them into polymers, and secondly—and most importantly—to investigate if polymer-SCO complex interactions could occur and could affect the SCO behaviour, depending on the structural properties of both the polymer matrix and the SCO complex. In this context, two different polymers, polylactic acid (PLA) and polysulphone (PSF), which are capable of developing different interactions with the inclusions, and the SCO complexes [Fe(abpt)2{N(CN)2}2] and [Fe(abpt)2(SCN)2] were examined; abpt is the N,N’-bidentate chelating ligand 4-amino-3,5-bis(pyridin-2-yl)-1,2,4-triazole. The composites were characterised through scanning electron microscopy (SEM), attenuated total reflectance infrared (ATR/FTIR), and Raman spectroscopy. In addition, the potential migration release of the SCO compounds from the polymeric matrices and their toxicity evaluation were also studied. In addition, the potential migration release of the SCO compounds from the polymeric matrices was evaluated, and their insignificant toxicity was also verified. Temperature-dependent Raman spectra were collected in situ for the monitoring of the SCO behaviour after the incorporation of the Fe(II) complexes into the polymers; an upshift of the T1/2 transition and a hysteretic behaviour was detected for PSF-SCO composites, compared with the non-hysteretic behaviour of the pristine SCO complexes.

1. Introduction

The spin-crossover (SCO) phenomenon, the exchange that occurs between the high-spin (HS) and low-spin (LS) states in certain coordination complexes, was introduced eight decades ago. Recently, however, there have been many attempts to implement it in specific applications, including smart pigments, actuators, data storage, and sensing [1,2,3,4]. In particular, the significance of sensing applications, which is based on the different colour of the SCO compound in the HS and LS states, is reflected in the fact that industrial SCO-based sensors are already available to consumers working as temperature indicators [5]. The transition between the two well-defined HS–LS states could be abrupt or smooth and reversible or hysteretic [6]. A long-lasting challenge in the field of spin-crossover materials is to tune the SCO behaviour in a preferable way, based on the needs of each application. This challenge could be mainly attributed to the ‘delicate’ nature of the phenomenon; cooperativity in the solid state, which could be expressed through alterations of particle size, morphologies, and electrostatic interactions (e.g., H bonds, π–π stacking), results in differences on the final overall SCO behaviour of the material [7,8,9,10,11].
The incorporation of SCO complexes into polymers could be considered important, in terms of technological applications which aim at highlighting the physical characteristics of the material [10,12,13,14]. In this context, different types of integration processes have been examined, including spray coating, film casting, electrospinning, and 3D printing or even through the chemical reaction of the SCO compound with the polymer [14,15,16,17]. Film casting could be considered one of the preferable preparation methods ensuring the stability of the complex after its incorporation into the polymer.
The main novelty of the present study lies in the fact that the polymer matrix is considered both as a means for the future practical application of SCO complexes and mainly, and most importantly, as a tool for tuning the SCO behaviour in a desirable way. We, therefore, propose in the present study the use of suitable polymeric matrices whose interaction or not with the SCO material, may or may not allow the modification of the SCO behaviour or even its tuning. In this context, two different types of matrices—polylactic acid (PLA) and polysulphone (PSF) (Scheme 1a)—which can develop different interactions (i.e., PLA through H bonds and PSF mainly through π–π interactions) with particular SCO compounds, were examined. In parallel, the selection of a ‘convenient’ SCO complex is also very important. Therefore, two different formations of SCO systems were utilised: (a) nanoparticle formations of the SCO compound [Fe(abpt)2{N(CN)2}2] (polymorph B, Scheme 1b, abbreviated in the text as SCO1 [18]) and (b) nanowires of the SCO compound [Fe(abpt)2(SCN)2] (polymorph A, abbreviated in the text as SCO2 [10]); abpt is the N,N’-bidentate chelating ligand 4-amino-3,5-bis(pyridin-2-yl)-1,2,4-triazole. Based on the crystal structures of these two complexes, SCO1 is susceptible to forming intermolecular interaction through π–π interactions between the SCO1 molecules, while the SCO2 system, in addition to these interactions, could also form intermolecular interactions through H bonding between the sulphur atom of the thiocyanate ligand and the H atom of the NH2 group of the abpt ligand of a neighbouring molecule; the latter plays a key role in the wire formation of the material. Therefore, the two SCO systems were selected in the context that possess different formations at the nanoscale and different types of intermolecular interactions for the two SCO systems, which may lead to differences in the polymer-SCO interactions. The importance of Raman spectroscopy for monitoring the SCO behaviour has been described previously [10,11,18], a methodology that we follow in the present research using temperature-dependent Raman collection.
In parallel, since our long-term aim is to exploit SCO materials as temperature sensors in food safety/food packaging applications, we also evaluated the potential/accidental migration release of the SCO materials into food simulants. To that end, following EU protocols proposed for studies related to plastic materials intended to come into contact with food (e.g., temperature, shaking conditions, etc.), and by using accredited migration cells in which the polymeric composite films were placed in contact with a relevant food simulant (50% v/v ethanol solution), we spectroscopically monitored the potential release of the composite’s filler (SCO complex) into the food simulant solution as a function of time. In addition, their potential cytotoxic effects were examined after in vitro exposure, especially as we refer to nanomaterials. Cytotoxicity is considered primarily as the potential of a compound to induce cell death [19,20,21,22]. In vitro cytotoxicity tests are useful and necessary to define cytotoxicity, for example, the intrinsic ability of a compound to cause cell death as a consequence of damage to basic cellular functions. For this reason, cytotoxicity should be considered a starting point in an integrated assessment of the potential in vivo toxicity of food chemicals [23].
The goal of the present effort is twofold comprising both scientific and technological interests. The development of SCO-polymeric hybrid material with tuneable/controllable SCO behaviour would significantly contribute to the wider exploitation of SCO complexes, while the polymeric nature of the material (i.e., polymers used in the food packaging sector) will enhance the possibility for future industrial applications. Smart food packaging could be described as the science and technology developed by using appropriate materials exhibiting specific focused activity, in order to achieve desired benefits towards the food safety improvement. For instance, our vision is to exploit the ability of the SCO material to change spin state, accompanied by colour change, when the temperature is increased/decreased. If for any reason a refrigerated food product is defrosted at room temperature, the SCO material will change colour by switching from LS to HS state. If subsequent re-freezing is attempted, due to the wide hysteresis of the SCO complex, it will not be able to return from the HS to the LS state, the HS colour remains, and the consumer will be aware of any product deterioration. The novelty of developing appropriate SCO-based temperature sensors that would be integrated into smart food packaging for refrigerated products and would be able to irreversibly detect food temperature fluctuation leading to food spoilage is obvious.

2. Results and Discussion

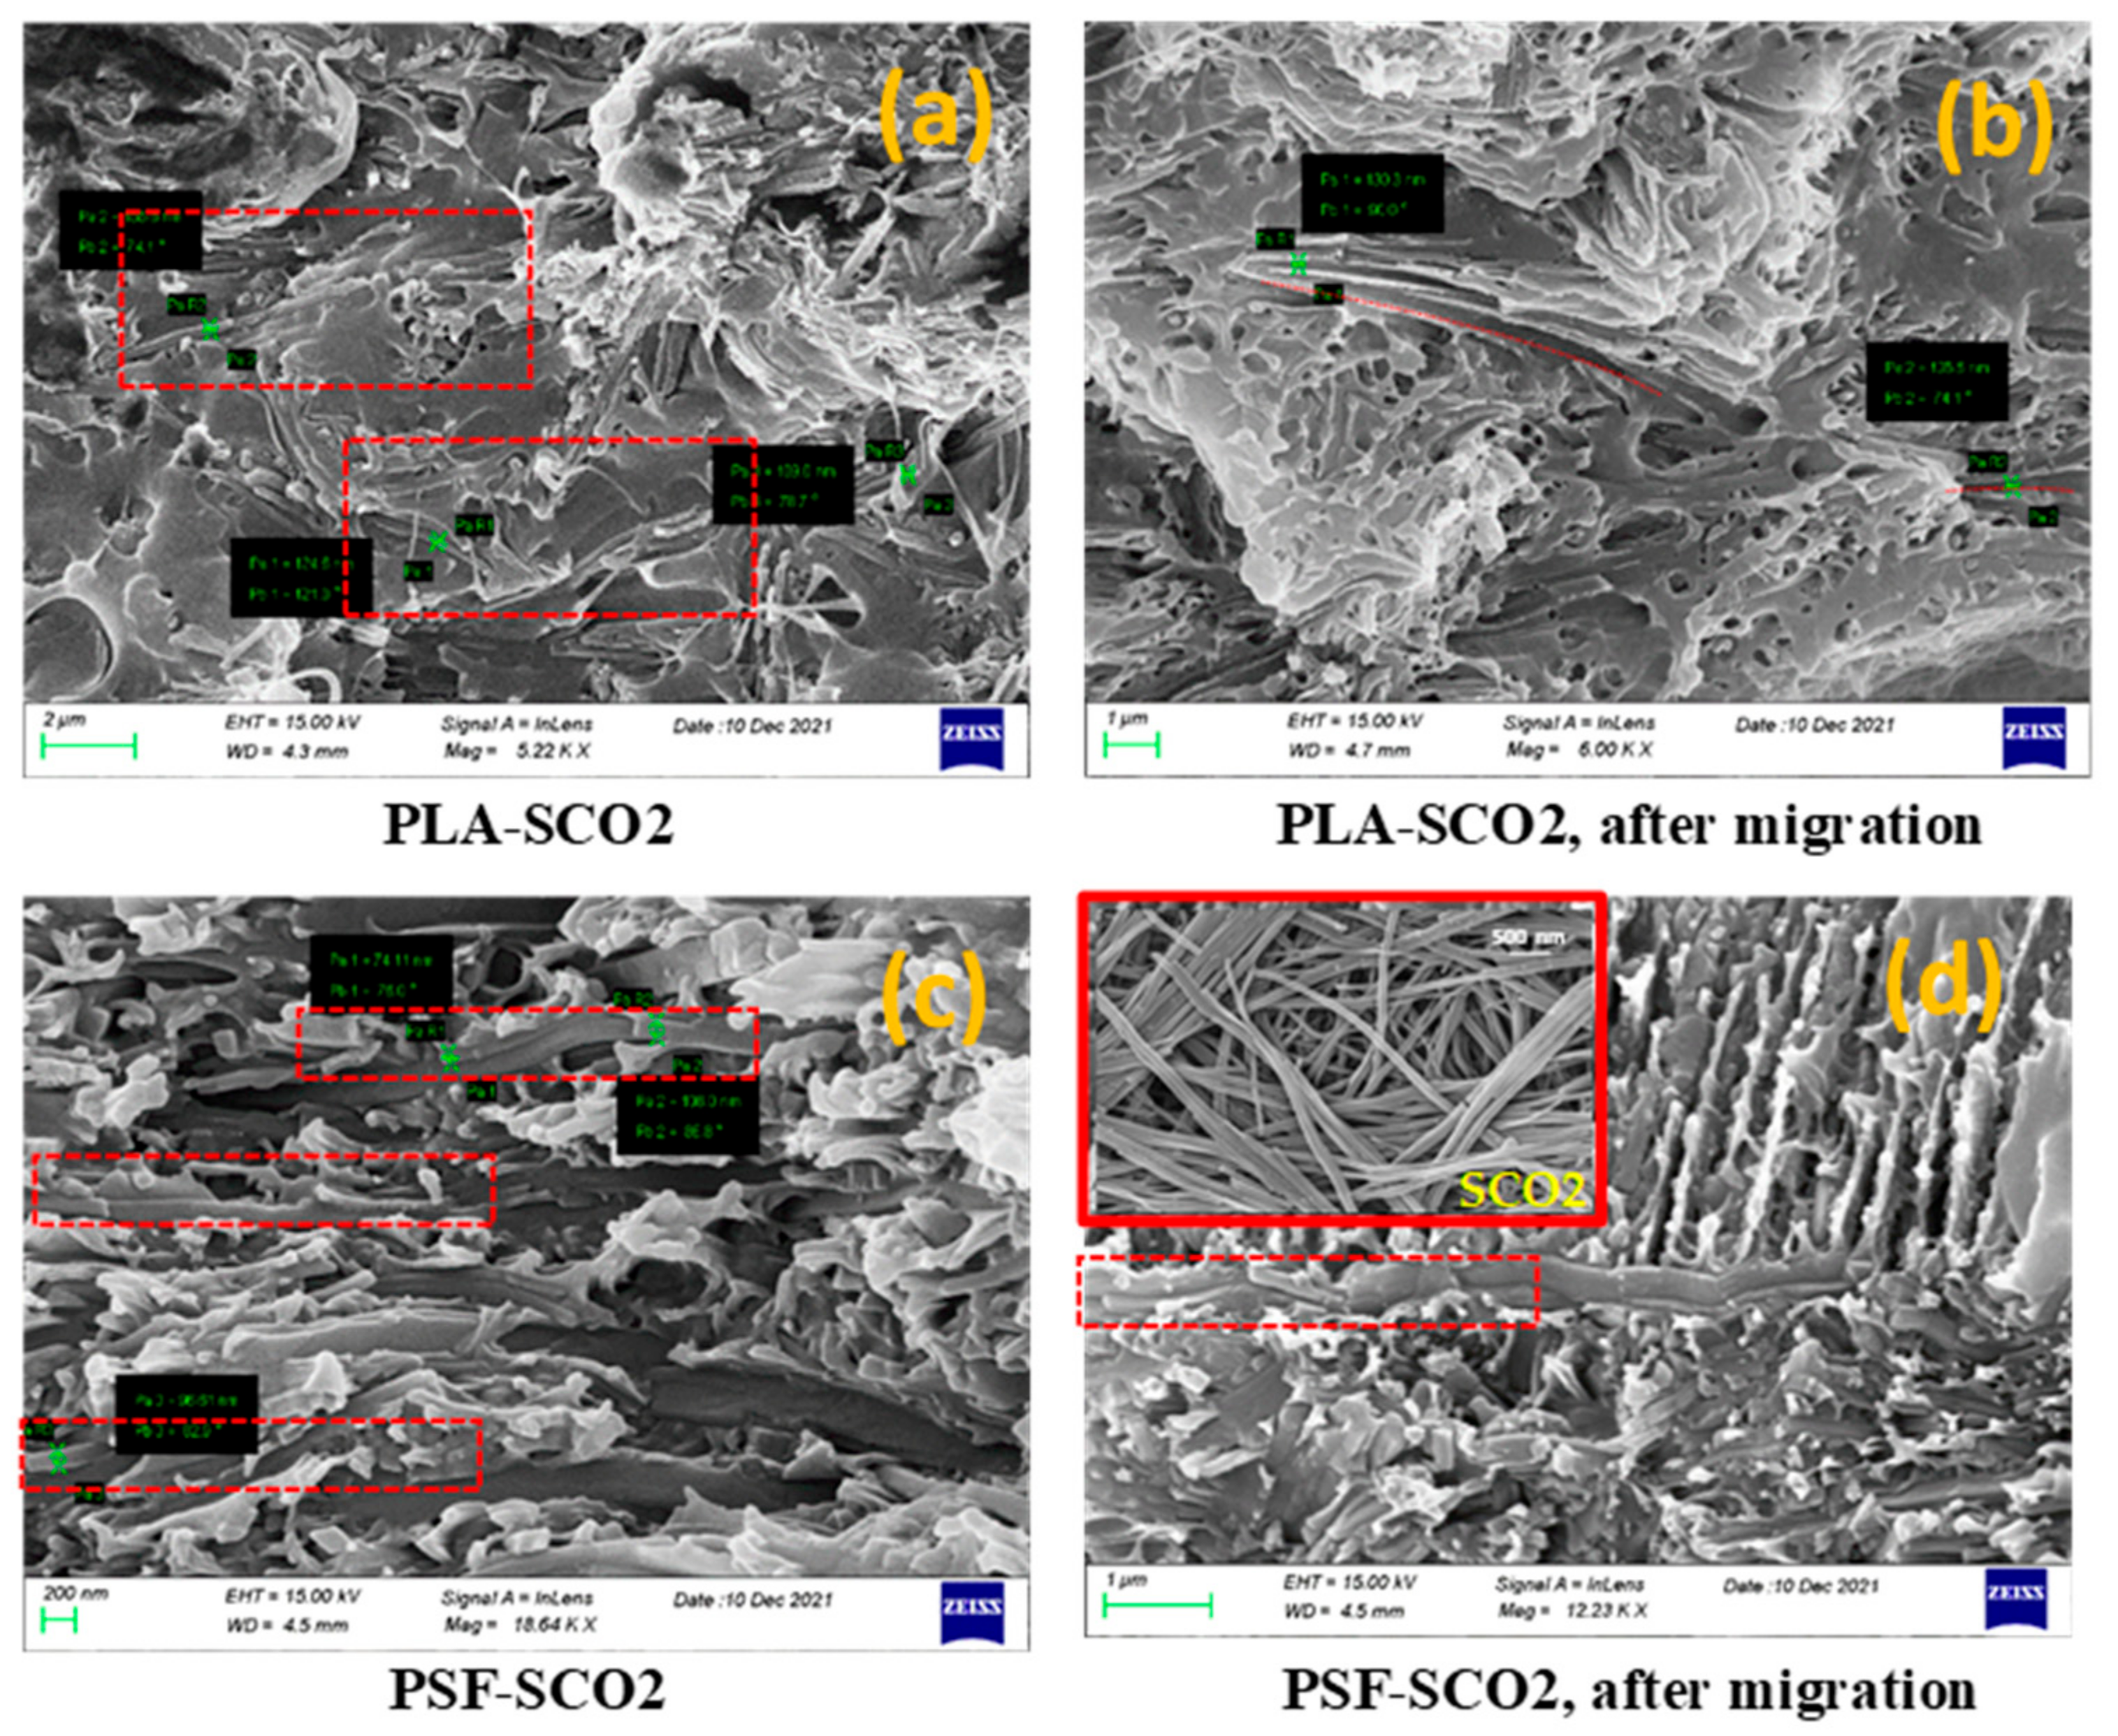
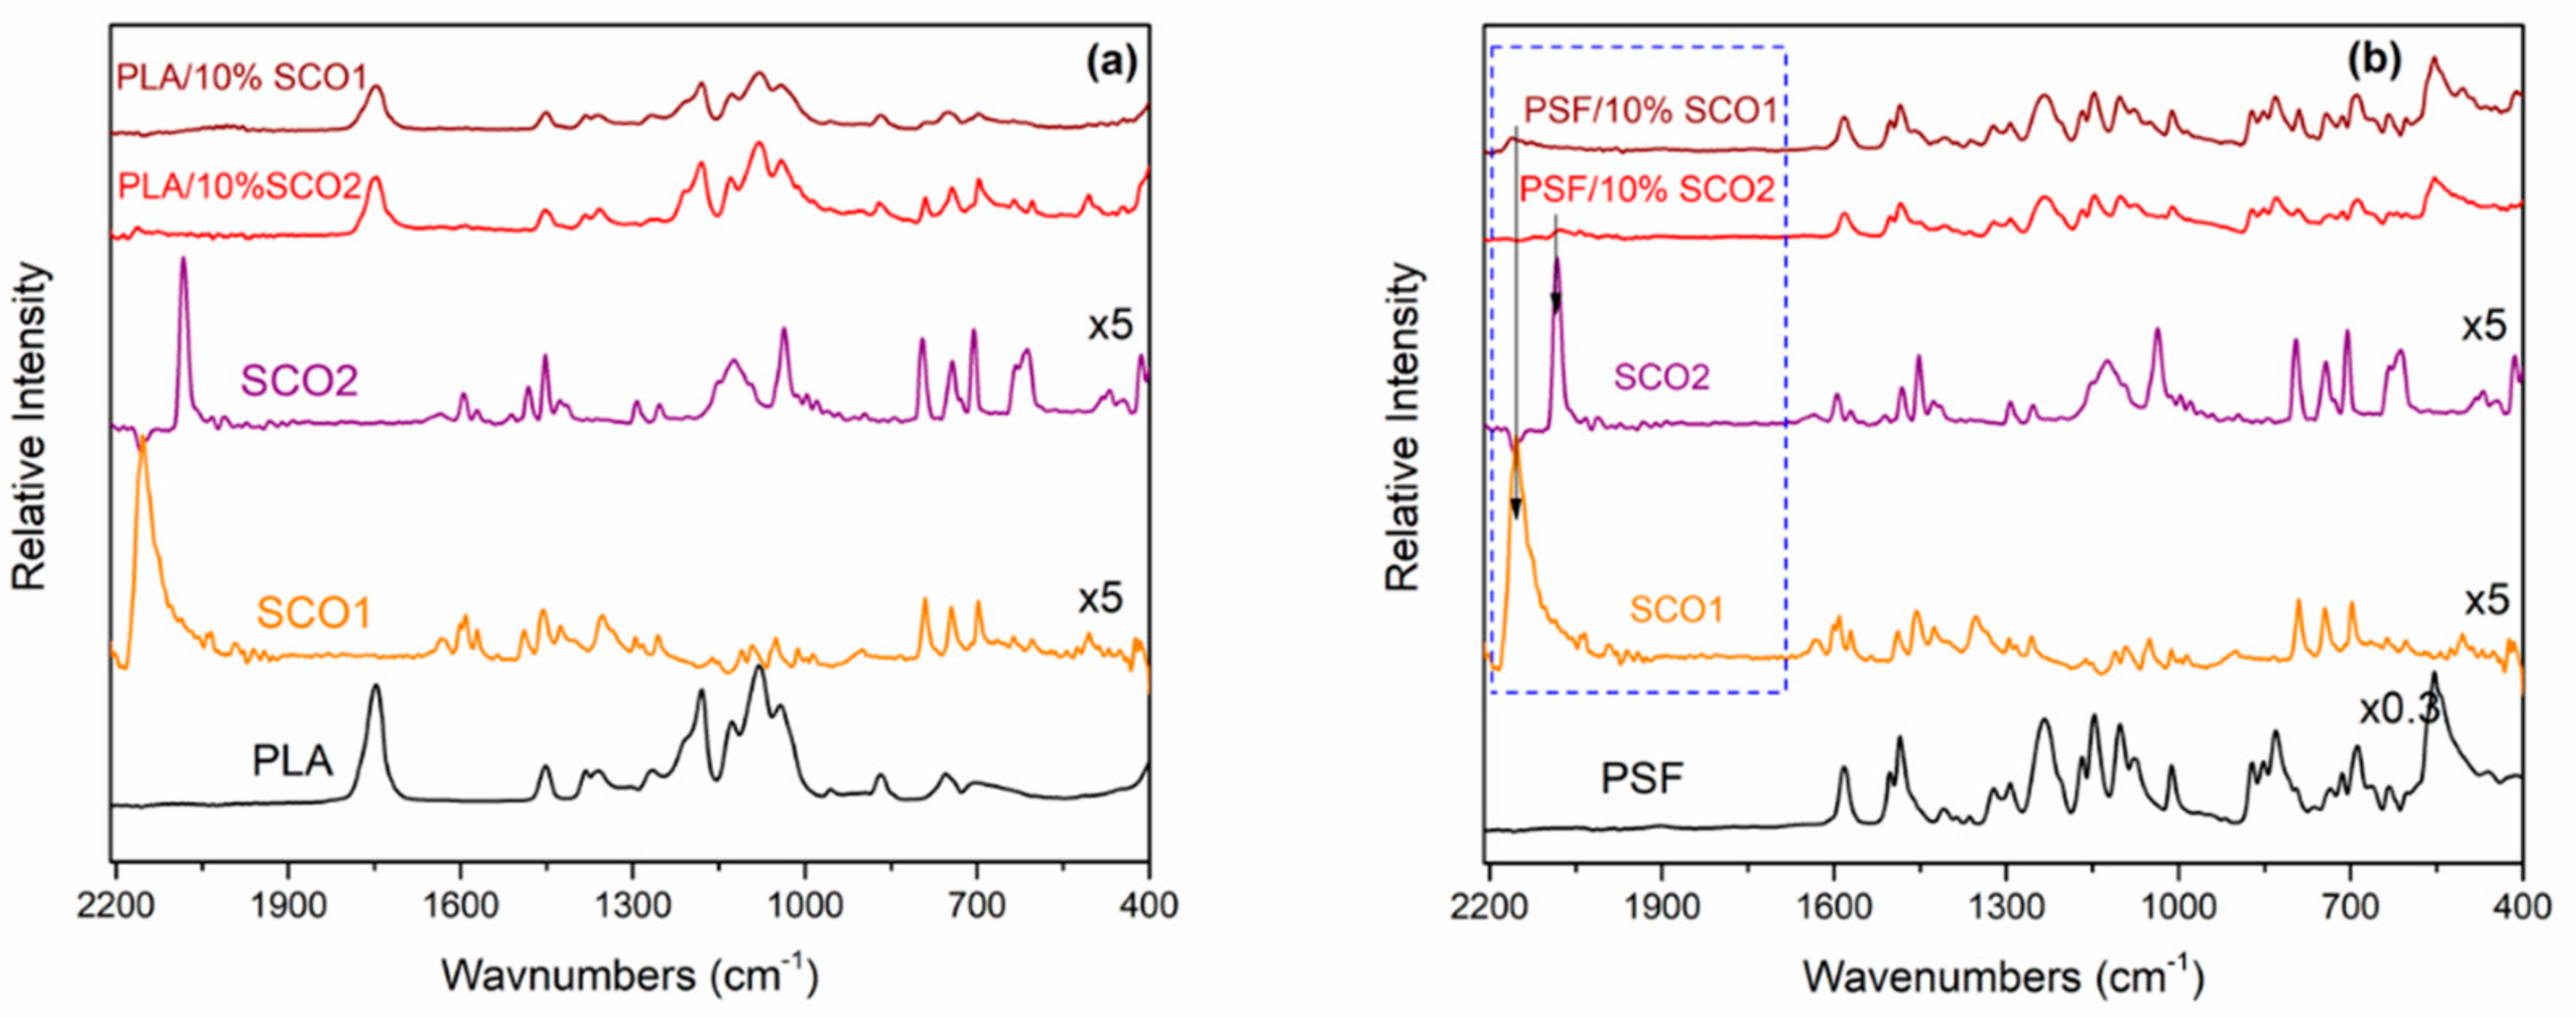
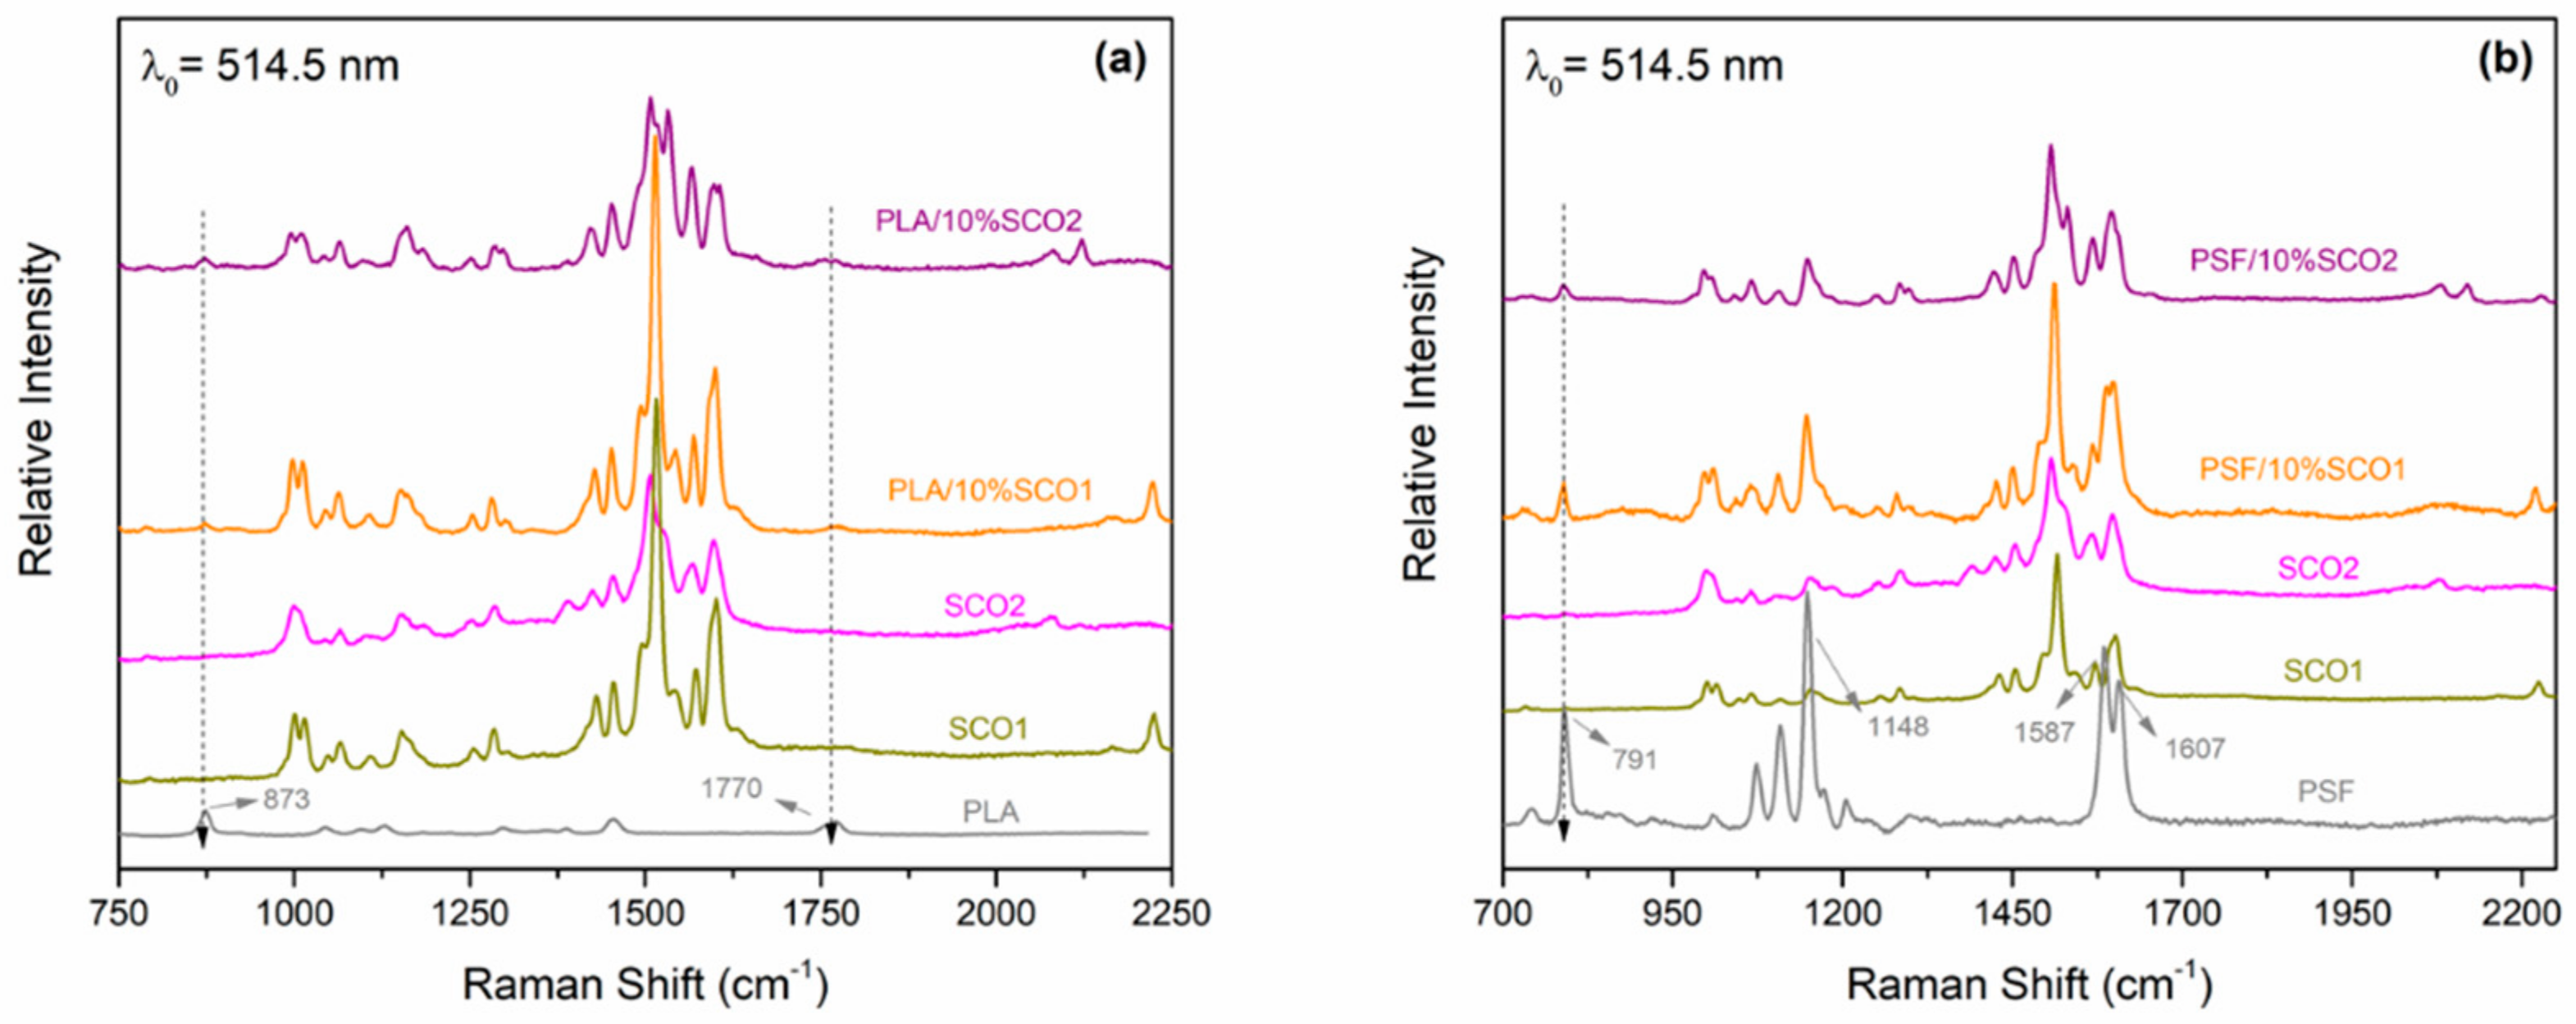
2.1. Morphological and Spectroscopic Characterisation

In Figure 1, representative SEM images of PLA-SCO2 and PSF-SCO2 composites in which the morphology of the SCO system is in nanowire formations, before (Figure 1a and Figure 1c, respectively) and after the migration release study (Figure 1b and Figure 1d, respectively), are presented; in the red box of the inset of Figure 1d the SEM image of the pristine SCO2 system is presented. The percentage of the SCO material in the polymer matrix is 10% w/w; this is also indicated in the EDX analysis of PSF:SCO samples (Figure S1). It seems that the SCO nanowires are successfully incorporated into both polymer matrices (squares in red dash line). However, after the migration process, residual cavities in the PLA matrix (red dashed lines) clearly indicate the release of nanowires, while in the case of PSF, no similar cavities are observed.
The spectroscopic characterisation of the composites was performed through ATR/FTIR and Raman spectroscopy (Figure 2 and Figure 3). As we can observe, the ATR/FTIR spectra of the polymers’ films were rather similar before and after incorporation of the SCO materials (SCO1 and SCO2) (Figure 2). In both samples, characteristic vibration bands of PLA and PSF are present. For example, absorption bands of PLA are detected at 1043 cm−1 (-OH bend), 1180/1080 cm−1 (-C-O- stretch), 1456 cm−1 (-CH2 bend), and 1747 cm−1 (-C=O carbonyl stretch) [24], while in the case of PSF, vibrational bands are located at 871, 850, and 831 cm−1 (aromatic C-H bending rocking); 1149 cm−1 (C-SO2-C symmetric stretching); 1238 and 1012 cm−1 (asymmetric C-O stretching); 1319 and 1292 cm−1 (asymmetric C-SO2-C stretching); 1580 cm−1 (benzene stretch) [25]. The most intense bands in the ATR/FTIR spectra of the SCO systems, attributed to the -C≡N stretching vibration of the isothiocyanate and dicyanamide axial ligands, are located at 2090 and 2150 cm−1, respectively [10,18]. The spectral contribution of the SCO systems is considered minor, and an indication of these bands can be scarcely observed in the corresponding ATR/FTIR spectra of PSF-SCO composites (black arrows in Figure 2b). It is noteworthy that a shift to lower wavenumbers (~5 cm−1) of the band corresponding to the SCN ligands (~2100 cm−1) in the PSF-SCO2 composite, compared with the pristine complex, is observed, indicating the possible existence of SCO-polymer interactions (blue box Figure 2b).
On the other hand, the Raman spectra of PLA-SCO and PSF-SCO composites reveal spectral contributions of both constituents; the SCO systems reveal their existence by characteristic peaks in the whole spectral range, with indicative stretching vibrations of PLA and PSF, respectively (indicated by arrows), being also present in the spectra.
The most characteristic bands of PLA that can be clearly resolved in the Raman spectra of the composites are the 873 cm−1 and the one at ~1770 cm−1 (black arrow, Figure 3a), while the respective one of PSF is the one at 791 cm−1 (black arrow, Figure 3b). Contribution to the vibrational modes of the SCO materials at ~1150 cm−1, 1590 cm−1, and 1605 cm−1 from the PSF vibrational spectrum may be also observed.
It is noted that the IR absorption spectra are dominated by the spectral contribution mainly of the polymer matrices, in contrast to the relevant Raman spectra which are dominated by the corresponding SCO complexes.

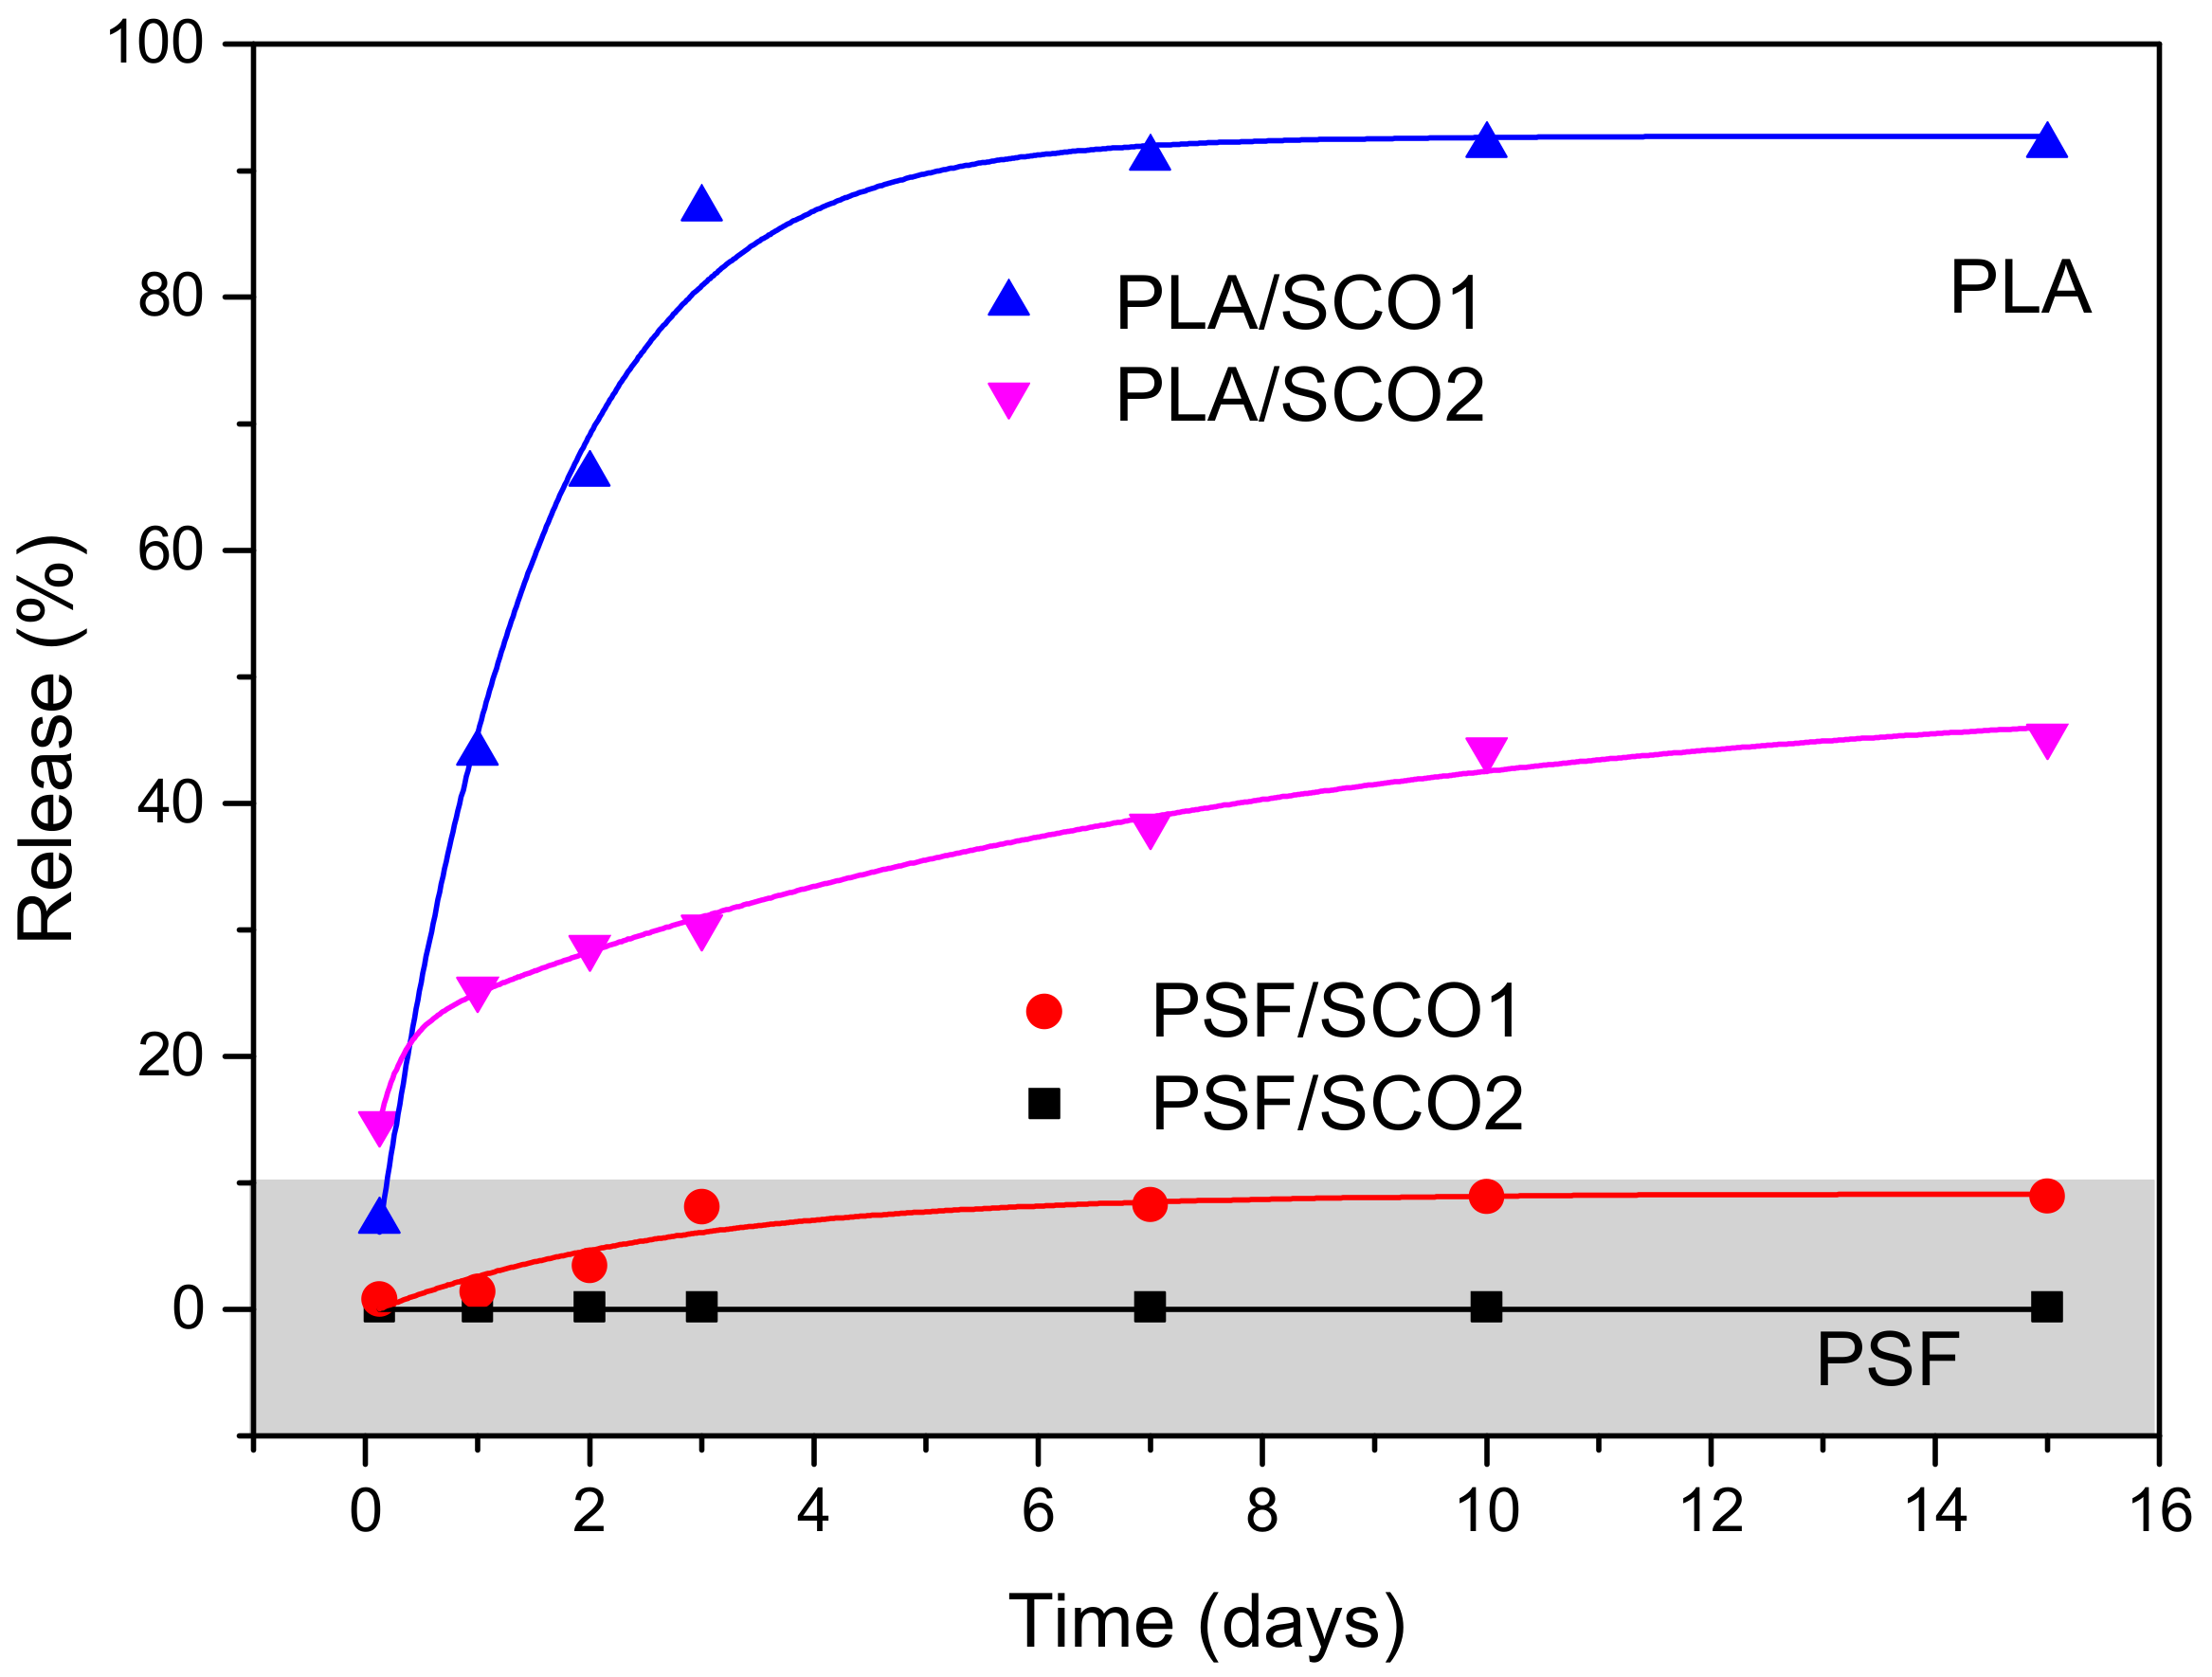
2.2. Migration/Release Studies (MRS)

Considering that our long-term goal is to develop smart and safe food packaging materials for application in refrigerated products, the migration release study and the evaluation of potential cytotoxicity of the sensors are essential. Towards the first task, we established the appropriate experimental conditions following the corresponding EU regulations/protocols for food packaging materials [26,27]; we used accredited migration cells and a solution of 50% v/v EtOH as food simulant (indicated for refrigerated products). Details on the migration release study are provided in the Supplementary Materials Section.
In Figure 4, the results from the release studies of PLA-SCO1, PLA-SCO2, PSF-SCO1, and PSF-SCO2 composites, by recording the UV–Vis absorption maxima of the solution in contact with the composite film bound to the migration cell as a function of time, are shown. As it is observed, the release characteristics are strongly dependent on the polymer matrix and less dependent on the SCO constituent. Interestingly, an insignificant release is detected for the composite PSF-SCO2, while in the corresponding PSF-SCO1 composite, a gradual (though not intense) release of the SCO system is detected. This may be attributed to stronger interactions between the SCO2 system and PSF, compared with the SCO1 sensor, and/or to the greater difficulty in penetrating the releasing medium into the composite matrix. On the other hand, comparing the two polymer matrices, PLA composites exhibit a significant release for both SCO systems. More specifically, for the SCO1 system, a gradual release of the sensor into the food simulant is observed, even only after 3 h of release process (7% of SCO1 is released into the 50% v/v EtOH solution), while the almost complete release of the sensor into the food simulant is detected after 10 days (92% release). In the case of SCO2, which possesses active sites susceptible to eventual H-bonding-type interactions, a less intense release is observed, and 45% release of SCO2 is detected after 10 days. Therefore, from the MRS studies, we can assume that PSF-based composites seem to be more stable, exhibiting zero or minor release of the sensors into the food simulant. Therefore, it would be interesting to investigate further in detail the SCO behaviour of PSF-SCO1 and PSF-SCO2 systems.

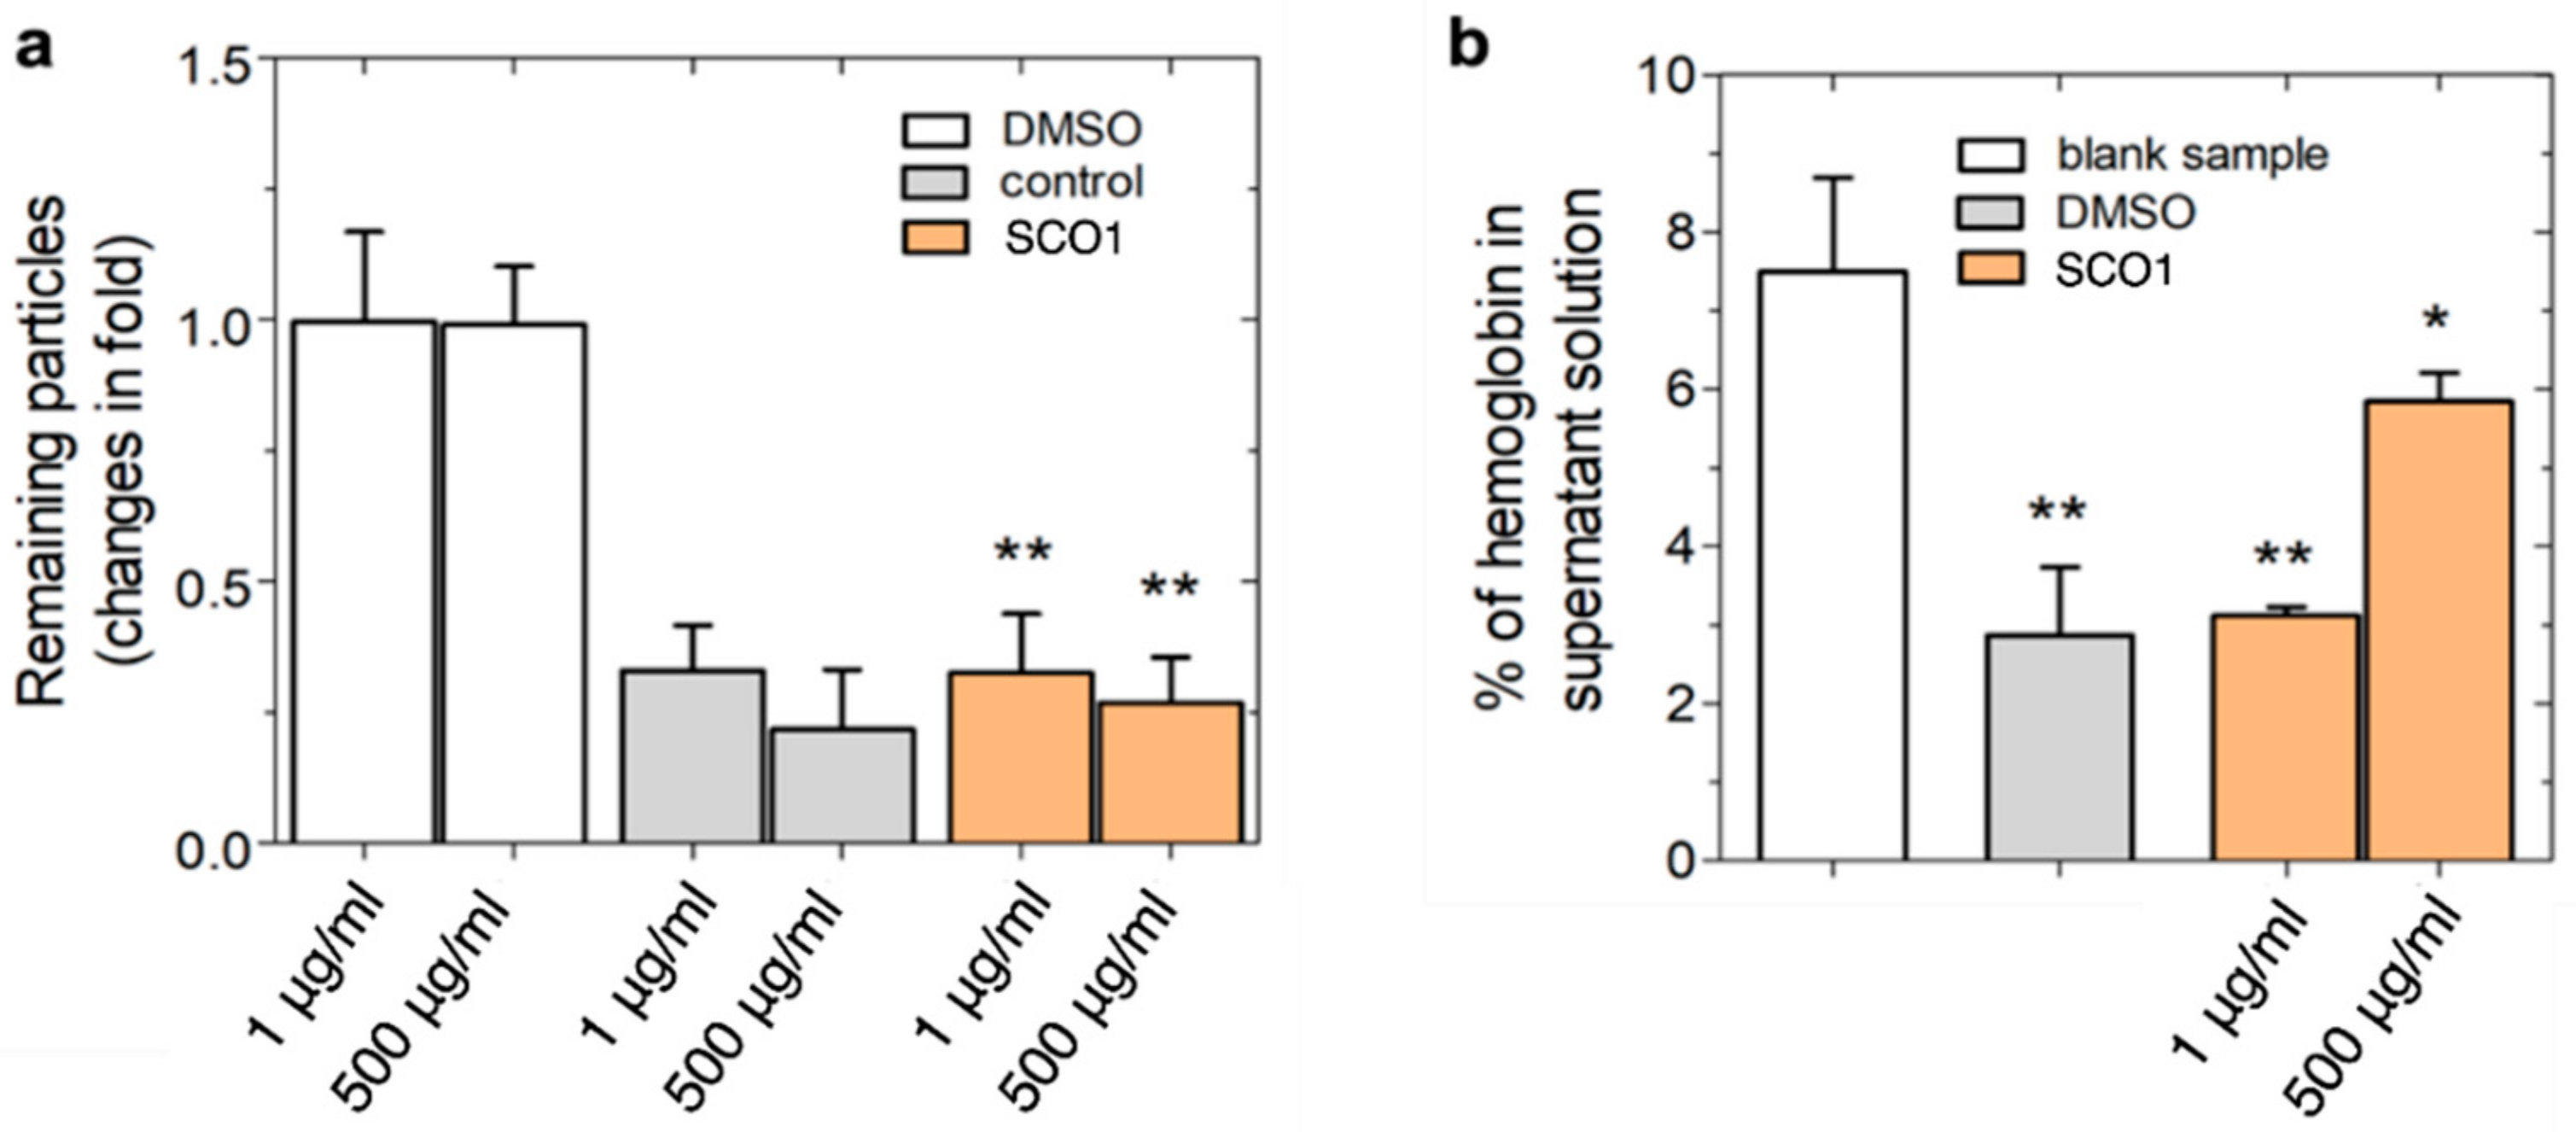
2.3. Toxicity Evaluation

The use of in vitro models with endpoints that reveal a general mechanism of toxicity can be a basis for further assessment of the potential risk of exposure to nanomaterials [28]. Toxicological endpoints may involve cytotoxicity studies first at the level of cell viability assays, evaluating dose- and time-dependent effects (short- and long-term evaluation) via mitochondrial activity and DNA stain, as well as cellular uptake reflecting activity, phenotype, and health, using fluorescent tags. Toxicity related to oxidative stress induced by nanomaterials may be examined in terms of ROS production. To this end, we evaluated the potential risks from the exposure of A549 lung adenocarcinoma cells to SCO1, which is a widely used in vitro cell cytotoxicity model, in order to define a safe concentration range for its further use, as well as to provide more information on the risk assessment of the synthesised sensor.
We first evaluated the effects of SCO1 on the viability of A549 cells, in the concentration range 1–1000 μg/mL at 10 μg/mL increment (selective concentrations are shown), in order to define the optimal concentration to be used in the next step of experimental approaches. As shown in Figure 5a, no significant cytotoxicity is observed at concentrations 1–500 μg/mL of SCO1, while at the highest concentration, SCO1 significantly reduces A549 cell viability. At the next level, the effects of 1 and 500 μg/mL concentrations of SCO1 were studied in terms of cell morphology and health. As depicted from immunofluorescence microscopy (Figure 5b), the sensor demonstrates slight changes in cell cytoskeleton only at the highest concentration, compared with the control cells. Specifically, F-actin filaments (green stain), crucial for the formation of cytoskeleton network, are observed somewhat condensed, compared with the untreated cells. Moreover, fluorescent sensing of cell nuclei with DAPI reveals the integrity of blue stain intensity, typical of healthy cells in both concentrations tested. Therefore, no significant cytotoxicity is observed in the presence of SCO1 in terms of cell viability and morphological characteristics.
Advancing further, we evaluated the ROS production following treatments of A549 with 1 and 500 μg/mL of the sensor. ROS generation is strong evidence of DNA damage and oxidative stress as a response to cytotoxic effects of xenobiotics. Figure 6 reveals that 1 μg/mL SCO1 does not induce ROS production, compared with the positive control, H2O2, whereas 500 μg/mL of the sensor results in a statistically significant reduction in ROS levels.
In cases in which a nanomaterial that an organism has been exposed to remains in the organism, following the composite’s release and before starting its in vivo cytotoxicity, it is possible to be released in the gastrointestinal (GI) tract and exert its cytotoxic actions. Taking this into account, it is logical to monitor the stability of the nanosensor in gastric fluids. In the present study, we produced a stimulated gastric fluid using pepsin 0.32% w/v at pH 1.2. Following the 1:1 addition of SCO1 (1, 500 μg/mL) to the pepsin buffer, the optical density at 450 nm was measured, and as shown in Figure 7a, we observe that the sensor demonstrates total stability in both concentrations tested.
In order to complete this in vitro cytotoxicity study, we also evaluated the haemolytic potential of SCO1 (Figure 7b). We revealed that SCO1 demonstrates increased stability when treated with red blood cells, suggesting that the possibility of its release in the bloodstream can be ruled out.
We can, therefore, conclude that the in vitro study of cytotoxicity reveals no significant health risk of the SCO1 sensor in the concentration range tested. Moreover, the facts that A549 cells do not produce ROS and retain a good cytoskeleton network and nuclei integrity following treatment with the synthesised sensor that is stable in gastric fluids and red blood cells, support the outcome of minimum cytotoxic effects. In addition, considering that the SCO2 system possesses a similar chemical structure to that of SCO1, an analogous cytotoxicity behaviour is anticipated for the former.

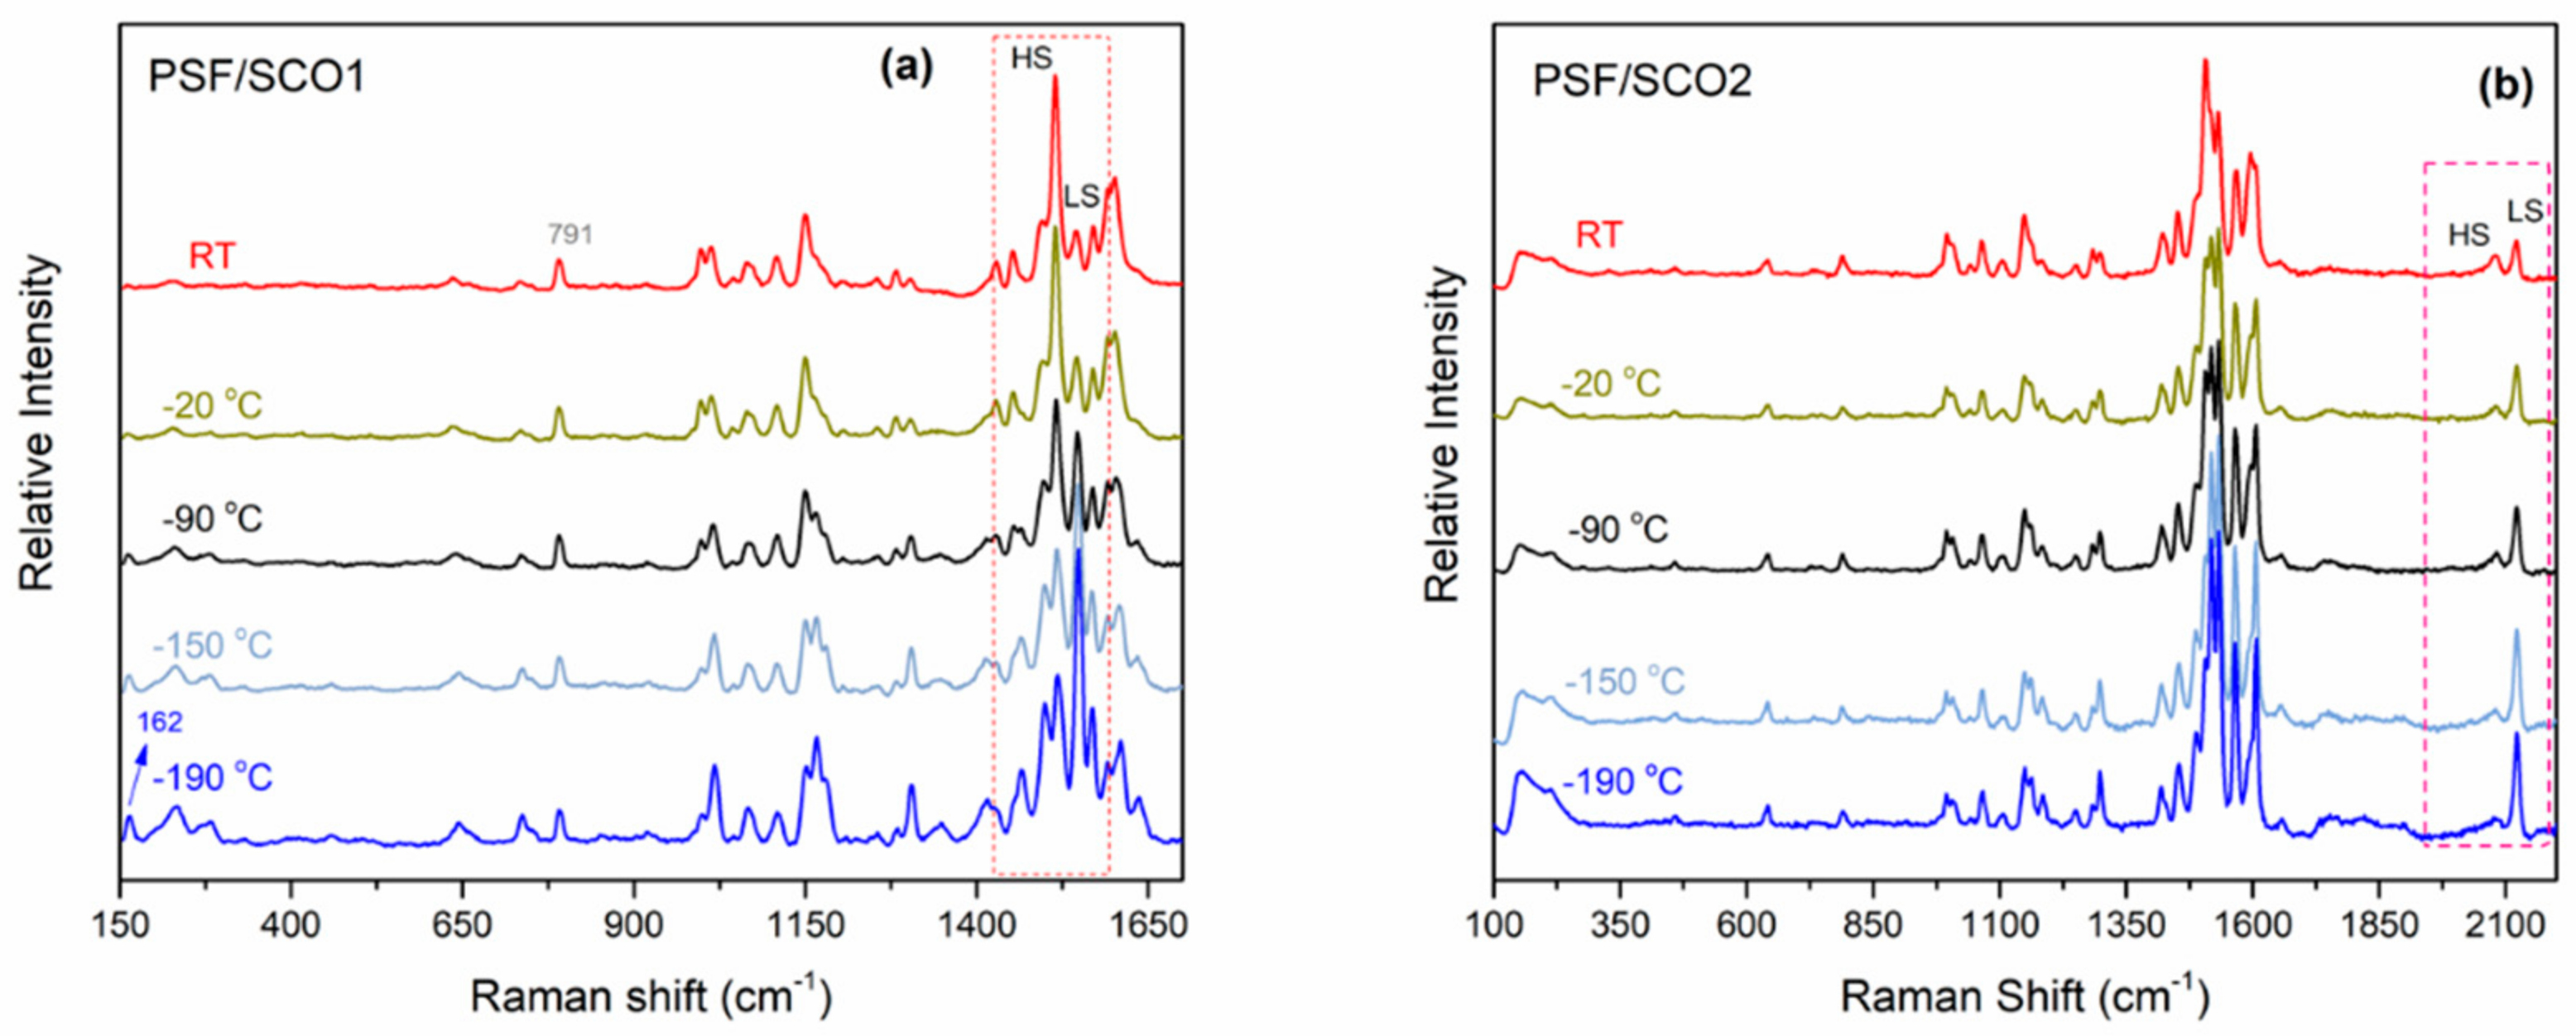
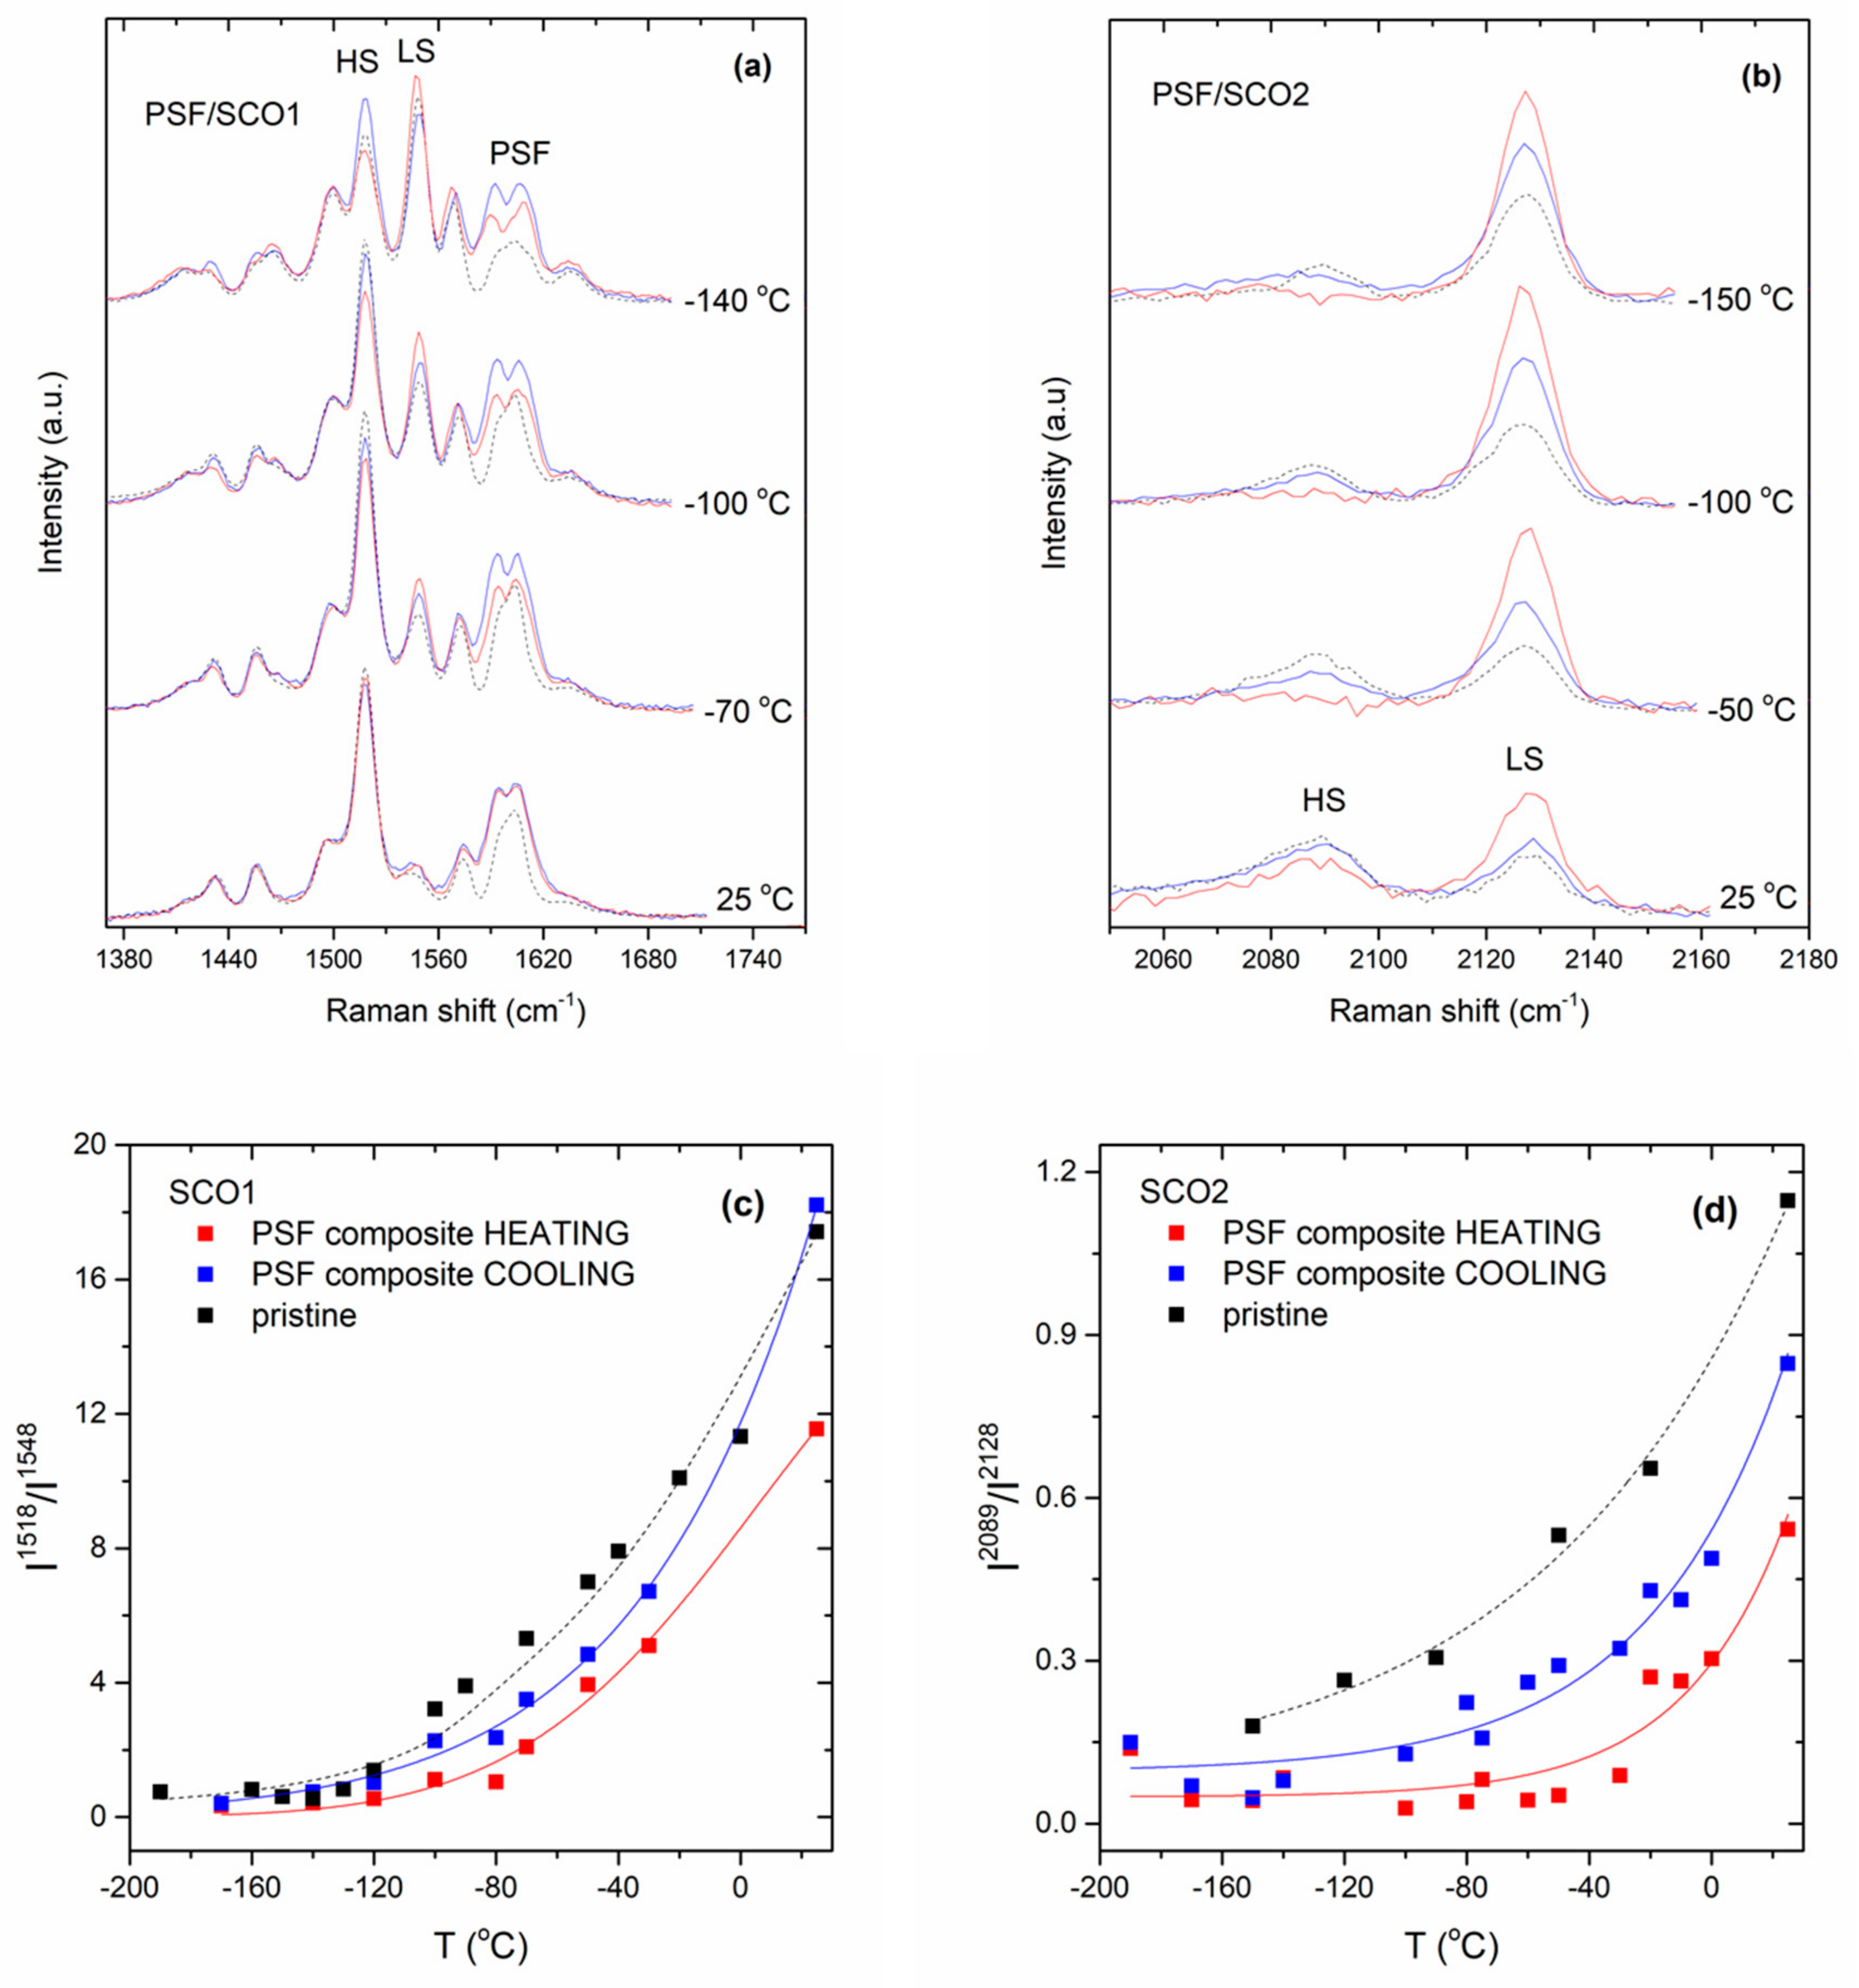
2.4. Monitoring of the SCO Behaviour

The main purpose of this research was to examine whether the incorporation of an SCO complex into a polymeric matrix (food packaging) can affect its SCO behaviour and even allow a kind of tuning; such an ability would enhance the importance of SCO materials in practical applications. Taking into account that PSF-SCO composites reveal significantly higher stability, compared with PLA-SCO composites during the migration release study (Figure 4), the SCO behaviour of the composites PSF-SCO1 and PSF-SCO2 was monitored via temperature-dependent Raman spectroscopy. In Figure 8, representative Raman spectra at different temperatures are presented for PSF-SCO1 and PSF-SCO2 films. Apart from the 791 cm−1 band and small contributions to ~1150 cm−1, 1590 cm−1, and 1605 cm−1 (as stated in Section 2.1), all other vibrational bands are attributed to the SCO material.
It is worth commenting that as the temperature decreases, differences in the Raman spectra of both PSF-SCO1 and PSF-SCO2 systems are clearly visible. The low concentration of the SCO systems in the polymers may hinder the convenient observation of the changes due to the SCO transition in the composites, especially in the low-frequency region. However, considerable changes could be monitored. For the PSF-SCO1 system, the most easily observed alterations in the spectra are located in the 1050–1600 cm−1 spectral region, attributed to internal modes of the abpt organic ligand. For the PSF-SCO2 system, apart from these differences in the low-frequency region (the intensity of the band at 162 cm−1, attributed to Fe-N stretching vibrations of the Fe(II) complex at the LS state, is increased as the temperature decreases), alterations of the peaks at 2000–2300 attributed to the C≡N stretching vibrations are also profound. To this end, the intensity of some of the bands increases with the reduction in the temperature, while the intensity of others increases. The first bands may be attributed to the HS species, while the latter to the LS species. A characteristic example is the pair of the abpt vibrational modes at 1518 cm−1 and 1548 cm−1 for the SCO1 system, which are included in the dashed square of the spectra in Figure 8a. The progressive intensity alteration of these bands indicates the transition of the system from the HS to the LS states as the temperature is decreased. For the SCO2 system, the CN vibrational modes exhibit the same behaviour [10]. The intensity of the 2089 cm−1 band attributed to the HS species decreases with a reduction in temperature, while the intensity of the 2128 cm−1 band attributed to the LS species increases (dashed square in Figure 8b).
The normalised temperature-dependent Raman spectra of PSF composites in the spectral regions of interest (dashed squares in Figure 8), i.e., the characteristic abpt internal modes for SCO1 and the CN modes for SCO2, are presented in Figure 9a,b, respectively. In these figures, the Raman spectra of the composites for the transition from the LS to HS state (red line, the spectra were obtained in a heating mode) and the transition from the HS to LS state (blue line, the spectra were obtained in a cooling mode) were collected; the corresponding spectra of the pristine SCO materials are illustrated with a black dashed line for comparison. It is noticeable that in both composites, an upshift of the transition (LS population for the case of composites is systematically greater than the corresponding one for the pristine coordination complexes) and a hysteretic behaviour were recorded; no hysteretic behaviour of the SCO pristine materials (SCO1 and SCO2) was detected [10,18]. These alterations may be attributed to possible PSF-SCO1 interactions. These features were more intensely observed in the PSF-SCO2 system. The HS↔LS transition may be easily resolved in plots of Raman peaks intensity ratio as a function of temperature; the ratio should involve vibrational bands associated with the HS and LS species. Such plots for the PSF composites of SCO1 and SCO2 systems are shown in Figure 9c,d. More specifically, for the SCO1 composite, the intensity ratio of the 1518 cm−1 and 1548 cm−1 bands which are internal abpt vibrational modes of the HS and LS species, respectively, is plotted as a function of temperature. For the SCO2 composite, a similar plot is depicted using the 2089 cm−1 and 2128 cm−1 peaks characteristic of the corresponding HS and LS species. A significant shift of the transition to higher temperatures is clear for both composites if compared with the transition of the pristine SCO materials. The shift of the transition is furthermore justified by the persistence of the vibrational modes attributed to the LS species in the Raman spectra recorded at ambient temperature during the heating cycle; the species are eliminated when the temperature is further increased (Figure S4). Moreover, both composites exhibit hysteresis during the cooling and heating runs, although for both SCO systems in the pristine state, no hysteresis is observed. Both shift and hysteric effects generated by the incorporation of the SCO systems in the polymeric matrix are more intense for SCO2. From the basic research viewpoint, the estimation of the HS population as a function of temperature is of great importance; however, its extraction requires careful handling of the Raman cross-section of the bands used to signify the HS and LS species. This task is beyond the target of the current study; nevertheless, the qualitative results obtained which indicate the shift of the transition towards the effective temperature window for applications in the food sector (−50 °C to ambient), along with the hysteretic effects introduced by the polymer matrix, highlight the practical importance of such materials as temperature indicators. However, further intensive research is required; this study could be considered the stepping stone for future optimisation of the process.

3. Materials and Methods

3.1. Materials and Procedures

Two different spin-crossover complexes were synthesised in the nanoscale and studied. The syntheses of nanosized particles (~20 nm) of the SCO compound [Fe(abpt)2{N(CN)2}2] (polymorph B, abbreviated in the text as SCO1) and nanowires of the SCO compound [Fe(abpt)2(SCN)2] (polymorph A, abbreviated in the text as SCO2), along with their detailed SCO behaviour (investigated through temperature-dependent Raman spectroscopy) were previously described [10,18]. Materials (reagent grade) and solvents were used as received, while all manipulations were performed under a nitrogen atmosphere to prevent Fe(II) oxidation. The thermoplastic polymers used in the present study, polylactic acid (PLA) and polysulphone (PSF), were of commercial grade (PLA: Ingeo PLA 3052D by Nature Works LLC, allegedly containing ~4% D-lactide isomer kindly supplied by ex-ARGO S.A. and PSF by Advanced Polymers and Hybrid Nanomaterials Research Laboratory of the Department of Chemistry at the University of Patras (Sigma Aldrich, St. Louis, MO, USA), respectively). PLA is a biodegradable polymer widely used in recent decades in various applications, especially as a packaging material for consumer goods. On the other hand, PSF is a rigid, high-strength, and transparent polymer used for storage, heating, serving of foods, etc. The incorporation of SCO materials into the polymers was performed through film casting, taking into account that it is a non-destructive method. Prior to the composite preparation, the solubility of both SCO compounds and polymer matrices was examined in a variety of solvents. Therefore, we prepared PLA-SCO and PSF-SCO in CH2Cl2 (dichloromethane), with an SCO compound:polymer ratio in the composite of 10% w/w (details for the film preparation are presented in the Supplementary Materials Section). The 10% w/w loading in the SCO material is not mandatory in case of future application of the composite, since the colour change of the sensor in the composite is visible even at very low loadings (as we have previously reported, 0.5% w/w provides a significant colour change). This loading was critical in the present study for the investigation of the SCO behaviour via Raman; the high Raman cross-section of the polymers affects the overall spectra of the composites. The colour of the films at room temperature containing the SCO1 complex for both PLA and PSF was orange (HS form of the SCO complex), and at 77 K (after immersing them in liquid N2), the colour of the film turned dark red (LS form of the SCO complex). In the case of the SCO2 complex, the corresponding colours of the films were mauve at room temperature and red mauve at 77 K. The colour variations are due to the alterations in the structural bond distances occurring during the spin-crossover transition [26].

3.2. Experimental Techniques

A Zeiss ZUPRA 35 VP-FEG scanning electron microscopy (SEM) instrument (operation 5−20 keV) was used for the morphological characterisation of the polymeric composites; the system is equipped with EDS (Bruker GmbH, Billerica, MA, USA, Quanta 200) and BSE (K E Developments, Ltd., Suffolk, UK), allowing elemental analyses. The attenuated total reflectance (ATR) IR spectra of the films were recorded on a Bruker Optics ATR spectrometer (Alpha-P Diamond/Bruker Optics GmbH). The T64000 Horiba Jobin Yvon micro-Raman setup was used for the study. The 514.5 nm wavelength emitted from a DPSS laser (Cobolt Fandango TMISO laser, Norfolk, UK) was used for the excitation of the samples. A single configuration of the monochromator collected the backscattered radiation after passing through an appropriate edge filter (LP02-633RU-25, laser2000, UK, Ltd., Huntingdon, Cambridgeshire, UK). Instrumental calibration was achieved via the standard Raman peak position of a Si wafer at 520.5 cm−1. The spectral resolution was 5 cm−1. The monitoring of the SCO behaviour as a function of temperature was performed by collecting temperature-dependent spectra acquired with the use of a cooling stage (temperature-controlled stage, THMS600/720, LINKAM); temperature stabilisation was better than 0.5 K throughout the temperature range from ambient to liquid nitrogen. The measurements were performed in triplicate for statistical reasons.

3.3. Migration Release Study

The migration study was performed following the appropriate EU regulations. Stainless steel migration cells (Figure S2), purchased from LABC-Labortechnik (http://www.labc.de/, accessed on 23 November 2021), were placed in a shaking incubator (Wise Cube), operating at stable temperature (40 °C) for a period of 10–15 days [27]. The migration release study was followed by UV–Vis absorption (Shimadzu UV-1900 spectrometer); details are provided in the Supplementary Materials Section. The selected food simulant was the type D1 food simulant (50% v/v ethanol/water solution), which is suitable for preserved fruits, vegetables, and meat. The quantification of the released concentration of the SCO compound was achieved by monitoring the band intensity of the absorption bands of the SCO1 and SCO2 systems; the calibration curve was constructed for known concentrations of the SCO compounds in 50% EtOH solutions (Figure S3).

3.4. Toxicological Assessment of Nanomaterial

3.4.1. Biochemicals and Reagents

Dulbecco’s minimal essential medium (DMEM), fetal bovine serum (FBS), sodium pyruvate, L-glutamine, penicillin, streptomycin, amphotericin B, and gentamycin were all obtained from Biosera LTD (France). All other chemicals used were of the best commercially available grade.

3.4.2. Cell Cultures and Conditions

Human lung adenocarcinoma A549 cell line was obtained from the American Type Culture Collection (ATCC, Baltimore, MD, USA) and routinely cultured as monolayers at 37 °C in a humidified atmosphere of 5% (v/v) CO2 and 95% air. Cells were grown in complete DMEM culture medium supplemented with 10% FBS, a cocktail of antimicrobial agents (100 IU/mL penicillin, 100 mg/mL streptomycin, 10 mg/mL gentamicin sulphate and 2.5 mg/mL amphotericin B), 2 mM L-glutamine, and 1 mM sodium pyruvate. Cells were harvested by trypsinisation with 0.05% (w/v) trypsin in PBS containing 0.02% (w/v) Na2EDTA. All experiments were conducted in serum-free conditions (0% FBS).
The material SCO1 was dissolved in DMSO, sonicated in a water bath for 30 min, and sterilised. The respective dilutions of the SCO complex, according to each experimental design were performed in DMEM 0% FBS. Cells were treated with the complex for 24 h prior to each experimental procedure.

3.4.3. WST-1 Cell Viability Assay

A549 cells were seeded in 96-well cell culture plates and grown to 60–70% confluency, followed by a 16 h starvation in serum-free medium, prior to treatment with the sample in the concentration range 1–1000 μg/mL. To evaluate the material’s effects on cell viability through mitochondrial dehydrogenase activity, Premix WST-1 (water-soluble tetrazolium salt, Takara Bio Inc., Göteborg, Sweden) was added to each well at a ratio of 1:10, and the absorbance at 450 nm was measured (reference wavelength at 650 nm), according to manufacturer’s instructions.

3.4.4. Reactive Oxygen Species (ROS) Detection

For the ROS detection, the fluorescent dye 2′,7′-dichlorodihydrofluorescein diacetate (H2DCF-DA) was applied. A549 cells were seeded in 96-well fluorescence flam bottom cell culture plates and allowed to attach overnight. Cells were then exposed to certain concentrations of tested nanomaterial, and H2O2 was used as a positive control for the method. Each experiment was performed in triplicate. Following the sample treatment, the culture medium was removed, and cells were loaded with 10 μΜ PBS-H2DCF-DA in a phenol red-free medium for 30 min at 37 °C in the dark. Negative and positive controls in order to eliminate background or indirect fluorescence were created. Cells were washed three times with a clear culture medium, and fluorescence intensity (excitation 495 nm; emission 530 nm) was measured using a microtiter plate reader (Tecan, Infinite M2000). Finally, a premixed WST-1 cell proliferation reagent was added at a 1:10 ratio to each well to determine the cell viability. Absorbance was measured at 450 nm (reference wavelength at 650 nm) in a microplate reader (Tecan, Infinite 2000). The increase in folds in ROS production was calculated using the following formula: (Ftest − Fblank)/(Fcontrol − Fblank), where Ftest, Fblank, and Fcontrol represent the fluorescence readings from the sample-treated wells, the unstained cells, and the stained control wells, respectively.

3.4.5. Immunofluorescence Microscopy

For immunofluorescence microscopy, 4 × 10⁴ A549 cells were seeded on glass coverslips in 24-well plates and incubated for 24 h in complete medium, followed by 16 h starvation. The medium was replaced with a serum-free medium containing the nanomaterial in the respective dilution, and cells were incubated for 24 h. Cells were first washed with phosphate-buffered saline (PBS), fixed in 4% paraformaldehyde (PFA) in PBS, washed three times with PBS, permeabilised with freshly made 0.1% Triton X-100 in PBS, washed three times with PBS-Tween 0.01%, and blocked with 5% BSA/PBS–Tween 0.01% for 1 h at room temperature. Then, cells were stained for α-tubulin using this primary antibody (#T9026, Sigma-Aldrich, Inc., dilution 1:100 in 1% BSA/PBS–Tween 0.01%) at 4 °C overnight. After that, the appropriate Alexa Fluor 594 goat anti-mouse (#A-11032, Invitrogen, dilution 1:2000) secondary antibody in 1% BSA/PBS–Tween 0.01% was added on coverslips that were incubated for 1 h in the dark. Finally, cells were washed, stained, and mounted on microscope slides with DAPI for cell nuclei. Between each step, cells were washed 3 times with PBS–Tween 0.01%. Visualisation was performed using a fluorescent phase-contrast microscope (OLYMPUS CKX41, QImaging Micro Publisher 3.3RTV, Teledyne Photometrics, Tucson, Arizona, USA) at 60× magnification.

Blood Assay

The haemolytic potential of the nanomaterial was measured using the method of Harington et al. [29]. The red blood cells were obtained from the fresh blood of healthy human donors. They were collected directly in 2% citrate–isotonic saline solution, and then, they were washed four times by suspending in PBS solution before centrifugation. At the end of each washing, the contents of the tubes were centrifuged for 10 min at 700× g. An approximately 2% erythrocyte suspension was prepared by making up 2 mL of packed erythrocytes to 100 mL with 1× veronal buffer. The optical density of the lysate was measured at 541 nm and the volume of the erythrocyte suspension was then adjusted to give an optical density of 0.7, as calculated by the following formula: (Observed optical density × Original volume/Desired optical density) = the Desired volume. The final suspension consisted of 2% standardised red blood cell (RBC) suspension in 1× veronal buffer. All treatments were diluted into 2 mL 1× veronal buffer first and incubated for 10 min at 37 °C. Subsequently, the nanomaterial was added to the 2 mL 2% erythrocyte suspension and incubated for 50 min at 37 °C (shaking gently every 10 min). A positive control (2 mL of erythrocyte suspension and 2 mL of veronal buffer with 1% Triton X-100), a control sample (2 mL of erythrocyte suspension and 2 mL of distilled water), and a second blank sample (2 mL of erythrocyte suspension and 2 mL of veronal buffer) acting as a control for the possible fragility of the erythrocytes were treated in exactly the same way as the nanomaterial. The amount of haemoglobin released into the supernatant solution was determined spectrophotometrically at 541 nm after a 5 min centrifugation of samples at 1800 rpm. The absorbance of wells with erythrocytes lysed with 1% Triton X-100 was taken as 100% haemolysis. The percentage of haemolysis in other wells was calculated relative to the Triton X-100 value.

3.4.6. In vitro Digestion Study

The effect of the gastric conditions on the studied sample was simulated by incubating the formulations in a digestion buffer (DB), 20 mM sodium acetate, as previously described [30]. Experiments were carried out with enzyme-free DB and with containing 0.32 %(w/v) pepsin DB. Measurement of absorbance at 450 nm was taken for the samples before the addition of the enzyme in order to exclude the potential absorbance from them alone. A single tube containing 0.5 mL of stimulation buffer was preheated to 37 °C prior to the addition of 0.5 mL of test sample solution. A tube containing the same amount of stimulation buffer and bovine albumin (BSA, Sigma) protein was used as a positive control to the method. The tube was mixed by vortex and immediately placed in a 37 °C water bath. Samples of 100 μL were removed at 4 h after initiation of the incubation and placed in a 96-well cell culture plate. Finally, the absorbance was measured at 450 nm using a microtiter plate reader (Tecan, Infinite M2000).

Statistical Analysis

For each assay, three individual experiments were conducted. Data in diagrams are expressed as mean ± standard deviation (SD). Statistically significant differences were evaluated using one-way ANOVA, followed by Tukey’s post hoc test. Statistical analyses and graphs were made using GraphPad Prism 9 (GraphPad Software, San Diego, CA, USA). Statistically significant differences are indicated by asterisks: * (p ≤ 0.05), ** (p < 0.01), compared with untreated (control) cells. Non-statistically significant comparisons (p > 0.05) are not displayed.

4. Conclusions

It is difficult to conclude on a project that is still in its infancy. The SCO complexes [Fe(abpt)2{N(CN)2}2] and [Fe(abpt)2(SCN)2] were mixed in polylactic acid and polysulphone via film casting. The complexes were found to be successfully incorporated into the polymers, while a relatively different migration release behaviour was recorded for the two different composites. More specifically, PLA composites exhibit a considerable release for both SCO systems, whereas a minor one is observed in the case of PSF. Both SCO complexes reveal insignificant cytotoxicity. From the investigation of the SCO behaviour of the composites, considerable changes in PSF-SCO composites were recorded. It is noticeable that in both composites, an upshift of the transition and a hysteretic behaviour were recorded; no hysteretic behaviour of the SCO1 pristine material was observed. Τhis study indicates that the strategy of selecting the dipole SCO-polymer being able to develop specific interactions seems to be effective and in the right direction. We did not find the optimum system, but we revealed the new directions/parameters that could lead to finding the optimal system. Further intensive research is planned, with this research activity acting as the stepping stone for future optimisation of the process. The possibility to tune the SCO transition based on the SCO-polymer interactions has an important technological implication in terms of future industrial applications of SCO materials and, therefore, will continue to attract intense research interest.

Supplementary Materials

The following supporting information can be downloaded at: https://www.mdpi.com/article/10.3390/magnetochemistry8020016/s1. Figure S1. Representative results from the EDX analysis for the PLA–SCO2 (a) and PSF–SCO2 (b) composites, where SCO2 is the complex [Fe(SCN)2(abpt)2]; the percentage of iron existing in the SCO2 and oxygen existing in the two polymers (PLA and PSF) is provided. Figure S2. (Left) The components of the migration cells. Cells of three different geometrical characteristics; the cell possessing 30 mm diameter was used for the migration experiments. (Right) A typical assembly of the cell that is ready to be put into the incubating chamber. Figure S3. The UV–Vis spectra of the SCO coordination complexes SCO1 and SCO2 ((a) and (c), respectively) in 50% EtOH for various concentrations and the subsequent calibration curves based on the maximum absorbance value ((b) and (d), respectively). Figure S4. The disappearance of the LS contribution in the Raman spectra of the PSF–SCO1 (a) and PSF–SCO2 (b) composites with increasing temperature.

Author Contributions

Conceptualisation, data collection, formal analysis, investigation, validation, writing—original draft preparation, Z.G.L.; formal analysis, validation, project administration, writing—review and editing, K.S.A.; MRS investigation, G.N.M.; toxicity evaluation, Z.P. and N.K.; validation, project administration, writing—review and editing, S.P.P.; project coordination, funding acquisition, writing—review and editing, G.A.V. All authors have read and agreed to the published version of the manuscript.

Funding

This research received no external funding.

Institutional Review Board Statement

Not applicable.

Informed Consent Statement

Not applicable.

Data Availability Statement

Not applicable.

Acknowledgments

The authors acknowledge Vassilios Dracopoulos from FORTH-ICEHT for his support with SEM images.

Conflicts of Interest

The authors declare no conflict of interest.

References

  1. Real, J.A.; Gaspar, A.B.; Munoz, M.C. Thermal, pressure and light switchable spin-crossover materials. Dalton Trans. 2005, 2062–2079. [Google Scholar] [CrossRef]
  2. Gamez, P.; Costa, J.S.; Quesada, M.; Aromí, G. Iron Spin-Crossover compounds: From fundamental studies to practical applications. Dalton Trans. 2009, 7845–7853. [Google Scholar] [CrossRef]
  3. Bousseksou, A.; Molnár, G.; Salmon, L.; Nicolazzi, W. Molecular spin crossover phenomenon: Recent achievements and prospects. Chem. Soc. Rev. 2011, 40, 3313–3335. [Google Scholar] [CrossRef]
  4. Senthil Kumar, K.; Ruben, M. Emerging trends in spin crossover (SCO) based functional materials and devices. Coord. Chem. Rev. 2017, 346, 176–205. [Google Scholar] [CrossRef]
  5. Olikrom. Available online: https://www.olikrom.com/en/nos-produits/quelques-applications/ (accessed on 12 November 2020).
  6. Brooker, S. Spin crossover with thermal hysteresis: Practicalities and lessons learnt. Chem. Soc. Rev. 2015, 44, 2880–2892. [Google Scholar] [CrossRef] [Green Version]
  7. Spiering, H. Elastic Interaction in Spin-Crossover Compounds. In Spin Crossover in Transition Metal Compounds III; Springer: Berlin, Germany, 2004; pp. 171–195. [Google Scholar]
  8. Vela, S.; Paulsen, H. Cooperativity in Spin Crossover Systems. An Atomistic Perspective on the Devil’s Staircase. Inorg. Chem. 2018, 57, 9478–9488. [Google Scholar] [CrossRef]
  9. Murray, K.S.; Kepert, C.J. Cooperativity in Spin Crossover Systems: Memory, Magnetism and Microporosity. In Spin Crossover in Transition Metal Compounds I; Gütlich, P., Goodwin, H.A., Eds.; Springer: Berlin, Germany, 2004; pp. 195–228. [Google Scholar]
  10. Lada, Z.G.; Chrissanthopoulos, A.; Perlepes, S.; Andrikopoulos, K.S.; Voyiatzis, G.A. Wet-Chemistry Assembly of One-Dimensional Nanowires: Switching Characteristics of a Known Spin-Crossover Iron(II) Complex Through Raman Spectroscopy. Chem. Commun. 2022, 58, 521–524. [Google Scholar] [CrossRef]
  11. Lada, Z.G.; Andrikopoulos, K.S.; Polyzou, C.D.; Tangoulis, V.; Voyiatzis, G.A. Monitoring the spin crossover phenomenon of [Fe(2-mpz)2Ni(CN)4] 2D Hofmann-type polymer nanoparticles via temperature-dependent Raman spectroscopy. J. Raman Spectr. 2020, 51, 2171–2181. [Google Scholar] [CrossRef]
  12. Enriquez-Cabrera, A.; Rapakousiou, A.; Piedrahita Bello, M.; Molnár, G.; Salmon, L.; Bousseksou, A. Spin crossover polymer composites, polymers and related soft materials. Coord. Chem. Rev. 2020, 419, 213396. [Google Scholar] [CrossRef]
  13. Cuéllar, M.P.; Lapresta-Fernández, A.; Herrera, J.M.; Salinas-Castillo, A.; Pegalajar, M.d.C.; Titos-Padilla, S.; Colacio, E.; Capitán-Vallvey, L.F. Thermochromic sensor design based on Fe(II) spin crossover/polymers hybrid materials and artificial neural networks as a tool in modelling. Sens. Actuators B Chem. 2015, 208, 180–187. [Google Scholar] [CrossRef]
  14. Hauser, A.; Adler, J.; Gütlich, P. Light-induced excited spin state trapping (LIESST) in [Fe(2-mephen)3]2+ embedded in polymer matrices. Chem. Phys. Lett. 1988, 152, 468–472. [Google Scholar] [CrossRef]
  15. Salmon, L.; Catala, L. Spin-crossover nanoparticles and nanocomposite materials. Compt. Rend. Chim. 2018, 21, 1230–1269. [Google Scholar] [CrossRef]
  16. Wang, W.; Ji, B.; Zhang, C.; Cao, X. New spin crossover polymeric composite and another way to describe the result. Inorg. Chem. Commun. 2016, 67, 55–59. [Google Scholar] [CrossRef]
  17. Lada, Z.G.; Soto Beobide, A.; Mathioudakis, G.N.; Voyiatzis, G.A. Fe(II) Spin Crossover/Polymer Hybrid Materials: Investigation of the SCO Behavior via Temperature-Dependent Raman Spectroscopy, Physicochemical Characterization and Migration Release Study. Molecules 2021, 26, 201. [Google Scholar] [CrossRef]
  18. Lada, Z.G.; Andrikopoulos, K.S.; Chrissanthopoulos, A.; Perlepes, S.P.; Voyiatzis, G.A. A Known Iron(II) Complex in Different Nanosized Particles: Variable-Temperature Raman Study of its Spin-Crossover Behavior. Inorg. Chem. 2019, 58, 5183–5195. [Google Scholar] [CrossRef]
  19. Xia, T.; Kovochich, M.; Brant, J.; Hotze, M.; Sempf, J.; Oberley, T.; Sioutas, C.; Yeh, J.I.; Wiesner, M.R.; Nel, A.E. Comparison of the Abilities of Ambient and Manufactured Nanoparticles To Induce Cellular Toxicity According to an Oxidative Stress Paradigm. Nano Lett. 2006, 6, 1794–1807. [Google Scholar] [CrossRef]
  20. Zhao, F.; Zhao, Y.; Liu, Y.; Chang, X.; Chen, C.; Zhao, Y. Cellular Uptake, Intracellular Trafficking, and Cytotoxicity of Nanomaterials. Small 2011, 7, 1322–1337. [Google Scholar] [CrossRef]
  21. Singh, S.; Nalwa, H.S. Nanotechnology and Health Safety — Toxicity and Risk Assessments of Nanostructured Materials on Human Health. J. Nanosci. Nanotech. 2007, 7, 3048–3070. [Google Scholar] [CrossRef]
  22. Nel, A.; Xia, T.; Mädler, L.; Li, N. Toxic Potential of Materials at the Nanolevel. Science 2006, 311, 622–627. [Google Scholar] [CrossRef] [Green Version]
  23. Trohalaki, S.; Zellmer, R.J.; Pachter, R.; Hussain, S.M.; Frazier, J.M. Risk Assessment of High-Energy Chemicals by in Vitro Toxicity Screening and Quantitative Structure-Activity Relationships. Toxicol. Sci. 2002, 68, 498–507. [Google Scholar] [CrossRef]
  24. Yuniarto, K.; Purwanto, Y.A.; Purwanto, S.; Welt, B.A.; Purwadaria, H.K.; Sunarti, T.C. Infrared and Raman studies on polylactide acid and polyethylene glycol-400 blend. AIP Conf. Proc. 2016, 1725, 020101. [Google Scholar]
  25. Singh, K.; Devi, S.; Bajaj, H.C.; Ingole, P.; Choudhari, J.; Bhrambhatt, H. Optical Resolution of Racemic Mixtures of Amino Acids through Nanofiltration Membrane Process. Sep. Sci. Technol. 2014, 49, 2630–2641. [Google Scholar] [CrossRef]
  26. Restuccia, D.; Spizzirri, U.G.; Parisi, O.I.; Cirillo, G.; Curcio, M.; Iemma, F.; Puoci, F.; Vinci, G.; Picci, N. New EU regulation aspects and global market of active and intelligent packaging for food industry applications. Food Control 2010, 21, 1425–1435. [Google Scholar] [CrossRef]
  27. Commission Regulation (EU) No 10/2011 of 14 January 2011 on Plastic Materials and Articles Intended to Come into Contact with Food Text with EEA Relevance. OJ L 2011, 338, 1–89. (updated 02011R0010—EN—23.09.2020—015.001, on September 2020). Available online: http://data.europa.eu/eli/reg/2011/10/oj (accessed on 20 December 2021).
  28. Marquis, B.J.; Love, S.A.; Braun, K.L.; Haynes, C.L. Analytical methods to assess nanoparticle toxicity. Analyst 2009, 134, 425–439. [Google Scholar] [CrossRef]
  29. Harington, J.S.; Miller, K.; Macnab, G. Hemolysis by asbestos. Environ. Res. 1971, 4, 95–117. [Google Scholar] [CrossRef]
  30. Thomas, K.; Aalbers, M.; Bannon, G.A.; Bartels, M.; Dearman, R.J.; Esdaile, D.J.; Fu, T.J.; Glatt, C.M.; Hadfield, N.; Hatzos, C.; et al. A multi-laboratory evaluation of a common in vitro pepsin digestion assay protocol used in assessing the safety of novel proteins. Regul. Toxicol. Pharmacol. 2004, 39, 87–98. [Google Scholar] [CrossRef]
Scheme 1. (a) Schematic representation of the chemical structures of polylactic acid (PLA) and polysulphone (PSF); (b) schematic representation of the structural formulae of the octahedral SCO complexes SCO1 and SCO2 (SCO1 is [Fe{N(CN)2}2(abpt)2] and SCO2 is [Fe(SCN)2(abpt)2]).
Magnetochemistry 08 00016 sch001
Figure 1. Representative SEM images of PLA-SCO2 and PSF-SCO2 composites, before ((a) and (c), respectively) and after the migration release study ((b) and (d), respectively). The dashed boxes indicate the presence of the nanowires of SCO2 into the polymer matrices, and the dashed line in PLA-SCO2 after migration indicates the void due to the release of the nanowires. In the inset of (d), the SEM image of the pristine SCO2 complex (inside the red box) is illustrated.
Magnetochemistry 08 00016 g001
Figure 2. (a) The ATR/FTIR spectra of PLA-SCO materials (SCO1 and SCO2) and (b) of PSF-SCO (SCO1 and SCO2) composites. The spectra of the pristine SCO complexes (SCO1 and SCO2) are also presented for comparison purposes.
Magnetochemistry 08 00016 g002
Figure 3. (a) The Raman spectra of PLA-SCO materials (SCO1 and SCO2) and (b) of PSF-SCO (SCO1 and SCO2) composites. The spectra of the pristine SCO complexes are also presented for comparison purposes.
Magnetochemistry 08 00016 g003
Figure 4. The percentage of SCO compounds (SCO1 and SCO2) released from PLA-SCO and PSF-SCO composites into the 50% EtOH solution as a function of time.
Magnetochemistry 08 00016 g004
Figure 5. Effects of the SCO1 on cell viability and morphology: (a) cell viability following treatment of A549 cells with 1, 10, 200, 500, 1000 μg/mL of SCO1 for 24 h following WST-1 assay. The asterisk (*) indicates statistically significant difference (p ≤ 0.05); (b) immunofluorescence analysis of F-actin (green) in A549 cells with 0 (control), 1, and 500 μg/mL SCO1. Nuclei are stained with DAPI (blue).
Magnetochemistry 08 00016 g005
Figure 6. Effects of SCO1 on ROS production. A549 cells were treated with 1 and 500 μg/mL SCO1 for 24 h, and ROS production was monitored using the fluorescent dye DCFDA/H2DCFDA. H2O2 is positive control and DMSO was utilised as negative control of the method. Asterisks (**) indicate statistically significant difference (p ≤ 0.01).
Magnetochemistry 08 00016 g006
Figure 7. Evaluation of the stability of SCO1 on stimulated gastric fluid and haemoglobin release: (a) in vitro study of SCO1 release on stimulated gastric fluid using incubation with pepsin 0.32% w/v at pH 1.2; (b) assessment of the haemolytic potential of the respective materials represented as % of red blood cells haemolysis. DMSO was utilised as the positive control of both methods. Asterisks (*), (**) indicate statistically significant differences (p ≤ 0.05 and p ≤ 0.01, respectively).
Magnetochemistry 08 00016 g007
Figure 8. The Raman spectra of (a) PSF-SCO1 and (b) PSF-SCO2 films at various temperatures; the spectral region of interest is enclosed in the red boxes.
Magnetochemistry 08 00016 g008
Figure 9. The temperature-dependent normalised Raman spectra of (a) PSF-SCO1 and (b) PSF-SCO2 composites. The Raman spectra of the composites for the transition from the LS to HS state (red line, the spectra were obtained in a heating mode) and the transition from the HS to LS state (blue line, the spectra were obtained in a cooling mode) were collected; the corresponding spectra of the pristine SCO materials are illustrated with black dashed line for comparison. Intensity ratios of the HS/LS peaks indicated in (a) and (b) are plotted as a function of temperature in (c) and (d), respectively.
Magnetochemistry 08 00016 g009
Publisher’s Note: MDPI stays neutral with regard to jurisdictional claims in published maps and institutional affiliations.

