1. Introduction
During the last century, spintronics, which deals with the spin-dependent transfer of charge carriers in solids, has been extensively developed. Recently, a new branch of spintronics, straintronics, has emerged [
1,
2,
3,
4], studying the effect of elastic deformations caused by external fields on the physical properties of various objects, including materials with a magnetic order.
The reflection and absorption of light in magnetic materials depend on magnetic fields and elastic deformations, which makes optical experiments an effective tool for studying electronic, spin, and lattice subsystems, as well as interactions between them ([
5,
6] and references therein). The fundamental magnetooptical (MO) effects in ferro- and ferrimagnets are observed in the range of fundamental absorption near the Curie temperature
TC. In this temperature range, the application of a magnetic field gives rise to a significant change in magnetization and thus affects the positions of energy bands. In a magnetically ordered phase, magnetization varies slightly at
T <<
TC and, therefore, MO effects are expected to be weak. However, recent experimental data [
7] showed that the magnetoreflection and magnetotransmission of nonpolarized light in the ferromagnetic spinel CoFe
2O
4 at
T <<
TC are sizeable and essentially depend on orientation of the magnetic field applied, thus demonstrating a direct relation with magnetostriction, which is large in this compound [
8]. Note that in the case of CoFe
2O
4, the contribution of magnetostriction to the magnetic anisotropy is anomalously large as well [
8].
A close interplay between MO and magnetoelastic properties in ferrite spinel materials with anomalously strong magnetostriction indicates that such compounds should be considered a special class of optical materials and in the corresponding field of magnetooptics can be classified as strain-magnetooptics. The literature is scanty for strain-magnetooptic properties of different materials and only CoFe2O4 has been studied so far. However, the matter in question is the discovery of similar properties in magnetostrictive magnetic materials of other compositions.
In the current work, we review the results of investigations of optical, magnetic and magnetoelastic properties, as well as the effect of magnetostriction on the absorption and reflection of nonpolarized light in the IR spectral range at different orientations of magnetic fields with respect to single crystals of CoFe2O4.
2. Materials and Methods
Single crystals of CoFe
2O
4 were grown by crucibleless floating-zone melting with radiation heating in the Institute of Metal Physics UB of RAS. The details of the method can be found in [
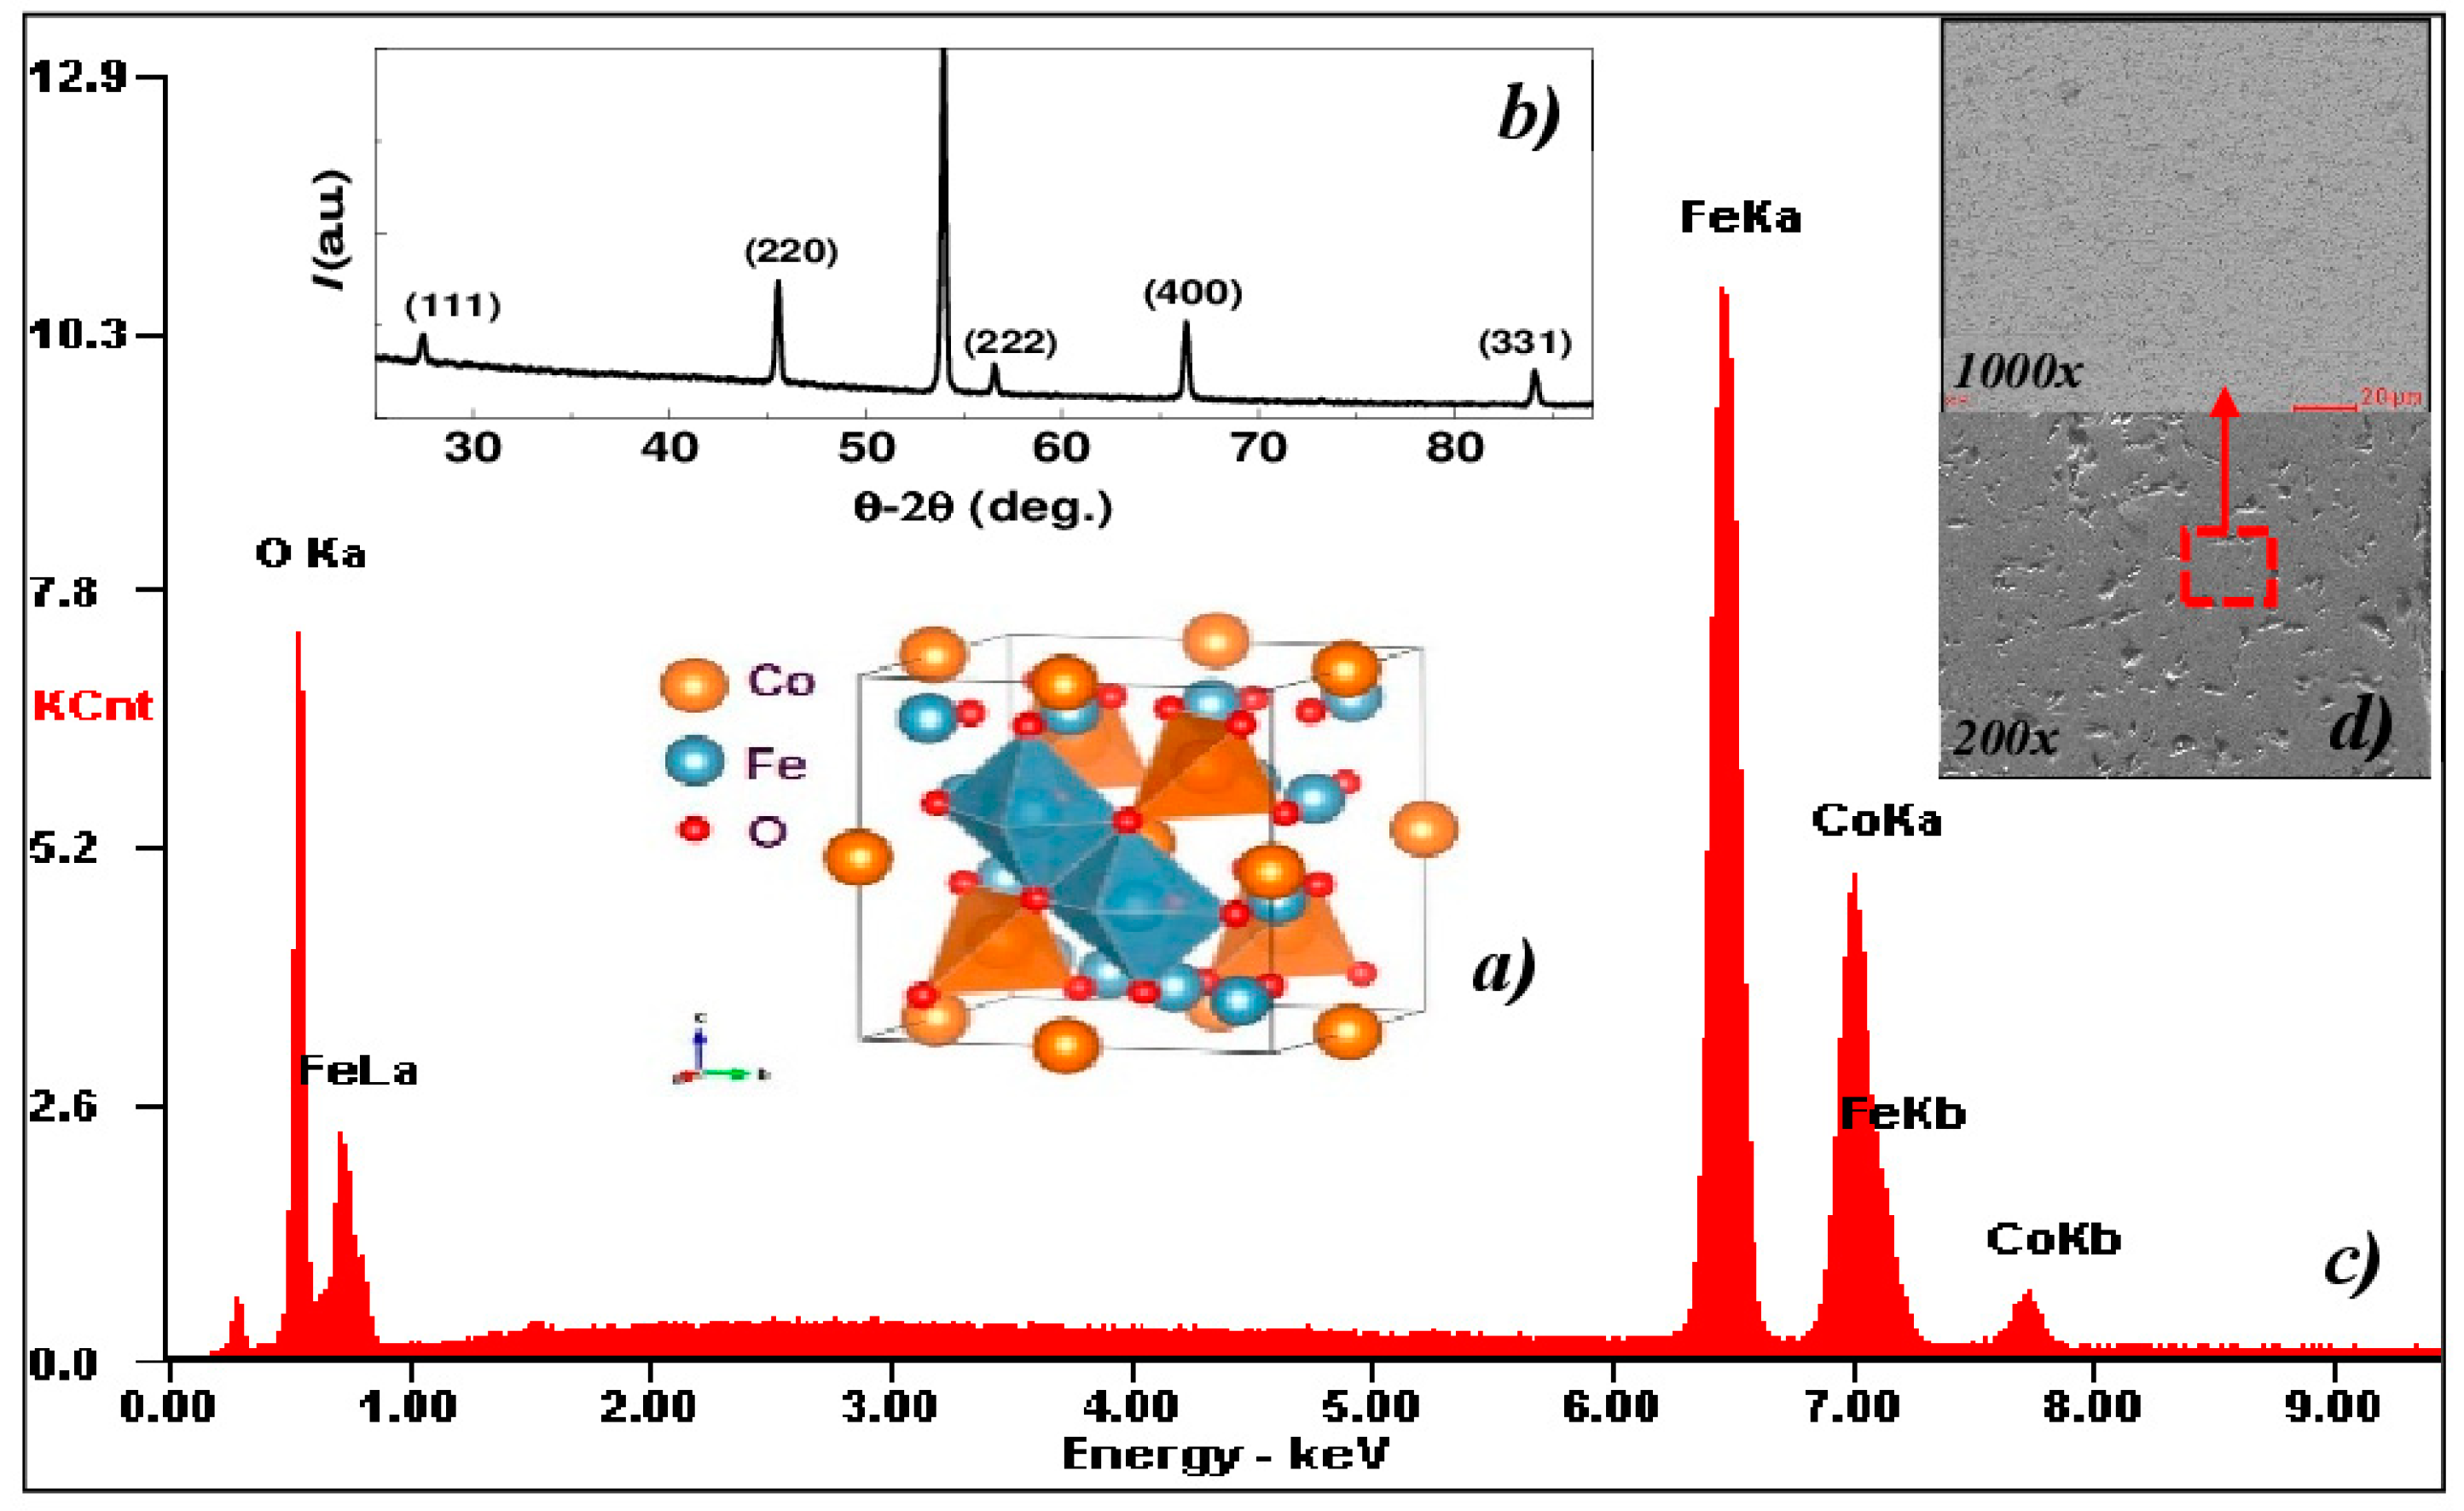
9]. The magnetic and magnetostrictive properties of the cobalt ferrites are not only determined by the basic composition, but also by structural characteristics, induced uniaxial anisotropy and cation distributions influenced by the route of ferrite production. Inset in
Figure 1a is a schematic of the crystal lattice of a single-crystal inversed spinel AB
2O
4, space symmetry group
Fd3
m, cubic syngony
Oh7. In an ideal two-sublattice ferrimagnet CoFe
2O
4, ions of 3d elements are distributed over sublattices, accounting for their valence, as follows:
Ions Co
2+ are located at A-sites of octahedra, whereas Fe
3+ exists in equal numbers at B–sites of octahedra and tetrahedra [
10]. According to the X-ray data (
Figure 1b), the lattice parameter makes up
a0 = 8.38 Å, which is close to the previous reported values
a0 = 8.39 Å [
11]. Samples of different thickness were cut from single crystals in the form of thin plates with plane (001). The plate surface was mechanically ground and polished with diamond pastes with a grain size that was gradually decreased to 0.5 µm. The comparison of chemical composition of the samples with the etalon value was conducted at different surface spots by reference-free X-ray spectral microanalysis with the help of an Inspect F scanning electron microscope equipped by an energy-dispersion X-ray spectrometer EDAX. The accelerating voltage was 20 kV. A typical EDAX spectrum of the single crystal is shown on
Figure 1c. According to the data of X-ray diffraction and electron microscopy, the samples were single-phase with a composition corresponding to the nominal one within the instrumental error (~1%); no other phases and impurities were detected. Note that the precise determination of the amount of oxygen in CoFe
2O
4 by the method of X-ray microanalysis is difficult because of the small oxygen mass. The images of the sample surface obtained by the scanning microscope with different magnifications are shown in
Figure 1d. The roughness of the sample surface was registered to be less than 1 µm. Thus, it meets the conditions and is suitable for the determination of specular reflection in the infrared spectral range.
The optical and magnetooptical properties of the samples were measured using a prism spectrometer in a wavelength range of 1 μm ≤ λ ≤ 30 μm at a temperature range of 80 to 300 K in magnetic fields up to H = 7.5 kOe.
The specular reflection of single crystals is defined as
R = IS/IAl, where
IS and
IAl are the intensities of nonpolarized light reflected from a sample and Al mirror at an angle of 7° to the normal of the sample surface. The samples had the shape of a thin plate with the dimensions 4 × 4 mm
2 and thickness
d = 400 µm. The transmission was defined as
t =
YS/
Yo, where
YS and
Yo are the intensities of the incident and transmitted nonpolarized light. This was measured on a plate with
d = 100 µm and normal light incidence. In the wavelength range 2.5 ≤
λ ≤ 5 μm, the transmission of the samples did not exceed 10%. Thus, when calculating the absorption coefficient
α(λ,H,T), a simple expression can be used:
Registration of R and t was fulfilled in the absence and presence of the external magnetic fields. The relative error of determination of R, t and α did not exceed 0.25%. Magnetoreflection of CoFe2O4 was determined as ΔR/R = (RH − R0)/R0, magnetoabsorption as Δα/α = (αH − α0)/α0 and the magnetorefractive effect as Δn/n = (nH − n0)/n0, where R0,H, t0,H, α0,H and n0,H are the coefficients of specular reflection, transmission, absorption and index of refraction of light in the absence and presence of a magnetic field, respectively. Magnetooptical measurements were carried out in two experimental geometries: (1) Faraday configuration, where the magnetic field is directed perpendicular to the plate plane and aligned with the direction of light propagation, and (2) Voigt configuration, where the magnetic field is lying in the plate plane perpendicular to the direction of light propagation. Specific Faraday rotation (Faraday effect -F) was measured using a single-beam technique at an angle θ = 45° between polarization planes of the polarizer and analyzer. The contribution of light ellipticity to the Faraday effect was ignored in view of the smallness of these corrections.
The magnetization of the samples was measured at room temperature in fields up to 17 kOe on a vibrating sample magnetometer “LakeShore 7400” at the Collaborative Access Center “Testing Center of Nanotechnology and Advanced Materials” IMP UB of RAS. Magnetostriction (Δ
l/l) measurements were carried out by the tensometric method [
8] with a strain gauge (FLA-1-11, Tokyo Co, Japan.) in a bridge circuit upon the homogeneously magnetized ferrite plate with thickness
d = 400 µm. Following this method, the external magnetic field was applied in the sample plane along and perpendicular to the [100] single-crystal axis and a gauge direction.
3. Magnetization
It is well known that CoFe
2O
4 is a ferrimagnetic material. The magnetic moments of cations in the A- and B-sites are aligned antiparallel with respect to one another, yielding a total moment of spins with ferrimagnetic ordering. In the inversed ferrites, half the Fe
3+ with magnetic moment 5μ
B was placed in A-sites and the other half in B-sites. Their moments are mutually compensated and the net moment of ferrite was due to the moment of 3μ
B of Co
2+ in the B-site. The general formula of the net magnetic moment per formula unit of spinel ferrite as a function of inversion degree x may be written as: μ = μ
B-sites–μ
A-sites= (7–4x)(μ
B), where μ is the net moment of the material, and μ
B-sites and μ
A-sites are moments of cations in B and A-sites, respectively [
12]. Thus, the cation distribution affects the magnetic properties of the ferrite.
In
Figure 2a, field dependences of magnetization
M(
H) at
T = 295 K are shown for different field orientations relative to the crystallographic axes. At H||[100], where [100] is the easy-magnetization axis [
13], the magnetization is saturated at
H ≈ 3 kOe and a further paraprocess takes place, with a linear growth up to
MS = 82 emu/g at
H = 15 kOe. This magnetization value lies in close proximity to the data reported for single crystals and films of CoFe
2O
4 [
11,
13]. A similar dependence
M(
H) was also observed in the case of H⊥[100]. If the magnetic field is oriented at an angle
φ = 45° to the axis [100], which matches to H||[110], the magnetization curve displays two steps. The extrema of the first derivative
dM/dH at
H ≈ 1.5 kOe and
H ≈ 2.8 kOe (
Figure 2) correspond to the appearance of the steps in
M(H). The condition
dM/dH = 0 fulfilled at
H ≈ 3.9 kOe corresponds to the saturation state, with
MS~78 emu/g. A step in
M(
H) at H||[111] was detected earlier in non-stoichiometric Co
0.
8Fe
2.
2O
4 at the field
H~70 kOe in [
12]. This step was followed by a jump in magnetostriction and was ascribed to the anisotropy-driven transition caused by a rotation of the magnetization vector jumping over an energy barrier. In stoichiometric single crystals of CoFe
2O
4, the step is formed already in relatively small fields
H~8 kOe [
14]. In our experiments, the step was registered in
H~1.5 kOe at room temperature and it was supposed to be caused by the distortions of the cubic symmetry of the CoFe
2O
4 crystal lattice at H||[110]. Indeed, the anisotropic energy for a cubic crystal can be written as:
where α
x,y,z are the directional cosines of the magnetization vector. The
z axis is directed along the normal to the plate surface, i.e., along the [001] direction.
Since the magnetization vector rotates in plane (001), we have
αz = 0. In this case, magnetization projection
MH onto the magnetic field direction in our experiment (H <
HA is applied in the plane of the sample) is the solution to the equation:
where
mH = MH/MS,
MS being the saturation magnetization and
HA = 2K1/MS is the anisotropy field.
Evidently, no steps are described by Equation (3), which supports the assignment of the step at H||[110] to the distortions of the crystal symmetry in our crystal.
It should be noted the coercive fields of a single crystal are much smaller than those measured on polycrystalline materials, because there is no influence of grain size and grain boundaries in a single crystal. The coercivity of the crystal was
HC ≈ 80 Oee at
T = 295 K, which was close to reported data [
11]; however, it depends on the orientation of the magnetic field relative to the crystallographic axes (
Figure 2b). Such behavior of
HC reflects the cubic anisotropy of the CoFe
2O
4 single crystal [
8]. The value of
HC is controlled by the cation distribution on the surface and in the bulk of a single crystal and can be lowered by annealing and subsequent etching of the sample [
8,
12]. Decreasing the temperature to 80 K increases
HC to ~500 Oe (
Figure 2c), while the saturation magnetization of the CoFe
2O
4 crystal is virtually unchanged. This indicates the complex competing nature of the contributions of the magnetocrystalline and magnetoelastic energies to the magnetic anisotropy of the crystal. Additional contributions from both the shape and growth anisotropy of the crystal, as well as the error in the orientation of the crystal, lead to smearing and the inaccurate reproduction of the positions of the maxima of the observed angular dependences of the magnetization (
Figure 2b).
4. Magnetostriction
Magnetostriction is an intrinsic property of magnetic materials. Due to the magnetic exchange, these materials change their shape when a magnetic field is applied. Magnetostriction is based on the coupling of the magnetic moment to the lattice. In a single crystal, magnetostriction is a tensor property which depends on the crystal structure and symmetry of the lattice [
8,
10,
12].
Figure 3 shows the field dependences of magnetostriction Δ
l/l measured along the [100] axis. The obtained value (Δ
l/l)
100 exceeds those for nonstoichiometric and alloyed single crystals, but is lower in magnitude as compared to the magnetostriction of crystals annealed in magnetic field [
8,
12,
15,
16]. The magnetization hysteresis due to the defects in the CoFe
2O
4 crystals was accompanied by a weak hysteresis of magnetostriction. At
T = 295 K <<
TC = 812 K, in the region of paraprocess, the magnetization almost did not change, which indicates that the volume of magnetostriction was small and can be neglected.
In the case of a cubic ferromagnet, the relative elongation along the axis specified by direction cosines
βx,y,z can be defined as [
17]:
In this study, the measurements of Δ
l/l were performed along the
x-axis in the in-plane magnetic field; therefore,
αz = βy= βz = 0,
βx = 1. Consequently, (Δ
l/l)
100 =
λ100 at H||[100] and (Δl/l)100 = −λ100/2 at H⊥[100]. Indeed, the magnetostriction (Δ
l/l)
100 for studied crystals of CoFe
2O
4 has the opposite sign in the case of H||[100] and H⊥[100]. The first derivative of magnetostriction (dashed lines in
Figure 3) demonstrates saturation in a field
HS ≥ 3 kOe, which is close to the saturation field (
Figure 2). The maximal magnetostriction value at H||[100] makes up (Δl/l)100 ≈ −624·10−6. This is almost three times as high as (Δl/l)100 ≈ +221·10−6 at H⊥[100]. The obtained discrepancy, as well as the steps on the
M(H) curve, point out to the distortions of the cubic crystal structure.
At H||[100], the (Δ
l/l)
100 sharply grew starting with only
H = 1.6 kOe. When H⊥[100], the growth of (Δ
l/l)
100 was observed from
H = 0 by the power law. The peculiarities of the magnetostriction of the crystal manifest clearly through the different behavior of the first derivatives of (Δ
l/l)
100 with extremes near 1.6 kOe (
Figure 3). The small values of (Δ
l/l)
100 at
H < 1.6 kOe were accounted for by the fact that the growth of domains with the magnetization aligned with field was compensated by a decrease in the size of domains with opposite magnetization. Meanwhile the total magnetic moment of the sample gradually increased.
It is commonly accepted that in cubic ferrimagnets the magnetostriction contribution Δ
K to the magnetic anisotropy constant
K1 does not exceed several percent [
8,
18,
19]. According to Bonnenberg and colleagues [
16], the magnetostriction contribution to
K1 is given by:
where the elastic constants for CoFe
2O
4 make up
c11 = 2.57·10
12 erg/cm
3,
c12 = 1.5·10
12 erg/cm
3 and
c44 = 0.85 × 10
12 erg/cm
3 [
20].
Given
λ111 = 120 × 10
−6 [
8] and
λ100 = −654 × 10
−6, we can calculate Δ
K ≈ 1 × 10
6 erg/cm
3. Taking the data of
Figure 2a, we obtain
K1 ≈ 2 × 10
6 erg/cm
3. Thus, in our case, the magnetostriction contribution to the magnetic anisotropy constant Δ
K/K1 of CoFe
2O
4 crystal makes up ~1/2, which is anomalously large.
5. Optical Properties
The spectrum of specular reflection
R for a single crystal of CoFe
2O
4 (
Figure 4a) was formed by the absorption edge in the short-wave range at
λ < 2 µm. Furthermore, a weak band at
λ < 3 µm, a frequency-independent (dispersionless) interval (
R~14.7%) in the range 3 µm <
λ< 12 µm and phonon bands at wavelength
λ = 16.4 µm (
E1 = 609 cm
−1) and
λ = 24.2 µm
(E2 = 413 cm
−1) [
21] were also observed.
The band
E1 with symmetry
T1u arises due to Co–O ion oscillations in the octahedral sublattice [
22], whereas
E2(
T1u) is predominantly related to the oxygen-ion oscillations in the tetrahedral sublattice [
23]. The short-wave edges of the bands
E1 и
E2 were distorted by the contribution of weak additional bands. The room-temperature resistivity of the samples was about ~10
5 Ω∙cm, hence, free charge carriers do not contribute to the reflection spectrum. This fact helped to simplify the application of the Kramers–Kronig method for processing the spectra of optical conductivity
σopt (light absorption) and the calculation of refraction indices from the reflection spectra [
24]. In the spectrum of
σopt (
Figure 4b), additional phonon bands at
λ = 22 µm
(E3 = 455 cm
−1) and
λ = 17.7 µm
(E4 = 565 cm
−1) become distinctly pronounced, which corresponds to data reported by Bujakiewicz-Koronska et al. [
23]. In the vicinity of the fundamental absorption edge at
λ~3 µm, the impurity-absorption band appears in the spectrum of
σopt (
Figure 4b), which was ascribed in to elastic modes [
25].
In the determination of the refraction index
n of the single-crystal CoFe
2O
4, an important part was played by the dispersionless interval of R(
λ). In the case of normal light incidence, it can be estimated from
n∞ = (1 + √
R)/(1 − √
R) ≈ 2.04. In the range 3 µm <
λ< 12 µm, it varies within the limits 1.8
< n < 2 (inset on
Figure 4). These values are less than
n = 2.2 as obtained in [
21], but exceed
n = 1.72 for a classical spinel. The spectral ranges with strong
n dispersion at
λ < 3 µm and
λ > 12 µm reflect impurity absorption and the phonon spectrum, respectively. Our spectra of
R,
σopt and
n for the single CoFe
2O
4 crystal (
Figure 4) supplement and rectify the reported data from [
21,
26].
The measured absorption spectrum of CoFe
2O
4 α(
λ) agrees well with the spectrum of optical conductivity (
Figure 4 and
Figure 5). A sharp growth of α at
λ < 2 µm was provided by the fundamental absorption edge at
λ~0.95 µm
(Eg = 1.18 eV) connected with indirect transitions from the hybridized
dCo +
pO– states of valence band at the
X point of Brillion zone to the
dFe– state of the conduction band at the
Γ point [
27]. While temperature decreases to 80 K (inset in
Figure 5), the absorption edge shifts toward the shorter wavelengths by 0.1 µm (+0.08 eV); this value is in close proximity to that for films from [
28,
29].
At
λ1 = 2.6 µm (0.48 eV), the spectrum exhibited band
1, which was also presented in the spectra of
σopt (
Figure 4b) and was conditioned by the impurity absorption. In [
30], it was established that oxygen surrounding the ions Co
2+ and Fe
3+ endures octahedral distortions, stronger in the case of Co
2+. We suppose that band
1 can be formed by transitions from the valence band to the states
VO (oxygen vacancy) +3d(Fe
3+) and
VO+3d(Co
2+), similar to the impurity absorption in single crystal of Hg(Cd)Cr
2Se
4 [
31]. On decreasing temperature, the intensity of band 1 also decreased (left inset in
Figure 5), which was related to the temperature-induced shift of the absorption edge. In the wavelength range 3 <
λ < 15 µm, the absorption spectrum exhibited a broad band with a maximum at
λ6 = 12.5 µm (0.1 eV) and a fine structure consisting of small bands centered at
λ2 = 6.1 µm (0.2 eV),
λ3 = 7 µm (0.17eV),
λ4 = 8.4 µm (0.14 eV) and
λ5 = 10 µm (0.12 eV) (
Figure 5). Cooling CoFe
2O
4 crystals to
T = 80 K resulted in better resolution of the fine structure (data not shown). The positions of these bands are close to those of the impurity bands, which were observed in the spectrum of CoFe
2O
4 crystals doped by ions of Zn, Zr or Cd [
26]. The increase in the absorption at
λ > 15 µm was attributed to the phonon spectrum.
The inset in
Figure 5 shows that the magnetic field of 7.5 kOe led to a small blue shift of the absorption edge (~10 meV) at
T = 295 K. There are no free charge carriers in CoFe
2O
4, so the value exchange interaction and the shift of the absorption edge were significantly lower in comparison with, for example, the ferromagnetic spinel Hg(Cd)Cr
2Se
4 [
32]. Another important finding was the detection of the red shift of the MIR-band at
λ = 2.6 µm (~15 meV) under the same conditions (right inset in
Figure 5). The field sensitivity of the MIR band confirms the connection of this band to the 3d(Fe
3+) and 3d(Co
2+) states, as in the case of donor states in Hg(Cd)Cr
2Se
4 formed by vacancies of V
Se+Cr
2+ [
32]. The effect of magnetic field also leads to an insignificant shift and change in intensity of the impurity bands in this range. Thus, in single-crystal CoFe
2O
4, the magnetic field influences not only the absorption edge but the impurity-absorption bands as well. This effect can be traced more distinctly when analyzing magnetoreflection and magnetoabsorption spectra.
6. Magnetooptical Properties
In a magnetic field exceeding the saturation field (
HS =3 kOe), the coefficients of reflection, absorption, and refraction of CoFe
2O
4 were changed, i.e., MO effects manifest themselves in the IR range [
7,
32]. The coefficients
R and
α depend on both the magnetic field strength and its direction relative to the crystallographic axes of the sample.
Let us treat the case when magnetization vector lies in the plane (001). For the nonpolarized light, the dependence of
α on the field direction for a sample in the single-domain state can be written in the form
where
A and
B depend on the light wavelength, temperature, and field strength
H; |
B|
<< A,
φ is the angle between axis [100] and magnetization direction.
If the field is applied to a multi-domain sample, the
is replaced by
, where
means averaging over magnetization directions in a multi-domain structure. In the common case, the magnetoabsorption of light Δ
α/α can then be written in the form:
where ΔA(H) = A(H) − A(H = 0) << A(H = 0).
If the field applied exceeds Hs, . In a case in which ΔA and B are the same order of magnitude, the strong dependence of Δα/α, as well as ΔR/R and Δn/n on the angle φ can be observed.
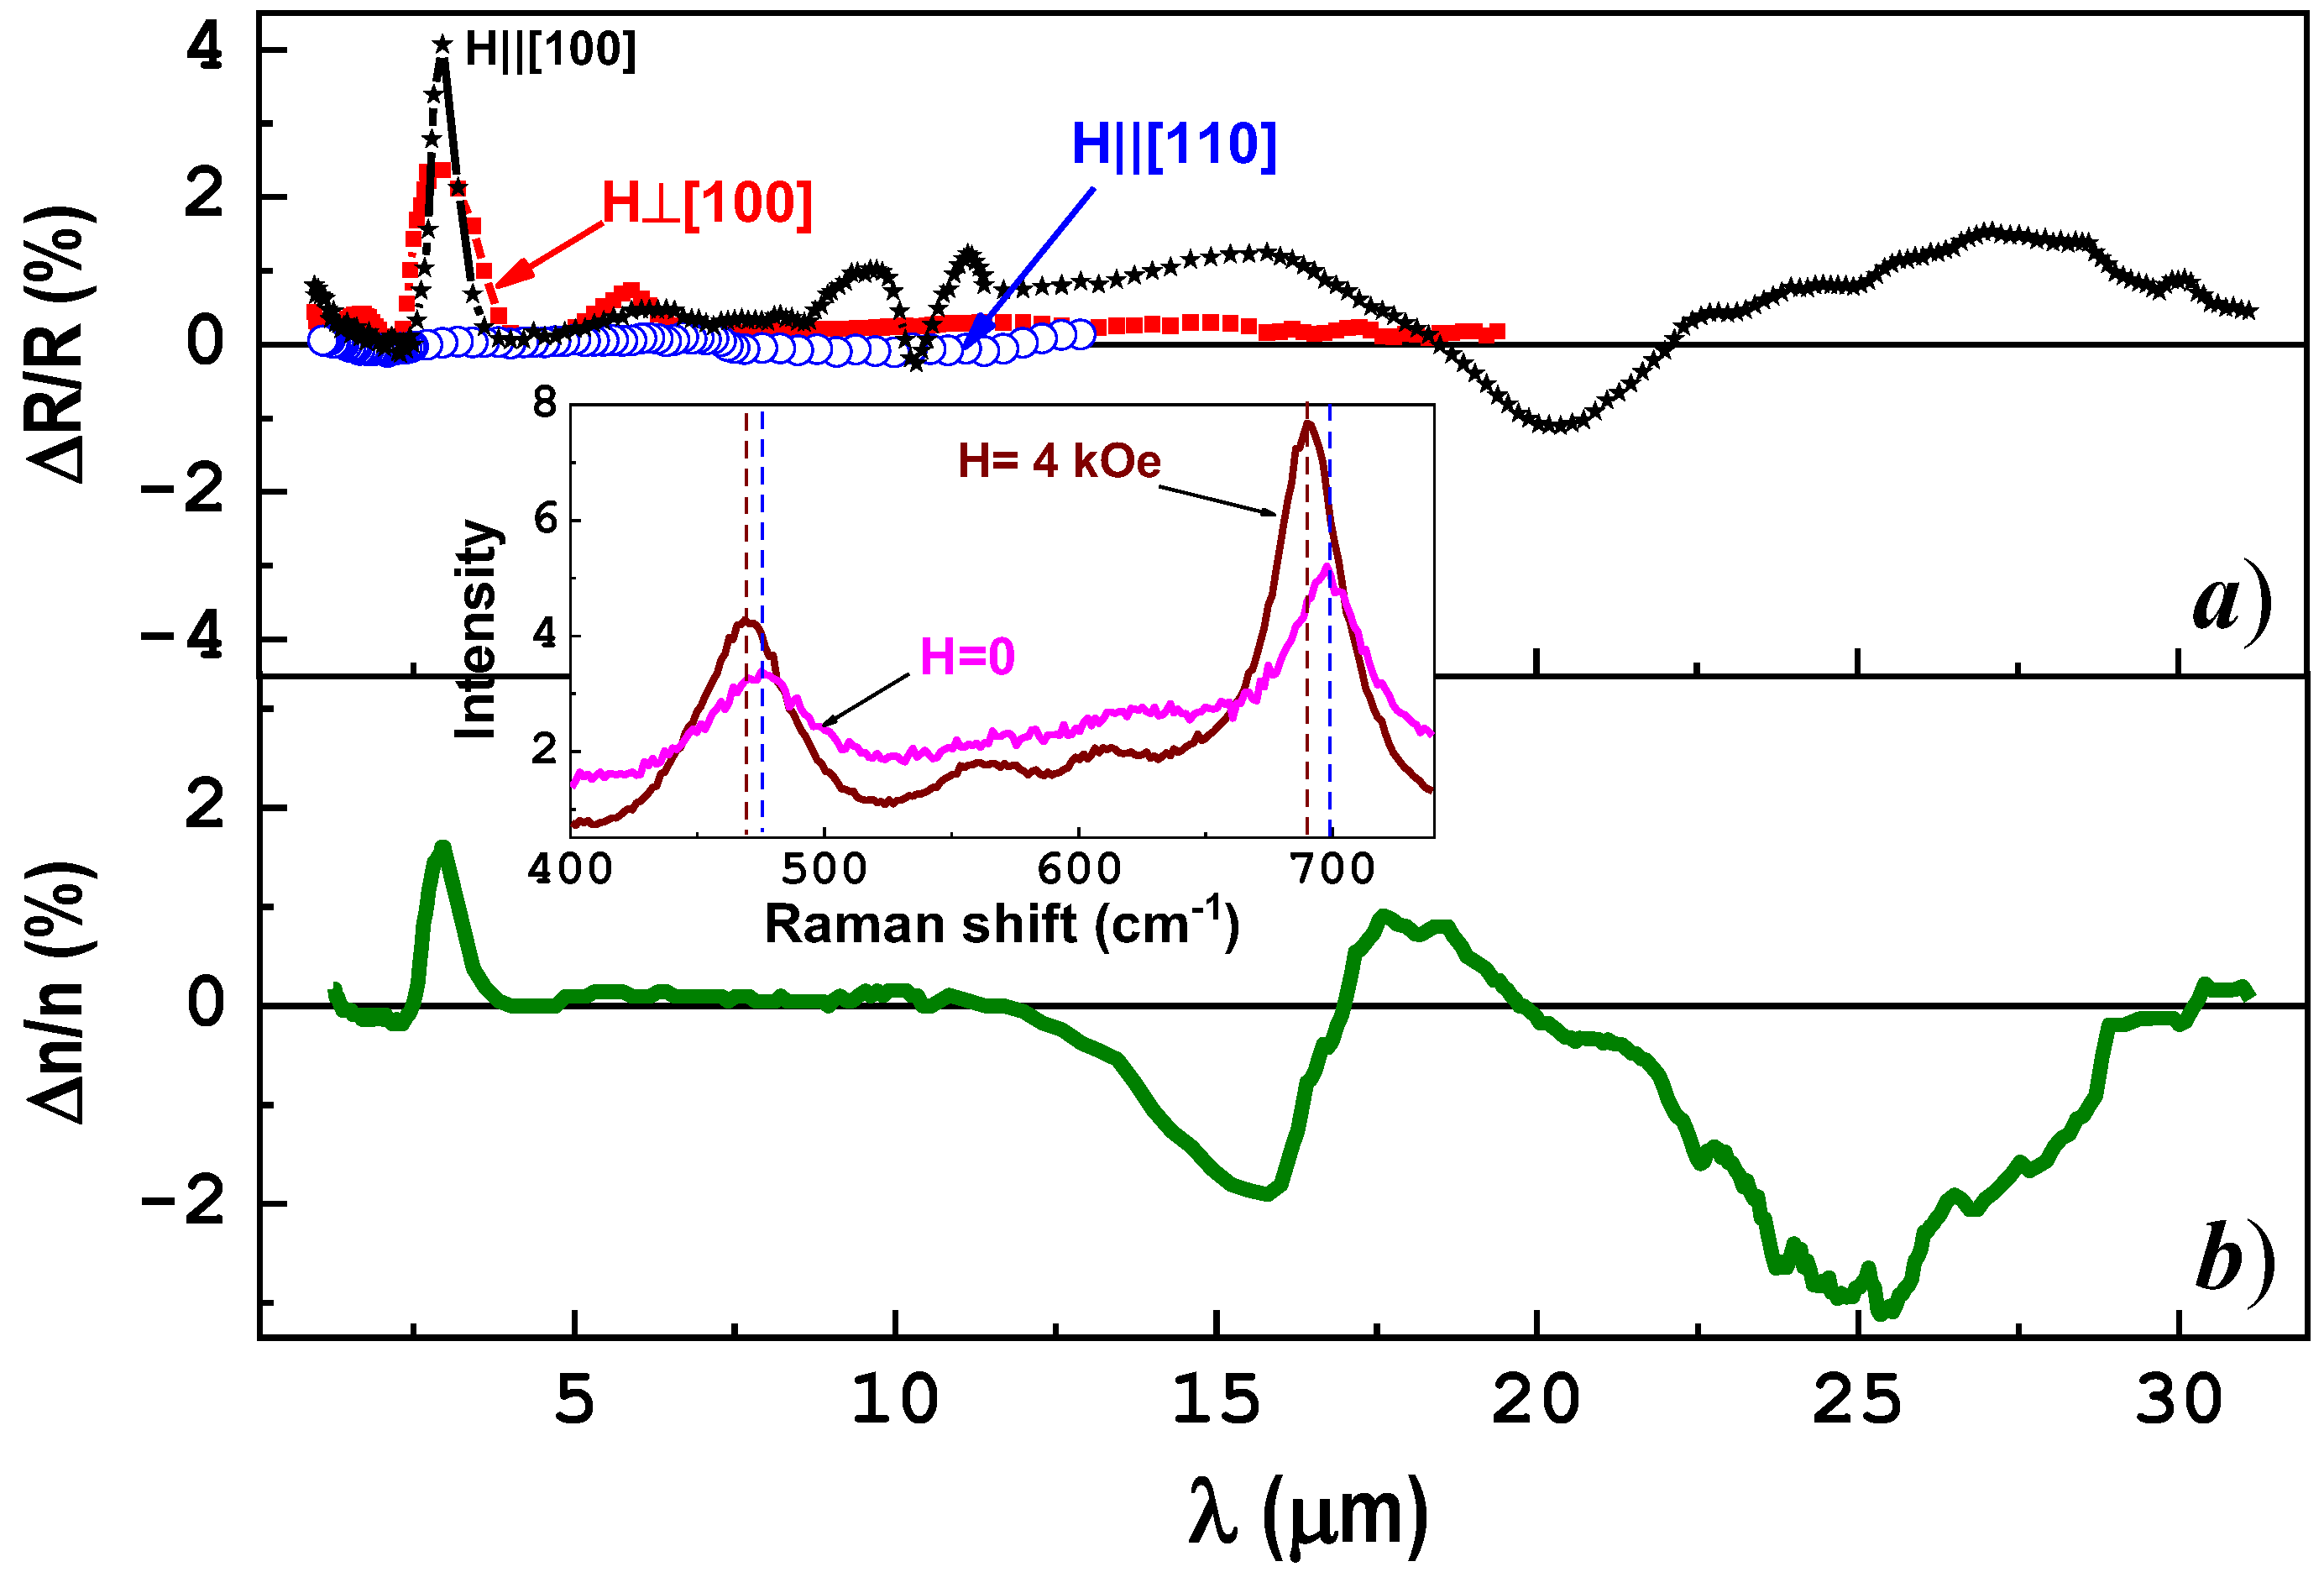
As shown in
Figure 6, the spectral shape and the value of magnetoreflection essentially depend on orientation of magnetic field relative to the crystallographic axes. In the range λ < 1.5 µm, the dependence Δ
R/
R(λ) demonstrates a growth connected with the shift of the fundamental absorption edge under the action of the field independently of its direction. An intense band Δ
R/R at
λ~2.9 µm, weak bands at
λ~6 µm and a feature at
λ~ 10–12 µm arise due to changes in the intensity and position of the impurity-absorption bands (
Figure 6a). At H||[100], the value of Δ
R/R was almost twice as high as at H⊥[100] and can reach ~4%. In the case of H||[110], magnetoreflection tends to zero within the accuracy of experiments. Features of Δ
R/R at
λ > 16 µm were ascribed to the impact of magnetic field on the phonon spectrum. More distinctly they are pronounced in the changes of Raman spectra for the CoFe
2O
4 single crystal under application of an external magnetic field (inset in
Figure 6). This is a direct evidence of a close interplay of phonon and magnetic subsystems, which was earlier observed in [
33].
The presence of a weakly dispersed spectral part of
n(λ) (
Figure 4c) was helpful in the determination of the magnetorefractive effect (Δ
n/n). The maximum of Δ
n/n~ +1.5 × 10
−3 in CoFe
2O
4 at H||[100] (
Figure 6b) is, for example, higher by an order of magnitude than the theoretically predicted Δ
n/n for the orthoferrite YFeO
3, whose magnetostriction is also lower by almost an order of magnitude than that of CoFe
2O
4 [
6]. Thus, we can suggest that the higher value of Δ
n/n for CoFe
2O
4 can be accounted for by its pronounced magnetoelastic properties.
Figure 7 demonstrates the very complicated shape of magnetoabsorption spectra Δ
α/α in CoFe
2O
4. It is worth noting the close correlation between the peculiarities in Δ
α/α and the absorption spectra (
Figure 5). These peculiarities arise due to shifting of the fundamental absorption edge and changes in the intensity and position of impurity-absorption bands under the action of a magnetic field.
According to the data on the band structure of CoFe
2O
4 [
27,
28], the changes of absorption coefficient in the magnetic field were caused by crystal distortion along the fourth-order axis induced by magnetostriction. Let us estimate Δ
α/α resulting from the changes in the energy of the absorption edge due to magnetoelastic deformations. As mentioned above, in the case of linear magnetostriction, the crystal volume did not change and, therefore, the shift of the conduction band bottom located at the Γ point of the Brillouin zone is equal to zero. The top of valence band is located at the X point. Therefore, in fields, which are above the saturation field and directed along [100] crystal axis, the shift of the valence band edge can be estimated as Δ
εν = Ξu|
λ100|, where
Ξu is the deformation potential. The magnetoabsorption is then Δ
α/α = [
α(
E +Δ
εν) −
α(
E)]/
α(
E) ≈ (dln
α(
E)/d
E) × Δ
εν. In the region of the absorption edge for
α = 10
5 cm
−1 at
E ≈ 2 eV [
30], the first derivative is ∼0.6 eV
−1. The value of |
Ξu| makes up 10–20 eV [
34], |
λ100| ≈ 6 × 10
−4 at room temperature [
8]. Hence, in the vicinity of the absorption edge, the value Δ
α/α should be about 1%. This estimated value of Δ
α/α is close to the experimental data for the case of a Voigt configuration (
Figure 7b) and smaller by an order of magnitude than that in the case of a Faraday configuration (
Figure 7a).
Such a difference can be caused by an additional contribution of “parasitic” mechanical stresses, which arise in the Faraday configuration and lead to a poorly controlled deformation of the sample and overestimation of the data gained. In the Voigt configuration, when the field lies in the sample plane, such stresses are minimal.
Unlike in the Faraday configuration, in the Voigt configuration the positions of impurity-absorption bands are well distinguished and are shown by arrays (
Figure 7b). In accordance with (7), the values of Δ
α/α and Δ
R/R essentially depend on the field direction relative to the crystallographic axes. In the case of H||[100], the magnetoabsorption reaches its maximal values, for instance, at room temperature Δ
α/α~5% at
λ~2.9 µm. Upon cooling to 80 K, the value of Δ
α/α is enhanced to 12%. However, in the case H||[110], the values of Δ
α/α and Δ
R/R were almost close to zero (
Figure 6a and
Figure 7b). Thus, in the magnetostrictive spinel CoFe
2O
4, the shape of the Δ
α/α and Δ
R/R spectra was controlled by the angle between axis [100] and magnetization direction.
The magnetoabsorption and magnetoreflection effects occur in natural light and have nothing in common with traditional MO effects in polarized light—say, Faraday (
F) and Kerr effects, respectively. However, as shown in
Section 5,
F can contribute to Δ
α/α if the light is partially polarized in the optical setup. In view of this, in
Figure 7c, the spectrum of specific
F for CoFe
2O
4 at
T = 295 K is shown. It was formed by a deep negative extreme at
λ = 1.9 µm with
F ≈ −1300°/cm ascribed to transitions from the Co
2+ to Fe
3+ state [
35]. In the range of 2 <
λ< 9 µm, the spectrum of Faraday rotation has a positive maximum
F~ +120 °/cm at
λ ≈ 3 µm and negative one
F ~−200 °/cm at
λ ≈ 6 µm. The complicated spectral shape of the Faraday effect in the middle IR range is by no means characteristic of a spinel [
36] and is likely due to the impurity states and contribution of the frequency-independent
F.
The temperature dependences Δ
α/α(
T) and
F(
T) reflect the behavior of the optical gap (
εg) and magnetic anisotropy constant for CoFe
2O
4 [
37]. Blue shift of the absorption edge upon cooling the crystal leads to a decrease in the effects (insets in
Figure 7). At
λ = 6.5 µm, the influence of the absorption edge on Δ
α/α was essentially reduced, which results in the appearance of a weak reverse temperature course in the range of impurity absorption. The plateau on the dependences Δ
α/α(
T) and
F(
T) at
T < 120 K is probably traceable to the anisotropy constants being temperature independent [
38].
8. Conclusions
The study of the magnetic, magnetoelastic, optical and magnetooptical properties of single crystals of the ferromagnetic spinel CoFe2O4 highlighted the peculiarities related to the interplay of magnetoelastic and magnetooptical properties of the material. These peculiarities are pronounced in the effects of magnetoreflection and magnetoabsorption (~6% in H~3.5 kOe) of the natural (nonpolarized) light in the infrared spectral range from 1 µm to 30 µm.
It was shown that the strain-magnetooptical properties of CoFe2O4 manifest themselves as a correlation of the field dependences of magnetostriction, magnetoreflection and magnetoabsorption. These effects reach large values in the IR range and were ascribed to the sensitivity of the fundamental absorption edge and impurity-absorption bands to magnetoelastic properties of the crystal. The correlation takes place at different orientations of the magnetic field relative to the crystal surface—in the Faraday and Voigt geometries of experiment—and to the crystallographic axes. In the Faraday configuration, a contribution of the Faraday effect to the magnetoabsorption was observed due to the partial polarization of light in the optical setup. The features of the field dependences of magnetoreflection and magnetoabsorption in the Faraday configuration was related to the additional contribution of mechanical stresses.
The anomalously large (on the order of 50%) contribution of magnetostriction to the magnetic anisotropy constant K1 is responsible for the strain-magnetooptical effects in CoFe2O4. The effect of magnetostriction on the magnetooptical properties of CoFe2O4 was found to be indirect. Due to the magnetostriction, an external magnetic field gives rise to B-sublattice distortion and thereby changes the electronic states of Co2+ ions, which in turn results in the observed changes in the absorption spectrum.
Finally, the results of investigations of the strain-magnetooptics in ferromagnetic CoFe2O4 single crystals are imperative in understanding and studying similar properties in magnetostrictive magnetic materials of other compositions.


 ,
, 


