Disturbance of the Conformation of DNA Hairpin Containing the 5′-GT-3′ Binding Site Caused by Zn(II)bleomycin-A5 Studied through NMR Spectroscopy


Abstract
:
1. Introduction
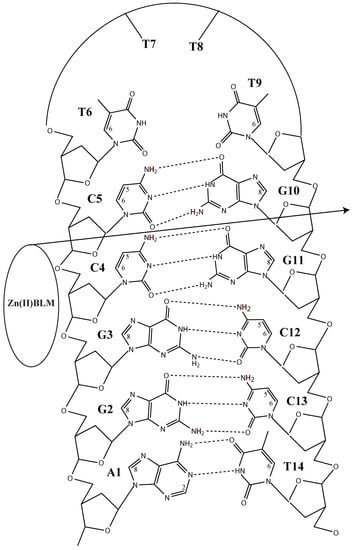
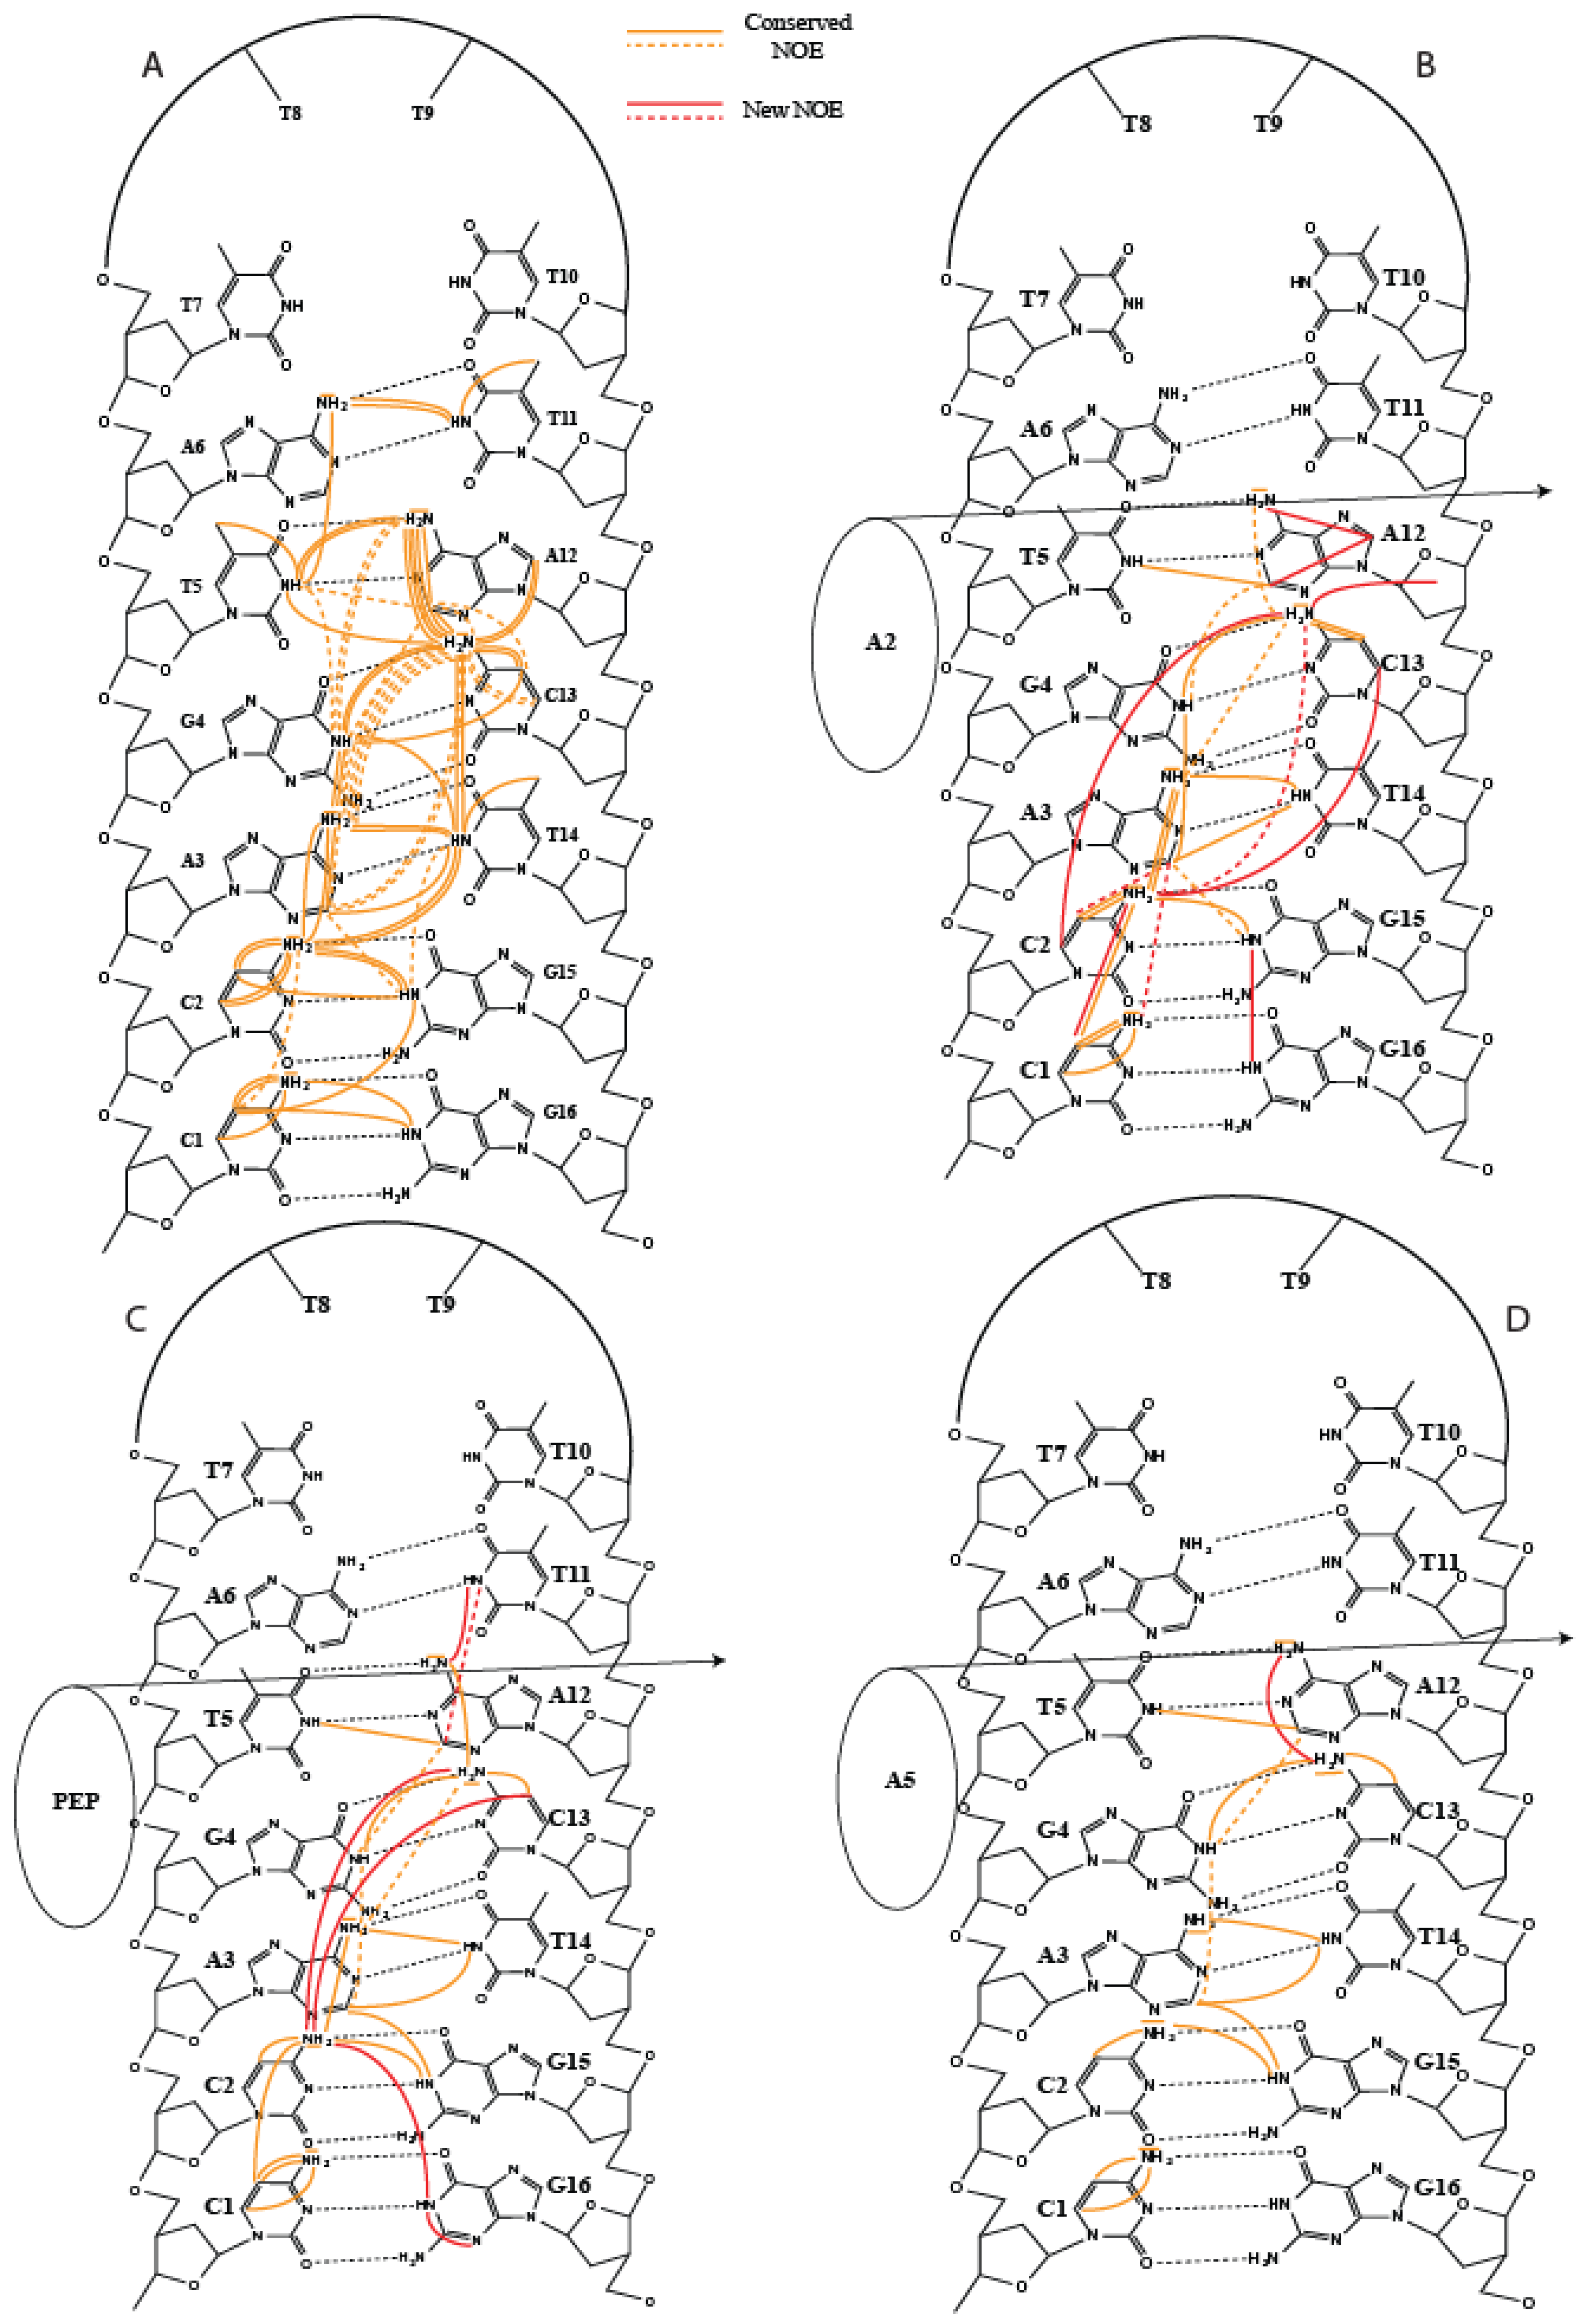
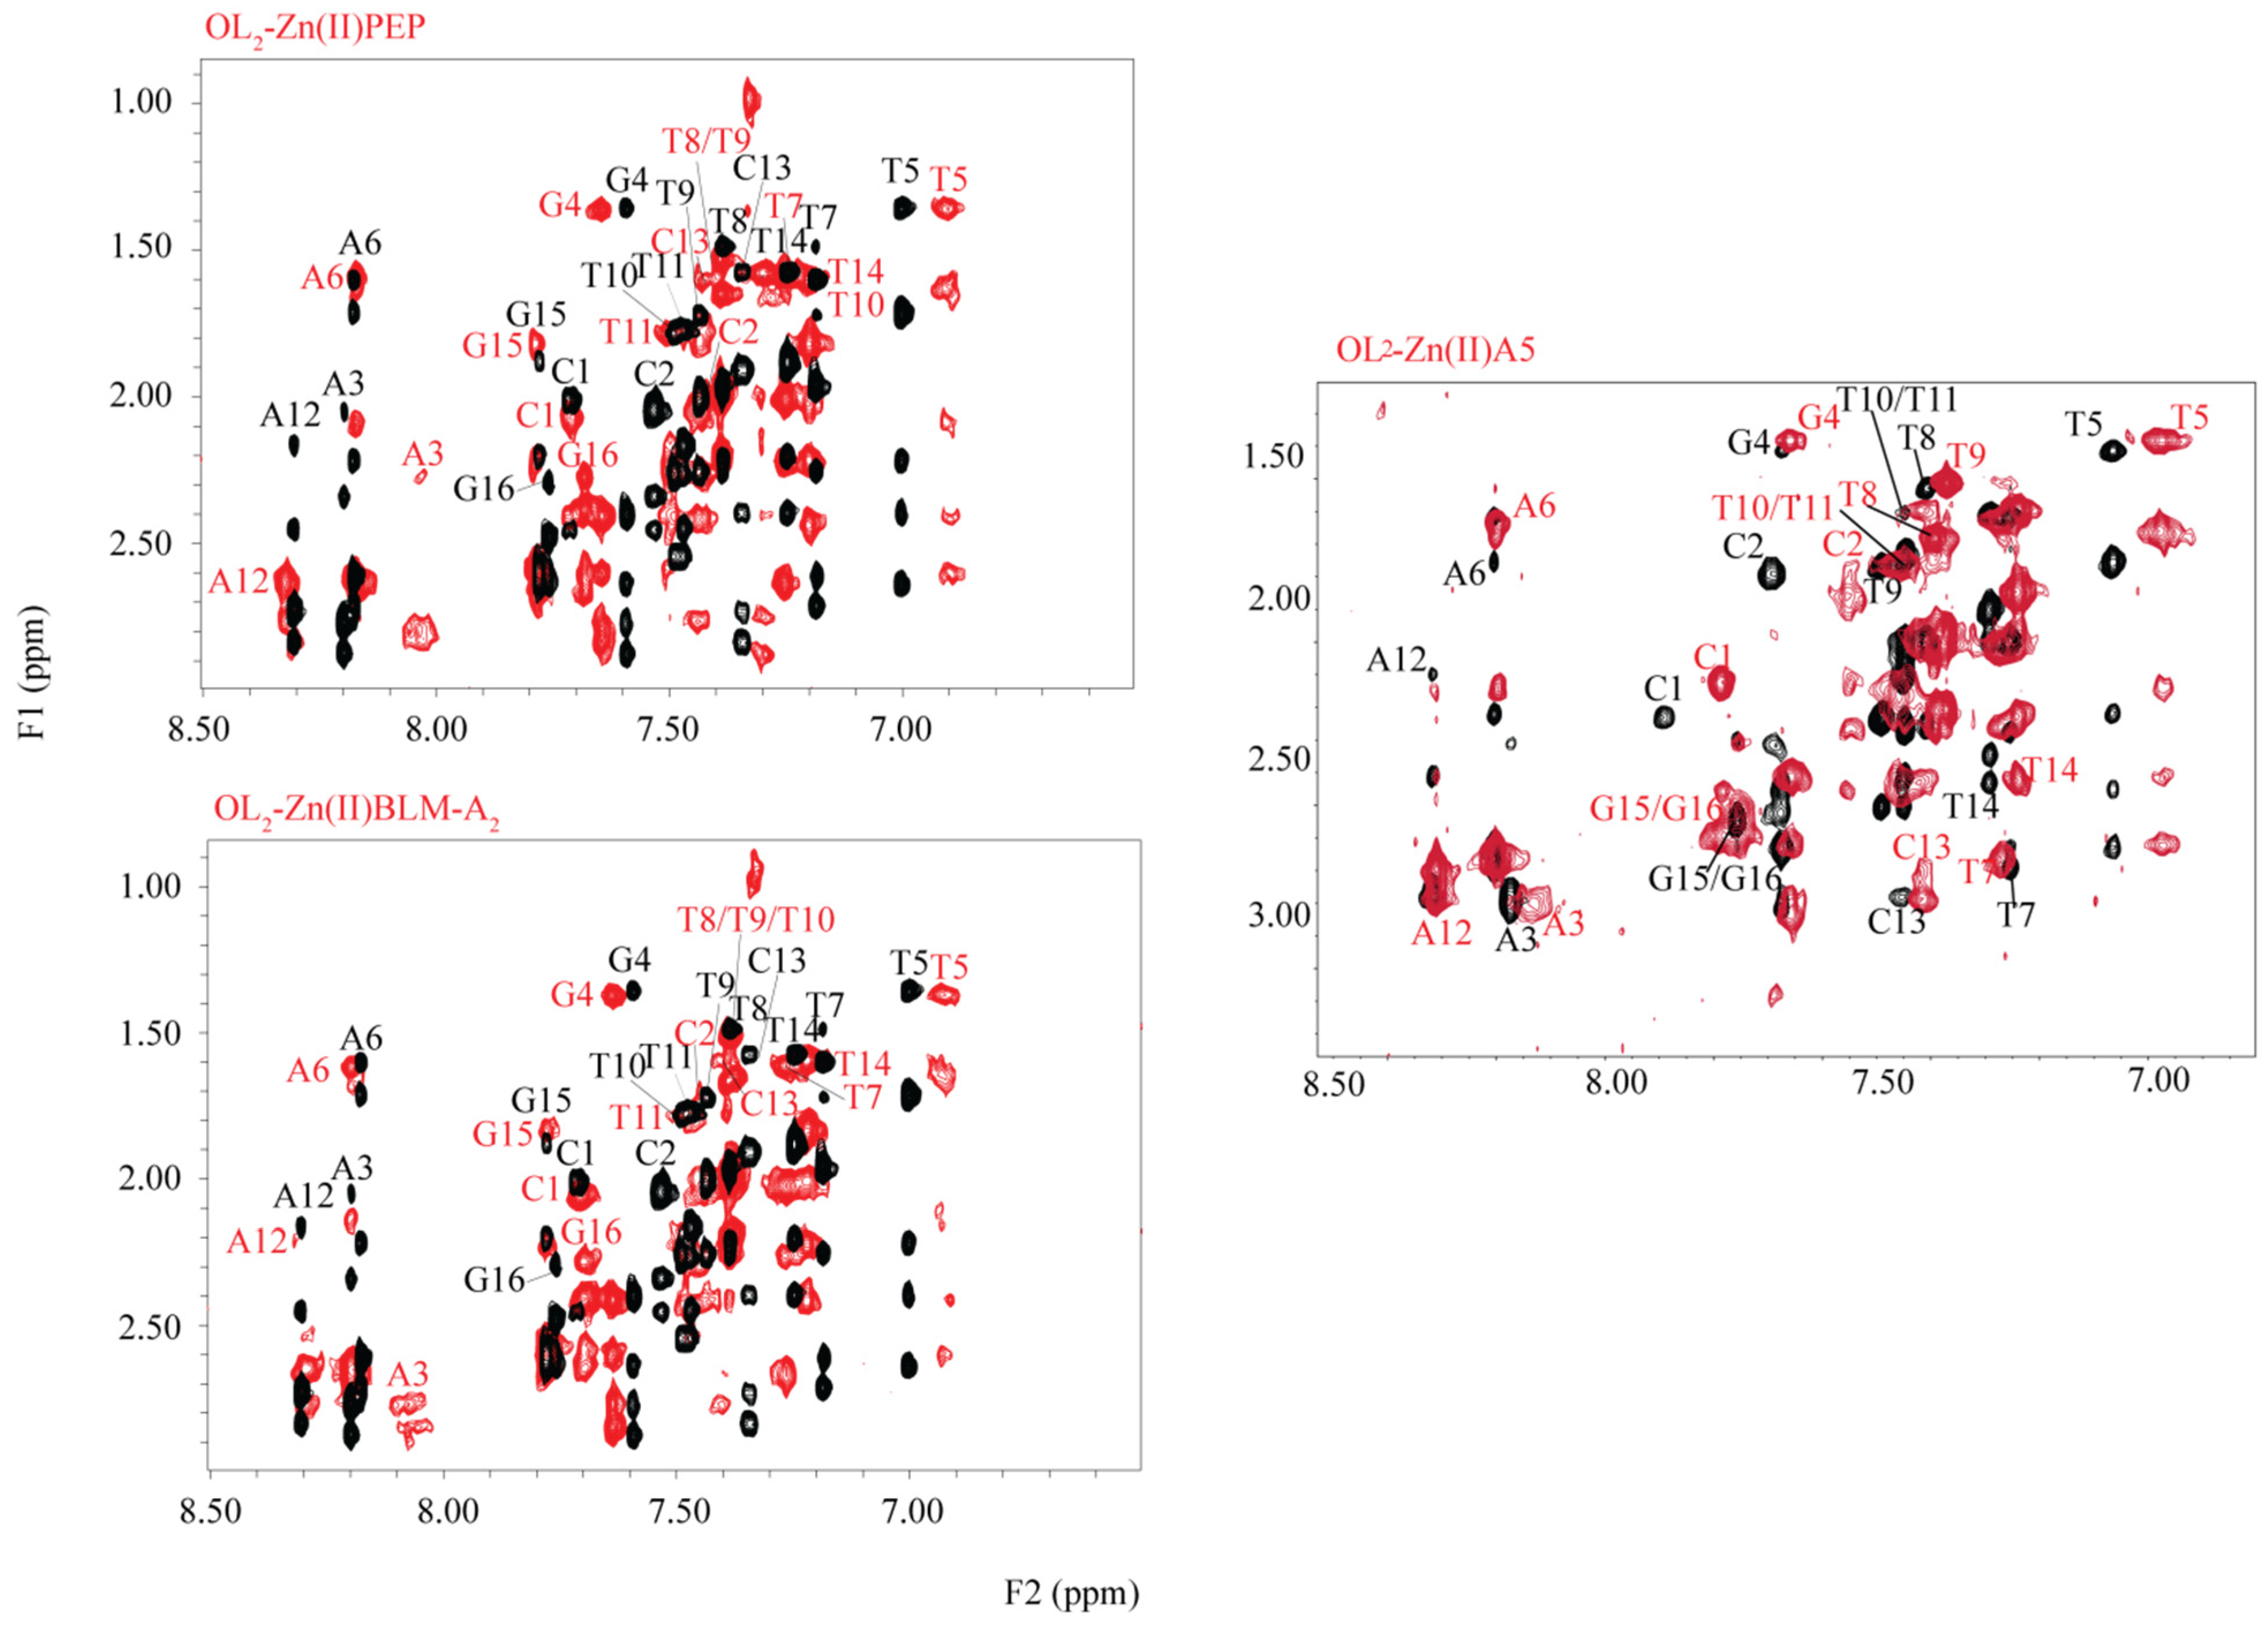
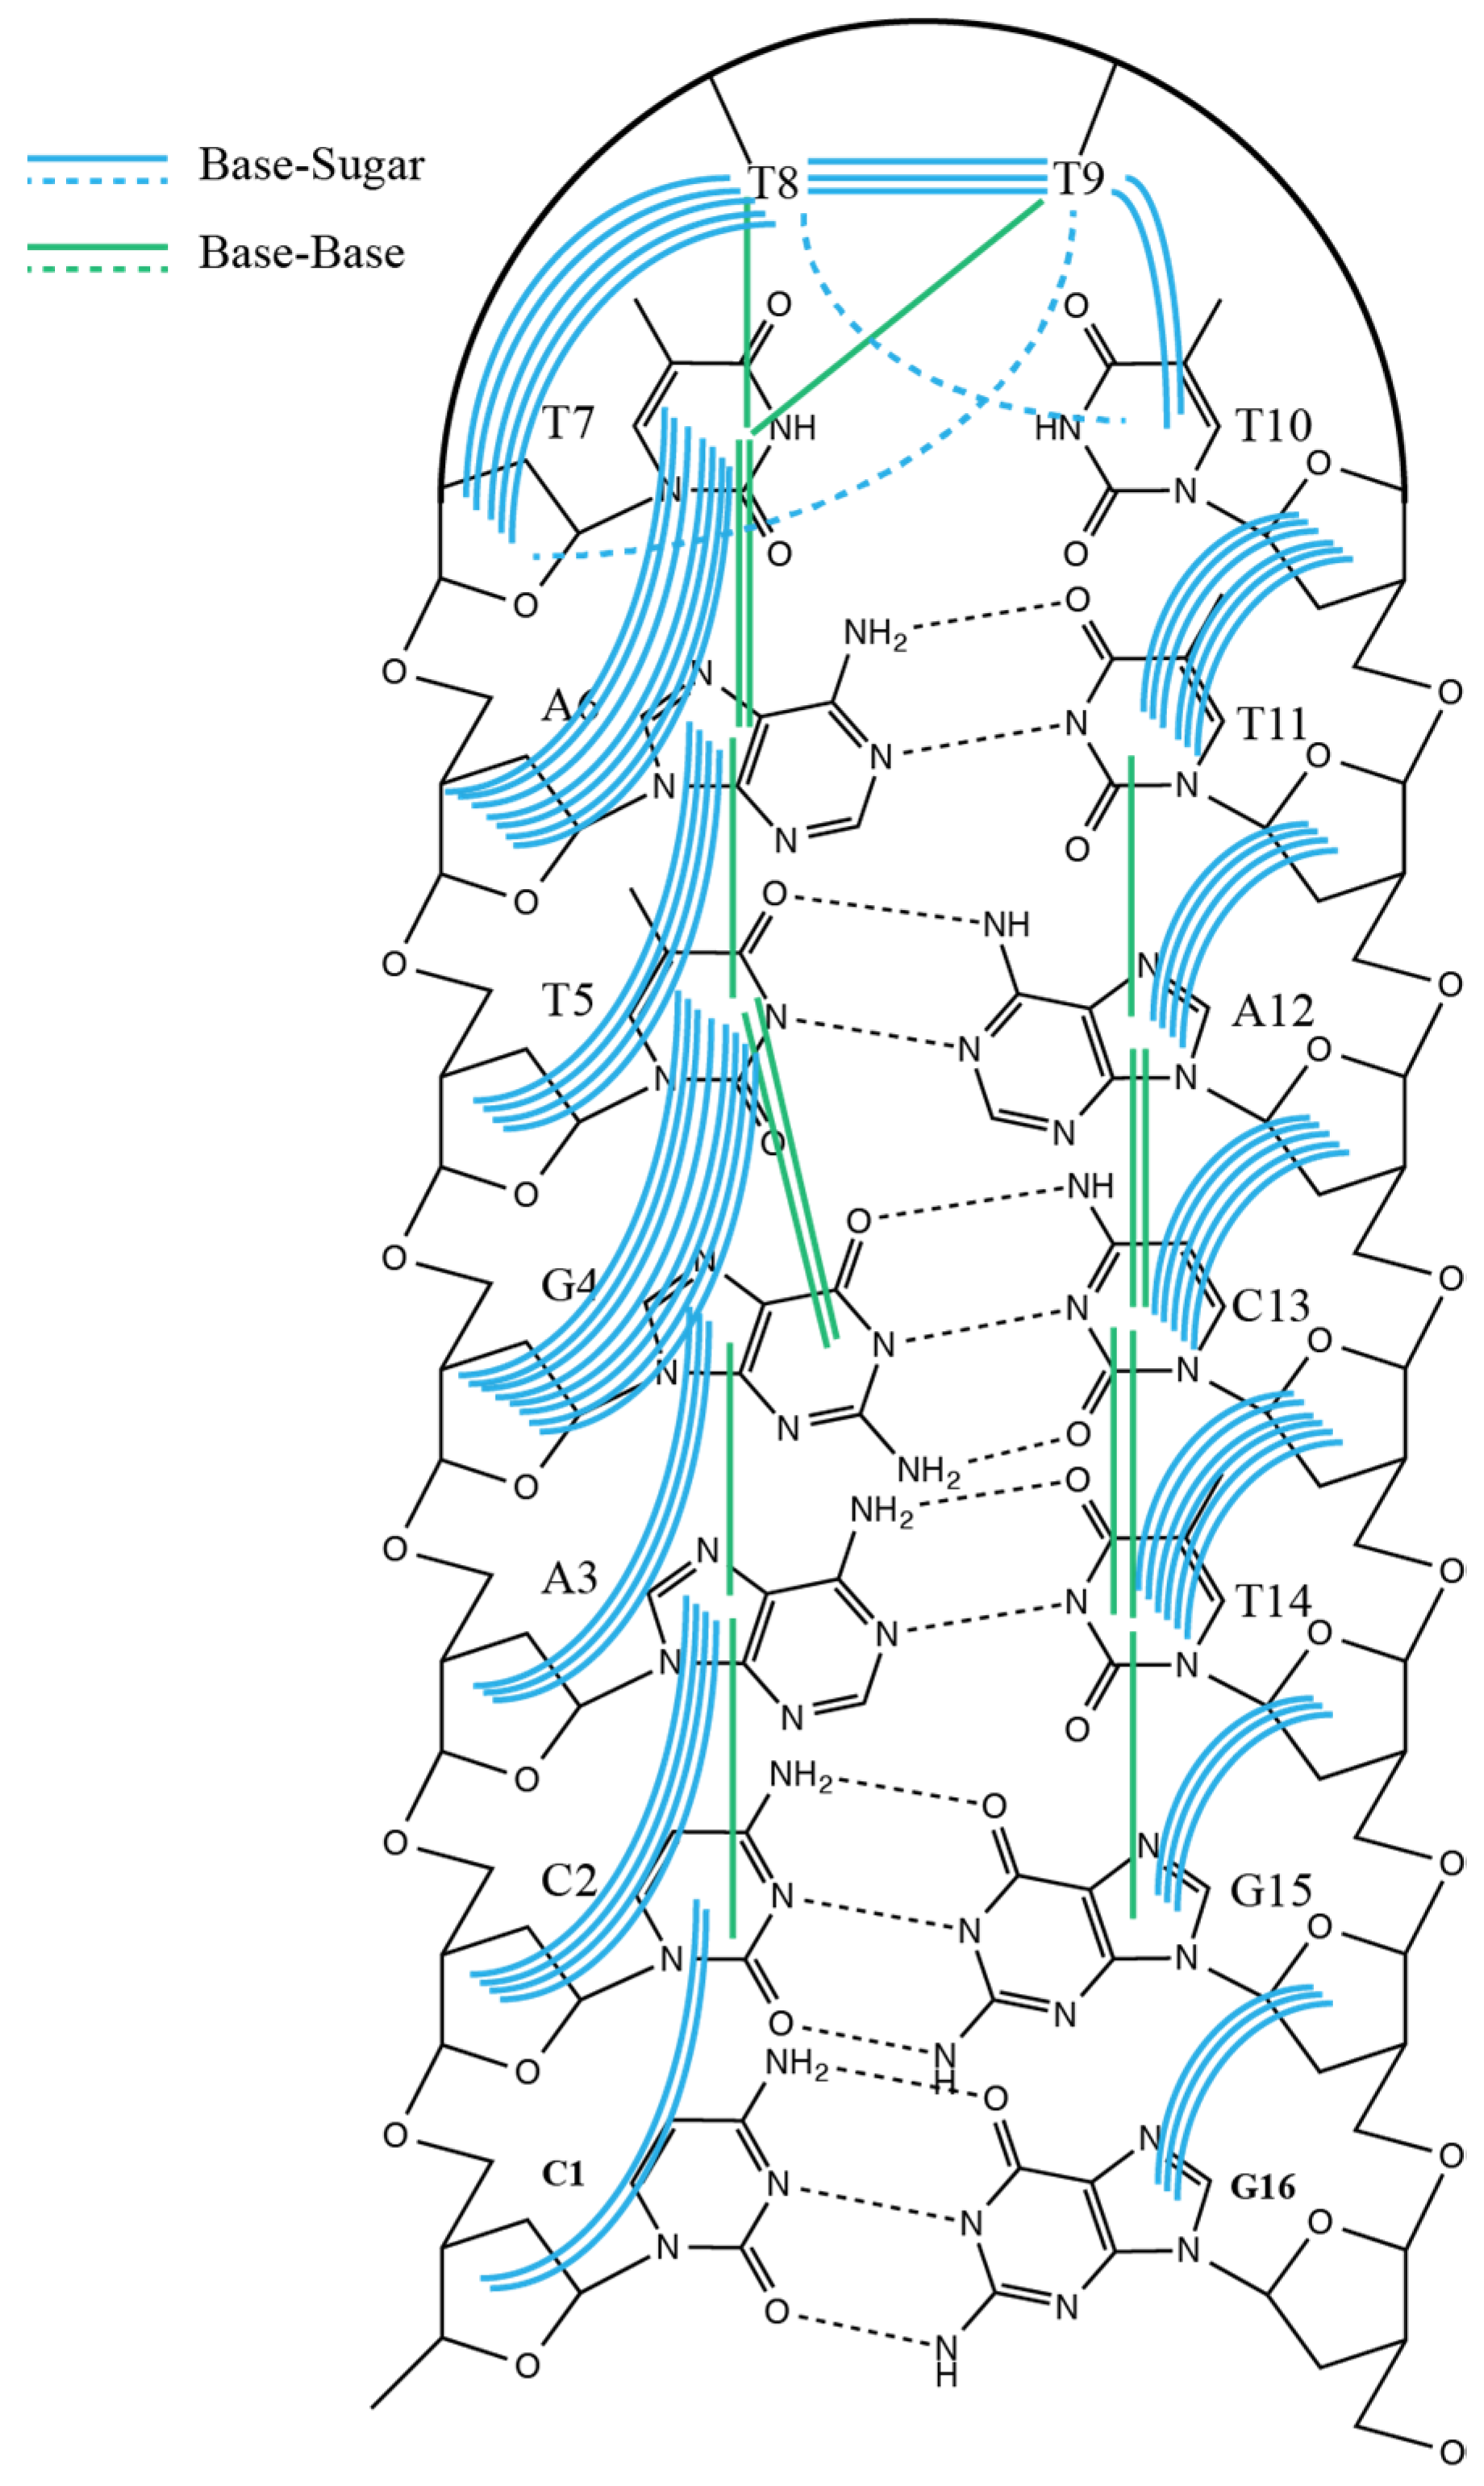
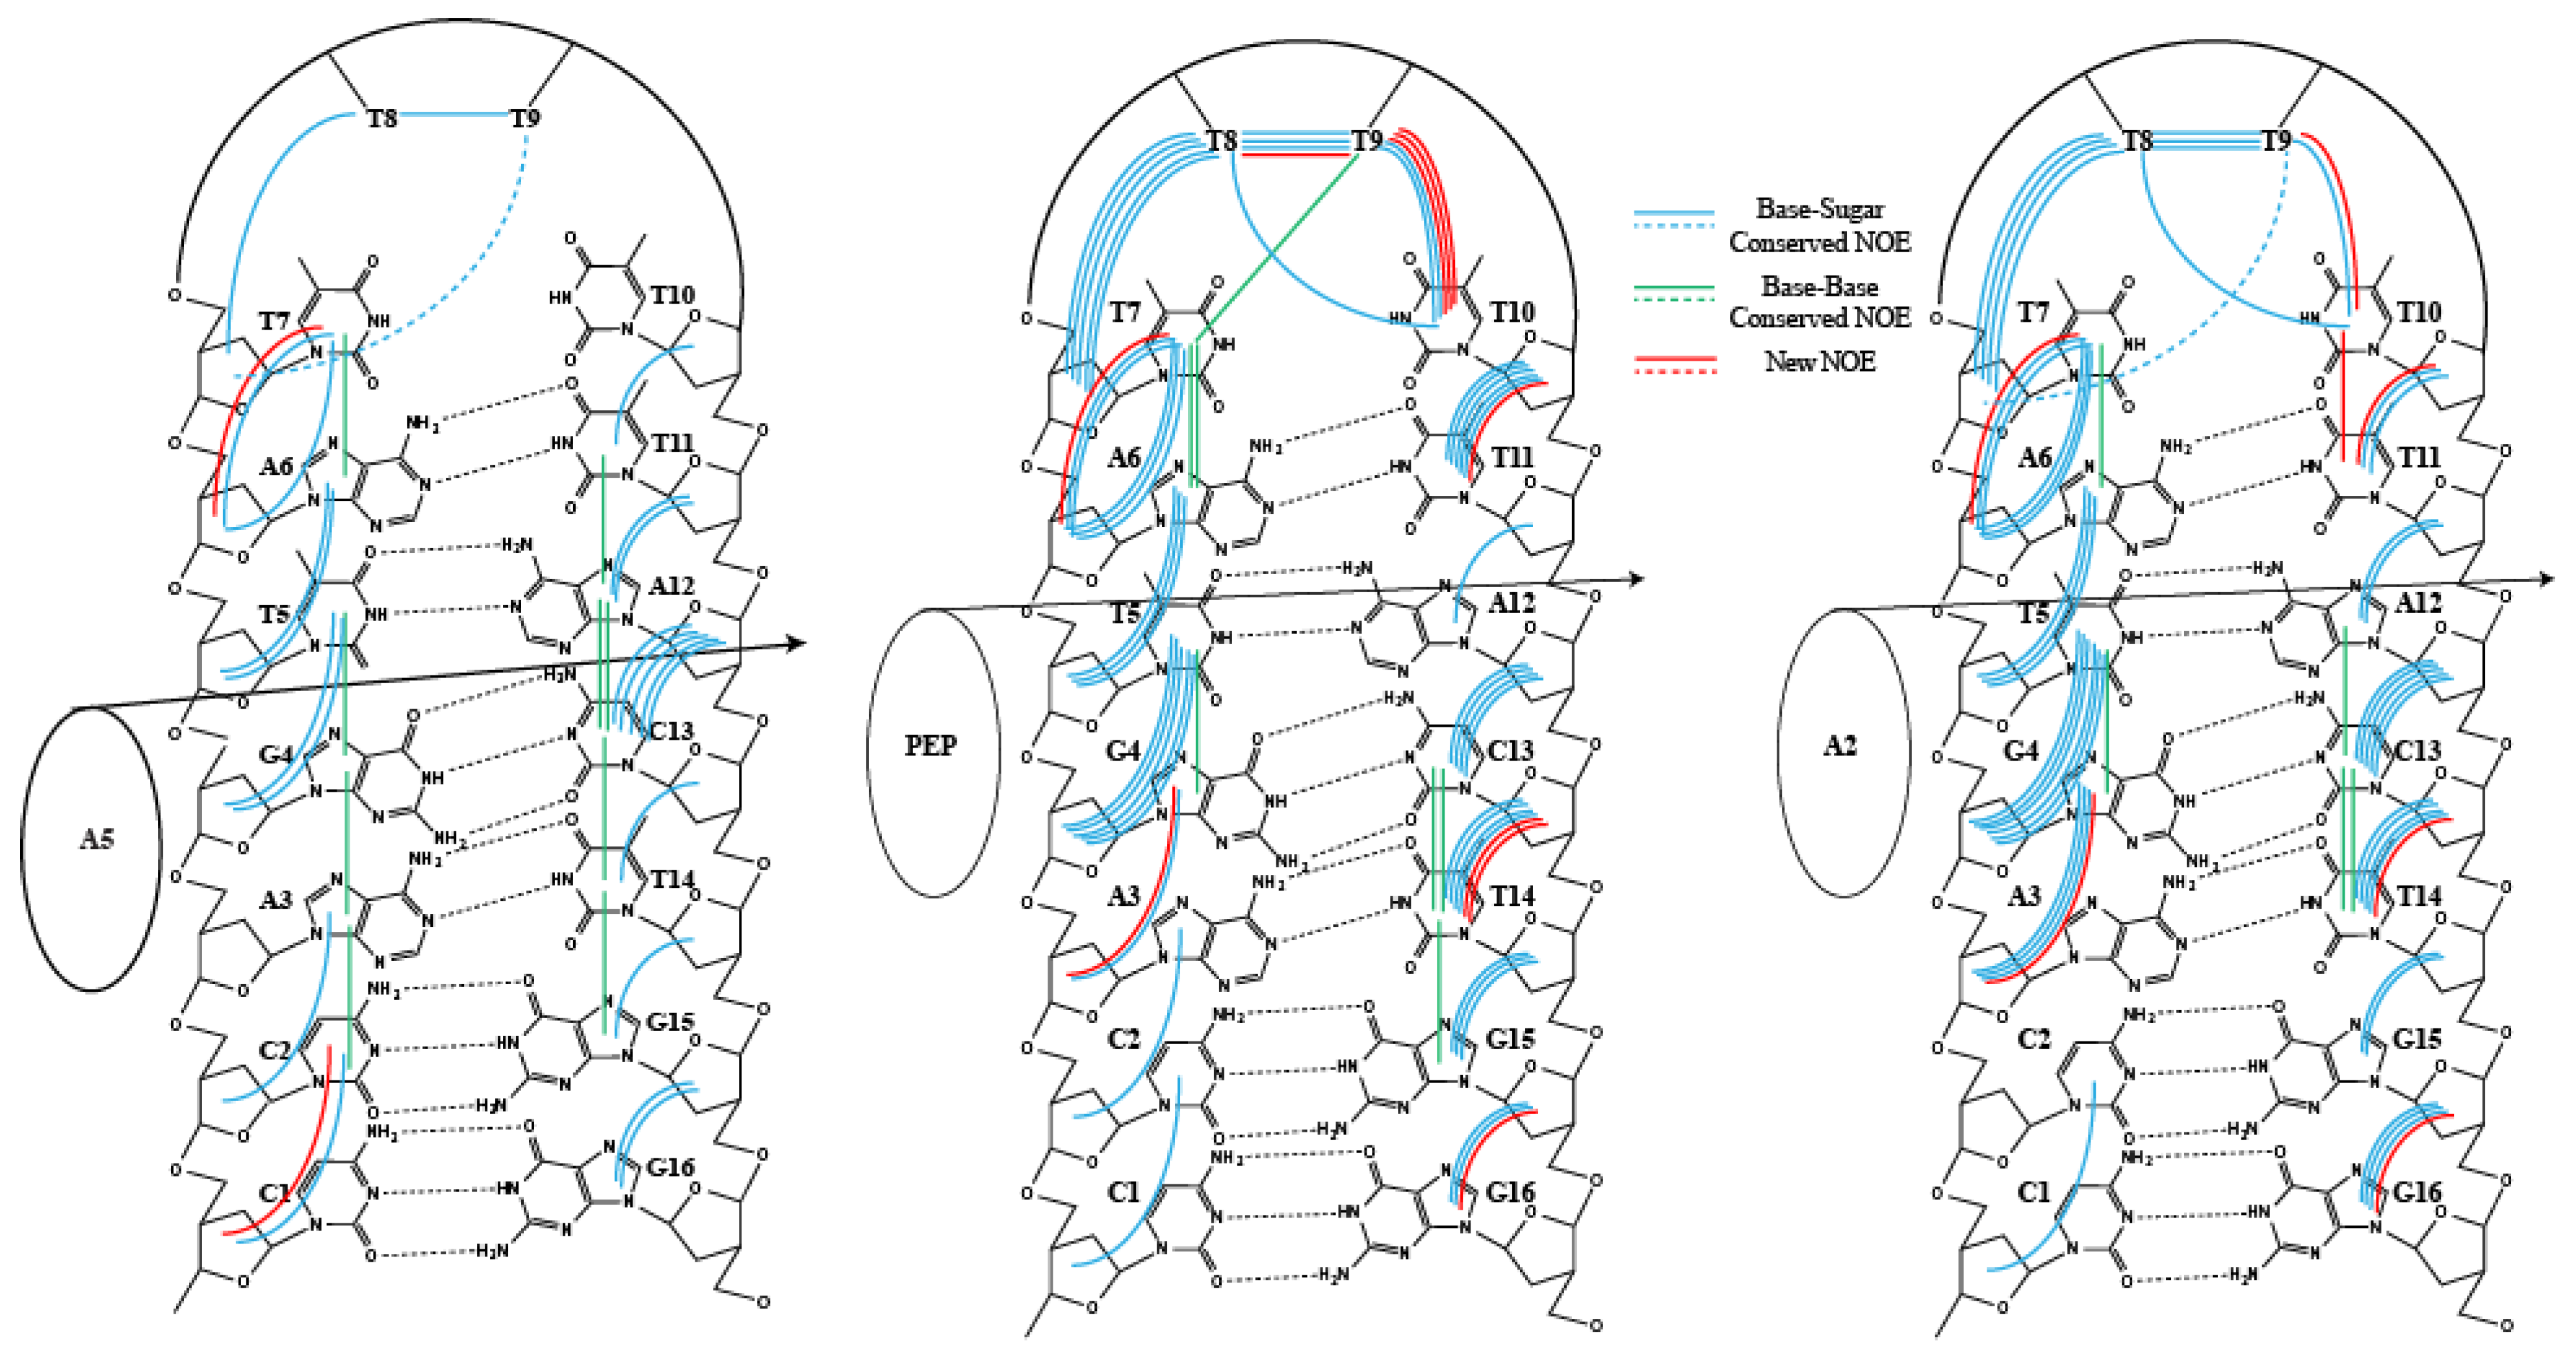
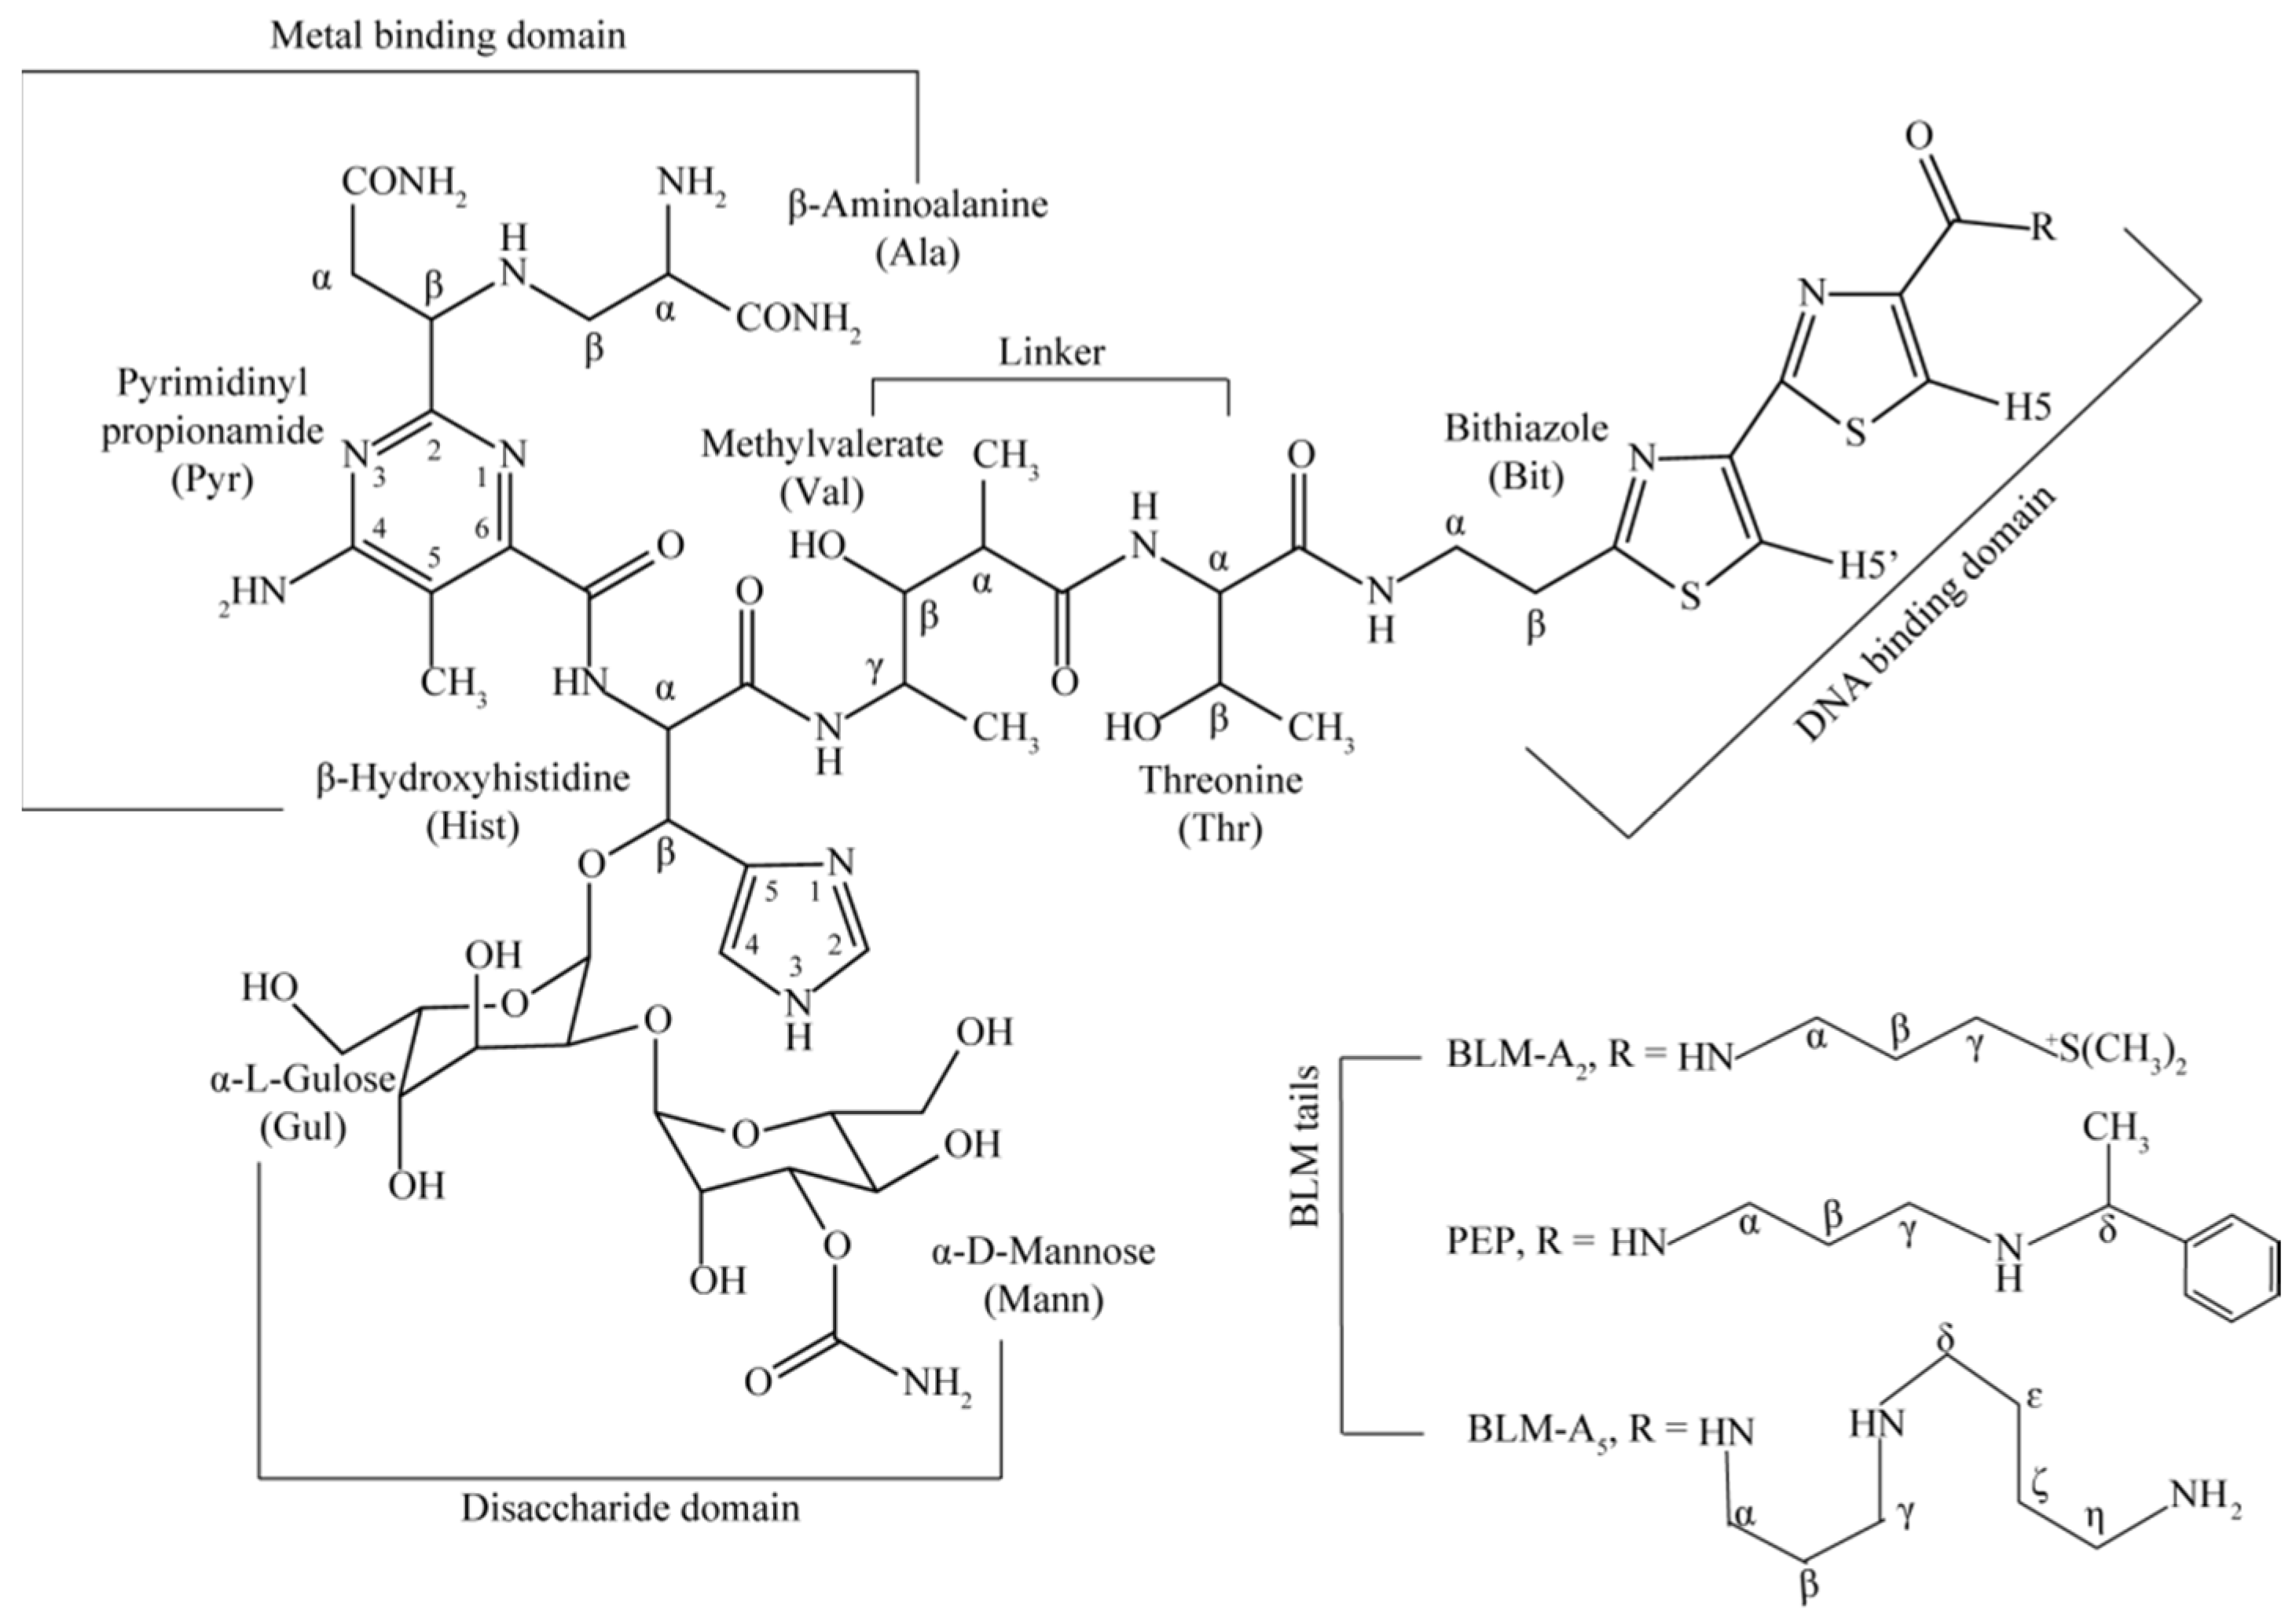
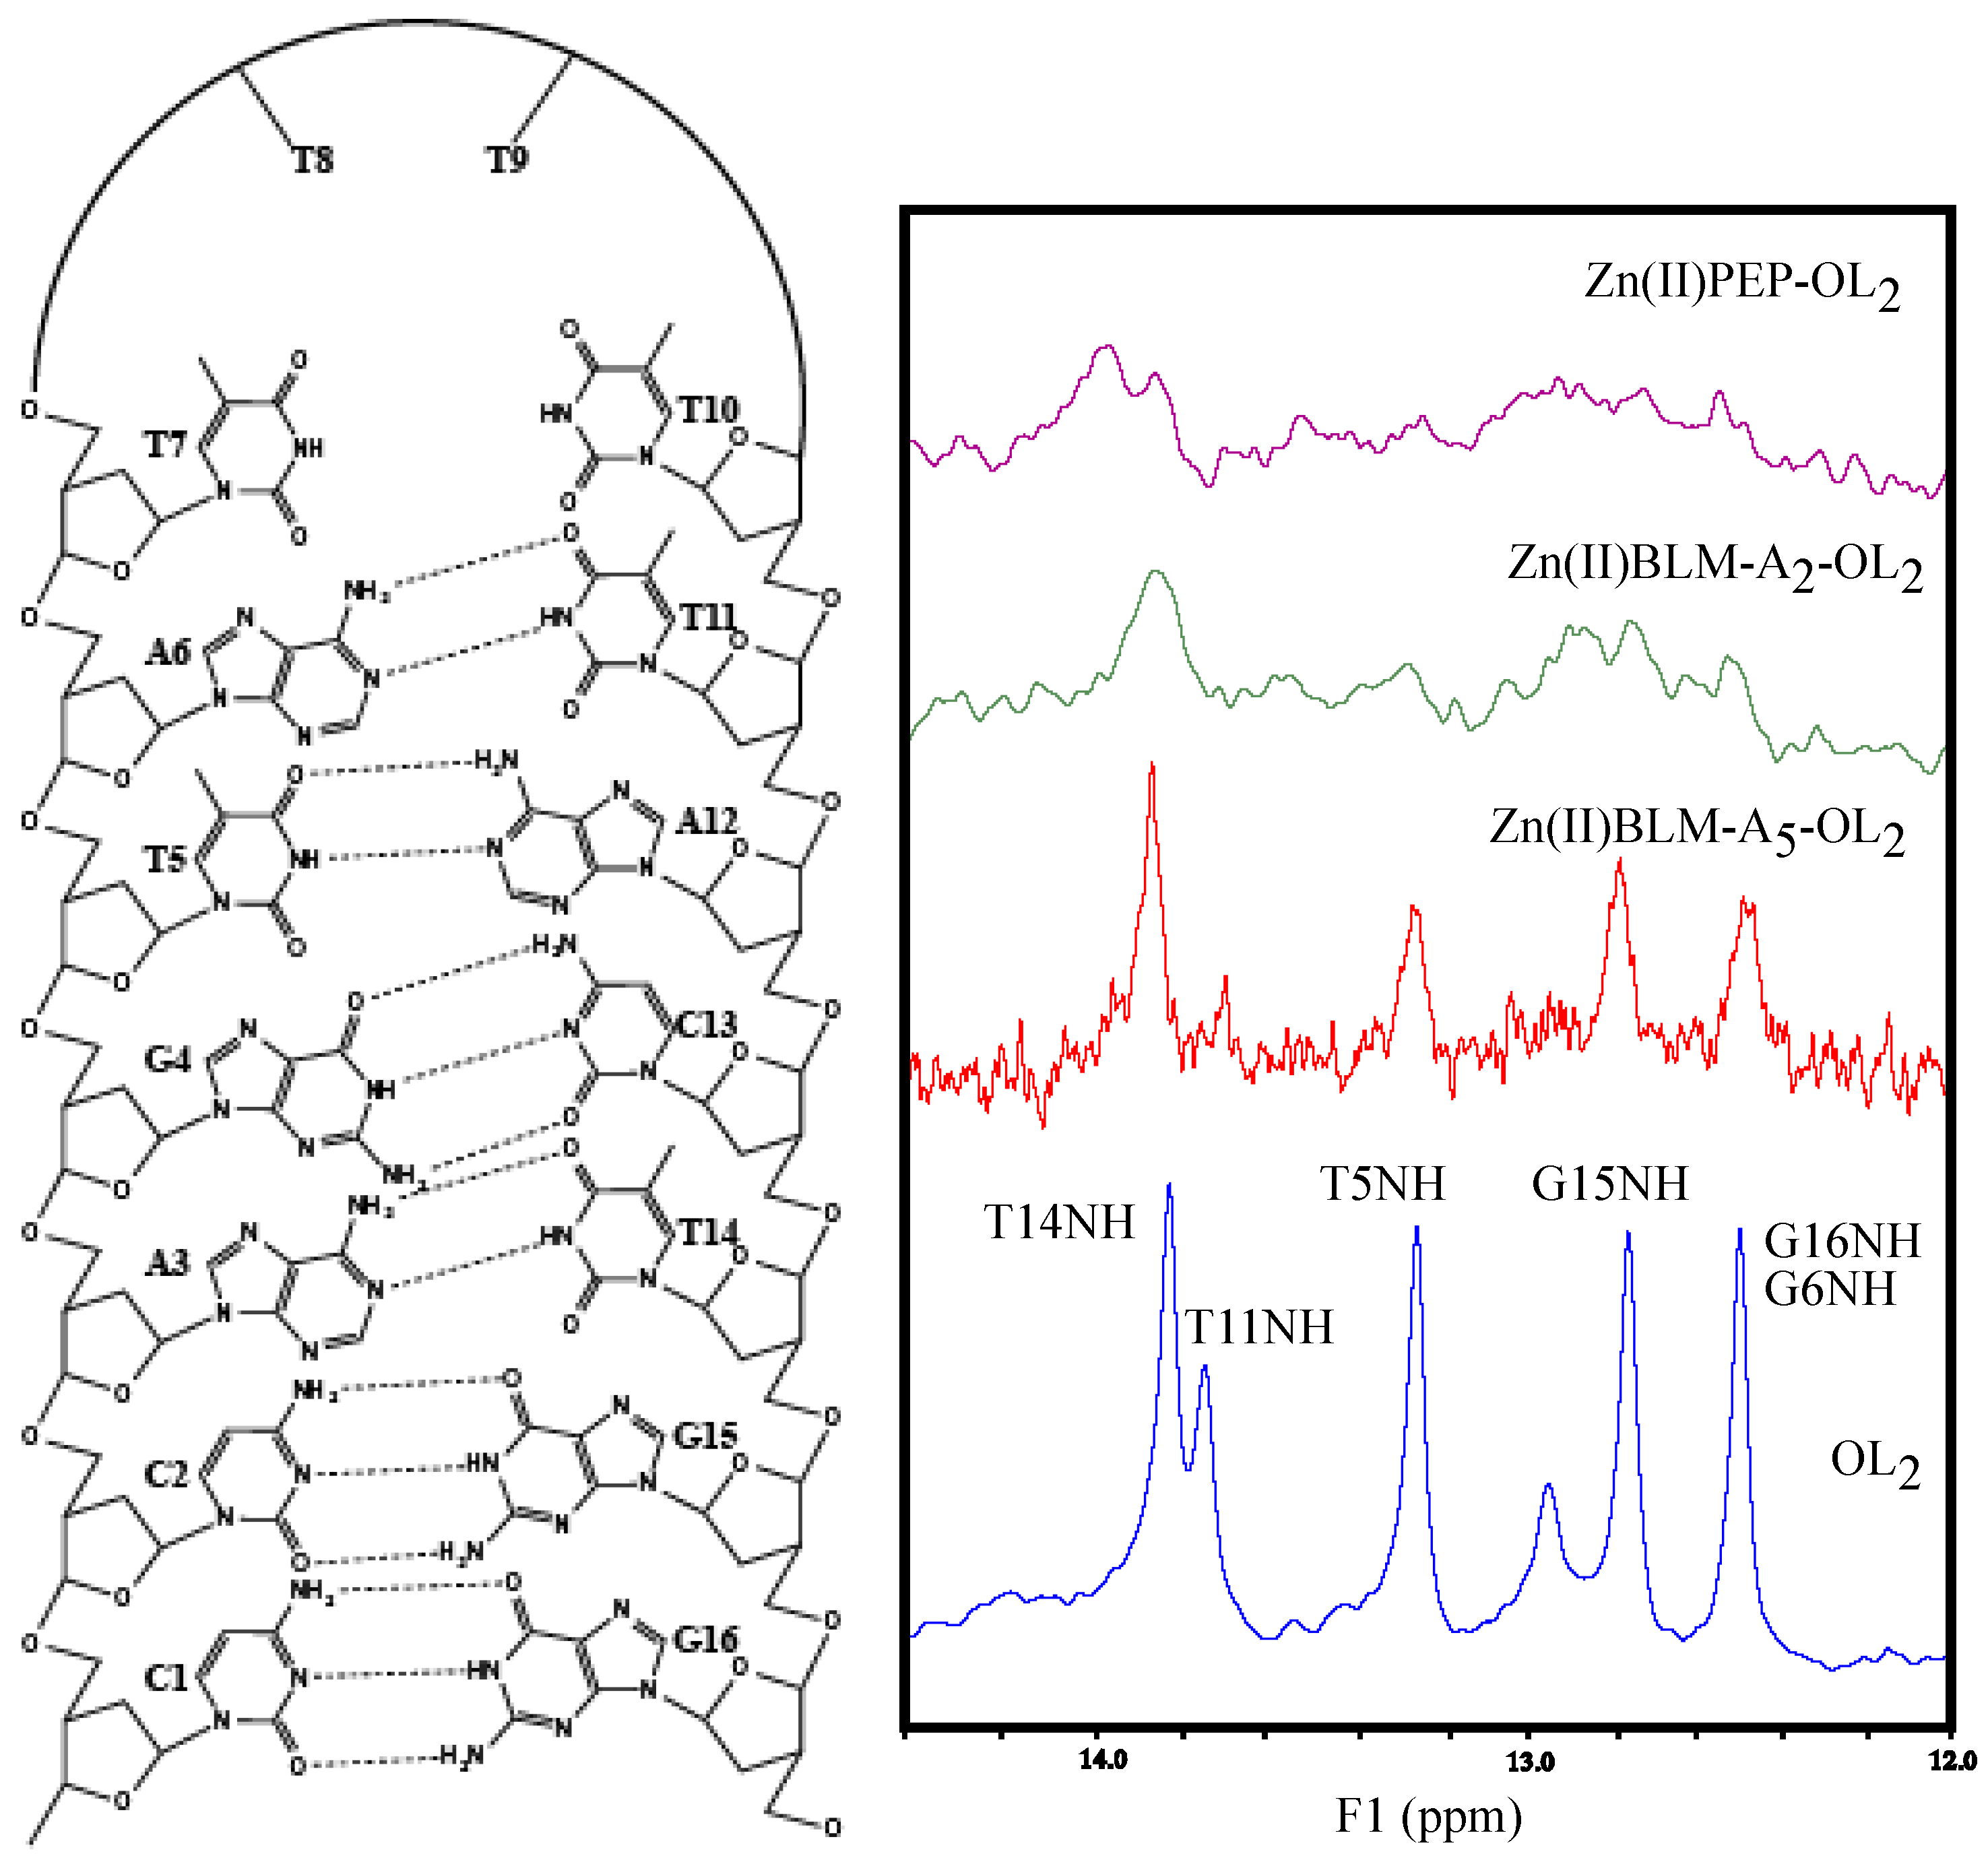
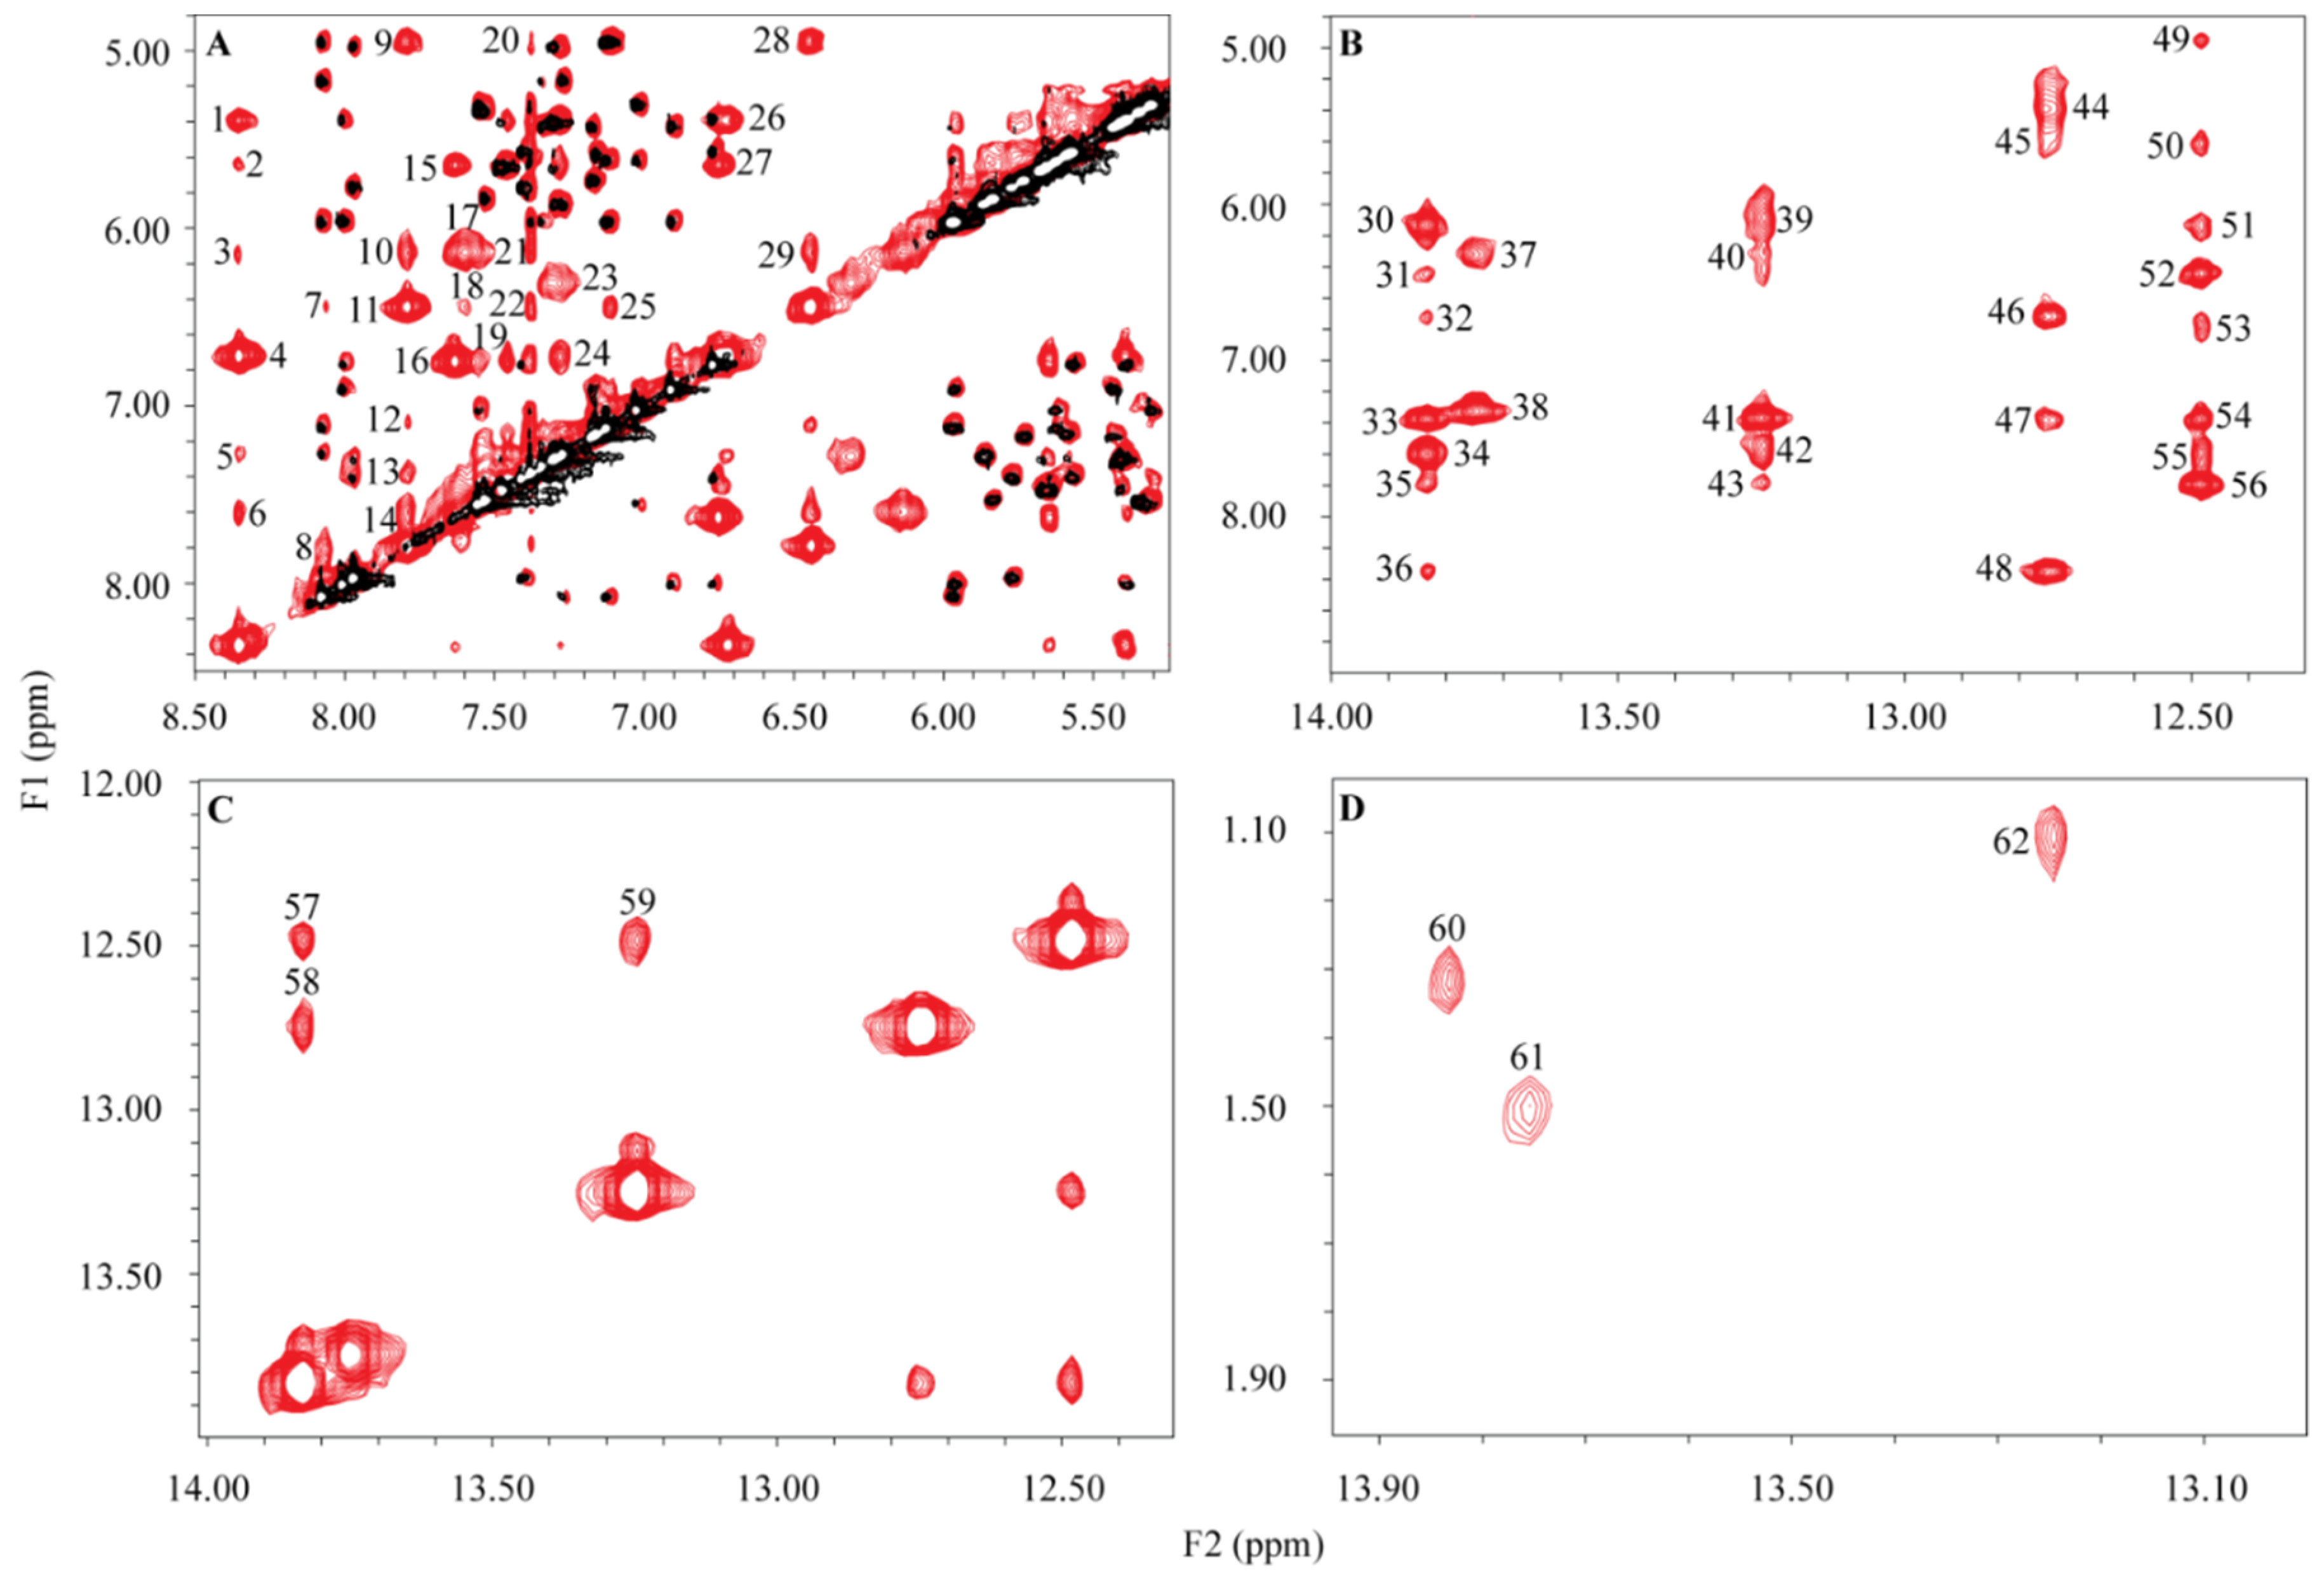
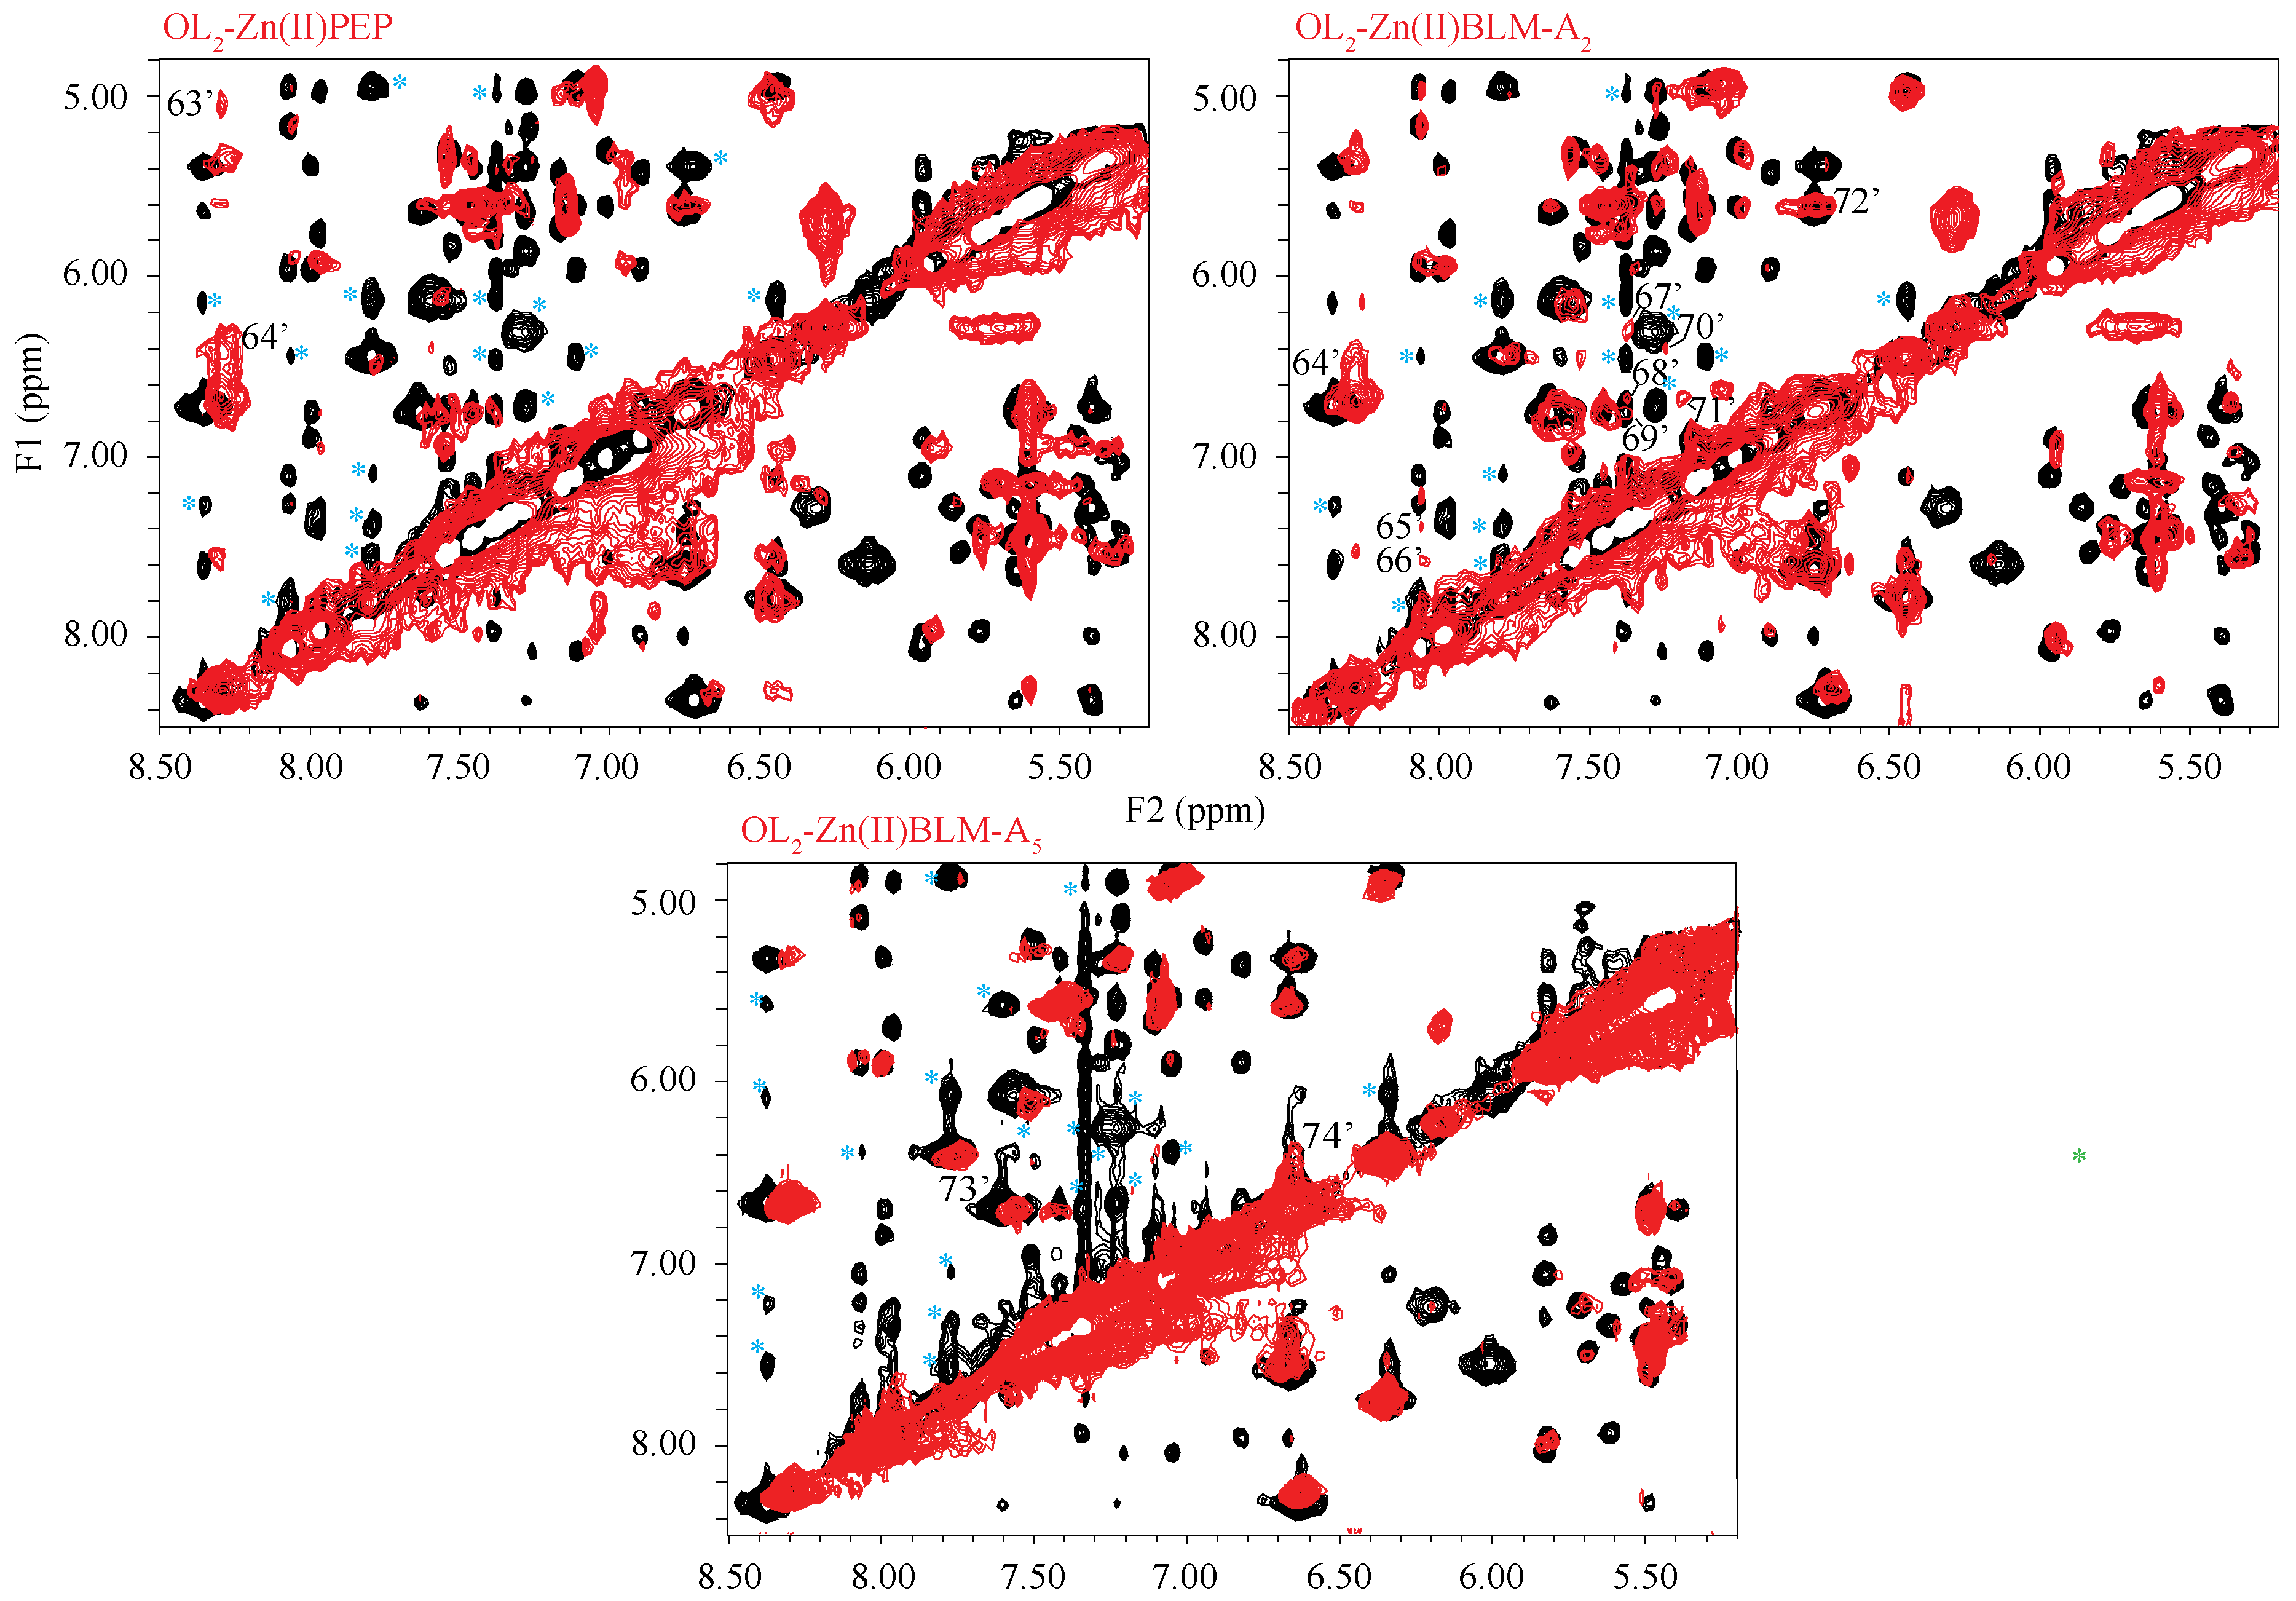
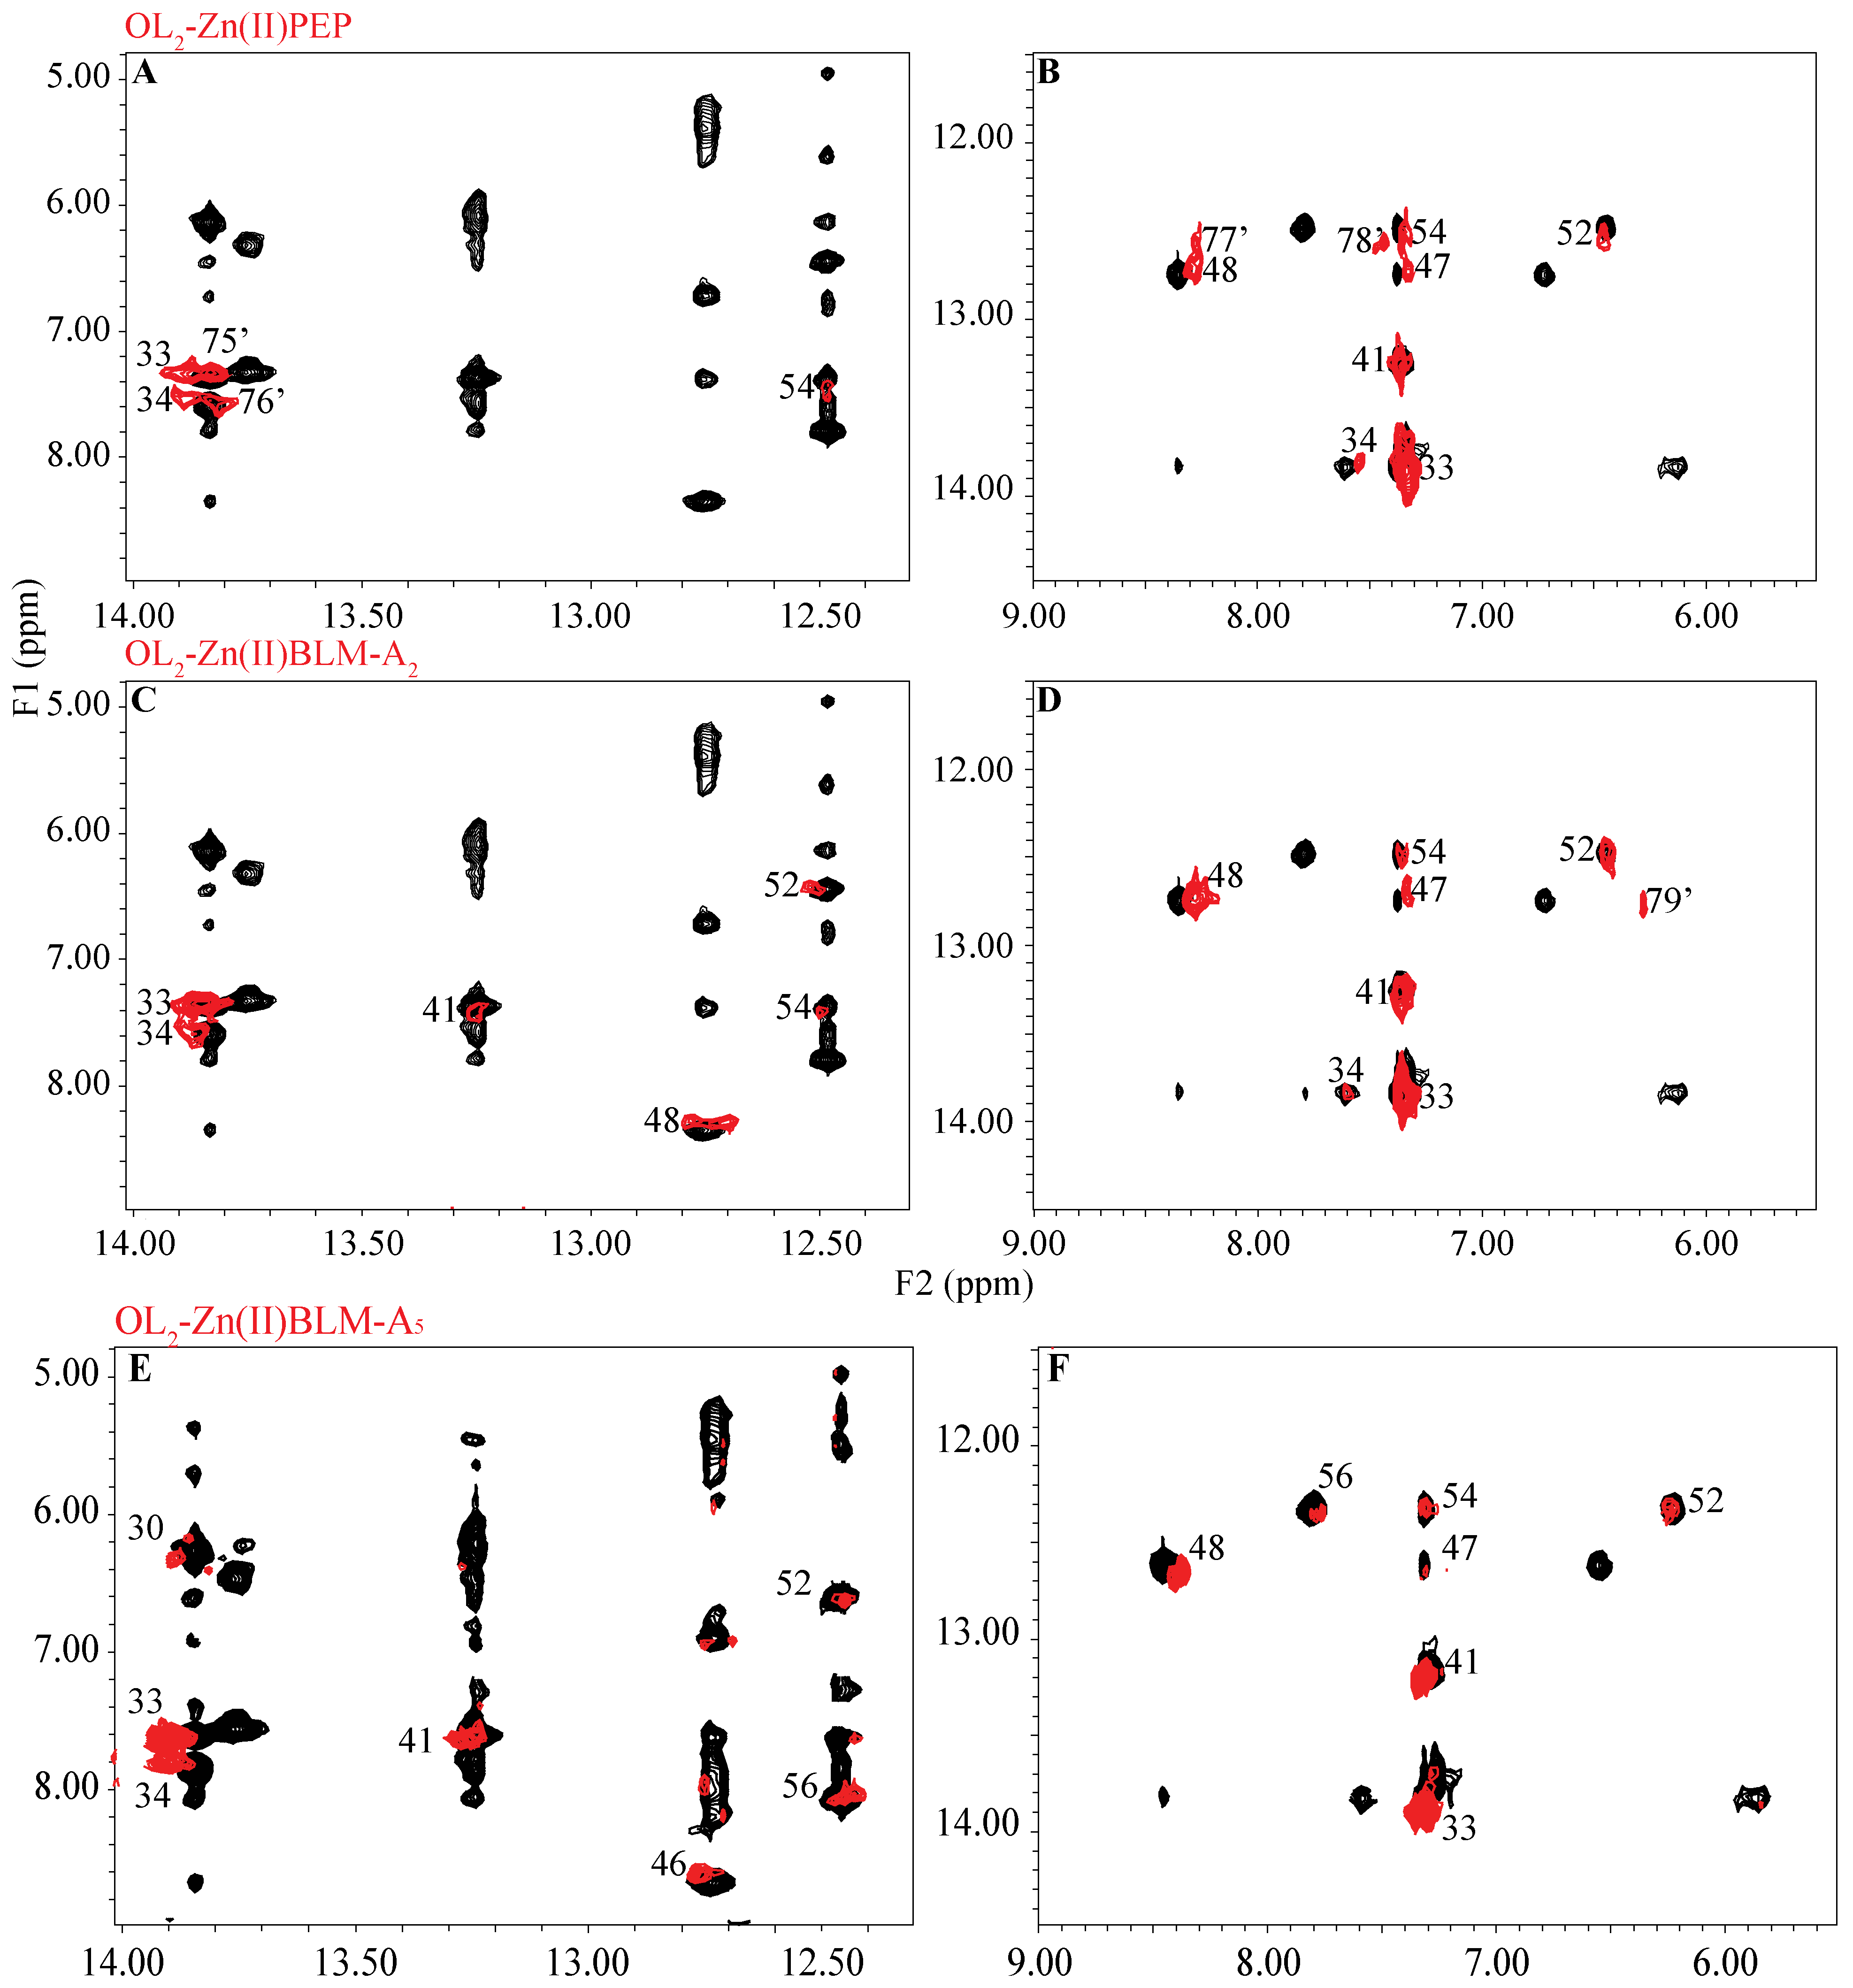
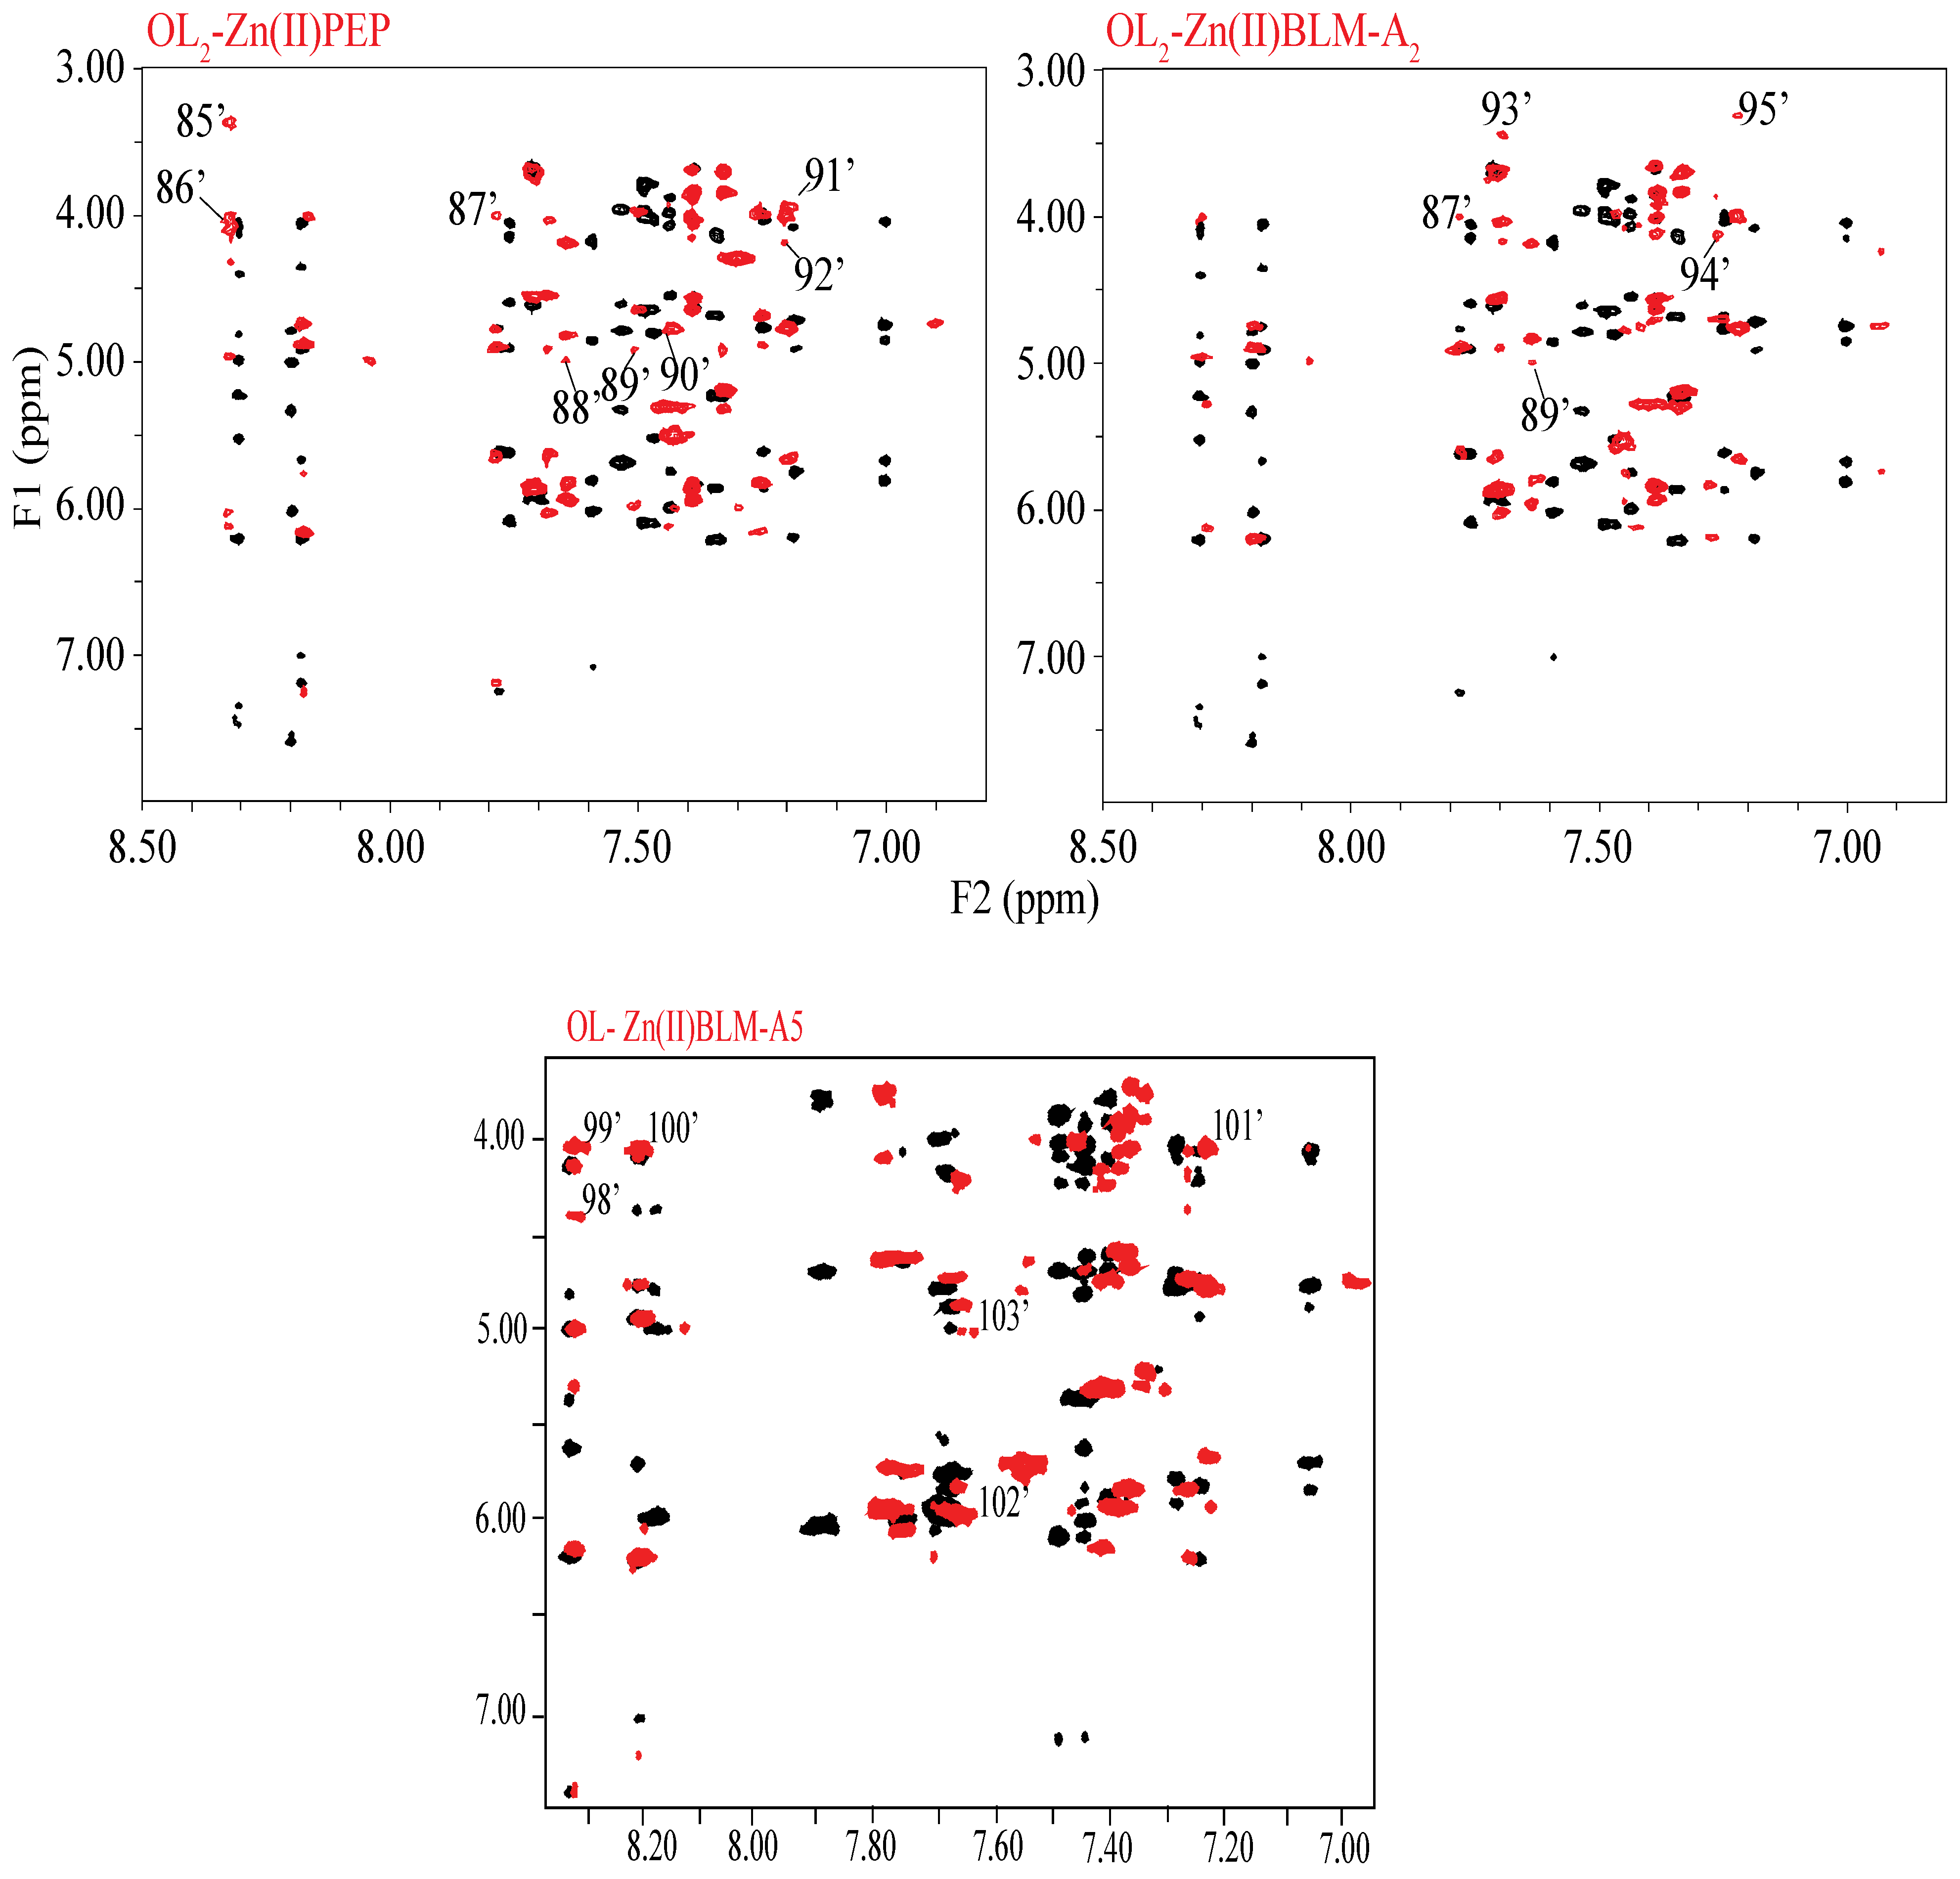
2. Results
3. Discussion
4. Materials and Methods
4.1. NMR Sample Preparation
4.2. NMR Spectra Collection
4.3. NMR-Signal Assignments
Supplementary Materials
Author Contributions
Funding
Acknowledgments
Conflicts of Interest
References
- Umezawa, H.; Maeda, K.; Takeuchi, T.; Okami, J. New antibiotics, Bleomycin A and B. J. Antibiot. 1966, 19, 200–209. [Google Scholar] [PubMed]
- Bennett, J.M.; Reich, S.D. Drugs five years later: Bleomycin. Ann. Intern. Med. 1979, 90, 945–948. [Google Scholar] [CrossRef] [PubMed]
- Carlson, R.W.; Sikic, B.I.; Turbow, M.M.; Ballon, S.C. Combination Cisplatin, Vinblastine, and Bleomycin chemotherapy (PVB) for malignant germ-cell tumors of the ovary. J. Clin. Oncol. 1983, 1, 645–651. [Google Scholar] [CrossRef] [PubMed]
- Hecht, S.M. Bleomycin-Group antibiotics. In Cancer Chemotherapeutic Agents, 1st ed.; Foye, W.O., Ed.; ACS Professional Reference Book; American Chemical Society: Washington, DC, USA, 1995; pp. 369–388. [Google Scholar]
- Einhorn, L.H.; Donohue, J. Cis-Diamminedichloroplatinum, Vinblastine, and Bleomycin combination chemotherapy in disseminated testicular cancer. Ann. Intern. Med. 1977, 87, 293–298. [Google Scholar] [CrossRef] [PubMed]
- Umezawa, H. Advances in Bleomycin studies. In Bleomycin: Chemical, Biochemical, and Biological Aspects, 1st ed.; Hecht, S.M., Ed.; Springer: New York, NY, USA, 1997; pp. 24–36. [Google Scholar]
- Tanaka, W.; Takita, T. Peplomycin-2nd generation Bleomycin chemically derived from Bleomycin A2. Heterocycles 1979, 13, 469–476. [Google Scholar] [CrossRef]
- Oka, S. A review of clinical studies of Peplomycin. Recent Results Cancer Res. 1980, 74, 163–171. [Google Scholar] [PubMed]
- Takahashi, K.; Aoyagi, H.S.; Koyu, A.; Kuramochi, H.; Yoshioka, O.; Matsuda, A.; Fujii, A.; Umezawa, H. Biological Studies on the Degradation Products of 3-[(S)-1′-phenylethylamino]propylaminobleomycin: A Novel Analog (Peplomycin). J. Antibiot. 1979, 32, 36–42. [Google Scholar] [CrossRef]
- Takeda, K.; Kato, F.; Kawai, S.; Konno, K. Effect of Bleomycin on Prolyl Hydroxylase and DNA Chain Breakage—Structure-Activity Relationship. J. Antibiot. 1979, 32, 43–47. [Google Scholar] [CrossRef]
- Raisfeld, I.H.; Chovan, J.P.; Frost, S. Bleomycin Pulmonary Toxicity—Production of Fibrosis by Bithiazole-Terminal Amine and Terminal Amine Moieties of Bleomycin-A2. Life Sci. 1982, 30, 1391–1398. [Google Scholar] [CrossRef]
- Raisfeld, I.H.; Chu, P.; Hart, N.K.; Lane, A. A Comparison of the Pulmonary Toxicity Produced by Metal-Free and Copper-Complexed Analogs of Bleomycin and Phleomycin. Toxicol. Appl. Pharmacol. 1982, 63, 351–362. [Google Scholar] [CrossRef]
- Raisfeld, I.H. Pulmonary Toxicity of Bleomycin Analogs. Toxicol. Appl. Pharm. 1980, 56, 326–336. [Google Scholar] [CrossRef]
- Raisfeld, I.H.; Kundahl, E.R.; Sawey, M.J.; Chovan, J.P.; Depasquale, J. Selective Toxicity of Specific Lung-Cells to Bleomycin. Clin. Res. 1982, 30, A437. [Google Scholar]
- Raisfeld, I.H. Relation Between Bleomycin Structure and Pulmonary Fibrosis. Clin. Pharmacol. Ther. 1981, 29, 274. [Google Scholar]
- Raisfeld, I.H. Relation of Bleomycin Structure to Pulmonary Toxicity. Clin. Res. 1980, 28, A530. [Google Scholar]
- Raisfeld, I.H. Bleomycin Terminal Groups Produce Pulmonary Fibrosis. Clin. Res. 1979, 27, A445. [Google Scholar]
- Ishizuka, M.; Takayama, H.; Takeuchi, T.; Umezawa, H. Activity and Toxicity of Bleomycin. J. Antibiot. 1967, 10, 15–24. [Google Scholar]
- Ishizuka, M.; Takayama, H.; Takeuchi, T.; Umezawa, H. Studies on Antitumor Activity, Antimicrobial Activity and Toxicity of Phleomycin. J. Antibiot. 1966, 19, 260–271. [Google Scholar] [PubMed]
- Lehmann, T.L.; Murray, S.A.; Ingersoll, A.D.; Reilly, T.M.; Follett, S.E.; Macartney, K.E.; Harpster, M.H. NMR Study of the Effects of Some Bleomycin C-termini on the Structure of a DNA Hairpin with the 5′-GC-3′ Binding Site. J. Biol. Inorg. Chem. 2017, 22, 121–136. [Google Scholar] [CrossRef]
- Follett, S.E.; Ingersoll, A.D.; Murray, S.A.; Reilly, T.M.; Lehmann, T.E. Interaction of Zn(II)bleomycin-A2 and Zn(II)peplomycin with a DNA Hairpin Containing the 5′-GT-3′ Binding Site in Comparison with the 5′-GC-3′ Binding Site Studied by NMR Spectroscopy. J. Biol. Inorg. Chem. 2017, 22, 1039–1054. [Google Scholar] [CrossRef]
- Follett, S.E.; Murray, S.A.; Ingersoll, A.D.; Reilly, T.M.; Lehmann, T.E. Structural Changes of Zn(II)bleomycin Complexes When Bound to DNA Hairpins Containing the 5′-GT-3′ and 5′-GC-3′ Binding Sites, Studied through NMR Spectroscopy. Magnetochemistry 2018, 4, 4. [Google Scholar] [CrossRef]
- Caceres-Cortes, J.; Sugiyama, H.; Ikudome, K.; Saito, I.; Wang, A.H.J. Interactions of Deglycosylated Cobalt(III)–Pepleomycin (green form) with DNA Based on NMR Structural Studies. Biochemistry 1997, 36, 9995–10005. [Google Scholar] [CrossRef] [PubMed]
- Hoehn, S.T.; Junker, H.D.; Bunt, R.C.; Turner, R.C.J.; Stubbe, J. Solution Structure of Co(III)-bleomycin-OOH Bound to a Phosphoglycolate Lesion Containing Oligonucleotide: Implications for Bleomycin-Induced Double-Strand DNA Cleavage. Biochemistry 2001, 40, 5894–5905. [Google Scholar] [CrossRef] [PubMed]
- Lui, S.M.; Vanderwall, D.E.; Wu, W.; Tang, X.-J.; Turner, C.J.; Kozarich, J.W.; Stubbe, J. Structural Characterization of Co·bleomycin A2 Brown: Free and Bound to d(CCAGGCCTGG). J. Am. Chem. Soc. 1997, 119, 9603–9613. [Google Scholar] [CrossRef]
- Manderville, R.A.; Ellena, J.F.; Hecht, S.M. Interaction of Zn(II)·Bleomycin with d(CGCTAGCG)2—A Binding Model-Based on NMR Experiments and Restrained Molecular-Dynamics Calculations. J. Am. Chem. Soc. 1995, 117, 7891–7903. [Google Scholar] [CrossRef]
- Vanderwall, D.E.; Lui, S.M.; Turner, C.J.; Kozarich, J.W.; Stubbe, J. A Model of the Structure of HOO-Co.bleomycin Bound to d(CCAGTACTGG): Recognition of the d(GpT) Site and Implications for Double-Stranded DNA Cleavage. Chem. Biol. 1997, 4, 373–387. [Google Scholar] [CrossRef]
- Wu, W.; Vaderwall, D.E.; Stubbe, J.; Kozarich, J.W.; Turner, C.J. Interaction of Co·bleomycin A2 (green) with d(CCAGGCCTGG)2: Evidence for Intercalation Using 2D NMR. J. Am. Chem. Soc. 1994, 116, 10843–10844. [Google Scholar] [CrossRef]
- Wu, W.; Vanderwall, D.E.; Lui, S.M.; Tang, X.J.; Turner, C.J.; Kozarich, J.W.; Stubbe, J. Studies of Co·bleomycin A2 green: Its Detailed Structural Characterization by NMR and Molecular Modeling and its Sequence-Specific Interaction with DNA Oligonucleotides. J. Am. Chem. Soc. 1996, 118, 1268–1280. [Google Scholar] [CrossRef]
- Wu, W.; Vanderwall, D.E.; Turner, C.J.; Kozarich, J.W.; Stubbe, J. Solution Structure of Co·bleomycin A2 Green Complexed with d(CCAGGCCTGG). J. Am. Chem. Soc. 1996, 118, 1281–1294. [Google Scholar] [CrossRef]
- Wu, W.; Vanderwall, D.E.; Teramoto, S.; Lui, S.M.; Hoehn, S.T.; Tang, X.-J.; Turner, C.J.; Boger, D.L.; Kozarich, J.W.; Stubbe, J. NMR Studies of Co·deglycobleomycin A2 Green and its Complexes with d(CCAGGCCTGG). J. Am. Chem. Soc. 1998, 120, 2239–2250. [Google Scholar] [CrossRef]
- Wu, W.; Vanderwall, D.E.; Turner, C.J.; Hoehn, S.; Chen, J.Y.; Kozarich, J.W.; Stubbe, J. Solution Structure of the Hydroperoxide of Co(III) Phleomycin Complexed with d(CCAGGCCTGG)2: Evidence for Binding by Partial Intercalation. Nucleic Acids Res. 2002, 30, 4881–4891. [Google Scholar] [CrossRef]
- Zhao, C.Q.; Xia, C.W.; Mao, Q.K.; Forsterling, H.; DeRose, E.; Antholine, W.E.; Subczynski, W.K.; Petering, D.H. Structures of HO2-Co(III)bleomycin A2 Bound to d(GAGCTC)2 and d(GGAAGCTTCC)2: Structure-Reactivity Relationships of Co and Fe Bleomycins. J. Inorg. Biochem. 2002, 91, 259–268. [Google Scholar] [CrossRef]
- Goodwin, K.D.; Lewis, M.A.; Long, E.C.; Georgiadis, M.M. Crystal Structure of DNA-Bound Co(III)·bleomycin B2: Insights on Intercalation and Minor Groove Binding. Proc. Nat. Acad. Sci. USA 2008, 105, 5052–5056. [Google Scholar] [CrossRef] [PubMed]
- Batist, G.; Andrews, J.L., Jr. Pulmonary Toxicity of Anti-neoplastic Drugs. JAMA J. Am. Med. Assoc. 1981, 246, 1449–1453. [Google Scholar] [CrossRef]
- Cooper, J.A.D., Jr.; White, D.A.; Matthay, R.A. Drug-Induced Pulmonary-Disease 1. Cytotoxic Drugs. Am. Rev. Respir. Dis. 1986, 133, 321–340. [Google Scholar] [PubMed]
- Ginsberg, S.J.; Comis, R.L. The Pulmonary Toxicity of Anti-Neoplastic Agents. Semin. Oncol. 1982, 9, 34–51. [Google Scholar]
- Muggia, F.M.; Louie, A.C.; Sikic, B.I. Pulmonary Toxicity of Antitumor Agents. Cancer Treat. Rev. 1983, 10, 221–243. [Google Scholar] [CrossRef]
- Wüthrich, K. NMR of Proteins and Nucleic Acids, 1st ed.; John Wiley & Sons: New York, NY, USA, 1986. [Google Scholar]
- Akkerman, M.A.J.; Haasnoot, C.A.G.; Hilbers, C.W. Studies of the Solution Structure of the Bleomycin-A2 - Zinc Complex by Means of Two-Dimensional NMR Spectroscopy and Distance Geometry Calculations. Eur. J. Biochem. 1988, 173, 211–225. [Google Scholar] [CrossRef]


| Chemical Shift (F2 (ppm)) | |||||||
|---|---|---|---|---|---|---|---|
| Assignment | OL2 | OL2-Zn(II)PEP | Δδ a (PEP) | OL2-Zn(II)BLM-A2 | Δδ a (A2) | OL2-Zn(II)BLM-A5 | Δδ a (A5) |
| C1NH2b | 7.63 | 7.61 | 0.02 | 7.64 | −0.01 | 7.58 | 0.05 |
| C1NH2a | 6.75 | 6.75 | 0.00 | 6.77 | −0.02 | 6.75 | 0.00 |
| C2NH2b | 8.36 | 8.29 | 0.07 | 8.28 | 0.08 | 8.20 | 0.16 |
| C2NH2a | 6.72 | 6.66 | 0.06 | 6.70 | 0.02 | 6.72 | 0.00 |
| A3NH2b | 7.60 | 7.56 | 0.04 | 7.54 | 0.06 | 7.76 | −0.16 |
| A3NH2a | 6.13 | 6.11 | 0.02 | 6.15 | −0.03 | b- | b- |
| G4NH | 12.48 | 12.51 | −0.03 | 12.51 | −0.02 | 12.45 | 0.03 |
| T5NH | 13.25 | 13.27 | −0.02 | 13.25 | 0.00 | 13.26 | −0.01 |
| A6NH2b | 7.28 | b- | b- | b- | b- | b- | b- |
| A6NH2a | 6.31 | b- | b- | b- | b- | b- | b- |
| T11NH | 13.75 | 13.82 | −0.07 | 13.86 | −0.11 | b- | b- |
| A12NH2b | 7.60 | 7.56 | 0.04 | 7.54 | 0.06 | 7.58 | 0.04 |
| A12NH2a | 6.13 | 6.11 | 0.02 | 6.15 | −0.01 | 6.73 | 0.60 |
| C13NH2b | 7.79 | 7.78 | 0.01 | 7.77 | 0.02 | 7.75 | 0.04 |
| C13NH2a | 6.44 | 6.46 | −0.02 | 6.44 | 0.00 | 6.45 | −0.01 |
| T14NH | 13.83 | 13.87 | −0.04 | 13.86 | −0.02 | 13.88 | −0.05 |
| G15NH | 12.75 | 12.72 | 0.03 | 12.71 | 0.04 | 12.78 | −0.03 |
| G16NH | 12.48 | 12.56 | −0.08 | 12.51 | −0.03 | 12.47 | 0.01 |
| Chemical Shift (F2 (ppm)) | |||||||
|---|---|---|---|---|---|---|---|
| Base 1H | OL2 | OL2-PEP a | Δδ b (PEP) | OL2-A2 a | Δδ b (A2) | OL2-A5a | Δδ b (A5) |
| C1(C6H) | 7.70 | 7.71 | 0.01 | 7.71 | 0.01 | 7.78 | −0.08 |
| C2(C6H) | 7.53 | 7.43 | 0.10 | 7.46 | 0.07 | 7.55 | −0.02 |
| A3(C8H) | 8.20 | 8.03 | 0.17 | 8.08 | 0.12 | 8.13 | 0.07 |
| G4(C8H) | 7.59 | 7.64 | −0.05 | 7.64 | −0.04 | 7.66 | −0.07 |
| T5(C6H) | 7.00 | 6.90 | 0.10 | 6.93 | 0.07 | 6.97 | 0.03 |
| A6(C8H) | 8.18 | 8.17 | 0.01 | 8.20 | −0.02 | 8.20 | −0.02 |
| T7(C6H) | 7.18 | 7.25 | −0.07 | 7.27 | −0.08 | 7.27 | −0.09 |
| T8(C6H) | 7.39 | 7.39 | 0.00 | 7.39 | 0.00 | 7.39 | 0.00 |
| T9(C6H) | 7.44 | 7.39 | 0.05 | 7.39 | 0.05 | 7.37 | 0.07 |
| T10(C6H) | 7.49 | 7.30 | 0.19 | 7.39 | 0.10 | 7.46 | 0.03 |
| T11(C6H) | 7.47 | 7.50 | −0.03 | 7.47 | 0.00 | 7.46 | 0.01 |
| A12(C8H) | 8.30 | 8.32 | −0.02 | 8.31 | 0.01 | 8.31 | −0.01 |
| C13(C6H) | 7.35 | 7.44 | −0.09 | 7.41 | −0.06 | 7.42 | −0.07 |
| T14(C6H) | 7.25 | 7.20 | 0.05 | 7.22 | 0.03 | 7.24 | 0.01 |
| G15(C8H) | 7.78 | 7.79 | −0.01 | 7.78 | 0.00 | -c | -c |
| G16(C8H) | 7.76 | 7.68 | 0.08 | 7.70 | 0.06 | 7.75 | 0.01 |
© 2019 by the authors. Licensee MDPI, Basel, Switzerland. This article is an open access article distributed under the terms and conditions of the Creative Commons Attribution (CC BY) license (http://creativecommons.org/licenses/by/4.0/).
Share and Cite
Covington, K.L.; Lehmann, T. Disturbance of the Conformation of DNA Hairpin Containing the 5′-GT-3′ Binding Site Caused by Zn(II)bleomycin-A5 Studied through NMR Spectroscopy. Magnetochemistry 2019, 5, 52. https://doi.org/10.3390/magnetochemistry5030052
Covington KL, Lehmann T. Disturbance of the Conformation of DNA Hairpin Containing the 5′-GT-3′ Binding Site Caused by Zn(II)bleomycin-A5 Studied through NMR Spectroscopy. Magnetochemistry. 2019; 5(3):52. https://doi.org/10.3390/magnetochemistry5030052
Chicago/Turabian StyleCovington, Kyle L., and Teresa Lehmann. 2019. "Disturbance of the Conformation of DNA Hairpin Containing the 5′-GT-3′ Binding Site Caused by Zn(II)bleomycin-A5 Studied through NMR Spectroscopy" Magnetochemistry 5, no. 3: 52. https://doi.org/10.3390/magnetochemistry5030052
APA StyleCovington, K. L., & Lehmann, T. (2019). Disturbance of the Conformation of DNA Hairpin Containing the 5′-GT-3′ Binding Site Caused by Zn(II)bleomycin-A5 Studied through NMR Spectroscopy. Magnetochemistry, 5(3), 52. https://doi.org/10.3390/magnetochemistry5030052