Featured Application
This magnetic marker material is used for large-scale field signal marking, offering the advantages of stable, rapid, and portable detection.
Abstract
With the widespread application of tagging materials, existing chemical tagging materials exhibit limitations in stability and detection under field conditions. This study introduces a novel magnetic detection scheme. Hydrophilic material-modified Fe3O4 nanoparticles (COOH-PEG@Fe3O4 NPs) were synthesized using the co-precipitation technique. The content of Fe3O4 nanoparticles in the magnetic tagging liquid can reach up to 10 wt% and remain stable in an aqueous phase system for seven days. This research details the preparation process, the characterization methods (IR, 1HNMR, EDX, XRD, SEM, TEM, VSM, DLS), and the performance effects of the materials in magnetic tagging. Experimental results indicate that COOH-PEG@Fe3O4 NPs exhibit high remanence intensity (Br = 1.75 emu/g) and considerable stability, making it possible to quickly detect tagged liquids in the field using portable flux meters and optical pump magnetometers. This study provides new insights into the design and application of magnetic tagging materials, making it particularly suitable for long-term tagging and convenient detection in field scenarios.
1. Introduction
Marking materials, serving as a quintessential component within the realms of modern technology and industry, play an indispensable role. According to Business Research, the global fluorescent dye market size in 2022 was USD 909.8 million, and it is expected that the market size will reach USD 1.34191 billion by 2031, with a compound annual growth rate of 4.4%. Their unique physical [1], chemical [2], and optical properties afford [3] them extensive applications in the identification [4], tracking [5], management, and protection of objects [6]. The principles of marking materials primarily encompass a variety of mechanisms such as optical, physical, and chemical mechanisms [7]. Optical marking materials employ the characteristics of optical reflection, absorption, and scattering for the visible light recognition and tracking of objects [8], whereas physical and chemical marking materials achieve object labeling and recording through chemical reactions and changes in molecular structure [9]. Optical marking materials often incorporate diverse fluorescent units, which possess recognizable characteristic emission spectra [10]; however, these characteristic emission spectra tend to be easily detectable, and, in some instances, optical marking materials are unsuitable for use in black light-absorbing materials [11]. The chemical stability of the molecules within chemical marking materials is somewhat deficient [12], making them ill-suited for long-term marking.
Consequently, it is proposed that the utilization of magnetic labeling materials could address the aforementioned challenges. These materials typically incorporate stable magnetic nanoparticles [13], uniformly dispersed within aqueous [14] or organic media [15], and are usually characterized by their exceptional biocompatibility. This renders them highly suitable for a plethora of biomedical applications, including, but not limited to, cellular tracking [16], drug delivery [17], and tumor therapy [18]. However, the fabrication process of biomagnetic labeling materials can be relatively intricate, necessitating specific synthesis conditions and equipment [19] and thereby elevating production costs and complexity. Despite the enormous potential of smart magnetic labels [20], to date, there has been a scant number of publications that delineate convenient techniques for the detection of such magnetic labels [21]. The primary reason for this deficiency is the unsatisfactory nature of detection/readout methodologies [22]. Current research into magnetic labels employs the use of substantial apparatuses, such as the Vibrating Sample Magnetometer (VSM), the Magneto–Optical Kerr Effect (MOKE) [23], and magnetic force microscopy [24], to conduct analyses. The VSM has a relatively high lateral resolution and simple measurement pre-calibration steps, but it has a large volume limitation. The protracted duration of measurements and the elaborate preparation and procedural requirements, coupled with the necessity of costly equipment, have thus far detracted from the appeal of these methods.
Research on magnetic nanomaterials is largely focused on Fe3O4 NPs due to their excellent magnetism [25] and biocompatibility [26]. Currently, they are extensively studied and mainly used in areas such as adsorption [27] and targeted drug delivery. For example, Xu et al. coated Fe3O4 with Cu2O to catalyze the aerobic oxidation of benzyl alcohol, thereby achieving the adsorptive function of the catalyst [28]. Zhu et al. used Fe3O4@β-cyclodextrin nanocomposite materials to efficiently activate persulfates for the removal of bisphenol A [29]. Sadat Sadr et al. produced and characterized Fe-based biocompatible nanocarriers for the magnetic delivery of hydroxychloroquine using Fe3O4 [30]. Shariati et al. designed and synthesized gold nanorods/Fe3O4 intended for photothermal therapy and drug delivery [31]. Yang et al. prepared ZnO-capped flower-like porous carbon-Fe3O4 composite materials (FPCS-Fe3O4-ZnO), constructed as carriers for pH and microwave dual-triggered drug delivery [32]. These researchers all utilized the super paramagnetism of Fe3O4 NPs [33], which possess a high saturation magnetization, to achieve a driving effect on other Fe3O4 NPs. Our goal is to design a water-stable magnetic fluid that can be rapidly and simply magnetized and then use a portable detector to measure its residual magnetism (Br) to achieve rapid detection of magnetic labeling materials. To date, we have not found any reports using this principle for magnetic labeling materials.
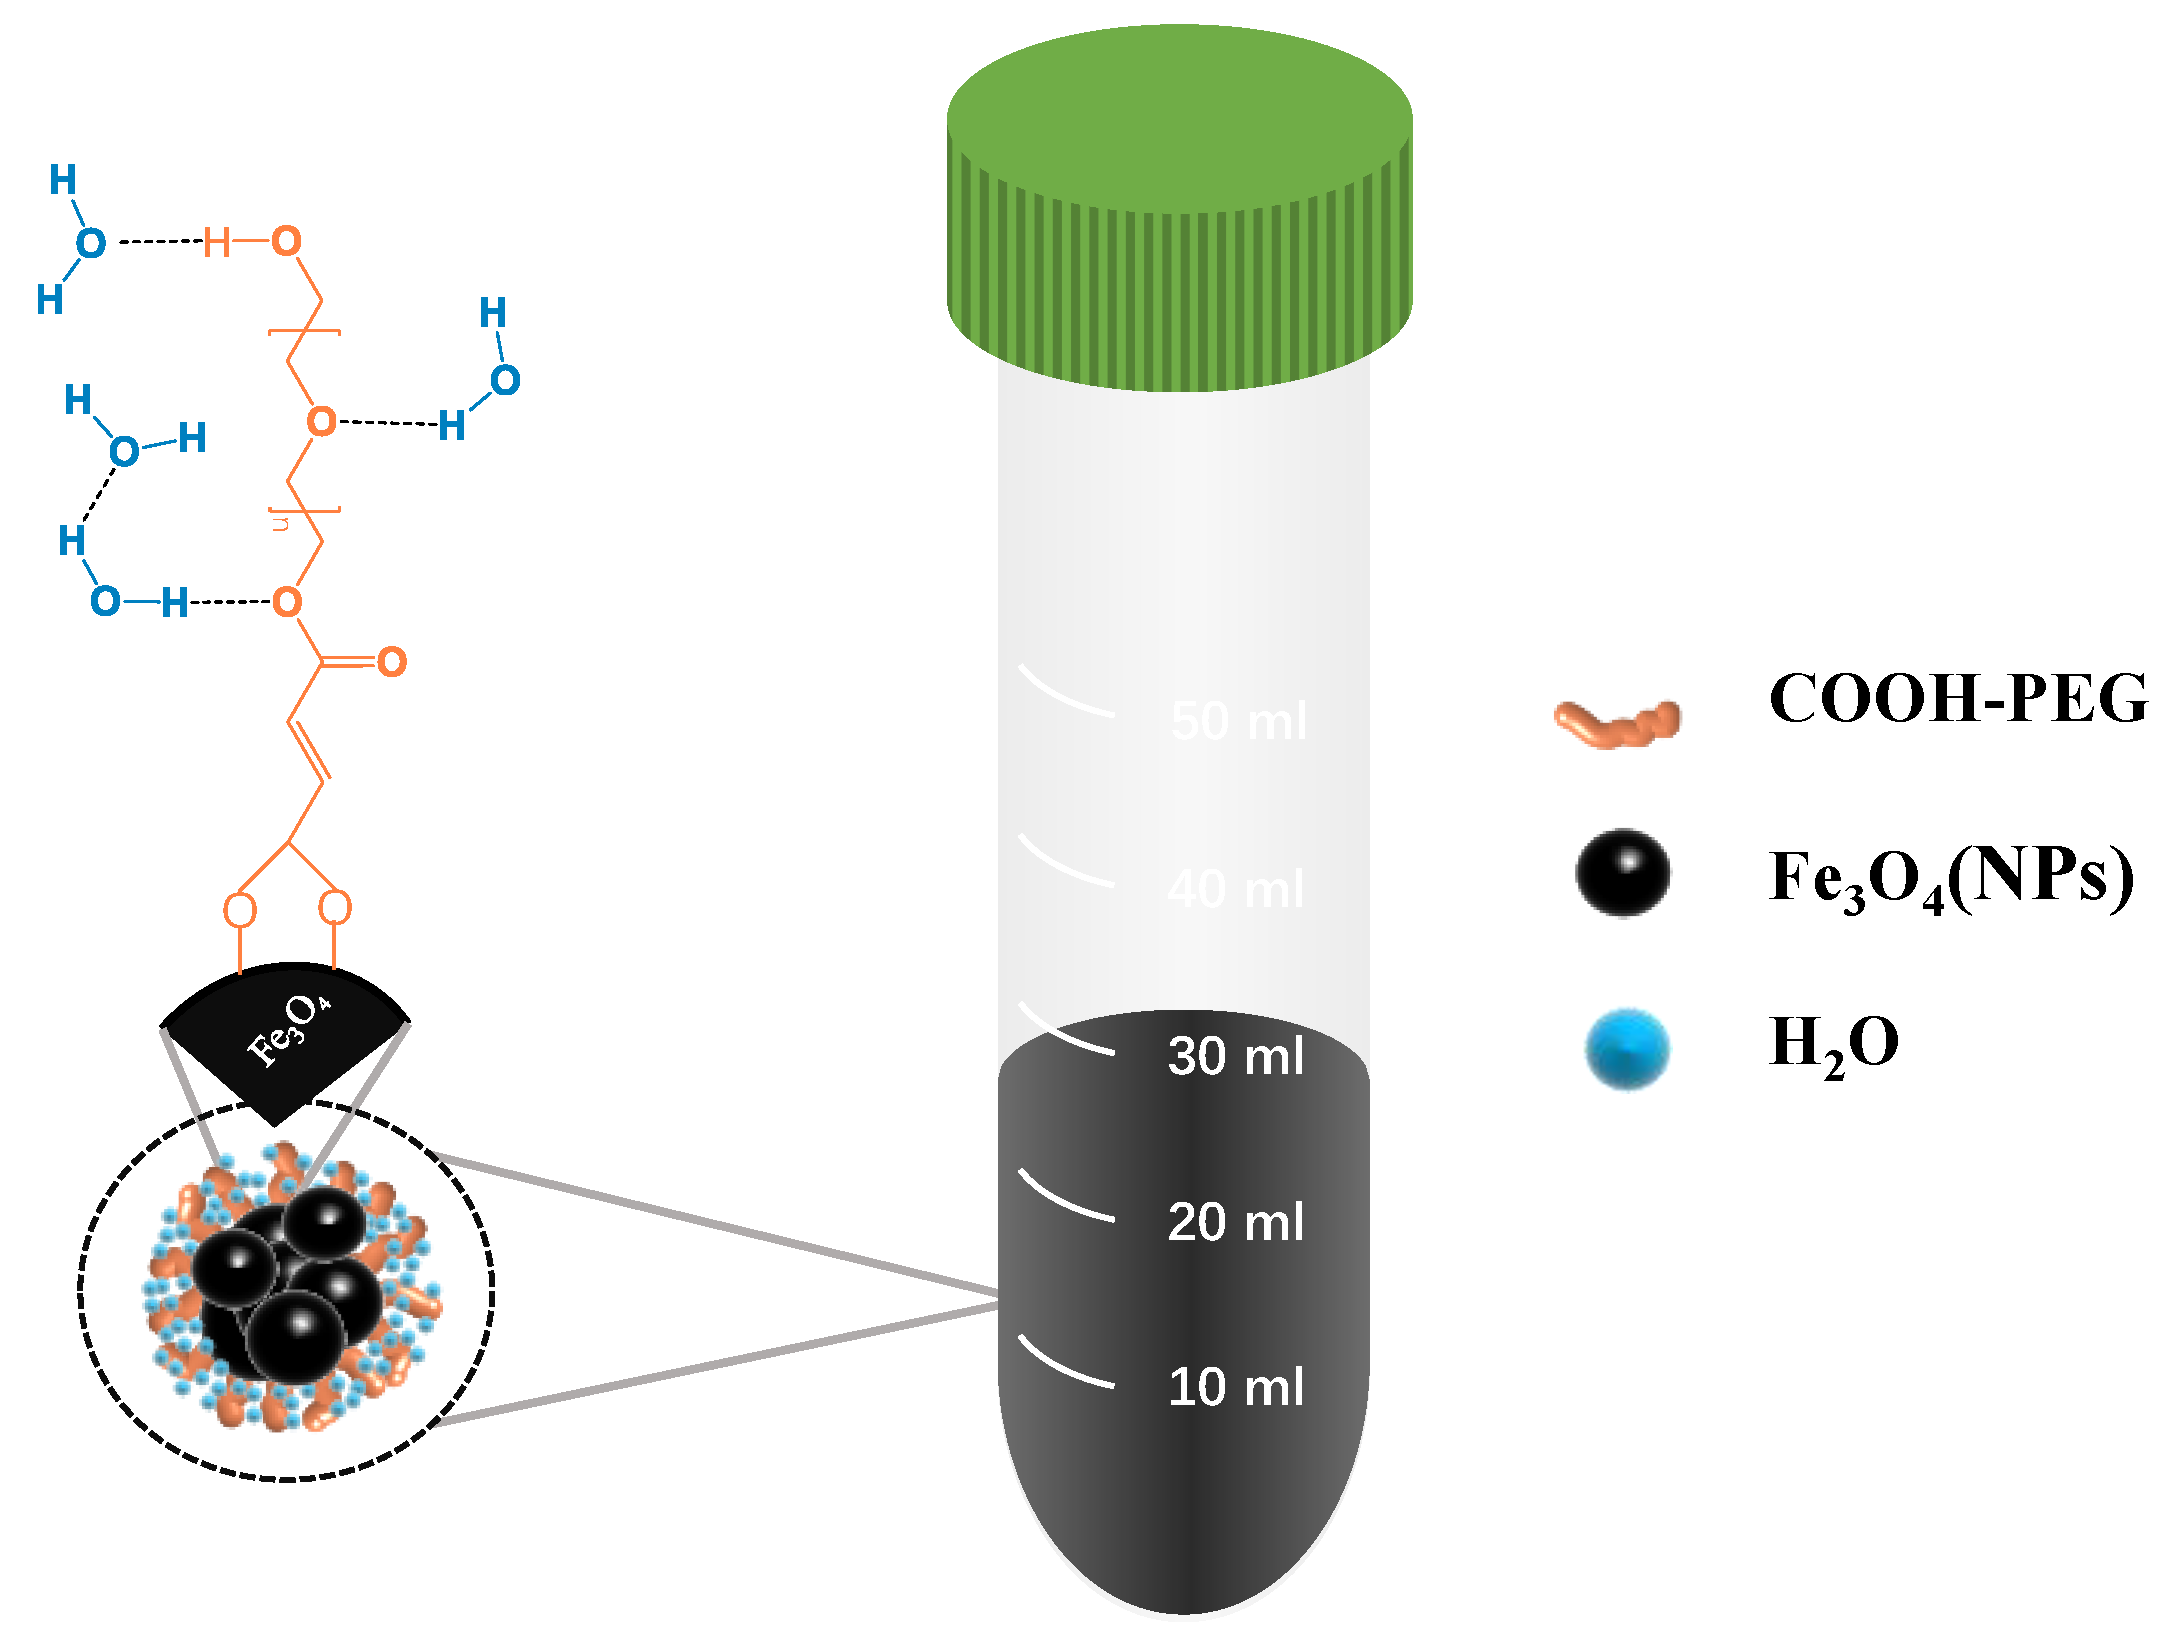
Based on these principles, we aim to synthesize a type of nanoparticle that is highly stable, has high Br, and is easy to prepare for use in the field. We plan to synthesize Fe3O4 nanoparticles (NPs) captured by hydrophilic materials (modified PEG) (Figure 1). This adsorption will make the surface of Fe3O4 NPs more hydrophilic, thereby granting them higher stability in water. In this study, we synthesized COOH-PEG@Fe3O4 (NP)-marked fluid as a magnetic marking fluid (Figure 2), in which the Fe3O4 (NPs) content reached 10 wt% and the mean particle size measured by dynamic light scattering was 1.75 μm. It remained stable in an aqueous phase for 7 days, and its high stability contributed to the dispersion of Fe3O4 (NPs). Using only 50 μL of the marking fluid to form a 1 cm spot, after drying and magnetizing for 30 s with a commercial magnet, a significant remanent magnetic signal could be detected using a handheld flux meter or a handheld optical pump magnetometer.

Figure 1.
Modification mechanism of PEG and Fe3O4 NPs.
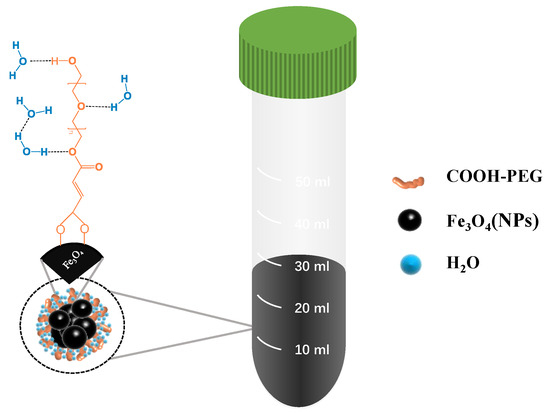
Figure 2.
Magnetic stabilizing fluid (COOH-PEG300@Fe3O4 (NPs)).
2. Materials and Methods
2.1. Materials
PEG300 (Aladdin average molecular weight: 300), PEG800 (Aladdin average molecular weight: 800), maleic anhydride (Aladdin purity: 99% AR), benzenesulfonic acid (Macklin purity: 98% anhydrous grade), anhydrous FeCl3 (Aladdin purity: AR), FeCl2·4H2O (Macklin purity: 98%), aqueous ammonia (Boer concentration: 25–27%), sodium oleate (Aladdin purity: AR), SDS (Aladdin purity: AR).
2.2. Preparation
2.2.1. Synthesis of COOH-PEG (COOH-PEG300 or COOH-PEG800)
The synthesis of COOH-PEG (including COOH-PEG300 and COOH-PEG800) was achieved by reacting PEG (PEG300 or PEG800) with maleic anhydride in a 1:1.1 molar ratio. To facilitate the reaction, 1 wt% of benzenesulfonic acid was added as a catalyst. The reaction mixture was magnetically stirred at 65 °C for 3 h. Special attention was paid to the stability of the reaction conditions, as maleic anhydride is prone to sublimation. Therefore, the reaction vessel was tightly sealed to prevent evaporation. Figure 1 illustrates the proposed reaction mechanism for this synthesis process.
2.2.2. Preparation of Fe3O4 Nanoparticles (Fe3O4 NPs)
Fe3O4 nanoparticles were prepared by mixing FeCl3 and FeCl2·4H2O solutions in a 2:1 molar ratio of Fe3+ to Fe2+. The resulting solution was filtered to obtain a clear reaction mixture. Subsequently, ammonia solution was added at a controlled molar ratio of nFe3+:nFe2+:nNH3·H2O = 2:1:2. The reaction was carried out at 45 °C under stirring at 2000 rpm using a digital overhead stirrer and simultaneous ultrasonic treatment at 70% power for 30 min. After the reaction, the product was filtered, washed six times with deionized water, and dried to obtain pure Fe3O4 nanoparticles for further characterization using SEM, XRD, TEM, and VSM techniques.
2.2.3. Preparation of Oleic Acid-Modified Fe3O4 Nanoparticles (Oleic Acid@Fe3O4 NPs)
For the preparation of oleic acid-modified Fe3O4 nanoparticles, FeCl3 and FeCl2·4H2O solutions were mixed in a 2:1 molar ratio of Fe3+ to Fe2+. Oleic acid sodium salt (0.0759 mmol/mL) and sodium dodecyl sulfate (SDS) (0.0134 mmol/mL) were added as modifiers. Ammonia solution was then added in a molar ratio of nFe3+:nFe2+:nNH3·H2O = 1:1:2, and the reaction was carried out at 45 °C under stirring and ultrasonic treatment for 30 min. After completion, the product was filtered, washed, and dried to obtain oleic acid-modified Fe3O4 nanoparticles for characterization using XRD and VSM.
2.2.4. Preparation of COOH-PEG-Modified Fe3O4 Nanoparticles (COOH-PEG@Fe3O4(NPs))
To synthesize COOH-PEG-modified Fe3O4 nanoparticles, FeCl3 and FeCl2·4H2O were mixed in a 2:1 molar ratio of Fe3+ to Fe2+, and 1 wt% of COOH-PEG300 or COOH-PEG800 was added as a modifier. Ammonia solution was subsequently added to maintain a molar ratio of nFe3+:nFe2+:nNH3·H2O = 2:1:2. The reaction was conducted at 45 °C under ultrasonic stirring for 30 min. After filtering, washing six times with deionized water, and drying, the product was obtained as COOH-PEG-modified Fe3O4 nanoparticles, labeled as COOH-PEG300@Fe3O4 NPs or COOH-PEG800@Fe3O4 NPs, respectively. These nanoparticles were characterized using SEM, XRD, TEM, and VSM techniques.
2.2.5. Preparation of Magnetic Labeling Solution (COOH-PEG@Fe3O4 Magnetic Labeling Solution)
To prepare the magnetic labeling solution containing COOH-PEG@Fe3O4 nanoparticles, FeCl3 and FeCl2·4H2O were mixed in a 2:1 molar ratio of Fe3+ to Fe2+, and 1 wt% of COOH-PEG300 was added. Ammonia solution was added in a molar ratio of nFe3+:nFe2+:nNH3·H2O = 2:1:2, and the reaction was carried out at 45 °C under ultrasonic stirring for 30 min. By precisely controlling the mass of Fe3+ and Fe2+ input, magnetic labeling solutions containing 5 wt% or 10 wt% COOH-PEG300@Fe3O4 (NPs) were prepared for further testing using DLS and magnetic detection methods.
2.3. Characterization
2.3.1. Nuclear Magnetic Resonance Spectrometer (1HNMR)
The molecular structures of synthetically modified COOH-PEG300 and COOH-PEG800 were characterized using a 600 MHz NMR spectrometer (JNM-ECA600, JEOL, Tokyo, Japan).
2.3.2. Fourier Transform Infrared Spectroscopy (IR)
Infrared spectroscopy provides information on molecular vibrational modes. The Fourier Transform Infrared (FTIR) Spectrometer (Bruker TENSOR27, Bruker, Mannheim, Germany) was used to analyze samples to characterize molecular structures and identify products, with a scanning range of 4000 to 400 cm−1 and 32 scans.
2.3.3. Scanning Electron Microscopy (SEM) and Transmission Electron Microscopy (TEM)
A scanning electron microscope (SU3500, Hitachi, Tokyo, Japan) was used to observe the micro-morphology of magnetic nanoparticles, with an acceleration voltage of 5–15 kV. SEM sample preparation: the COOH-PEG@Fe3O4 (NP)-labeled solution and Fe3O4 (NP)-labeled solution were dropped directly on the sample stage. The transmission electron microscope (JEM 2100 LaB6, JEOL, Tokyo, Japan) observed the internal structure of the sample through transmission, providing high-resolution images. TEM sample preparation: COOH-PEG@Fe3O4 (NPs) and Fe3O4 (NPs) were dispersed in ethanol, crushed with an ultrasonic disruptor, and then dropped onto a double-grid carbon film for sample preparation.
2.3.4. EDX Spectrum
An EDX X-ray spectrometer (micro-XRF, IXRF, Austin, TX, USA) analyzed the elemental distribution of the sample surface, and a two-dimensional mapping chart showed the elemental distribution.
2.3.5. X-ray Diffractometer (XRD)
The DX-2700BHmodel X-ray diffractometer was used for XRD testing (HaoYuan, Dandong, China), with a scanning rate of 2°/min, using Cu-Kα radiation (λ = 1.54 nm). It characterized the crystal structure, crystallinity, and grain size of Fe3O4 (NPs).
2.3.6. Dynamic Light Scattering (DLS)
The prepared magnetic marking liquid was in a liquid environment. Dynamic light scattering (DLS) (Litesizer 500, AntOn Paar, Graz, Austria) was used to measure the particle size and zeta potential of the prepared magnetic liquid. The zeta potential was used to characterize its stability in aqueous systems. AntOn Paar software cumulant fitting was set to export the particle size distribution, and Origin was used to directly plot it.
2.3.7. Vibration Sample Magnetometer (VSM)
The Vibrating Sample Magnetometer (VSM), model (BKT-4500, Xinke Gaoce Technology Co., Ltd., Qingdao, China), measured the magnetic behavior of solid samples under varying magnetic fields, including parameters such as the magnetic moment and magnetic susceptibility. By measuring the sample’s response in the range of −4000 to 4000 Oe, the magnetic properties of the material, as well as the microstructure and magnetic mechanisms within the material, were revealed. The obtained data was directly plotted in Origin.
2.3.8. Rapid Measurement of the Magnetic Field
The handheld fluxmeter (TM4300B handheld triaxial fluxgate magnetometer, TUNKIA, Changsha, China) was used to detect the magnitude of weak residual magnetic fields with a measuring range of 0–100 μT and a resolution of 0.01 μT. The handheld optically pumped magnetometer (QTFA-00U optically pumped magnetometer, QuSpin, Louisville, CO, USA) was used to detect the magnitude of weak residual magnetic fields, with a dynamic range of 1000–100,000 nT and a resolution of 0.05 nT. First, 50 μL of the prepared magnetic marking liquid was taken and dropped onto filter paper to form a circular spot with a diameter of 1 cm. After the spot dried, it was magnetized for 30 s using a commercial neodymium–iron–boron magnet (60 mm in diameter with a maximum field strength of 1500 G). Then, the black marker was placed on the probe of the handheld fluxmeter and scanned (intervals of 10 s, place for 5 s) or the handheld optically pumped magnetometer was used to detect the residual magnetism (intervals of 1 min, place for 5 s). The handheld flux meter has a data saving function, allowing users to save data points for testing and input them directly into Origin for plotting. The handheld optical pump magnetometer uses QTFM 2-channel V1.0.14 software to connect to the computer, test and save data points, and import them into Origin for plotting.
3. Results
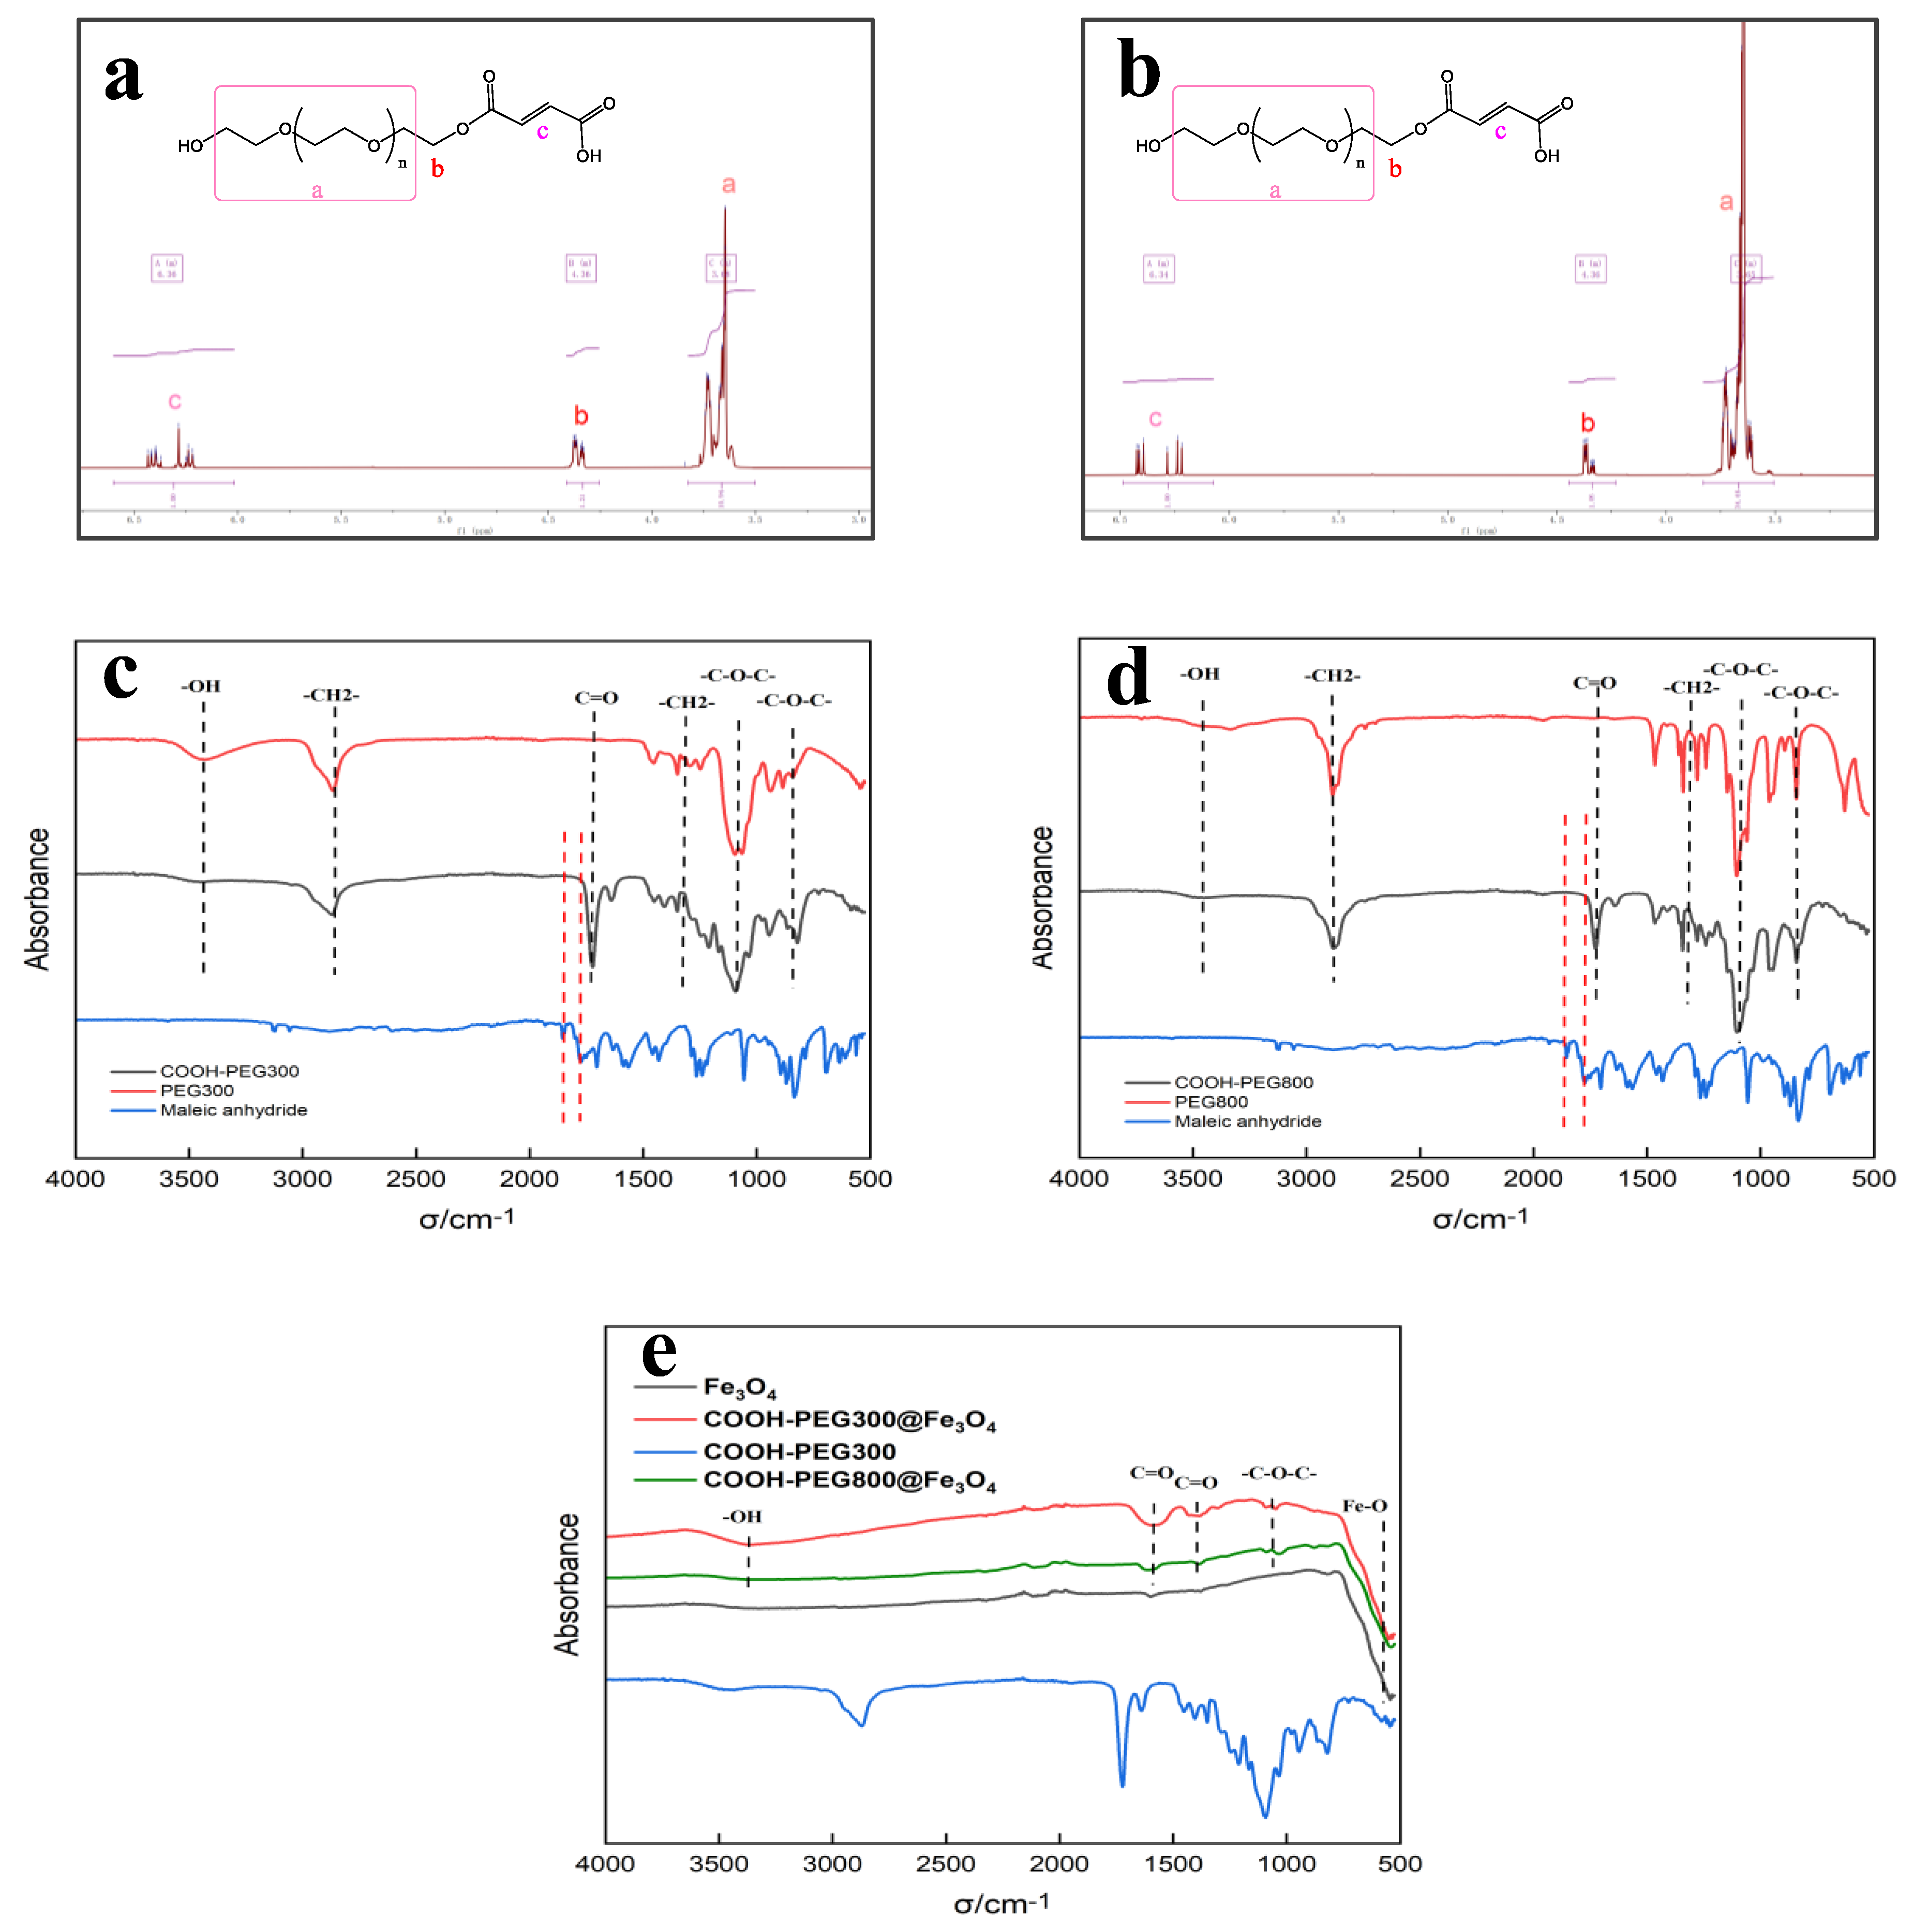
The synthesis of Fe3O4 (NPs) and COOH-PEG@Fe3O4 (NPs) was carried out using a straightforward co-precipitation method, as shown in Figure 1. The advantages of the co-precipitation method include its simple operation, high efficiency, and convenience for large-scale preparation. We characterized the modified PEG through proton nuclear magnetic resonance (NMR) and infrared spectroscopy, as shown in Figure 3a (1H NMR of COOH-PEG300 resulted in 1H NMR (600 MHz, chloroform-d) δ 6.60–6.02 (m, 1H), 4.41–4.25 (m, 1H), 3.82–3.50 (m, 11H)) and Figure 3b (1H NMR of COOH-PEG800 resulted in 1H NMR (600 MHz, chloroform-d) δ 6.49–6.07 (m, 1H), 4.44–4.23 (m, 1H), 3.83–3.51 (m, 34H)). Based on the integration of the NMR results, the successful synthesis of COOH-PEG300 and COOH-PEG800 was proven, with each PEG molecule bearing a single -COOH group. Figure 3c,d show the infrared spectra of PEG300 and PEG800 before and after esterification. In the spectra, the infrared absorption changes in the range of 1840–1600 cm−1 are of primary interest. Among them, 1856 cm−1 and 1775 cm−1 correspond to the infrared absorption peaks of the two conjugated carbonyl groups in maleic anhydride (Figure 3c,d in red dashed lines). The former represents the antisymmetric vibration-coupling band of the two C=O bonds on the maleic anhydride ring, while the latter represents their symmetric vibration-coupling band [34]. After esterification, these two peaks disappeared (Figure 3c,d in red dashed lines). Additionally, the carboxy PEG showed an enhanced absorption peak at 1728 cm−1. This is because, after the esterification reaction, the two conjugated carbonyl groups in the maleic anhydride are opened, forming an ester carbonyl and a carboxylic acid carbonyl; thus, a distinct C=O bond vibration absorption peak appears at 1728 cm−1. In summary, by observing the changes in absorption peak intensities at different wavenumbers and the NMR results, it was proven that high-purity carboxylic COOH-PEG300 and COOH-PEG800 were successfully synthesized through a simple one-step method.
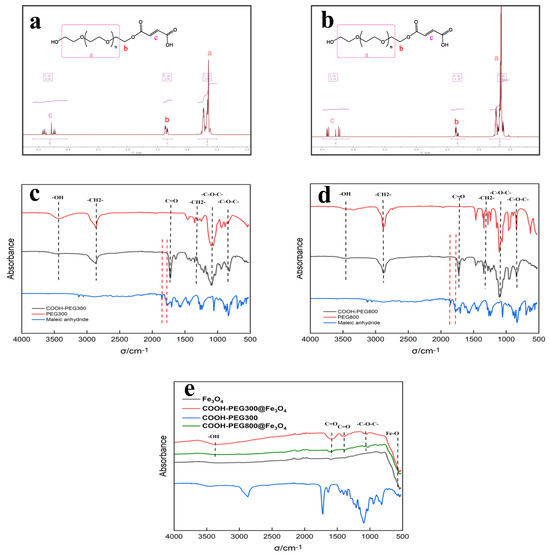
Figure 3.
(a) 1H NMR of COOH-PEG300, a corresponds to the hydrogen atom in the PEG segment (-C-C-O-), b corresponds to the hydrogen atom in the PEG segment (-C-O-), and c corresponds to the hydrogen atom in the PEG segment (-C=C-); (b) 1H NMR of COOH-PEG800, a, b and c correspond to the same as above; (c) IR of COOH-PEG300, PEG300, and maleic anhydride; (d) IR of COOH-PEG800, PEG800, and maleic anhydride; (e) IR of COOH-PEG300@Fe3O4, COOH-PEG800@Fe3O4, Fe3O4, and COOH-PEG300.
Figure 3e shows the infrared spectra of COOH-PEG300@Fe3O4 (NPs), COOH-PEG800@Fe3O4 (NPs), and Fe3O4 (NPs). In the spectra, the absorption peak at the wavenumber of 584 cm−1 is caused by the vibration of the Fe-O bond [35], which is the characteristic absorption peak of Fe3O4. The absorption peaks at wavenumbers 1384 cm−1 and 1579 cm−1 are characteristic of the C=O bond [36], while the peak at 1080 cm−1 corresponds to the characteristic absorption peak of the -C-O-C- bond, indicating that the surface of the Fe3O4 (NPs) was successfully modified with carboxyl PEG300 or PEG800. Notably, at the bands 1384 cm−1 and 1579 cm−1, the peak intensity of COOH-PEG300@Fe3O4 (NPs) is higher than that of COOH-PEG800@Fe3O4 (NPs). This is because, under the condition that 1 wt% of COOH-PEG300 or COOH-PEG800 is added, COOH-PEG300 contains more -COOH groups, making the surface of COOH-PEG300@Fe3O4 (NPs) have more C=O bonds [37].
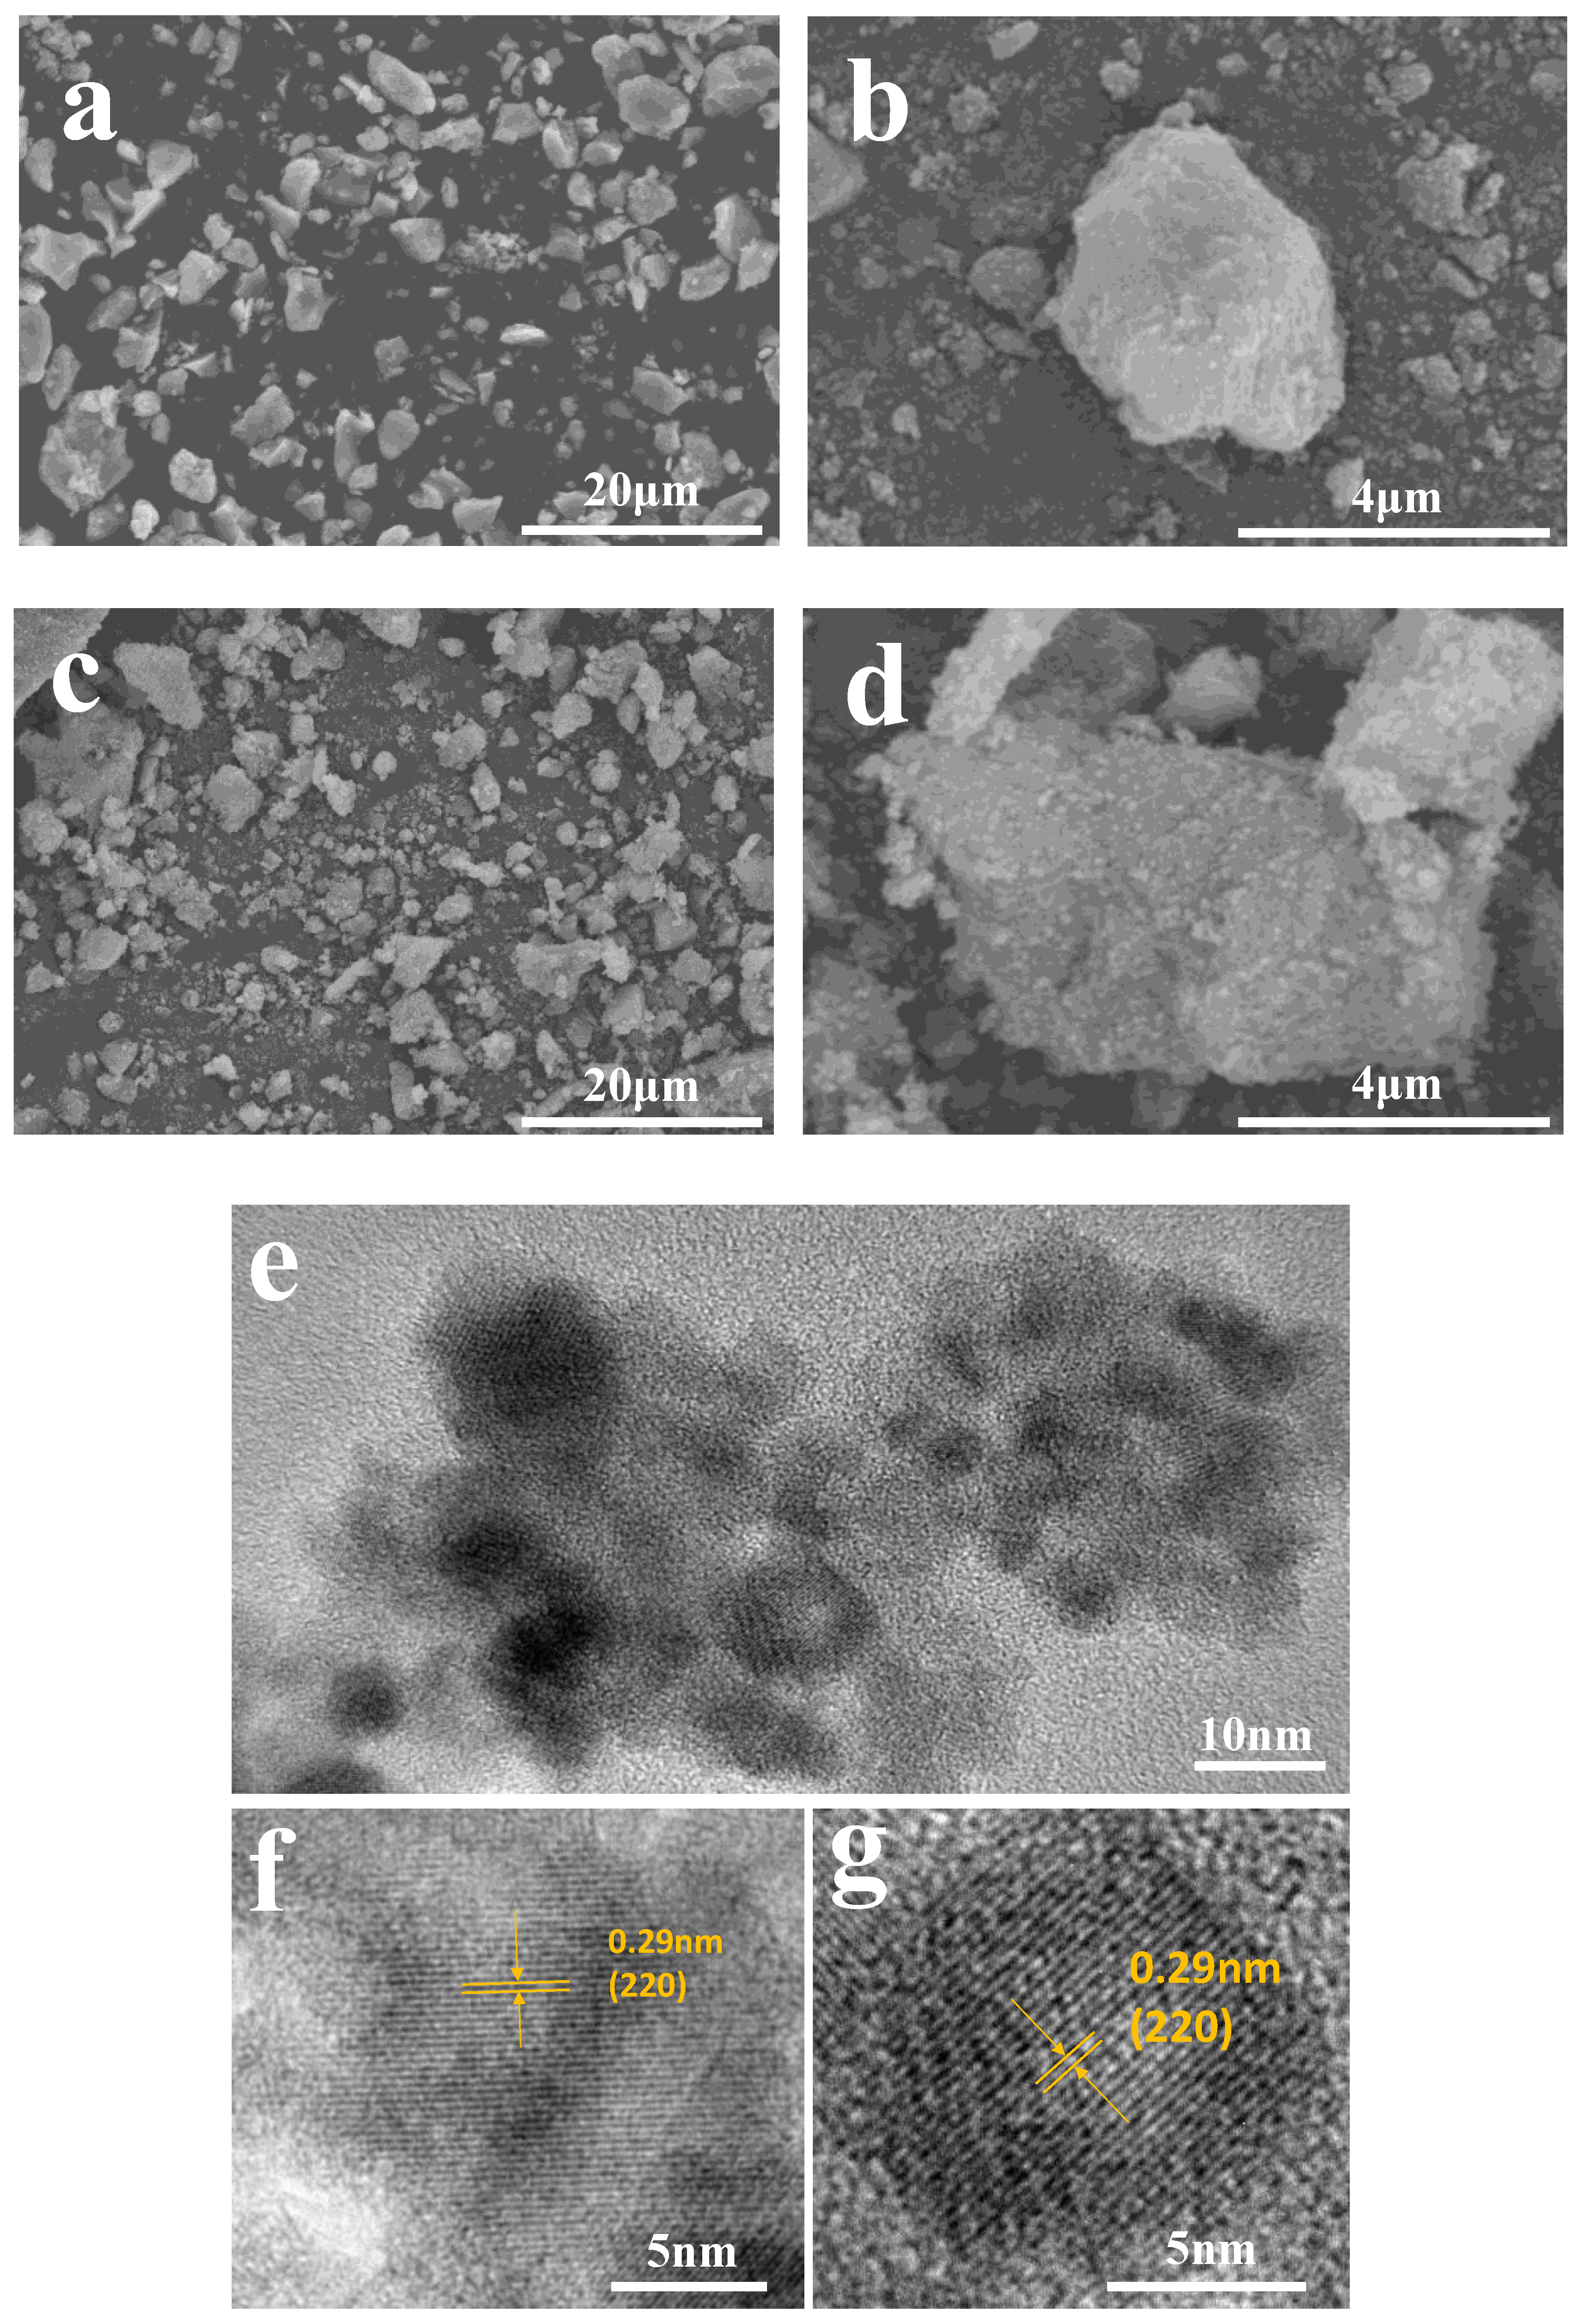
As shown in Figure 3e, COOH-PEG300@Fe3O4 NPs contain more C=O, indicating that more COOH-PEG is loaded on the surface of Fe3O4 NPs. We characterized the morphology and structure of COOH-PEG300@Fe3O4 (NPs) and Fe3O4 (NPs) using scanning electron microscopy (SEM) and transmission electron microscopy (TEM). Figure 4a,b shows the micrographs of pure Fe3O4 (NPs), and compared with Figure 4c,d, it is clear that the surface of pure Fe3O4 (NPs) is relatively smooth. Figure 4d distinctly reveals that the surface of COOH-PEG300@Fe3O4 (NPs) possesses tiny particles, and there are complex physical and chemical interactions between the -COOH groups and the hydroxyl groups on the surface of Fe3O4 nanoparticles [38], which result in a large number of -COO−- bonds on the surface of Fe3O4 (NPs) [37]. As a consequence, COOH-PEG300@Fe3O4 NPs exhibit a characteristic rough surface. We used an ultrasonic crusher to break down COOH-PEG300@Fe3O4 (NPs) to produce a sample suitable for transmission electron microscopy. Figure 4e is a photo of COOH-PEG300@Fe3O4 (NPs) under high-resolution transmission electron microscopy (HRTEM), showing the NPs’ high crystallinity clearly. Through HRTEM, we observed the (220) plane lattice spacing of 0.29 nm, revealing that COOH-PEG300@Fe3O4 NPs are composed of multiple highly crystalline microcrystals ranging from 5–30 nm, demonstrating a multicore structure.
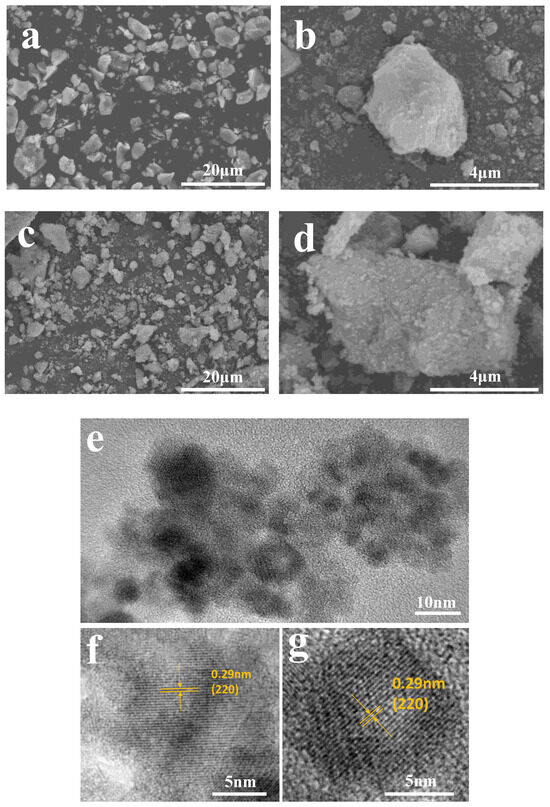
Figure 4.
(a,b) SEM images of Fe3O4 (NPs) at different magnifications; (c,d) SEM images of COOH-PEG300@Fe3O4 (NPs) at different magnifications; (e) TEM images of COOH-PEG300@Fe3O4 (NPs); (f,g) HRTEM images of COOH-PEG300@Fe3O4 (NPs).
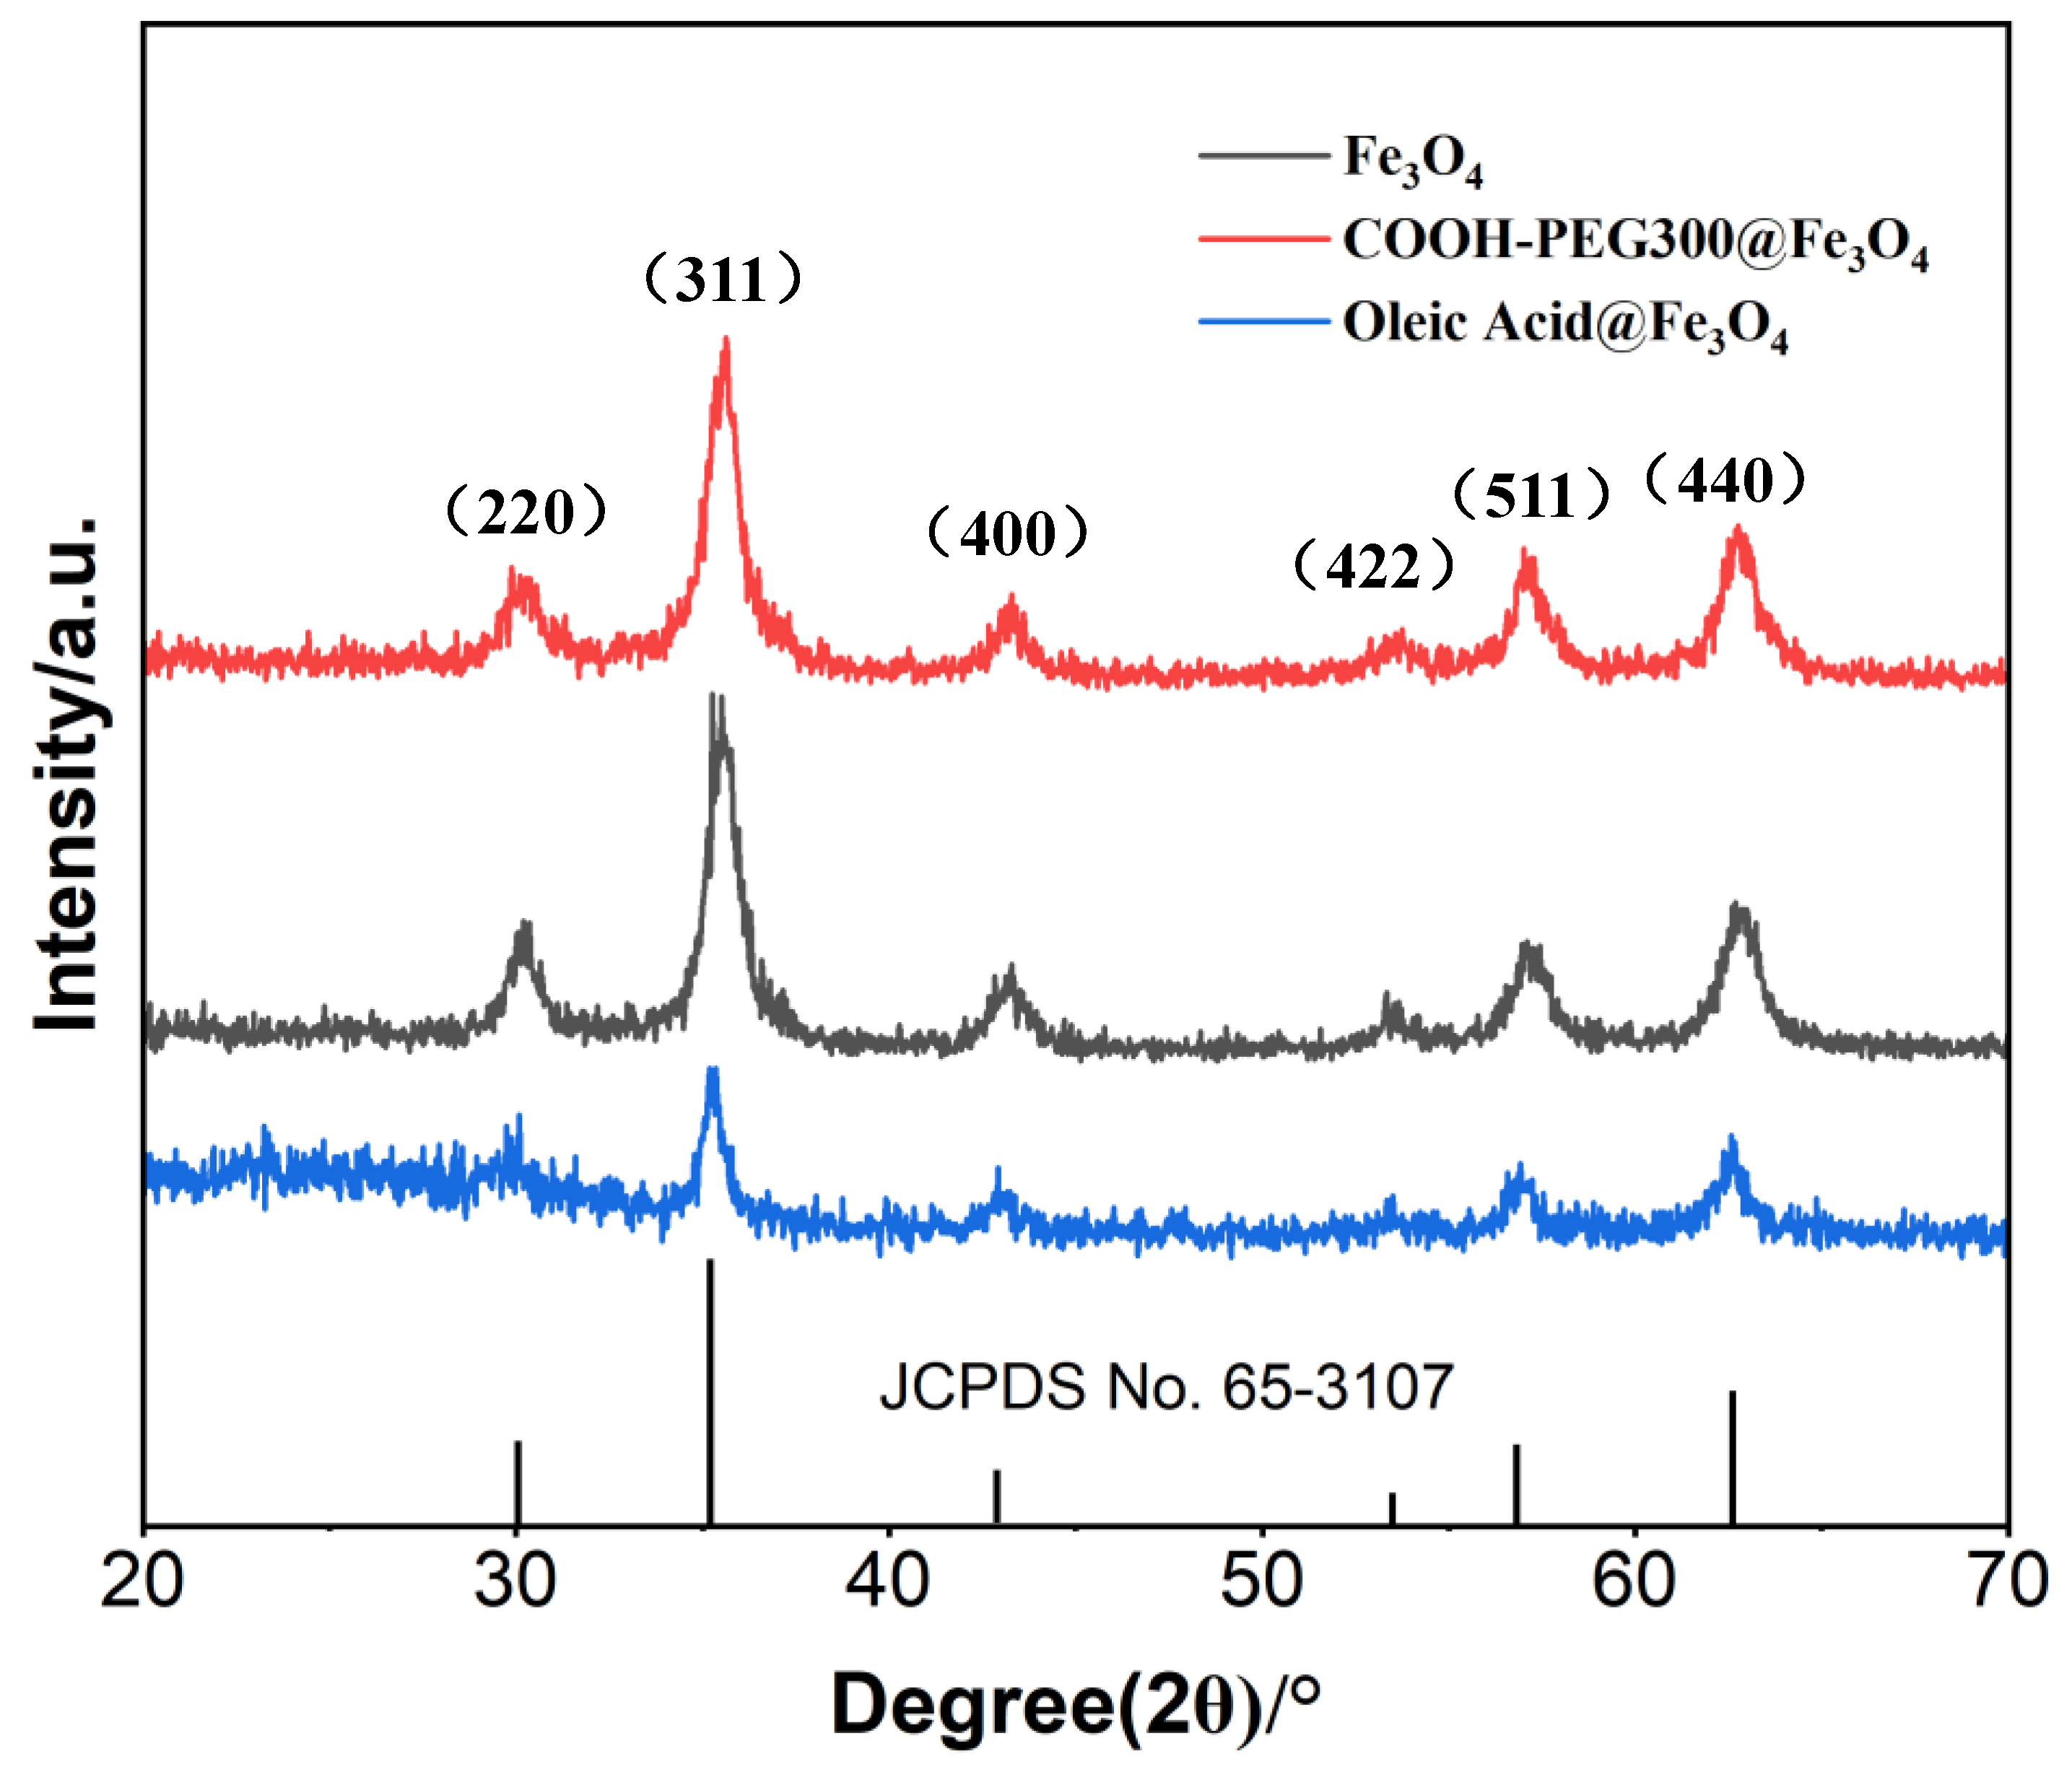
The crystallinity of the three prepared nanoparticles (NPs) was characterized by XRD, as shown in Figure 5. To compare the crystallinity, we presented a previously failed case—oleic acid@Fe3O4 (NPs). The peak intensity of oleic acid@Fe3O4 (NPs) was the weakest, leading us to abandon it as the preferred target for labeling materials due to the positive correlation between crystallinity and magnetic properties [39]. From the spectra in Figure 5, the positions and intensities of the diffraction peaks are consistent with the standard data of Fe3O4 (JCPDS No. 65-3107). The average particle sizes of COOH-PEG300@Fe3O4 (NPs), Fe3O4 (NPs), and oleic acid@Fe3O4 (NPs) were calculated using the Scherrer formula, resulting in values of 19.36 nm, 19.22 nm, and 16.02 nm. This indicates that the products obtained by the three methods are all Fe3O4 and possess a cubic crystal structure. XRD shows no presence of other iron elements such as Fe2O3 and FeO. Notably, the peak heights of COOH-PEG300@Fe3O4 (NPs) and Fe3O4 (NPs) are similar, but the peak intensity of oleic acid@Fe3O4 is significantly the weakest, demonstrating that the addition of COOH-PEG300 does not affect the crystallinity of Fe3O4, whereas oleic acid reduces the crystallinity of Fe3O4.
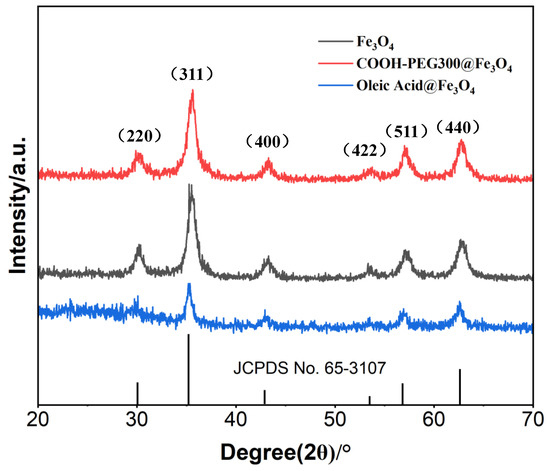
Figure 5.
XRD patterns of as-synthesized Fe3O (NPs), COOH-PEG300@Fe3O4 (NPs), and oleic acid@Fe3O4 (NPs).
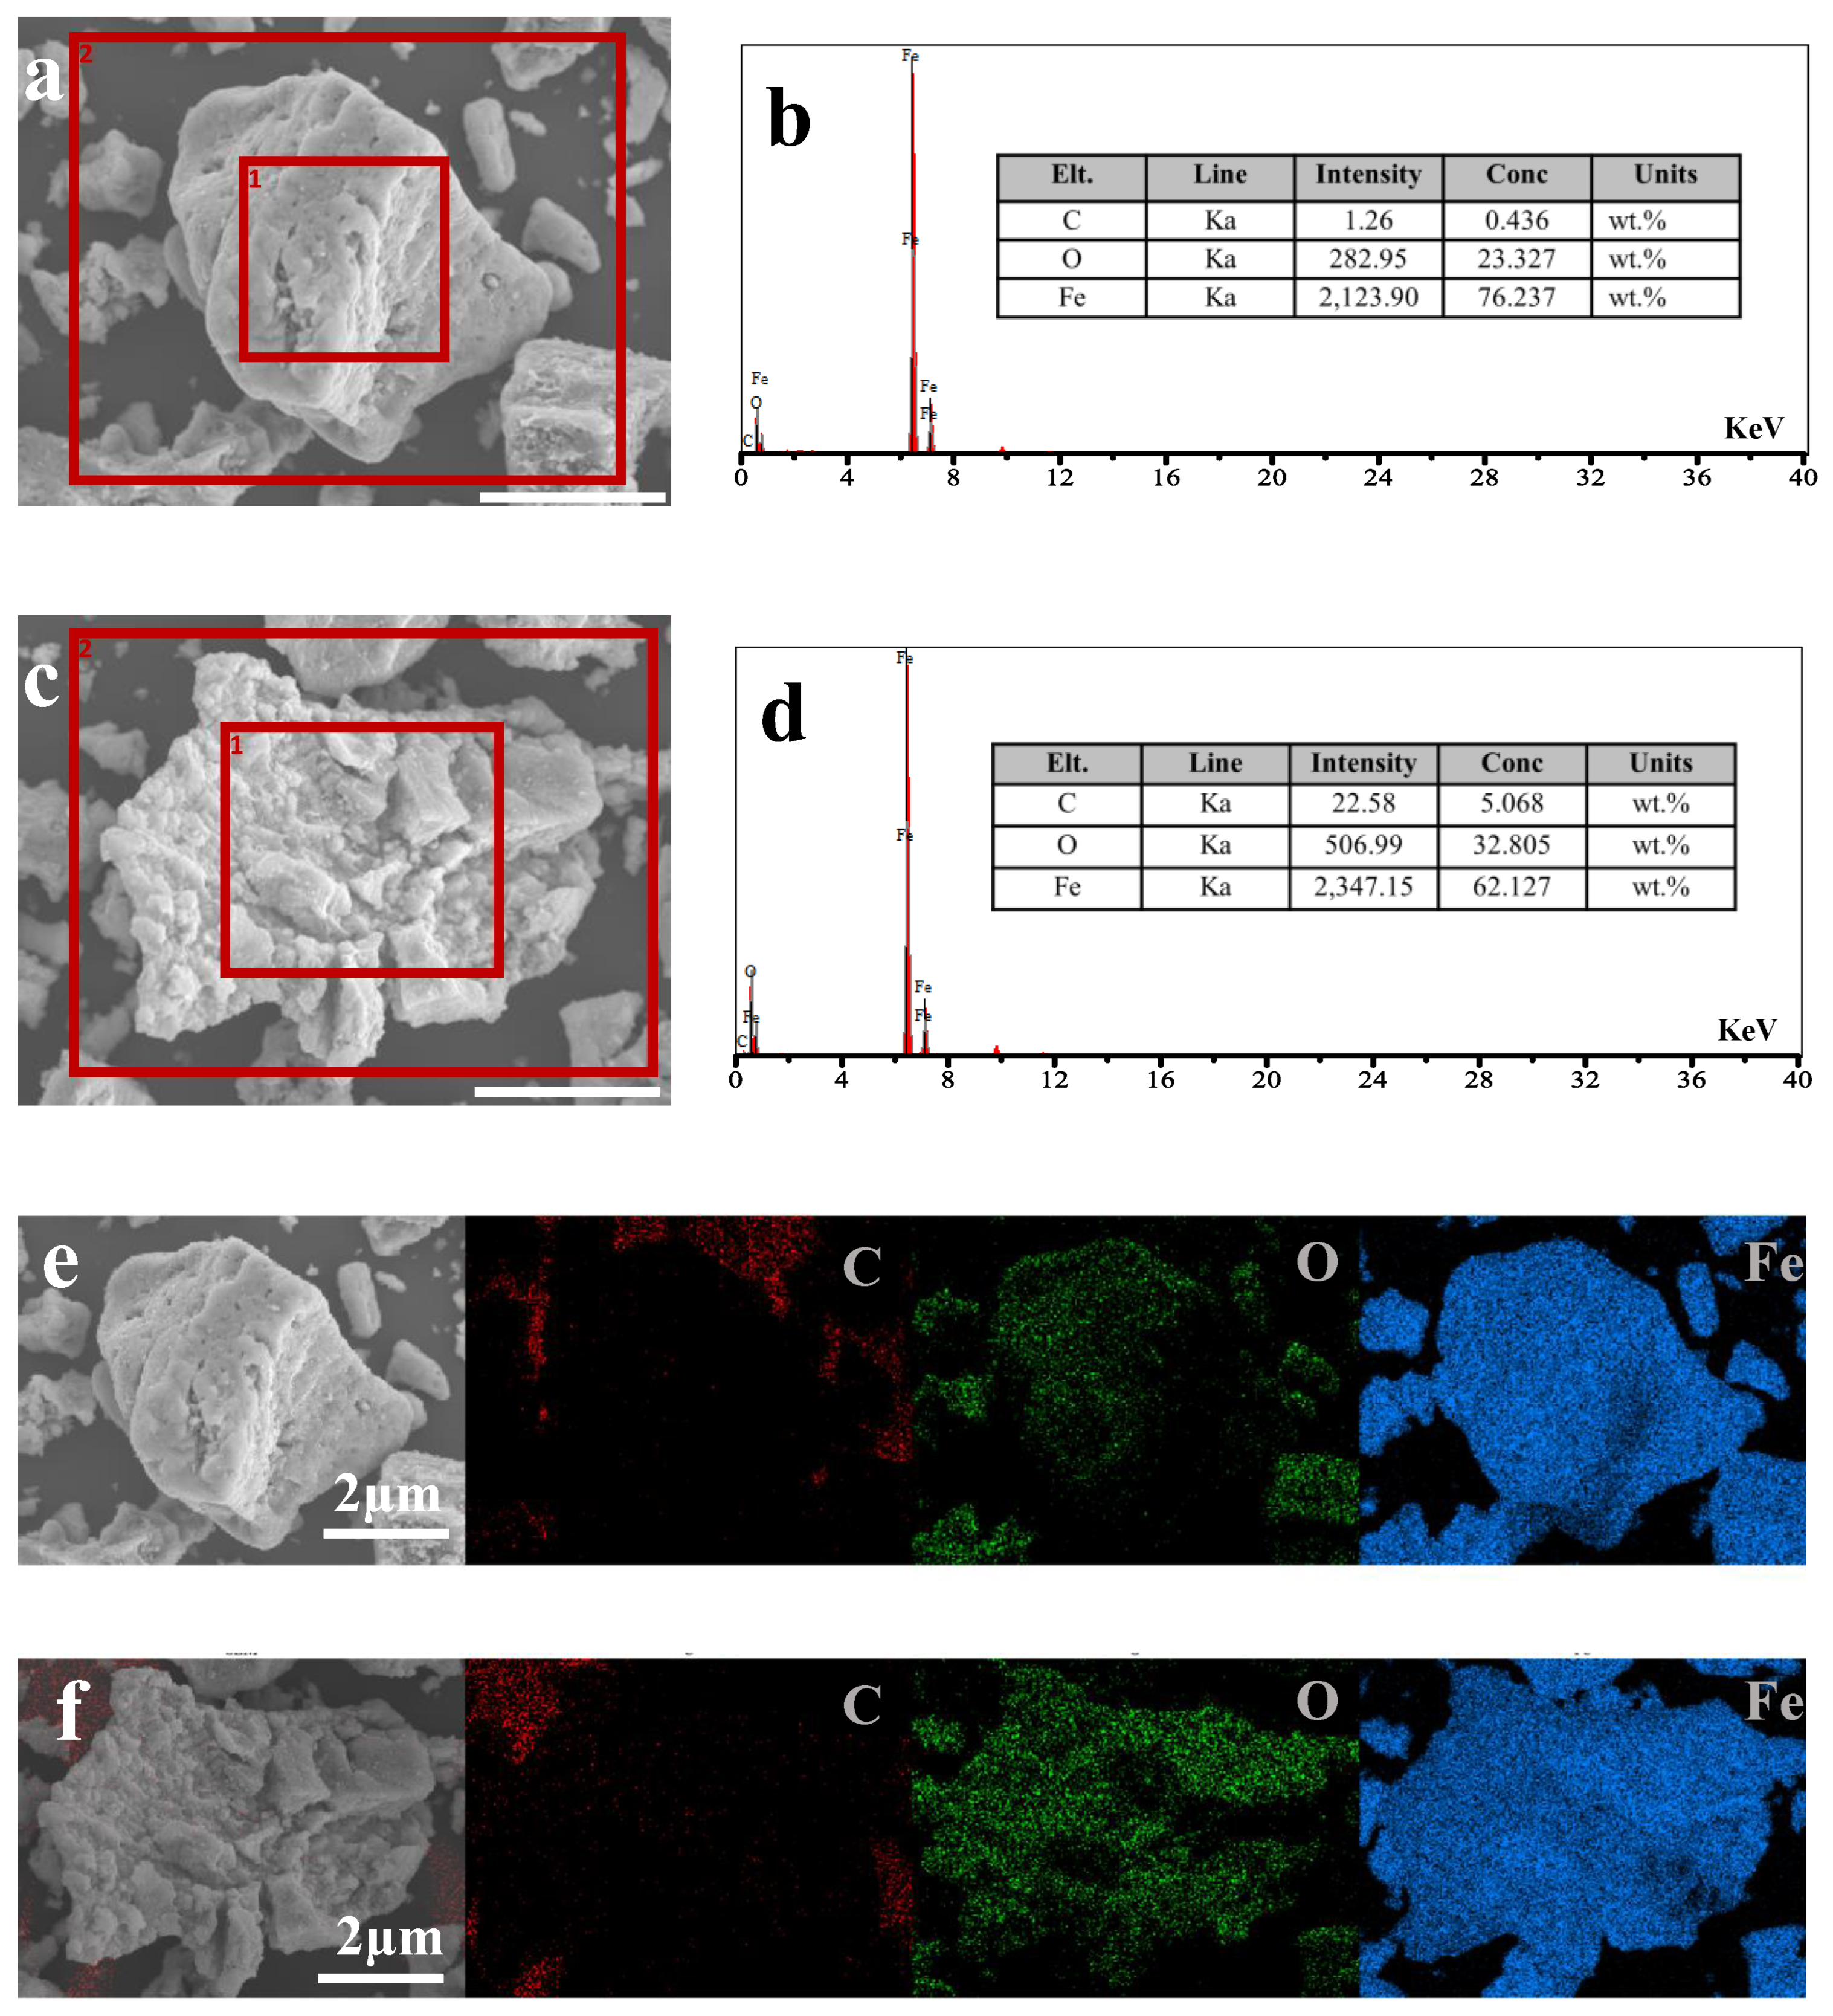
To determine how much COOH-PEG300 remains on the surface of Fe3O4 nanoparticles (NPs), EDX analysis of the elemental content on the surfaces of COOH-PEG300@Fe3O4 (NPs) and pure Fe3O4 (NPs) was conducted, as shown in Figure 6b,d. These figures, respectively, show the elemental content of Fe3O4 (NPs) and COOH-PEG300@Fe3O4 (NPs), with Fe3O4 (NPs) containing C (0.436 ± 0.1 wt%), O (23.327 ± 0.1 wt%), and Fe (76.237 ± 0.1 wt%) and COOH-PEG300@Fe3O4 (NPs) containing C (5.068 ± 0.1 wt%), O (32.805 ± 0.1 wt%), and Fe (62.107 ± 0.1 wt%). The increase in carbon content indicates the presence of COOH-PEG300 on the surface of Fe3O4. Based on the total amount added in the reaction, the theoretical mass ratio of mC:mFe is approximately 1:6.96. According to Figure 6d, the actual mC:mFe ratio is calculated to be about 1:12.25, resulting in an actual ≈56.7 wt% of COOH-PEG300 reacted on the surface of Fe3O4 (NPs). Figure 6e,f show the mapping of elemental distribution for Fe3O4 (NPs) and COOH-PEG300@Fe3O4 (NPs) (excluding the obvious substrate carbon), respectively. The carbon content distribution in COOH-PEG300@Fe3O4 (NPs) is relatively uniform (Figure 6f), demonstrating that PEG molecular chains are evenly distributed on the surface of Fe3O4 (NPs).
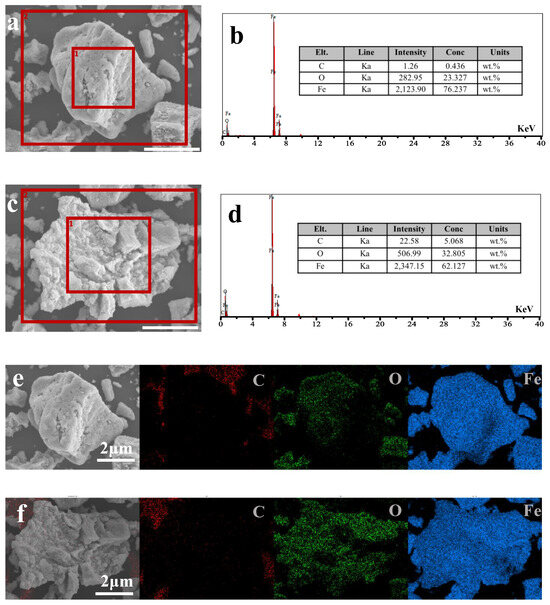
Figure 6.
(a) SEM images of Fe3O4 (NPs) (ruler = 2 μm), (b) elemental content within the box in (a) 1 as characterized by EDX, (c) SEM images of COOH-PEG300@Fe3O4 (NPs) (ruler = 2 μm), (d) elemental content within the box in (c) 1 as characterized by EDX, (e) the elemental mapping within the box in (a) 2 as characterized by EDX, (f) the elemental mapping within the box in (c) 2 as characterized by EDX.
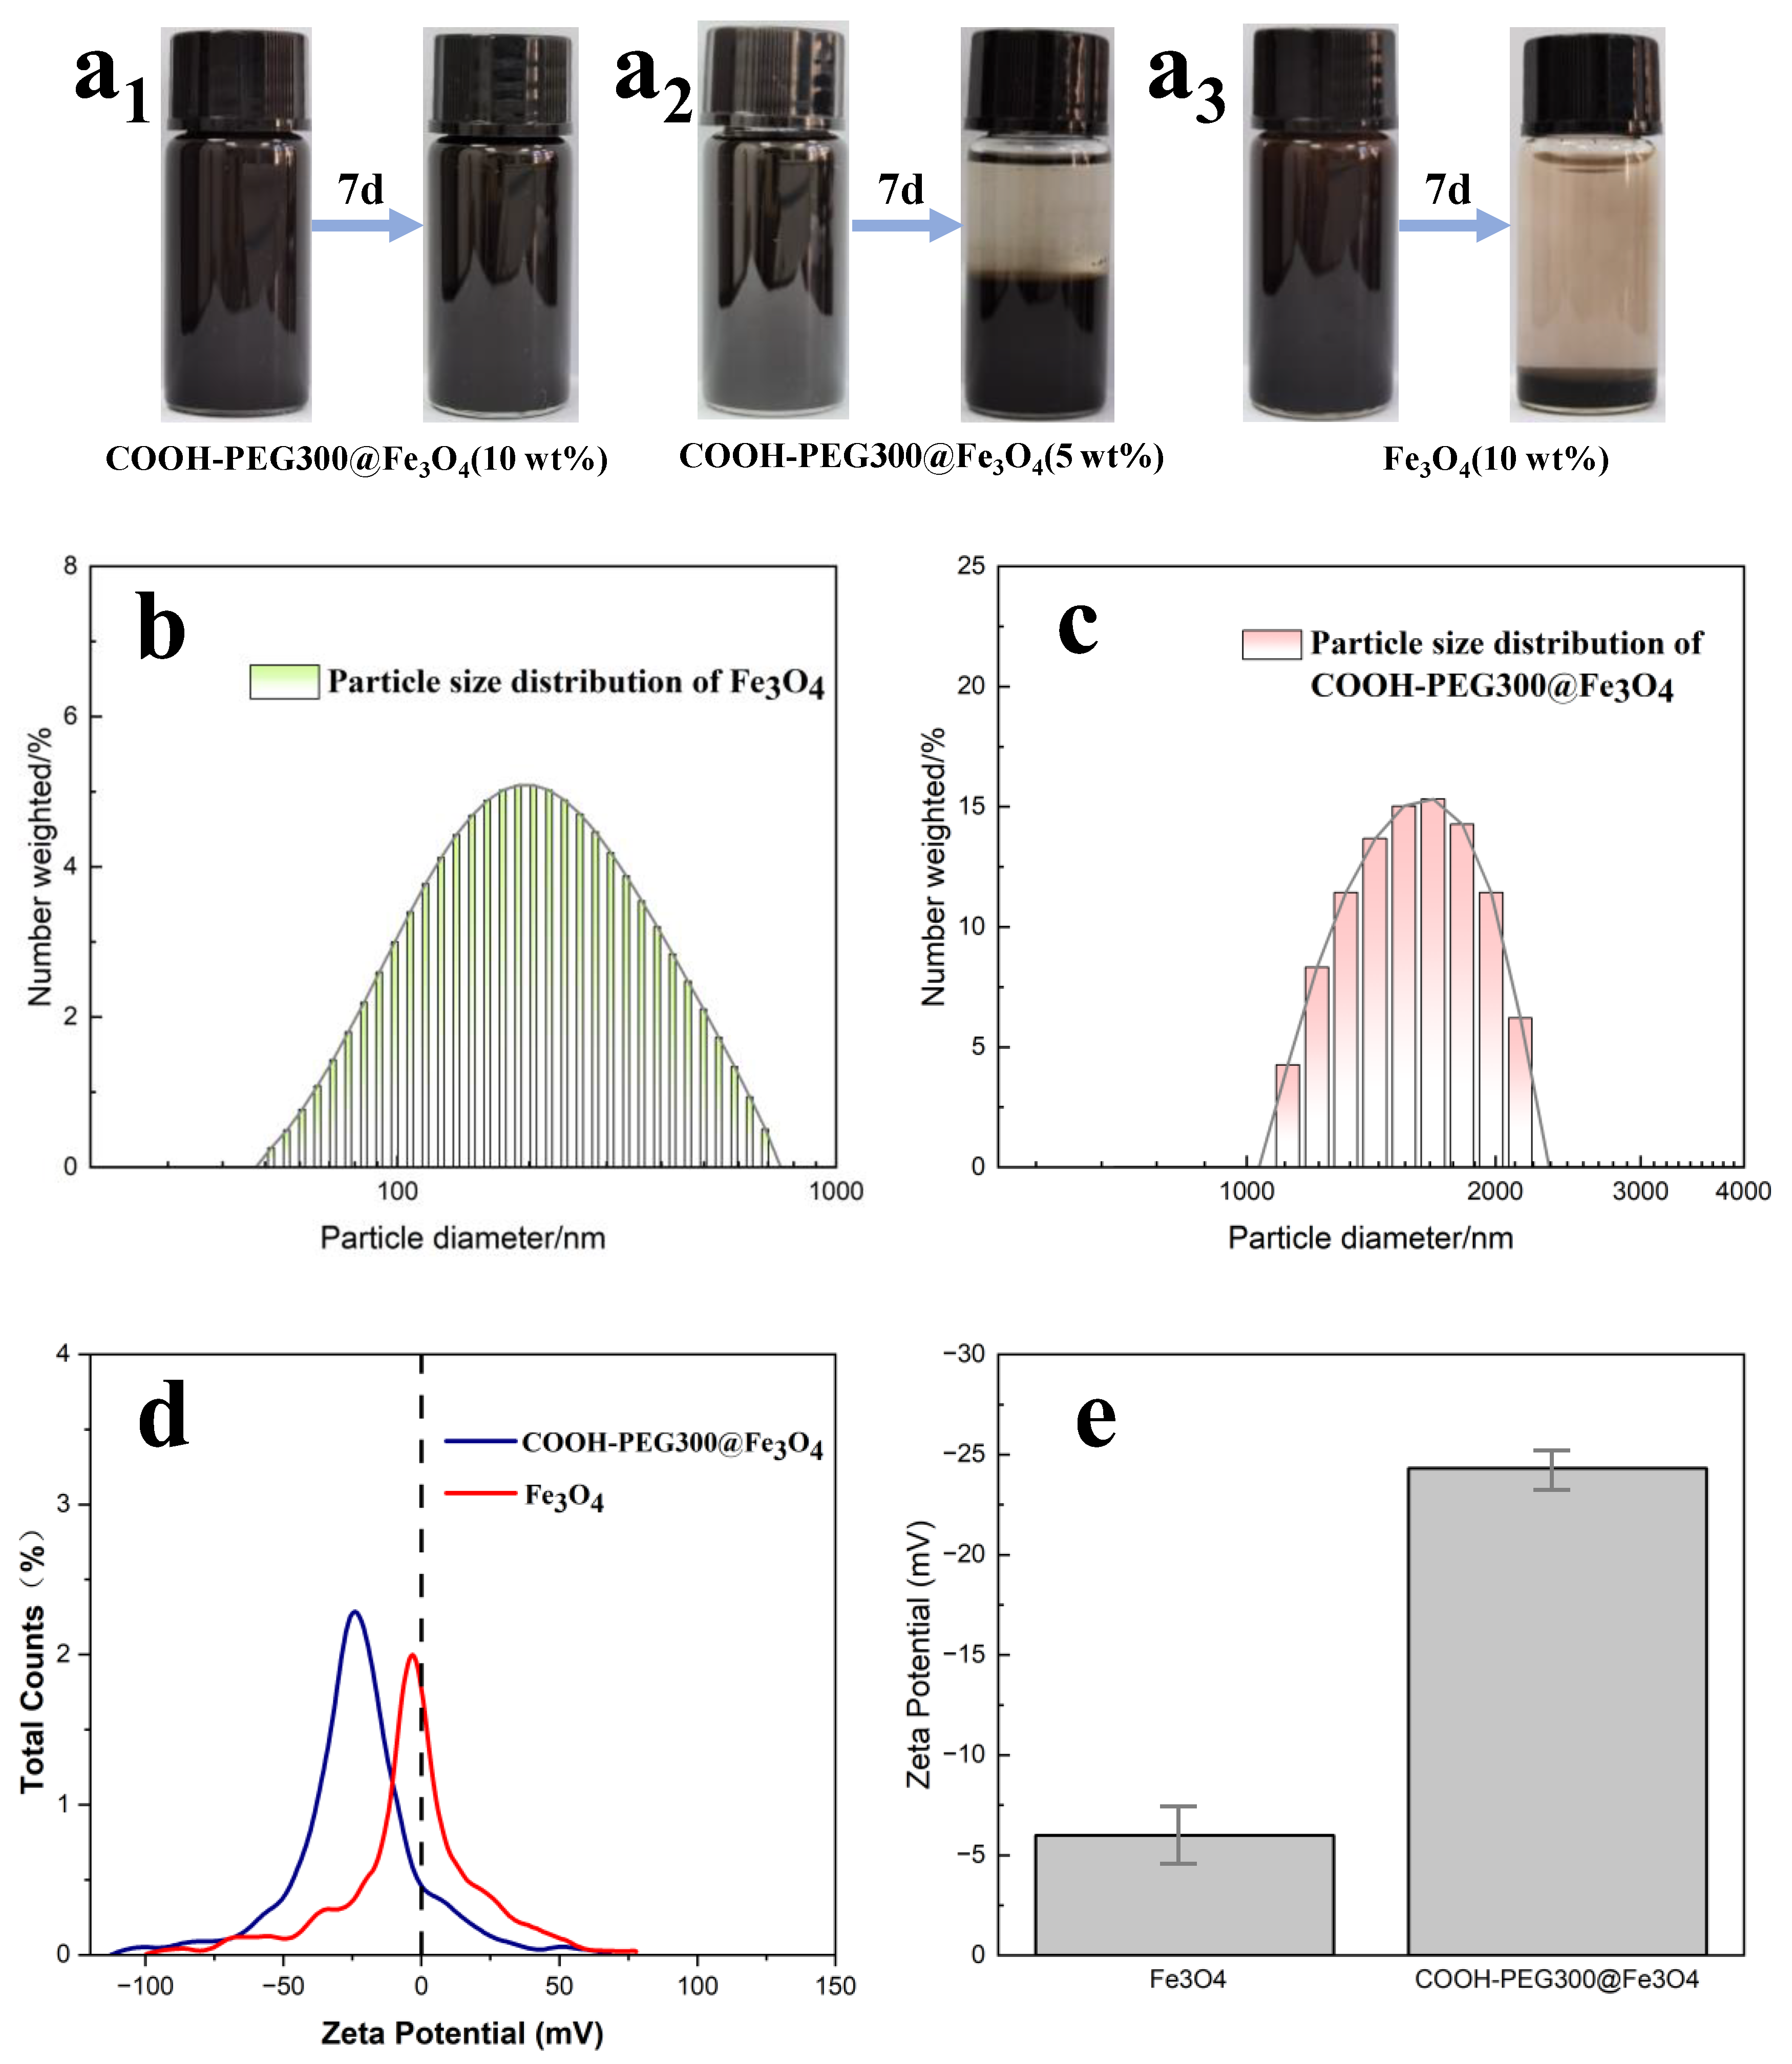
The water phase stability of magnetic marking fluids is very important, which is also the reason why we modified Fe3O4. We characterized the particle size and stability of COOH-PEG300@Fe3O4 magnetic marking fluid prepared by one-step synthesis and pure Fe3O4 magnetic marking fluid. As shown in Figure 7a1–a3, the images show the changes of COOH-PEG300@Fe3O4 (10%), COOH-PEG300@Fe3O4 (5 wt%), and Fe3O4 (10 wt%) magnetic marking fluids over seven days. COOH-PEG300@Fe3O4 is more stable than Fe3O4 magnetic fluid. Under aqueous conditions, the -O- and terminal -OH in PEG form a large number of hydrogen bonds with water, hindering the aggregation of Fe3O4 (NPs) [40] (Figure 2). The particle size distribution shown in Figure 7b,c indicates that the average particle size of COOH-PEG300@Fe3O4 magnetic fluid (1.75 μm) is larger than that of Fe3O4 magnetic fluid (0.32 μm), but their stabilities are opposite, mainly depending on their zeta potentials. Figure 7d,e show the zeta potential distributions of the two materials. Zeta potential represents the amount of surface charge they carry, with the average zeta potential of COOH-PEG300@Fe3O4 being −24.32 mV (Figure 7e), while that of Fe3O4 is −5.99 mV (Figure 7e). Zeta potential characterizes the charge carried on the particle surface and is related to charge density. The larger the negative value, the more negative charge on the particle surface, and a positive value indicates the presence of a positive charge. The higher the absolute value of the potential, the higher the surface charge density of the particles, which means stronger repulsive forces between the particles and better stability in the system [41]. COOH-PEG300@Fe3O4 and Fe3O4 magnetic fluids exhibit different surface charge densities, resulting in different stabilities. Interestingly, the stability of the COOH-PEG300@Fe3O4 (5 wt%) magnetic fluid is lower than that of the COOH-PEG300@Fe3O4 (10 wt%) magnetic fluid (Figure 7a1,a2), contrary to the intuition that “higher content leads to worse stability”. This may be because, under the combined action of hydrogen bonding and surface charge, the PEG molecular chains stretch out in water. As the number of particles in the magnetic fluid increases, more hydrogen bonds are formed between the PEG chains and water, leading to a more stable system [42]. We used the COOH-PEG300@Fe3O4 (10 wt%) magnetic marking fluid prepared by one-step synthesis as the final marking material.
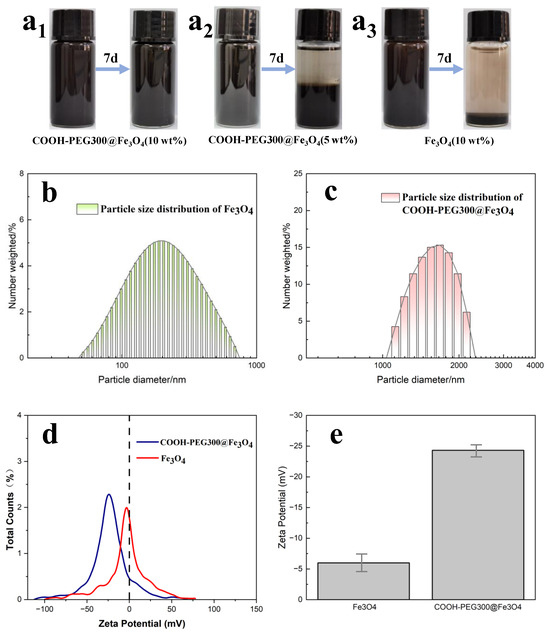
Figure 7.
(a1–a3) The change graph of COOH-PEG300@Fe3O4 (10 wt%), COOH-PEG300@Fe3O4 (5 wt%), and Fe3O4 (10 wt%) magnetic labeling liquid before and after 7 days; (b) particle size distribution graph of Fe3O4 by DLS; (c) particle size distribution graph of COOH-PEG300@Fe3O4 by DLS; (d) zeta potential distribution graph of COOH-PEG300@Fe3O4 and Fe3O4; (e) the average zeta potential of COOH-PEG300@Fe3O4 and Fe3O4.
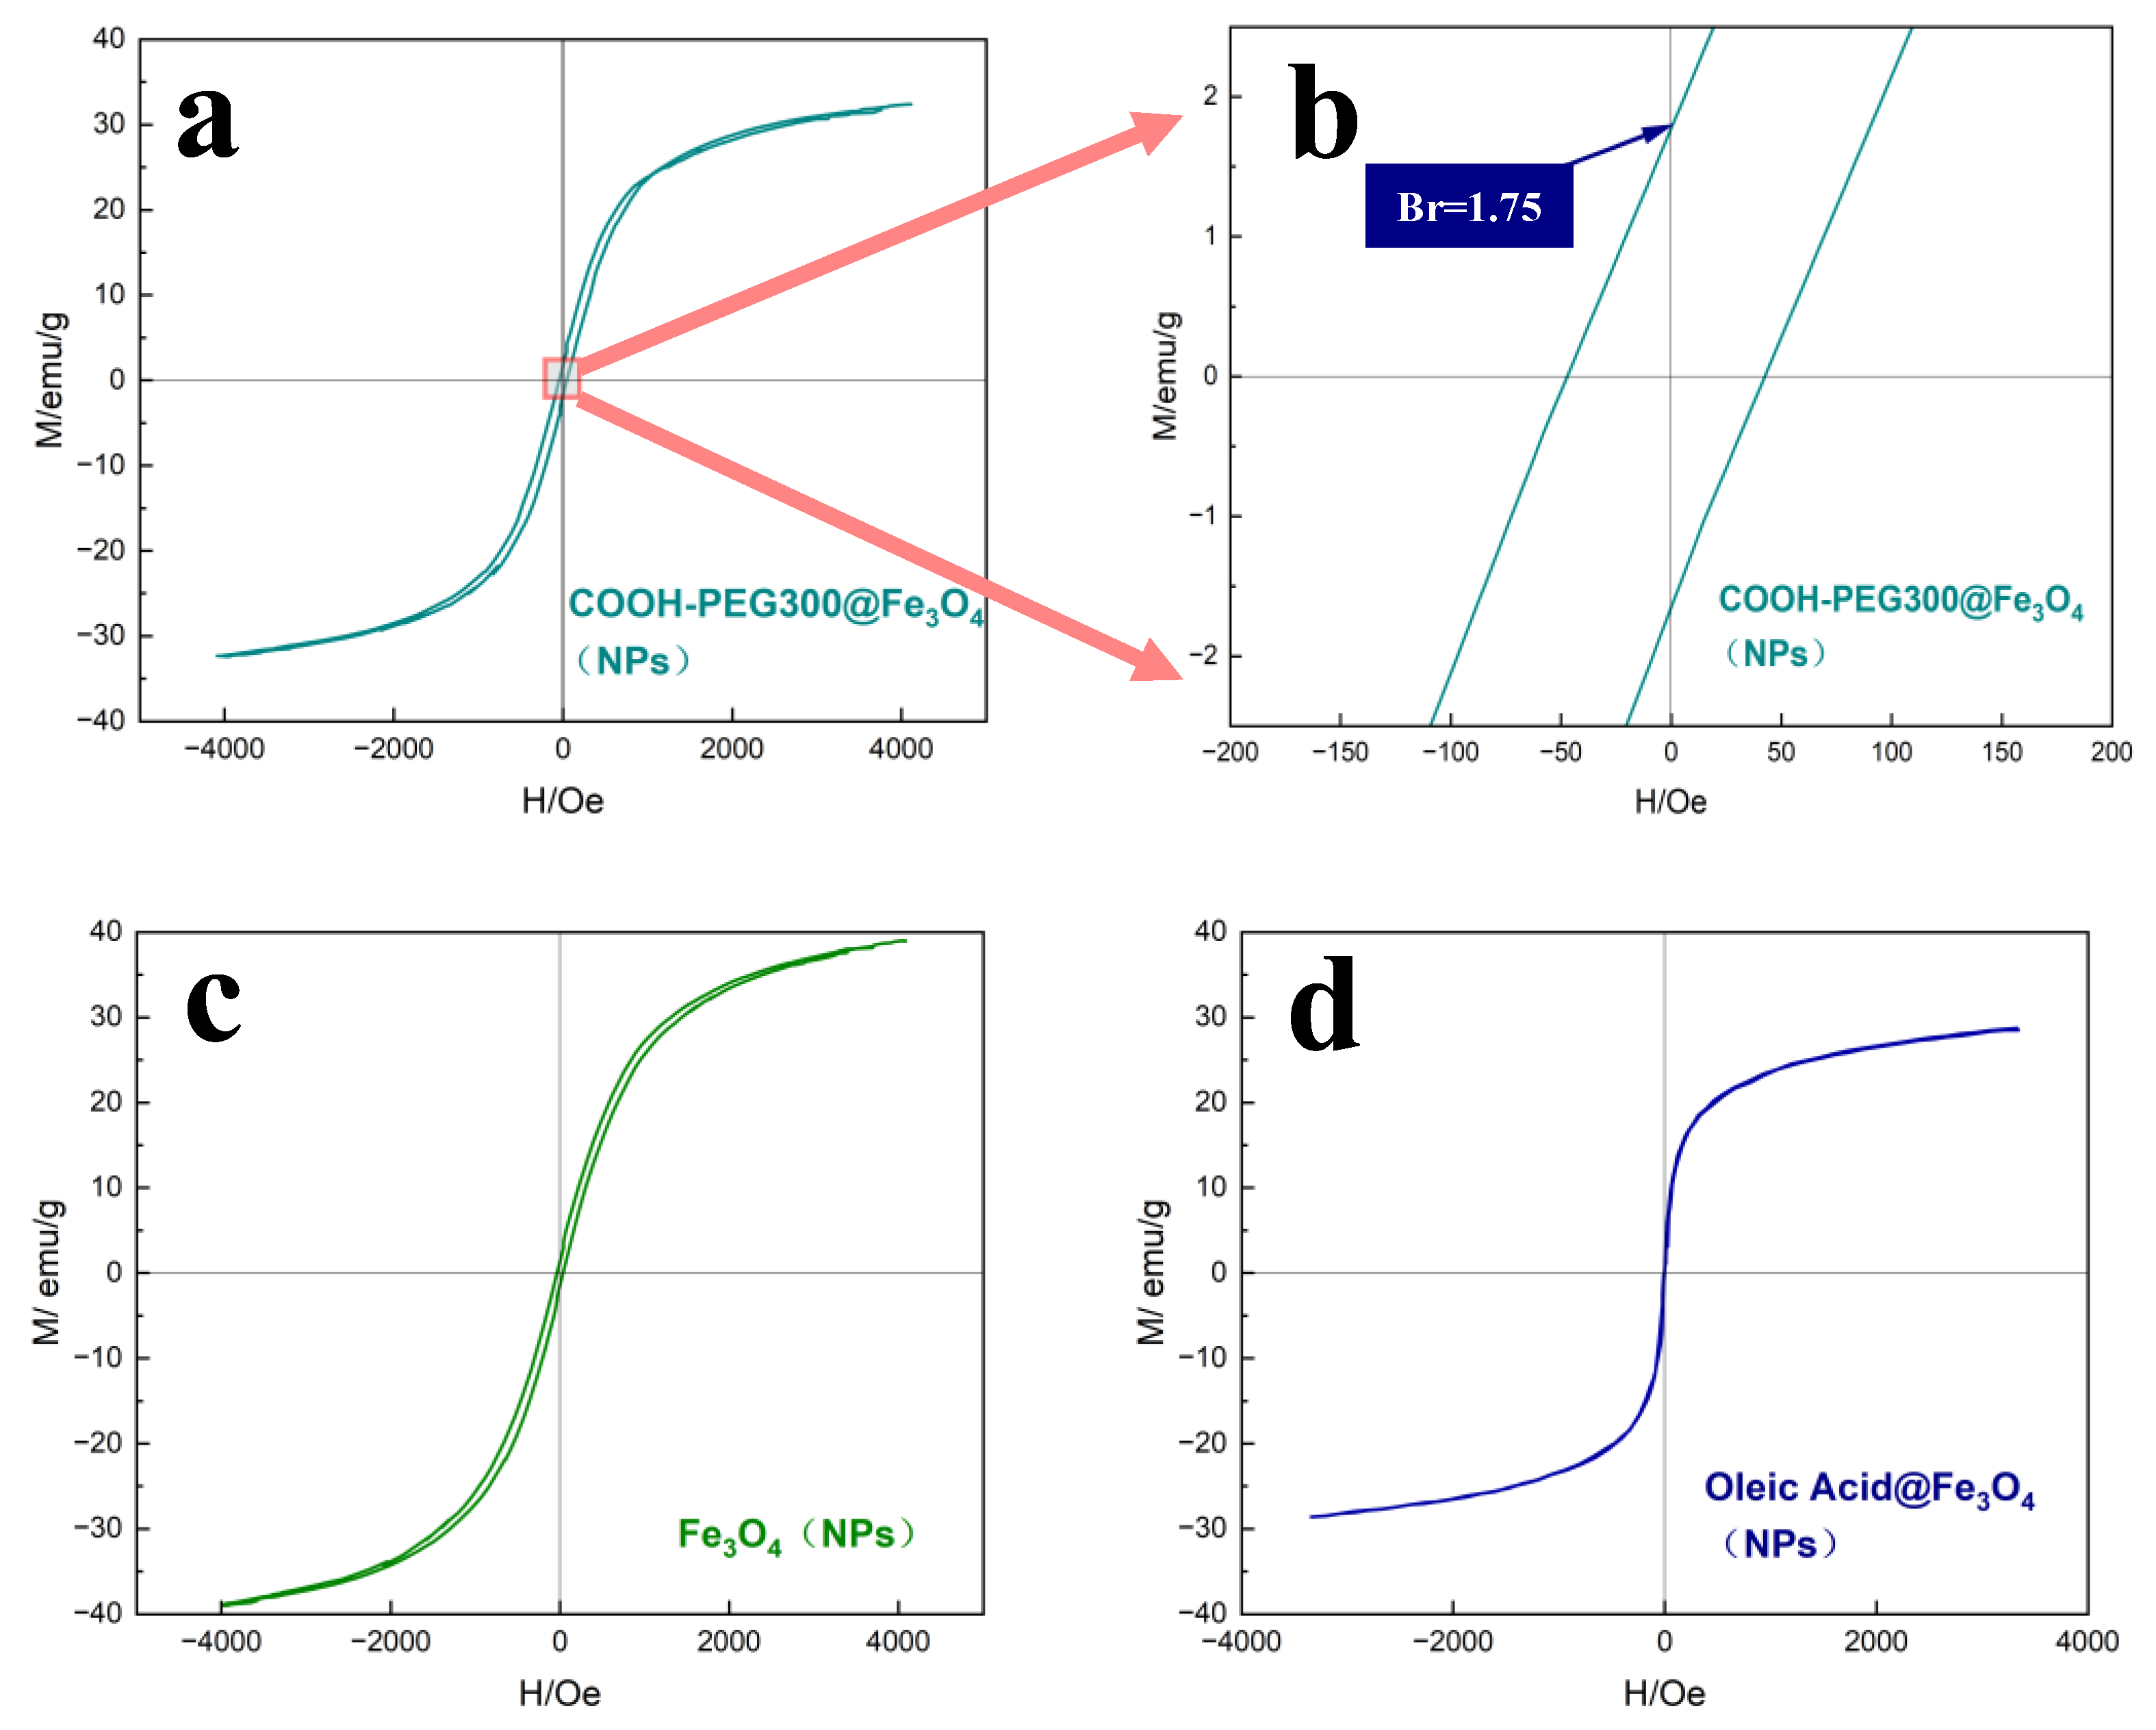
Figure 8 shows the VSM analysis curves of the magnetic hysteresis at room temperature for the studied COOH-PEG300@Fe3O4 (NPs) (Figure 8a), Fe3O4 (NPs) (Figure 8c), and oleic acid@Fe3O4 (NPs) (Figure 8d). Figure 8b shows that the synthesized COOH-PEG300@Fe3O4 (NPs) have a strength Br of 1.75 ± 0.3 emu/g, which is higher than that of Fe3O4 (NPs) (Br = 1.23 ± 0.2 emu/g), making it advantageous for our quick detection of the residual magnetism. The COOH-PEG300@Fe3O4 (NPs) possess a saturation magnetization strength (Ms) of 31 ± 0.8 emu/g, slightly lower than Fe3O4 (NPs) (Ms = 37 ± 0.8 emu/g), and the decrease in saturation magnetization strength of COOH-PEG300@Fe3O4 (NPs) is due to the PEG layer on the magnetic core [43]. Oleic acid@Fe3O4 (NPs), having zero coercivity at room temperature and exhibiting superparamagnetism, is not suitable for use as residual magnetic marking material, possibly related to its crystallinity, as depicted by the peak morphologies showing that oleic acid@Fe3O4 NPs exhibit the poorest crystallinity. The differences in magnetic properties due to various surface-active groups on the particle surface have a significant effect on their stability in the aqueous phase [44].
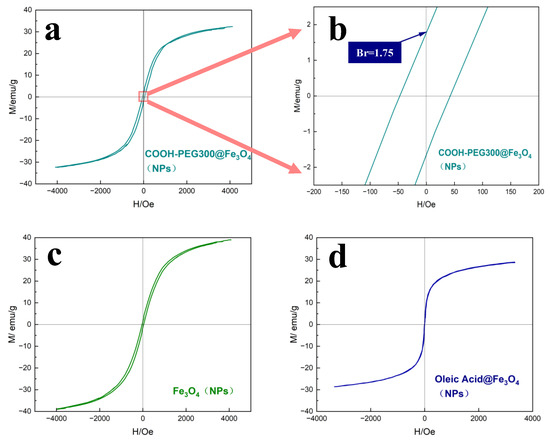
Figure 8.
(a) Magnetic hysteresis curve of COOH-PEG300@Fe3O4 (NPs) measured by VSM, (b) enlarged local image of curve (a,c) magnetic hysteresis curve of Fe3O4 (NPs) measured by VSM, (d) magnetic hysteresis curve of oleic acid@Fe3O4 (NPs) measured by VSM.
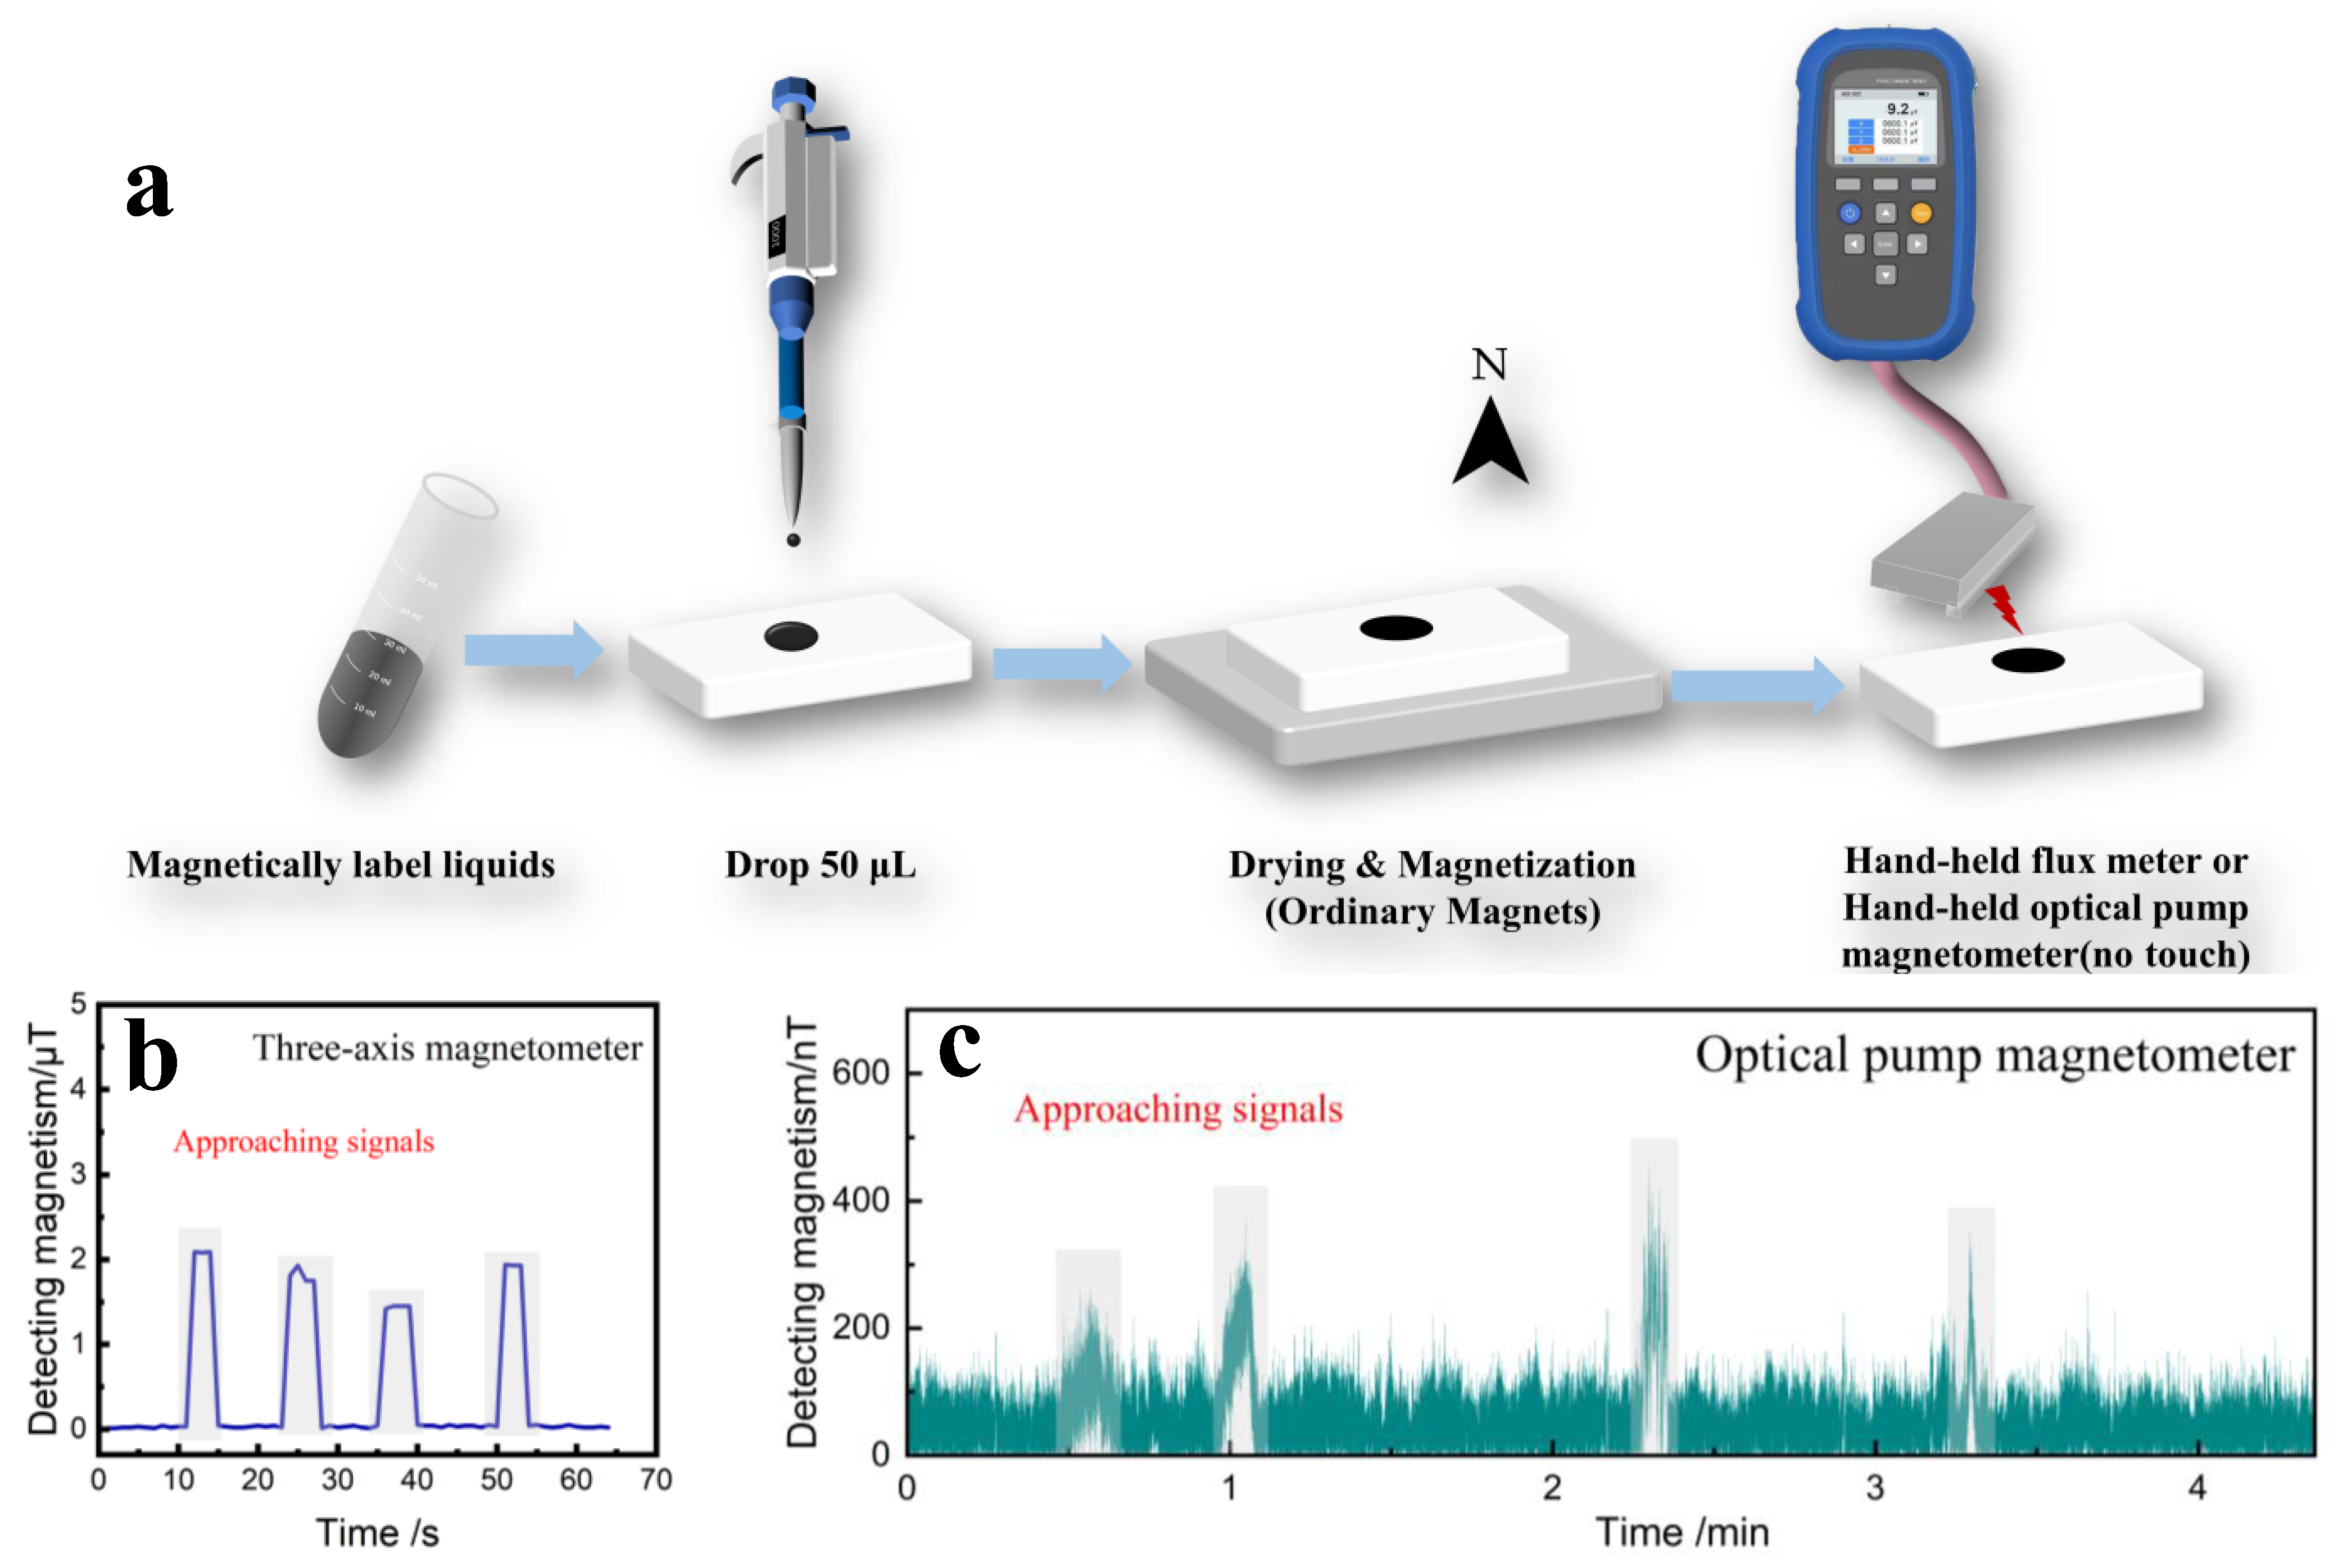
Finally, we simulate COOH-PEG300@Fe3O4 (10 wt%) liquid as a magnetic labeling material by adding 50 μL of liquid on filter paper to form a spot with a diameter of 1 cm. In the field, only 5 mg of the marker can detect a significant magnetic signal. After the spot dried, it was magnetized for 30 s using a commercial neodymium iron boron magnet, and then the black marker was placed on the probe of a handheld fluxmeter for scanning (with intervals of 10 s, placed for 5 s) or the residual magnetism was measured using a handheld optically pumped magnetometer (with intervals of 1 min, placed for 5 s), as shown in Figure 9a. Figure 9b displays the detection graph of the handheld fluxmeter, where a clear signal was detected with a maximum value of 2.09 μT. The varying proximity to the probe caused different detection magnitudes. Figure 9c shows the detection graph of the handheld optically pumped magnetometer, where the signal response of the magnetic labeling material can be clearly seen, with the varying proximity to the probe again causing different detection magnitudes. This verifies the feasibility of using COOH-PEG300@Fe3O4 (10 wt%) liquid as a magnetic labeling material, boasting the advantages of rapid detection and response and offering new insights for labeling material development.
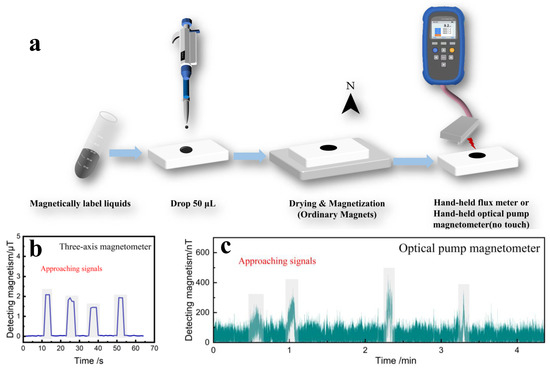
Figure 9.
(a) Simulated marking and detection diagram for COOH-PEG300@Fe3O4 (10 wt%), (b) magnetic signal measured by handheld flux meter, (c) magnetic signal measured by handheld optical pump magnetometer.
4. Conclusions
In this study, we successfully synthesized COOH-PEG@Fe3O4 nanoparticles (NPs) with high Br and improved water environmental stability using a simple method. Detailed characterization of the magnetic tagging materials was conducted using IR, 1HNMR, EDX, XRD, SEM, TEM, VSM, and DLS. Combined with a simple magnetization process using a portable detector, a residual magnetic signal could be rapidly detected with only 5 mg of the magnetic tag, confirming the feasibility of COOH-PEG@Fe3O4 nanoparticles (NPs) as rapid detection magnetic tag materials. This study not only broadens the application range of magnetic nanoparticles in the field of tagging materials but also proposes an efficient and convenient method for the rapid detection of magnetic tags. Looking forward, such magnetic tags are expected to be applied in permanent marking and portable detection in complex field environments.
In the future, we will enhance the functionalization of magnetic tagging materials by exploring the integration of additional functional groups or molecules to impart additional properties such as specific targeting, biodegradability, or fluorescence. This will further enhance their applicability in complex environments. While this study has demonstrated two simple magnetization processes using portable detectors, further research can focus on the development of more compact and user-friendly portable detection devices. This will make magnetic tags more accessible and suitable for use in remote or resource-limited environments.
Author Contributions
Conceptualization, X.S. and W.M.; Data curation, P.S.; Funding acquisition, H.W.; Investigation, P.S.; Methodology, X.S. and W.M.; Project administration, W.M., P.S. and H.W.; Supervision, P.S. and H.W.; Visualization, X.S. and W.M.; Writing—original draft, X.S.; Writing—review and editing, H.W. All authors have read and agreed to the published version of the manuscript.
Funding
This research received no external funding.
Institutional Review Board Statement
Not applicable.
Informed Consent Statement
Not applicable.
Data Availability Statement
The original contributions presented in the study are included in the article material, further inquiries can be directed to the corresponding author.
Conflicts of Interest
The authors declare no conflicts of interest.
References
- Jeon, J. Review of Therapeutic Applications of Radiolabeled Functional Nanomaterials. Int. J. Mol. Sci. 2019, 20, 2323. [Google Scholar] [CrossRef] [PubMed]
- Ren, X.; Evangelista-Leite, D.; Wu, T.; Rajab, T.K.; Moser, P.T.; Kitano, K.; Economopoulos, K.P.; Gorman, D.E.; Bloom, J.P.; Tan, J.J.; et al. Metabolic Glycan Labeling and Chemoselective Functionalization of Native Biomaterials. Biomaterials 2018, 182, 127–134. [Google Scholar] [CrossRef] [PubMed]
- Annenkov, V.V.; Danilovtseva, E.N.; Pal’shin, V.A.; Verkhozina, O.N.; Shishlyannikova, T.A.; Hickman, G.J.; Perry, C.C. Fluorescently-Tagged Polyamines for the Staining of Siliceous Materials. Plant Physiol. Biochem. 2018, 125, 205–211. [Google Scholar] [CrossRef] [PubMed]
- Woidasky, J.; Sander, I.; Schau, A.; Moesslein, J.; Wendler, P.; Wacker, D.; Gao, G.; Kirchenbauer, D.; Kumar, V.; Busko, D.; et al. Inorganic Fluorescent Marker Materials for Identification of Post-Consumer Plastic Packaging. Resour. Conserv. Recycl. 2020, 161, 104976. [Google Scholar] [CrossRef]
- Szielasko, K.; Youssef, A.; Sporn, D.; Mandel, K. Fingerprint Signatures Based on Nanomagnets as Markers in Materials for Tracing and Counterfeit Protection. J. Nanopart. Res. 2016, 18, 131. [Google Scholar] [CrossRef]
- Zhai, Y.; Shen, F.; Zhang, X.; Jing, P.; Li, D.; Yang, X.; Zhou, D.; Xu, X.; Qu, S. Synthesis of Green Emissive Carbon Dots@montmorillonite Composites and Their Application for Fabrication of Light-Emitting Diodes and Latent Fingerprints Markers. J. Colloid Interface Sci. 2019, 554, 344–352. [Google Scholar] [CrossRef] [PubMed]
- Xu, L.; Chen, Z.; Li, X.; Xiao, F. Performance, Environmental Impact and Cost Analysis of Marking Materials in Pavement Engineering, the-State-of-Art. J. Clean. Prod. 2021, 294, 126302. [Google Scholar] [CrossRef]
- Grimm, J.B.; Lavis, L.D. Caveat Fluorophore: An Insiders’ Guide to Small-Molecule Fluorescent Labels. Nat. Methods 2022, 19, 149–158. [Google Scholar] [CrossRef] [PubMed]
- Lukin, S.; Germann, L.S.; Friščić, T.; Halasz, I. Toward Mechanistic Understanding of Mechanochemical Reactions Using Real-Time In Situ Monitoring. Acc. Chem. Res. 2022, 55, 1262–1277. [Google Scholar] [CrossRef]
- Yerpude, A.N.; Parshuramkar, D.M.; Pawade, V.B.; Kokode, N.S.; Dhoble, S.J. Luminescence Properties of MgCaAl10O17:RE3+ (RE3+ = Sm3+, Dy3+) Phosphor for Eco-Friendly Solid-State Lighting Applications. Luminescence 2022, 37, 1710–1713. [Google Scholar] [CrossRef]
- Müssig, S.; Fidler, F.; Haddad, D.; Hiller, K.-H.; Wintzheimer, S.; Mandel, K. Supraparticles with a Magnetic Fingerprint Readable by Magnetic Particle Spectroscopy: An Alternative beyond Optical Tracers. Adv. Mater. Technol. 2019, 4, 1900300. [Google Scholar] [CrossRef]
- Liu, J.; Zhao, B.; Zhang, X.; Guan, D.; Sun, K.; Zhang, Y.; Liu, Q. Thiolation for Enhancing Photostability of Fluorophores at the Single-Molecule Level. Angew. Chem. Int. Ed. 2024, 63, e202316192. [Google Scholar] [CrossRef] [PubMed]
- Bakhteeva, I.A.; Medvedeva, I.V.; Filinkova, M.S.; Byzov, I.V.; Zhakov, S.V.; Uimin, M.A.; Yermakov, A.E. Magnetic sedimentation of nonmagnetic TiO2 nanoparticles in water by heteroaggregation with Fe-based nanoparticles. Sep. Purif. Technol. 2019, 218, 156–163. [Google Scholar] [CrossRef]
- Low, L.E.; Tey, B.T.; Ong, B.H.; Chan, E.S.; Tang, S.Y. Dispersion Stability, Magnetivity and Wettability of Cellulose Nanocrystal (CNC)-Dispersed Superparamagnetic Fe3O4 Nanoparticles: Impact of CNC Concentration. RSC Adv. 2016, 6, 113132–113138. [Google Scholar] [CrossRef]
- Merchant, R.R.; Maldonado-Camargo, L.; Rinaldi, C. In Situ Measurements of Dispersed and Continuous Phase Viscosities of Emulsions Using Nanoparticles. J. Colloid Interface Sci. 2017, 486, 241–248. [Google Scholar] [CrossRef]
- Gu, L.; Li, X.; Jiang, J.; Guo, G.; Wu, H.; Wu, M.; Zhu, H. Stem Cell Tracking Using Effective Self-Assembled Peptide-Modified Superparamagnetic Nanoparticles. Nanoscale 2018, 10, 15967–15979. [Google Scholar] [CrossRef]
- Komaee, A. Feedback Control for Transportation of Magnetic Fluids with Minimal Dispersion: A First Step Toward Targeted Magnetic Drug Delivery. IEEE Trans. Control Syst. Technol. 2017, 25, 129–144. [Google Scholar] [CrossRef]
- Kolitsi, L.I.; Orova, M.; Yiantsios, S.G. A Model of Magnetic Nanoparticle Transport and Their Effects in Tumor Areas: Assessment of Desirable Magnetic Properties. J. Magn. Magn. Mater. 2022, 561, 169732. [Google Scholar] [CrossRef]
- Dey, C.; Das, A.; Goswami, M.M. Dopamine Loaded SiO2 Coated Fe3O4 Magnetic Nanoparticles: A New Anticancer Agent in pH-Dependent Drug Delivery. ChemistrySelect 2019, 4, 12190–12196. [Google Scholar] [CrossRef]
- Zawadzki, J.; Bogacki, J. Smart Magnetic Markers Use in Hydraulic Fracturing. Chemosphere 2016, 162, 23–30. [Google Scholar] [CrossRef]
- Hung, A.H.; Lilley, L.M.; Hu, F.; Harrison, V.S.R.; Meade, T.J. Magnetic Barcode Imaging for Contrast Agents. Magn. Reson. Med. 2017, 77, 970–978. [Google Scholar] [CrossRef]
- Wintzheimer, S.; Granath, T.; Oppmann, M.; Kister, T.; Thai, T.; Kraus, T.; Vogel, N.; Mandel, K. Supraparticles: Functionality from Uniform Structural Motifs. ACS Nano 2018, 12, 5093–5120. [Google Scholar] [CrossRef] [PubMed]
- Yamamoto, S.; Matsuda, I. Measurement of the Resonant Magneto-Optical Kerr Effect Using a Free Electron Laser. Appl. Sci. 2017, 7, 662. [Google Scholar] [CrossRef]
- Winkler, R.; Ciria, M.; Ahmad, M.; Plank, H.; Marcuello, C. A Review of the Current State of Magnetic Force Microscopy to Unravel the Magnetic Properties of Nanomaterials Applied in Biological Systems and Future Directions for Quantum Technologies. Nanomaterials 2023, 13, 2585. [Google Scholar] [CrossRef] [PubMed]
- Kutluay, S.; Şahin, Ö.; Ece, M.Ş. Fabrication and Characterization of Fe3O4/Perlite, Fe3O4/perlite@SiO2, and Fe3O4/perlite@SiO2@sulfanilamide Magnetic Nanomaterials. Appl. Phys. A 2022, 128, 222. [Google Scholar] [CrossRef]
- Rashidi Dafeh, S.; Iranmanesh, P.; Salarizadeh, P. Fabrication, Optimization, and Characterization of Ultra-Small Superparamagnetic Fe3O4 and Biocompatible Fe3O4@ZnS Core/Shell Magnetic Nanoparticles: Ready for Biomedicine Applications. Mater. Sci. Eng. C 2019, 98, 205–212. [Google Scholar] [CrossRef] [PubMed]
- Wang, L.; Kim, C.; Zhang, Z.; Hu, Q.; Sun, T.; Hu, X. Adsorption Behavior of Lysozyme on Carbon-Coated Fe3O4 Nanoparticles. Curr. Nanosci. 2017, 13, 159–166. [Google Scholar] [CrossRef]
- Xu, B.; Senthilkumar, S.; Zhong, W.; Shen, Z.; Lu, C.; Liu, X. Magnetic Core–Shell Fe3O4@Cu2O and Fe3O4@Cu2O–Cu Materials as Catalysts for Aerobic Oxidation of Benzylic Alcohols Assisted by TEMPO and N-Methylimidazole. RSC Adv. 2020, 10, 26142–26150. [Google Scholar] [CrossRef] [PubMed]
- Zhu, Y.; Yue, M.; Natarajan, V.; Kong, L.; Ma, L.; Zhang, Y.; Zhao, Q.; Zhan, J. Efficient Activation of Persulfate by Fe3O4@β-Cyclodextrin Nanocomposite for Removal of Bisphenol A. RSC Adv. 2018, 8, 14879–14887. [Google Scholar] [CrossRef]
- Sadr, M.S.; Heydarinasab, A.; Panahi, H.A.; Javan, R.S. Production and Characterization of Biocompatible Nano-Carrier Based on Fe3O4 for Magnetically Hydroxychloroquine Drug Delivery. Polym. Adv. Technol. 2021, 32, 564–573. [Google Scholar] [CrossRef]
- Shariati, B.; Goodarzi, M.T.; Jalali, A.; Salehi, N.; Mozaffari, M. Gold Nanorods Incorporated into a MoS2/Fe3O4 Nanocomposite for Photothermal Therapy and Drug Delivery. New J. Chem. 2023, 47, 20100–20108. [Google Scholar] [CrossRef]
- Yang, Z.; Wang, L.; Liu, Y.; Liu, S.; Tang, D.; Meng, L.; Cui, B. ZnO Capped Flower-like Porous Carbon-Fe3O4 Composite as Carrier for Bi-Triggered Drug Delivery. Mater. Sci. Eng. C 2020, 107, 110256. [Google Scholar] [CrossRef] [PubMed]
- Chen, C.; Yuan, H.; Wang, X.; Lin, Y.; He, Y.; Wang, F. Recyclable and High-Efficiency Methane Hydrate Formation Promoter Based on SDS-Coated Superparamagnetic Nano-Fe3O4. Chem. Eng. J. 2022, 437, 135365. [Google Scholar] [CrossRef]
- Krump, H.; Alexy, P.; Luyt, A.S. Preparation of a Maleated Fischer–Tropsch Paraffin Wax and FTIR Analysis of Grafted Maleic Anhydride. Polym. Test. 2005, 24, 129–135. [Google Scholar] [CrossRef]
- Batista de Jesus, A.C.; Santos Barbosa, C.C.; Barreto Peixoto, E.; de Jesus, J.R.; da Silva Filho, J.L.; Fabian, F.A.; Costa, I.M.; dos Santos Duque, J.G.; de Meneses, C.T. Influence of Ag on the Magnetic Anisotropy of Fe3O4 Nanocomposites. J. Supercond. Nov. Magn. 2019, 32, 2471–2477. [Google Scholar] [CrossRef]
- Zuo, Y.; Wu, Y.; Gu, J.; Zhang, Y. The UV Aging Properties of Maleic Anhydride Esterified Starch/Polylactic Acid Composites. J. Wuhan Univ. Technol.-Mat. Sci. Edit. 2017, 32, 971–977. [Google Scholar] [CrossRef]
- Hong, R.Y.; Zhang, S.Z.; Han, Y.P.; Li, H.Z.; Ding, J.; Zheng, Y. Preparation, Characterization and Application of Bilayer Surfactant-Stabilized Ferrofluids. Powder Technol. 2006, 170, 1–11. [Google Scholar] [CrossRef]
- Shin, J.R.; An, G.S.; Choi, S.-C. Influence of Carboxylic Modification Using Polyacrylic Acid on Characteristics of Fe3O4 Nanoparticles with Cluster Structure. Processes 2021, 9, 1795. [Google Scholar] [CrossRef]
- Anjum, S.; Tufail, R.; Rashid, K.; Zia, R.; Riaz, S. Effect of Cobalt Doping on Crystallinity, Stability, Magnetic and Optical Properties of Magnetic Iron Oxide Nano-Particles. J. Magn. Magn. Mater. 2017, 432, 198–207. [Google Scholar] [CrossRef]
- Hu, J.; Yamahara, H.; Liao, Z.; Yano, Y.; Tabata, H. Characterization of Hydrogen Bond Network of Waters around Polyethylene Glycol by Broadband Dielectric Spectroscopy. Appl. Phys. Lett. 2022, 120, 023702. [Google Scholar] [CrossRef]
- Pochapski, D.J.; Carvalho dos Santos, C.; Leite, G.W.; Pulcinelli, S.H.; Santilli, C.V. Zeta Potential and Colloidal Stability Predictions for Inorganic Nanoparticle Dispersions: Effects of Experimental Conditions and Electrokinetic Models on the Interpretation of Results. Langmuir 2021, 37, 13379–13389. [Google Scholar] [CrossRef] [PubMed]
- Tsuruta, T. On the Role of Water Molecules in the Interface between Biological Systems and Polymers. J. Biomater. Sci. Polym. Ed. 2010, 21, 1831–1848. [Google Scholar] [CrossRef] [PubMed]
- Bica, I.; Anitas, E.M.; Choi, H.J.; Sfirloaga, P. Microwave-Assisted Synthesis and Characterization of Iron Oxide Microfibers. J. Mater. Chem. C 2020, 8, 6159–6167. [Google Scholar] [CrossRef]
- Hu, Y.; Mignani, S.; Majoral, J.-P.; Shen, M.; Shi, X. Construction of Iron Oxide Nanoparticle-Based Hybrid Platforms for Tumor Imaging and Therapy. Chem. Soc. Rev. 2018, 47, 1874–1900. [Google Scholar] [CrossRef] [PubMed]
Disclaimer/Publisher’s Note: The statements, opinions and data contained in all publications are solely those of the individual author(s) and contributor(s) and not of MDPI and/or the editor(s). MDPI and/or the editor(s) disclaim responsibility for any injury to people or property resulting from any ideas, methods, instructions or products referred to in the content. |
© 2024 by the authors. Licensee MDPI, Basel, Switzerland. This article is an open access article distributed under the terms and conditions of the Creative Commons Attribution (CC BY) license (https://creativecommons.org/licenses/by/4.0/).


