Article

The Electric Properties of the Magnetopause Boundary Layer

1
School of Science, Harbin Institute of Technology, Shenzhen 518055, China
2
School of Mathematics and Statistics, Ning Xia University, Yinchuan 750021, China
3
RAL Space, Rutherford Appleton Laboratory, Science and Technology Facilities Council, UK Research and Innovation, Harwell Oxford, Didcot OX11 0GD, UK
*
Author to whom correspondence should be addressed.
Magnetochemistry 2024, 10(6), 37; https://doi.org/10.3390/magnetochemistry10060037
Submission received: 4 April 2024 / Revised: 15 May 2024 / Accepted: 15 May 2024 / Published: 21 May 2024
(This article belongs to the Special Issue New Insight into the Magnetosheath)

Abstract

:
The magnetopause plays a pivotal role in the coupling among solar wind, the magnetosheath, and the magnetosphere. By analyzing magnetopause crossing events using MMS, we reveal a local non-neutrality of electric charges in the magnetopause boundary layer and the associated electric field. There are two types of electric structures. In one group, which typically occurs on the dusk side, the electric field directs towards the Earth. In the other, which generally occurs on the day side, the field directs away from the Earth. The spatial extent of this electric non-neutrality spans approximately 600 km, which is at the scale of ion gyrational motion. These findings provide valuable insights into the fine structures of the magnetopause and the coupling between the magnetosheath and the magnetosphere.

1. Introduction

The magnetopause is the boundary separating the Earth’s magnetosphere from the magnetosheath. The mass, momentum, and energy carried by solar wind can pass through the magnetopause and transfer into the magnetosphere, which may result in disastrous space weather effects. Therefore, it is important to study the physical characteristics of the magnetopause [1,2]. Through years of research relying on satellite observation, the large-scale characteristics of the magnetopause’s structure has been gradually revealed [3,4,5,6,7]. However, the fine structures of the magnetopause are still not yet fully understood.
The classical closed magnetopause model, called the Chapman–Ferraro model [8], represents the magnetopause as a simple current sheet structure. The current sheet is generated by the collective motion of solar wind electrons and ions passing through the magnetosheath. As the electrons and ions have unequal radii of gyration, a charge separation forms around the current sheet, which generates a polarized electric field that prevents further charge separation. In the classical closed magnetopause model, the current sheet thickness is on the scale of the electron cyclotron radius. Additionally, the overall thickness of the charge layer also corresponds to the electron cyclotron scale. Notably, the negative charge layer is considerably thicker compared to the positive charge layer. Previous statistical results have shown that the ideal Chapman–Ferraro model is not strictly consistent with the magnetopause’s observed morphology [5,9,10], implying that the balance between solar wind momentum and Lorentz force associated with the magnetopause is complicated.
The polarized electric field can be weakened by discharge currents parallel with the magnetic field, resulting in a neutralized magnetopause boundary layer and establishing a balance between the magnetic and electric fields [11,12]. In the neutralized magnetopause model (in which the magnetopause is fully neutralized, which is unlikely), the boundary layer of the magnetopause has a thickness corresponding to the ion cyclotron scale. Furthermore, the positive charge layer is significantly thicker than the negative charge layer.
Electric fields (ranging from a few to hundreds of mV/m) are found at most magnetopause crossings, as observed by Cluster satellites [13], and occur over distances of a few hundred km in the moving magnetopause, a scale length comparable to the ion gyroradius [14]. Based on spatial gradients [15], the direct measurement of charge density using Gauss’s theorem [16,17,18,19] became possible, allowing the electric properties of the magnetopause to be more finely reconstructed. However, the large spacing of the four Cluster satellites and the lack of C4 electric field data prohibit the estimation of charge density. The MMS mission, consisting of four spacecraft and a smaller distance, was launched in 2015 [20] and included a high-precision electric field instrument (EDP) [21]. Therefore, the mission is capable of calculating the charge density at the center of the tetrahedron using Gauss’s theorem ρ = ε 0 E = ε 0 i = 1 3 i E i [16,17,18,19]. The charge density’s calculation error can be divided into three parts: geometric error, truncation error, and measurement error. The analysis results show that geometric error and truncation error are very small and can be ignored. Although measurement errors cannot be ignored, they are within an acceptable range and will not greatly affect the calculation results [17,18].
This study focuses on the fine-scale structures and microphysical processes in the magnetopause based on MMS observations, with the following objectives:
  • Verifying the existence of charge separation and a polarized electric field in the magnetopause current;
  • Determining the association between the electric field and charge;
  • Verifying the thickness of the charge layer.

2. Database

The database used in this study includes data from the MMS mission from September 2015 to February 2016, collected at burst mode time intervals. Magnetopause crossing events are selected in multiple steps, and the burst time interval for crossing the magnetopause in the database is determined by the following criteria:
  • Refer to the quick-look burst data of MMS1 to determine the approximate time of the magnetopause crossing (https://lasp.colorado.edu/mms/sdc/public/, accessed on 3 April 2024). The website allows users to plot key parameters such as plasma moment, electromagnetic field, and spacecraft position with high temporal resolution. Since the near-rigid magnetic field and low-dense plasma inside the magnetosphere can be distinguished from the turbulent magnetic field and dense plasma in the magnetosheath [5], magnetopause crossings can be visually identified by abrupt changes in the magnetic field or plasma parameters.
  • The average radial distance between the MMS and Earth should be less than 15 Earth radii (RE).
  • We use the parameter α = Eflux low Eflux high , which is defined as the ratio of the integrated differential electron flux in the low energy range (30–800 eV) and high energy range (1–25 keV), because of the different plasma temperatures in the magnetosphere and magnetosheath [22]. When α < 1 , the satellite is in the magnetosphere, and when α > 170 , the satellite is in the magnetosheath; thus, when 1 < α < 170 , the satellite is crossing the magnetopause [23].
  • The electric field should be significantly enhanced within α < 170 .

3. Observations

Using the procedure described above, 82 burst mode intervals were selected. Figure 1 shows one of the qualified intervals during which the MMS passed from the magnetosheath to the magnetosphere through the magnetopause between approximately 17:26:04 UT and 17:26:32 UT on 2 September 2015. In the GSM coordinate, the MMS was located near the magnetopause’s dusk side (X = 1.29, Y = 11.01, Z = −4.5) RE. All other physical quantities are also in the GSM coordinate system unless specified otherwise. The magnetosphere has a stable northward dipole field (Figure 1a), tenuous-hot plasma with an electron number density of less than 2 cm−3 (Figure 1b), ion temperatures greater than 2400 eV (Figure 1c), and electron temperatures greater than 100 eV (Figure 1d). In contrast, the magnetosheath proper exhibits stronger magnetic field fluctuations (Figure 1a) and has a higher electron number density of up to 40 cm−3 (Figure 1c). The ion and electron temperatures in the magnetosheath are lower than that in the magnetosphere, and are about 220 eV and 20 eV, respectively (Figure 1c,d). Electrons with energies above 1 keV are almost absent in the magnetosheath (Figure 1k). The mixing of particles from the magnetosphere and magnetosheath occurs around the center current sheet, as seen in Figure 1j,k, where low-energy and high-energy ions (electrons) coexist in this region. The red dashed line marks α = 170 . It should be noted that the electric field signals in Figure 1g show high-frequency fluctuations, which may reduce the precision of measurement. Shen et al. pointed out that incorporating sliding time averaging in calculations reduces the effect of small oscillation disturbances on the charge measurement [18].
The corrected electric field strength is E = E + v mp × B with the velocity of the magnetopause being v mp = 26.68 km / s , calculated using the timing methods [24], as shown in Figure 1g. The relative motion of the magnetopause and the satellite will influence the charge density calculation, ρ = ρ v mp j / c 2 , where ρ is the charge density in the magnetopause reference frame; ρ is the charge density in the satellite reference frame; j is the current density; and c is the speed of light in vacuum. The error of the charge density Δ ρ = ρ ρ is very small and can be ignored.
Upon entering the magnetosphere, the electric field strength increases significantly, and high-frequency perturbations occur. Two net charge layers with positive and negative charges, respectively, appear within the magnetosphere (Figure 1i). The positive charge layer (PCL) is on the outer side of the magnetosphere and is closer to the current sheet. The boundary of the PCL is indicated by the blue dashed line. The negative charge layer (NCL) is located further Earthward and on the inner side of the magnetosphere. The PCL is marked between the two blue dashed lines. The range of the charge layer corresponds to the range where the strong electric field fluctuates at high frequencies, and the transition point between the PCL and NCL corresponds to the electric field’s peak strength, which we consider to be the polarized electric field generated by the charge separation. The current density ( j = μ 0 1 × B ) is shown in Figure 1h, where a strong current appears in the current sheet around the red dashed line.
The LMN coordinates are L= [0.14, 0.19, 0.96], M= [−0.80, 0.58, 0.00] (dawnward), and N= [0.57, 0.78, −0.24]. The starting moment of the PCL (the first blue dashed line shown in Figure 1) is used as a baseline to show the variation in the electromagnetic field and charge density with the depth of the satellite into the magnetopause. The range of the polarized electric field is L = v mp × ( t end - t start ) = 434   km , where t start is the starting moment of the PCL and t end is the ending moment of the NCL. The results, presented in Figure 2, demonstrate that the depth of this polarized electric field aligns with the ion cyclotron scale. Moreover, the PCL and NCL exhibit nearly equal thicknesses. A clear signal of the normal electric field can be seen upon entering the magnetopause, and this normal electric field intensity increases and then decreases with depth. The electric field occurs within a certain range L = 434   km , and we fitted the electric field signal using a Fourier function, represented by the black line in Figure 2b. The corresponding charge density ρ fit = ε 0 d E fit / d L is depicted as the red dashed line in Figure 2d and is in agreement with the observed results. This consistency suggests that the charge calculation method is reliable and confirms that the normal electric field in the magnetopause is generated by the excess charge.
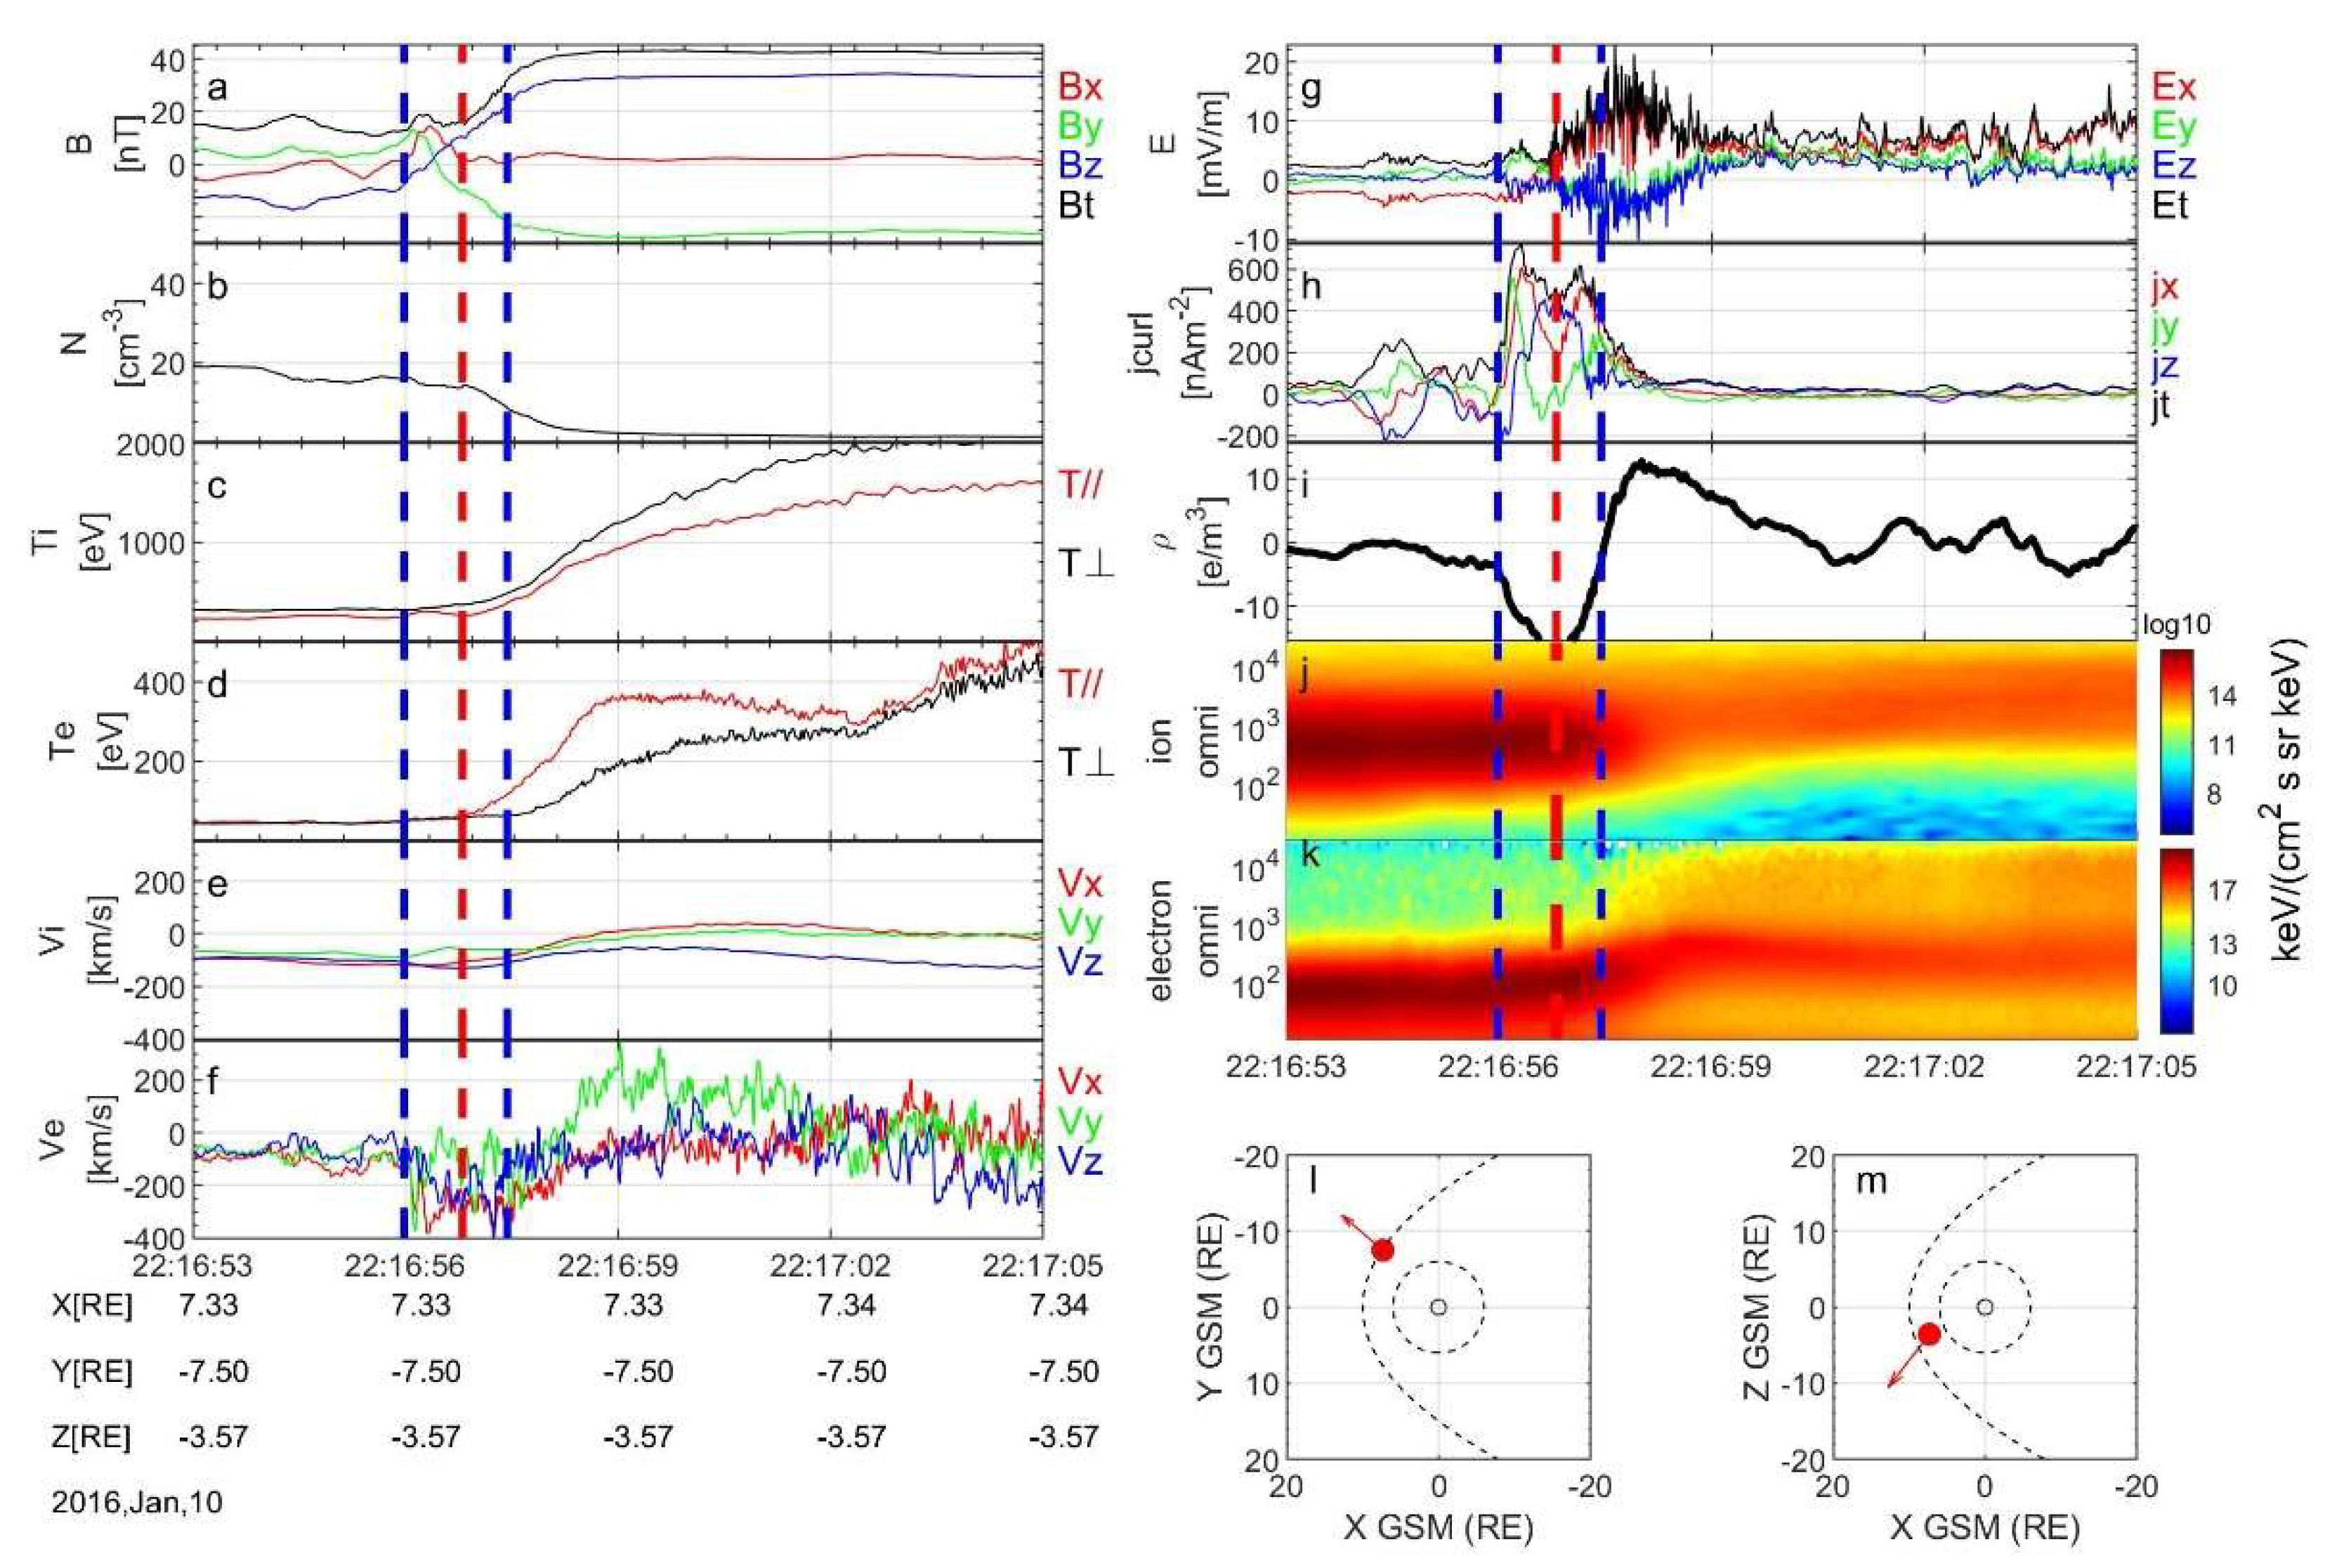
Another event is found in our database, as shown in Figure 3: the MMS enters the magnetopause from the magnetosheath between approximately 22:16:53 UT and 22:17:05 UT on 10 January 2016. During this interval, the MMS was located around (X = 7.33, Y = −7.5, Z = −3.57) RE. The magnetosphere has a stable northward dipole field and tenuous hot plasma ( N e < 2   cm 3 , T i > 1500   eV , T e > 250 eV ). In contrast, the magnetosheath proper exhibits stronger magnetic field fluctuations and has a higher electron number density of up to 20 cm−3. The ion and electron temperatures in the magnetosheath are lower than those in the magnetosphere ( T i < 300   eV , T e < 50   eV ). The red dashed line marks α = 170 .
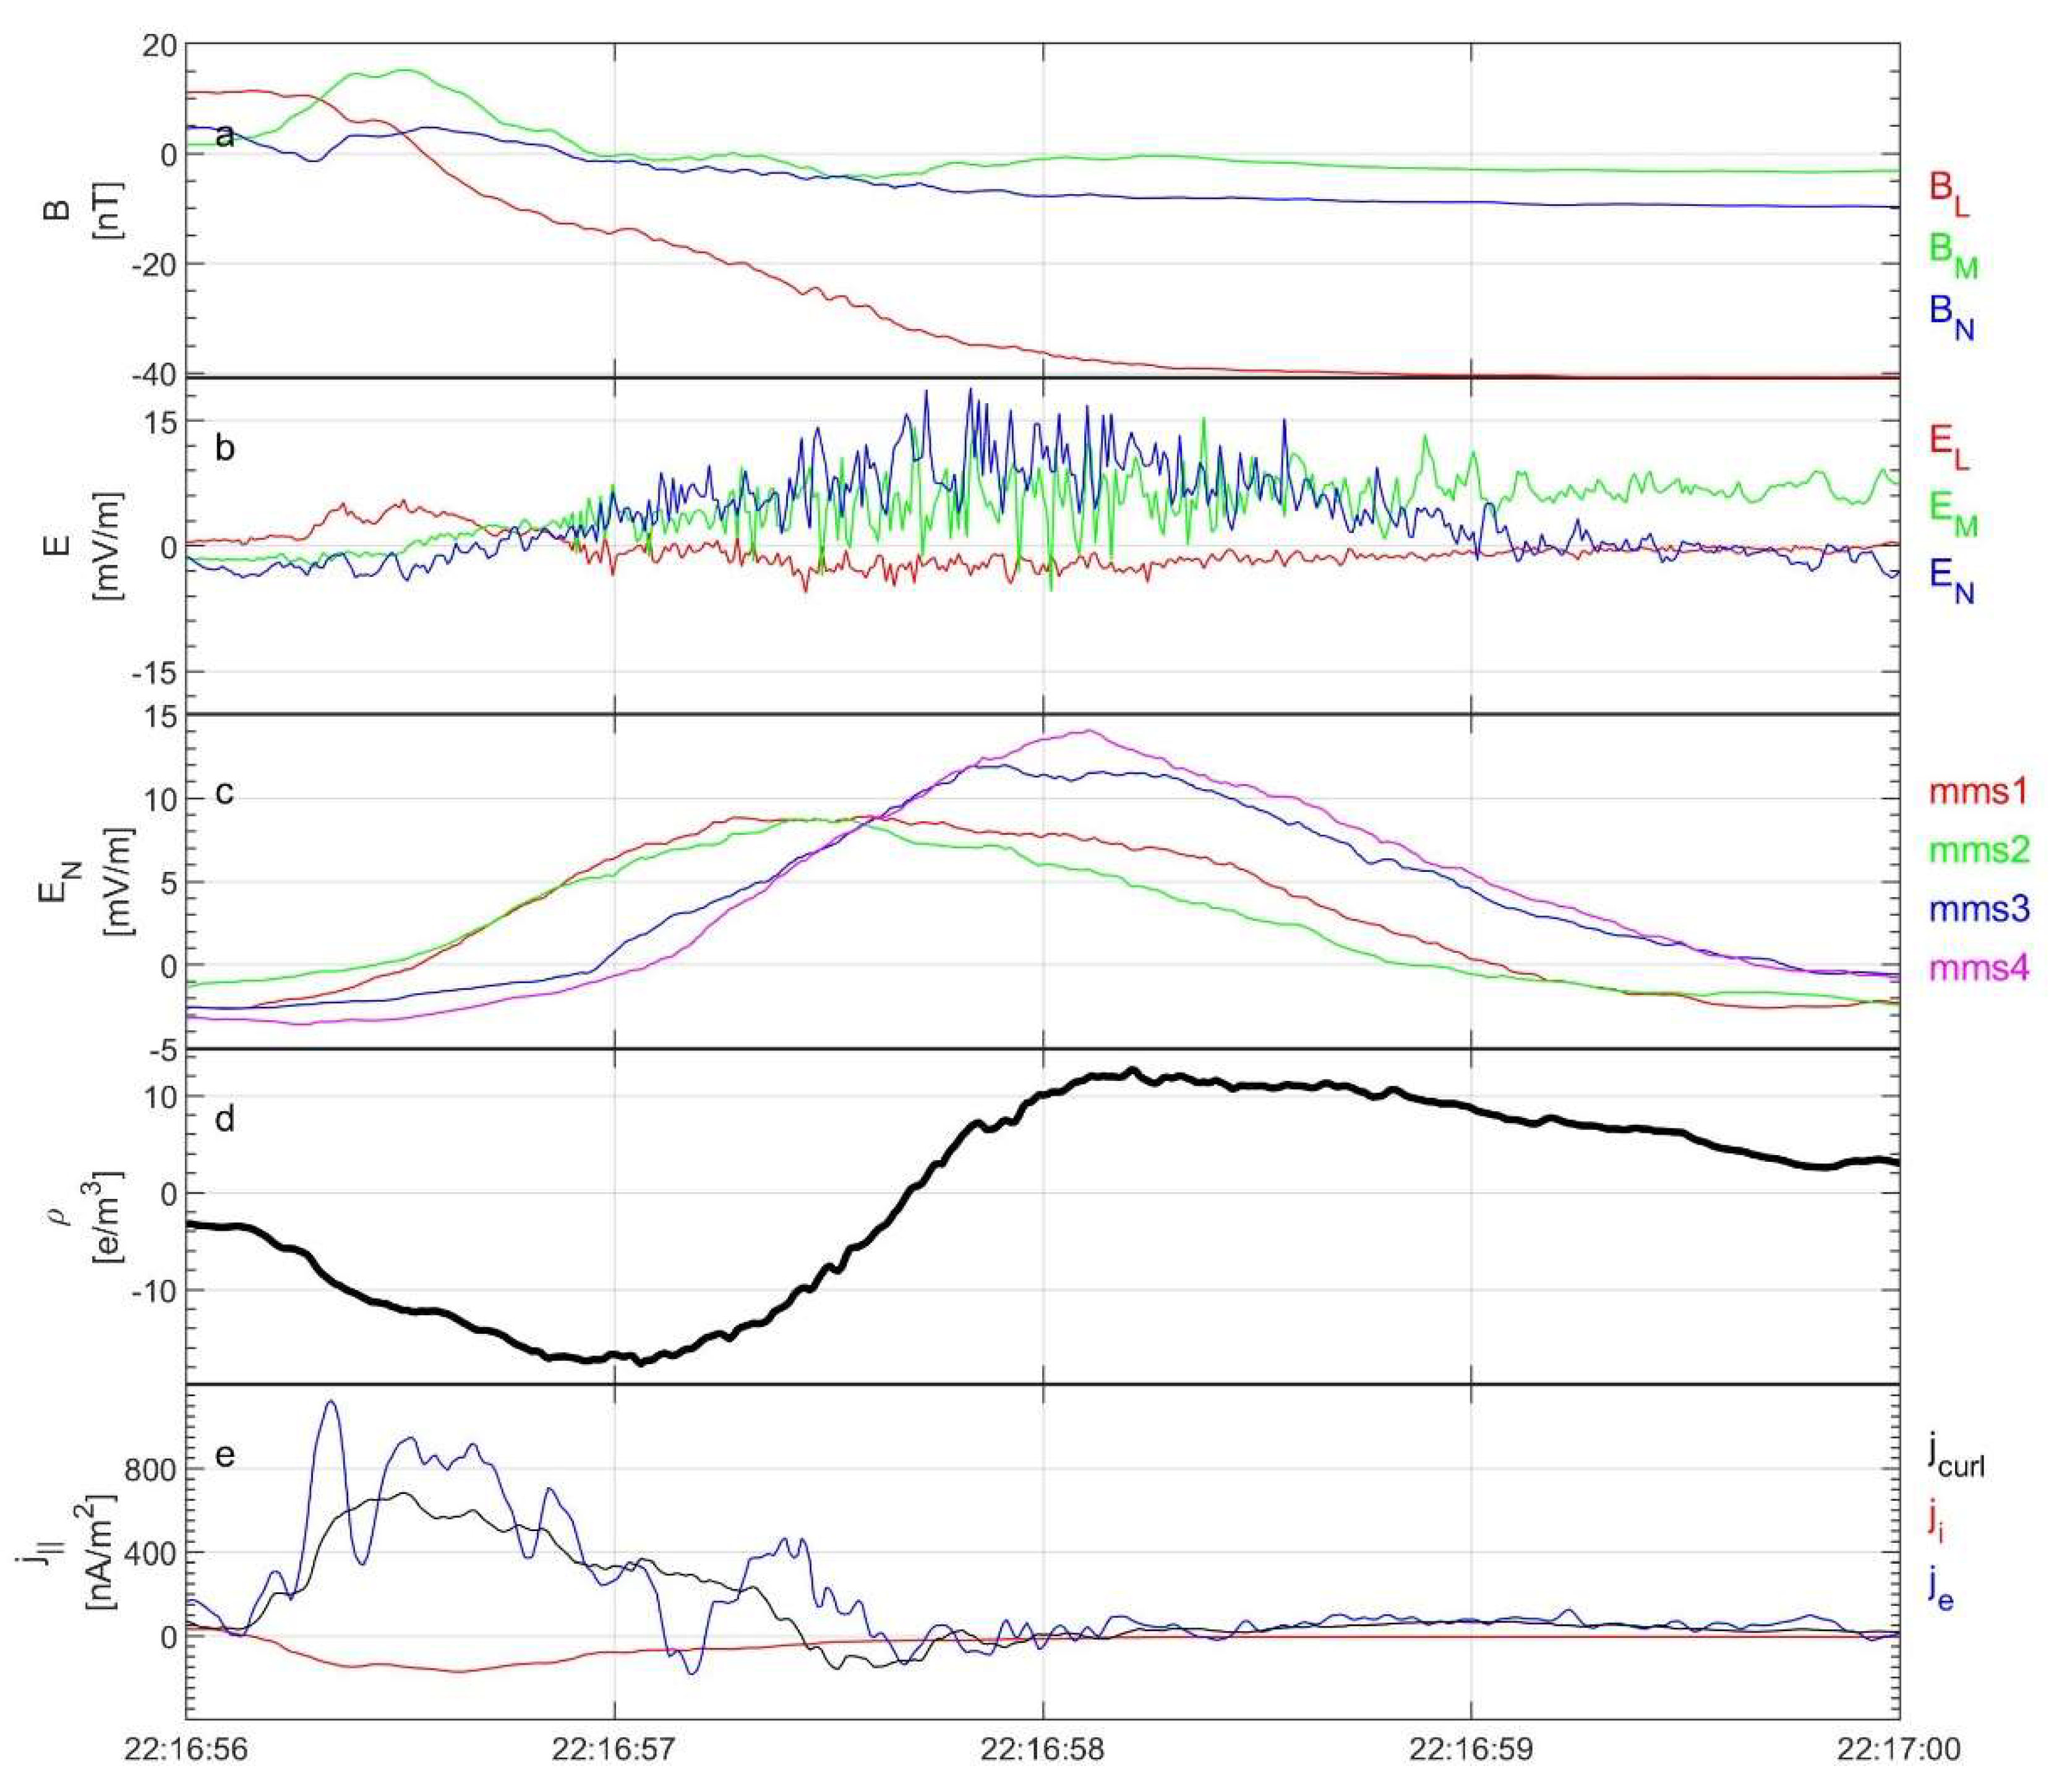
Similar to the above event, upon entering the magnetosphere, a polarized electric field emerges. At the same time, charge separation is observed. Unlike the above event, the NCL is on the outside of the magnetosphere, and the PCL is on the inside. The boundary of the NCL is indicated by the blue dashed line. Again, we explored the relationship between the electric field and the charge density distribution, as shown in Figure 4. The LMN coordinates are L = [0.22, 0.70, −0.63], M = [0.78, 0.50, 0.28] (dawnward), and N = [0.54, −0.46, −0.70]. During this magnetopause crossing, the range of the polarized electric field is L = 551   km with v mp = 129.47   km / s . The intensity of the polarized electric field strength E N increases and then decreases with depth. There are significantly enhanced parallel currents in the NCL range, indicating that the electric field may discharge through parallel currents and the carriers are electrons.
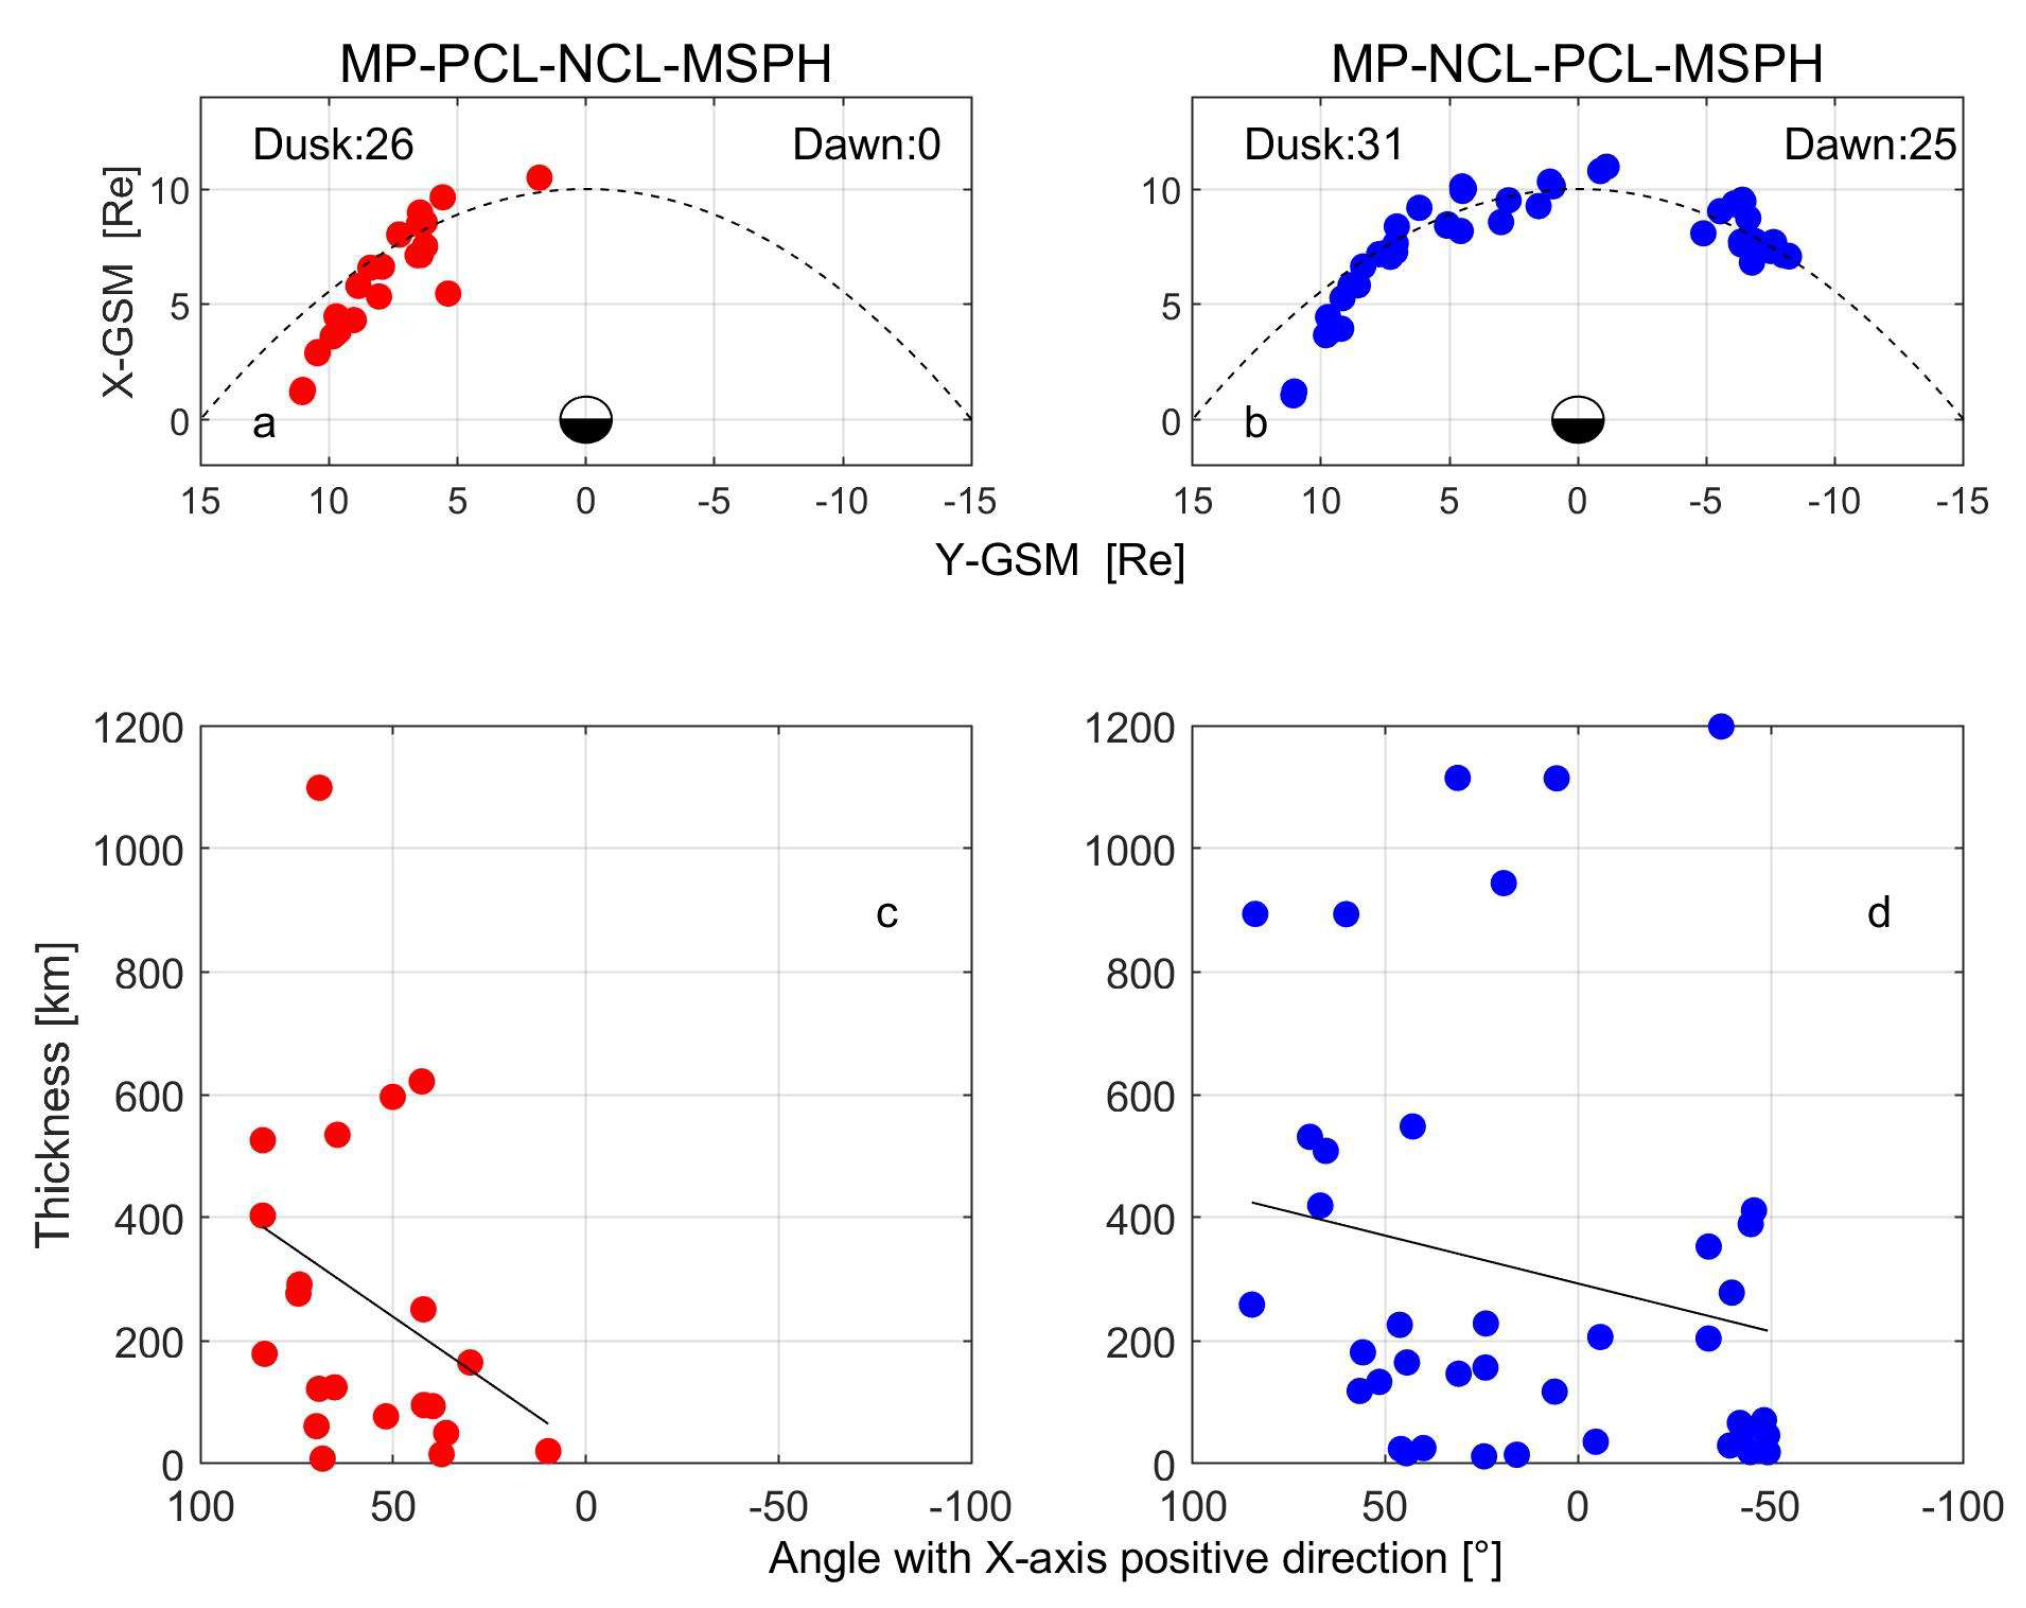
Given the charge separation characteristics presented by the two events mentioned above, we classified the crossing events in the database. Figure 5a,b show the location of the crossing events and the corresponding charge distributions. Figure 5a shows crossing events with MP-PCL-NCL-MSPH (MP, magnetopause; MSPH, magnetosphere) events, and we have marked such events in red. It can be seen that the 26 events (red) with MP-PCL-NCL-MSPH always occur at dusk. We have marked the MP-NCL-PCL-MSPH crossing events in blue (Figure 5b). The distribution of such MP-NCL-PCL-MSPH events shows dawn–dusk symmetry, with an occurrence rate of 55% at dusk and 45% at dawn.
Combined with the velocity of the motion of the magnetopause [24], the thickness of the PCL in MP-PCL-NCL-MSPH events and the NCL in MP-NCL-PCL-MSPH events can be roughly calculated, and the determination of the charge layer boundary is subjective. The two aforementioned examples illustrate that the profile of the charge density resembles a sinusoidal function, while the accompanying polarized electric field profile resembles a cosinusoidal function. Therefore, based on these observations, a single-charge layer can be identified using two criteria: the charge within the layer is typically either positive or negative, and the electric field strength is monotonically increasing. We can more easily obtain the boundary of the PCL in MP-PCL-NCL events and of the NCL in MP-NCL-PCL-MSPH events. On the contrary, the boundary of the NCL in MP-PCL-NCL-MSPH events and the PCL in MP-NCL-PCL-MSPH events is easily missed, which is due to the short duration of the burst model data and the difficulty of observing complete crossings from the magnetosheath to the magnetosphere. Excluding those events that cannot capture the boundary of the charge layer on the outside, we can obtain 60 charge layer thickness measurements from the outside of the magnetopause, as shown in Figure 5c,d.
The magnetopause is a paraboloidal structure, and the charge layer characteristics could be related to the particle incidence position. Since the ion cyclotron radius is much larger than the electron cyclotron radius, an MP-NCL-PCL-MSPH event appears on the day side and the dawn side near the magnetopause, and the thickness of the NCL decreases with the decrease in θ ( θ is the azimuth in the coordinate system). The MP-PCL-NCL-MSPH events only appear on the dusk side, and the thickness of the PCL decreases with the decrease in θ . The relationship between the thickness of the charge layer and the azimuth angle is shown in Figure 5c,d. The MP-PCL-NCL-MSPH events are more concentrated on the dusk side, θ > 30 ° , and the MP-NCL-PCL-MSPH events are evenly distributed in the range of θ [ 50 ° , 85 ° ] . The average thickness of the charge layer on the outside is ~300 km, which implies a range of ~600 km for the polarized electric field, doubling the thickness of the single-charge layer. Notably, the thickness of the negative charge layer is roughly equivalent to that of the positive charge layer, with the overall thickness aligning with the ion cyclotron scale.

4. Conclusions

In conclusion, we focused on analyzing the distribution of the charge and electric fields within the magnetopause. In the 82 magnetopause crossing events observed by the MMS, an excess net charge and a distinct electric field are present within the magnetopause, and the field vector is parallel to the boundary normal. The derived charge density, obtained by taking the derivative of the fitted electric field signal, is consistent with the observed value, suggesting that the electric field is indeed generated by the net charge.
The charge distribution can be categorized into two cases: MP-PCL-NCL-MSPH and MP-PCL-NCL-MSPH. MP-NCL-PCL-MSPH events are predominantly observed on the day side, whereas MP-PCL-NCL-MSPH events are typically observed on the dusk side. The average thickness of these electric layers is approximately 600 km, which is on the ion cyclotron scale. The existence of two groups of electric conditions in the magnetopause can be explained by the varying angles between the particle inflow direction and the magnetopause from the dawn side to the dusk side.
The presence of a localized transverse electric field brings about significant changes in the internal dynamics of the magnetopause, giving rise to the potential for new oscillations within the lower hybrid frequency range [25]. These oscillations are thought to have significant implications in various plasma phenomena, including magnetospheric boundary layer dynamics [26], fast magnetic reconnection [27], cross-field transport in laser-produced plasmas [28], and the dynamics of narrow electron beams at the plasma edge [29].

Author Contributions

Methodology, C.S.; Software, Y.Z.; Validation, Y.J. and Y.Z.; Formal analysis, L.G.; Investigation, L.G.; Writing—original draft, L.G.; Writing—review and editing, C.S., Y.J., Y.Z. and Y.V.B.; Visualization, L.G.; Supervision, C.S.; Funding acquisition, C.S. All authors have read and agreed to the published version of the manuscript.

Funding

This work was supported by the National Natural Science Foundation of China (Grant No. 42130202) and the National Key Research and Development Program of China (Grant No. 2022YFA1604600).

Data Availability Statement

High-quality MMS data were obtained from the MMS Science Data Center (http://lasp.colorado.edu/mms/sdc/, accessed on 3 April 2024), and we thank the MMS field teams and the MMS Science Data Center for providing them.

Conflicts of Interest

The authors declare no conflicts of interest.

References

  1. Pitout, F.; Bogdanova, Y.V. The polar cusp seen by Cluster. J. Geophys. Res. Space Phys. 2021, 126, e2021JA029582. [Google Scholar] [CrossRef]
  2. Haaland, S.; Hasegawa, H.; Paschmann, G.; Sonnerup, B.; Dunlop, M. 20 years of Cluster observations: The magnetopause. J. Geophys. Res. Space Phys. 2021, 126, e2021JA029362. [Google Scholar] [CrossRef]
  3. Shen, C.; Dunlop, M.; Ma, Y.H.; Chen, Z.Q.; Yan, G.Q.; Liu, Z.X.; Lucek, E. The magnetic configuration of the high-latitude cusp and dayside magnetopause under strong magnetic shears. J. Geophys. Res. 2011, 116, A09228. [Google Scholar] [CrossRef]
  4. Dunlop, M.W.; Balogh, A. Magnetopause current as seen by Cluster. Ann. Geophys. 2005, 23, 901–907. [Google Scholar] [CrossRef]
  5. Haaland, S.; Reistad, J.; Tenfjord, P.; Gjerloev, J.; Maes, L.; DeKeyser, J.; Maggiolo, R.; Anekallu, C.; Dorville, N. Characteristics of the flank magnetopause: Cluster observations. J. Geophys. Res. Space Phys. 2014, 119, 9019–9037. [Google Scholar] [CrossRef]
  6. Haaland, S.; Sonnerup BU, Ö.; Dunlop, M.W.; Georgescu, E.; Paschmann, G.; Klecker, B.; Vaivads, A. Orientation and motion of a discontinuity from Cluster curlometer capability: Minimum variance of current density. Geophys. Res. Lett. 2004, 31, L10804. [Google Scholar] [CrossRef]
  7. Panov, E.V.; Artemyev, A.V.; Nakamura, R.; Baumjohann, W. Two types of tangential magnetopause current sheets: Cluster observations and theory. J. Geophys. Res. 2011, 116, A12204. [Google Scholar] [CrossRef]
  8. Chapman, S.; Ferraro VC, A. A new theory of magnetic storms. Terr. Magn. Atmos. Electr. 1931, 36, 77–97. [Google Scholar] [CrossRef]
  9. Berchem, J.; Russell, C.T. The thickness of the magnetopause current layer: ISEE 1 and 2 observations. J. Geophys. Res. 1982, 87, 2108–2114. [Google Scholar] [CrossRef]
  10. Le, G.; Russell, C.T. The thickness and structure of high beta magnetopause current layer. Geophys. Res. Lett. 1994, 21, 2451–2454. [Google Scholar] [CrossRef]
  11. Willis, D.M. Structure of the magnetopause. Rev. Geophys. 1971, 9, 953–985. [Google Scholar] [CrossRef]
  12. Willis, D.M. The Boundary of the Magnetospheres: The Magnetopause. In Proceedings of the Critical Problems of Magnetospheric Physics, Madrid, Spain, 11–13 May 1972. [Google Scholar]
  13. André, M.; Vaivads, A.; Buchert, S.C.; Fazakerley, A.N.; Lahiff, A. Thin electron-scale layers at the magnetopause. Geophys. Res. Lett. 2004, 31, L03803. [Google Scholar] [CrossRef]
  14. Andre, M.; Behlke, R.; Wahlund, J.E.; Vaivads, A.; Eriksson, A.I.; Tjulin, A.; Fazakerley, A. Multi-spacecraft observations of broadband waves near the lower hybrid frequency at the Earthward edge of the magnetopause. Ann. Geophys. 2001, 19, 1471–1481. [Google Scholar] [CrossRef]
  15. Paschmann, G.; Daly, P.W. Analysis Methods for Multi-Spacecraft Data; ISSI Scientific Reports Series SR-001, ESA/ISSI; The International Space Science Institute: Bern, Switzerland, 1998; Volume 1, ISBN 1608-280X. [Google Scholar]
  16. Argall, M.R.; Shuster, J.; Dors, I.; Genestreti, K.J.; Nakamura, T.K.M.; Torbert, R.B.; Webster, J.; Ahmadi, N.; Ergun, R.; Strangeway, R.; et al. How Neutral Is Quasi-Neutral: Charge Density in the Reconnection Diffusion Region Observed by MMS. 2019. Available online: https://d197for5662m48.cloudfront.net/documents/publicationstatus/102689/preprint_pdf/5db3dbdfd818e19dfbd04f8606b30761.pdf (accessed on 3 April 2024).
  17. Gao, L.; Shen, C.; Zhou, Y.; Ji, Y.; Pu, Z.; Parks, G.; Burch, J.L. Observational features of charge distribution in Earth’s inner magnetosphere. Commun. Phys. 2024, 7, 63. [Google Scholar] [CrossRef]
  18. Shen, C.; Zhou, Y.; Gao, L.; Wang, X.; Pu, Z.; Escoubet, C.P.; Burch, J.L. Measurements of the Net Charge Density of Space Plasmas. J. Geophys. Res. Space Phys. 2021, 126, e2021JA029511. [Google Scholar] [CrossRef]
  19. Tong, Y.; Vasko, I.; Mozer, F.S.; Bale, S.D.; Roth, I.; Artemyev, A.V.; Torbert, R.B. Simultaneous Multispacecraft Probing of Electron Phase Space Holes. Geophys. Res. Lett. 2018, 45, 11513–11519. [Google Scholar] [CrossRef]
  20. Burch, J.L.; Moore, T.E.; Torbert, R.B.; Giles, B.L. Magnetospheric Multiscale Overview and Science Objectives. Space Sci. Rev. 2016, 199, 5–21. [Google Scholar] [CrossRef]
  21. Lindqvist, P.A.; Olsson, G.; Torbert, R.B.; King, B.; Granoff, M.; Rau, D.; Tucker, S. The Spin-Plane Double Probe Electric Field Instrument for MMS. Space Sci. Rev. 2016, 199, 137–165. [Google Scholar] [CrossRef]
  22. Pu, Z.Y.; Raeder, J.; Zhong, J.; Bogdanova, Y.V.; Dunlop, M.; Xiao, C.J.; Fazakerley, A. Magnetic topologies of an in vivo FTE observed by Double Star/TC-1 at Earth’s magnetopause. Geophys. Res. Lett. 2013, 40, 3502–3506. [Google Scholar] [CrossRef]
  23. Man, H.; Zhou, M.; Zhong, Z.; Deng, X.; Li, H. Statistics of the Intense Current Structure in the Dayside Magnetopause Boundary Layer. JGR Space Phys. 2021, 126, e2021JA029890. [Google Scholar] [CrossRef]
  24. Paschmann, G.; Daly, P.W. Shock and Discontinuity Normals, Mach Numbers, and Related Parameters. In Analysis Methods for Multi-Spacecraft Data; The International Space Science Institute: Bern, Switzerland, 1998. [Google Scholar]
  25. Amatucci, W.E.; Ganguli, G.; Walker, D.N.; Gatling, G.; Balkey, M.; McCulloch, T. Laboratory investigation of boundary layer processes due to strong spatial inhomogeneity. Phys. Plasmas 2003, 10, 1963–1970. [Google Scholar] [CrossRef]
  26. Ganguli, G.; Romero, H.; Dusenbery, P. The Dynamical Plasma Sheet Boundary Layer: A New Perspective. In Space Plasmas: Coupling Between Small and Medium Scale Processes; American Geophysical Union: Washington, DC, USA, 1995; pp. 371–384. [Google Scholar]
  27. Drake, J.F.; Biskamp, D.; Zeiler, A. Breakup of the electron current layer during 3-D collisionless magnetic reconnection. Geophys. Res. Lett. 1997, 24, 2921–2924. [Google Scholar] [CrossRef]
  28. Peyser, T.A.; Manka, C.K.; Ripin, B.H.; Ganguli, G. Electronion hybrid instability in laser-produced plasma expansions across magnetic fields. Phys. Fluids B Plasma Phys. 1992, 4, 2448–2458. [Google Scholar]
  29. Yamada, M.; Owens, D.K. Cross-Field-Current Driven Lower-Hybrid Instability and Stochastic Ion Heating. Phys. Rev. Lett. 1977, 38, 1529–1532. [Google Scholar] [CrossRef]
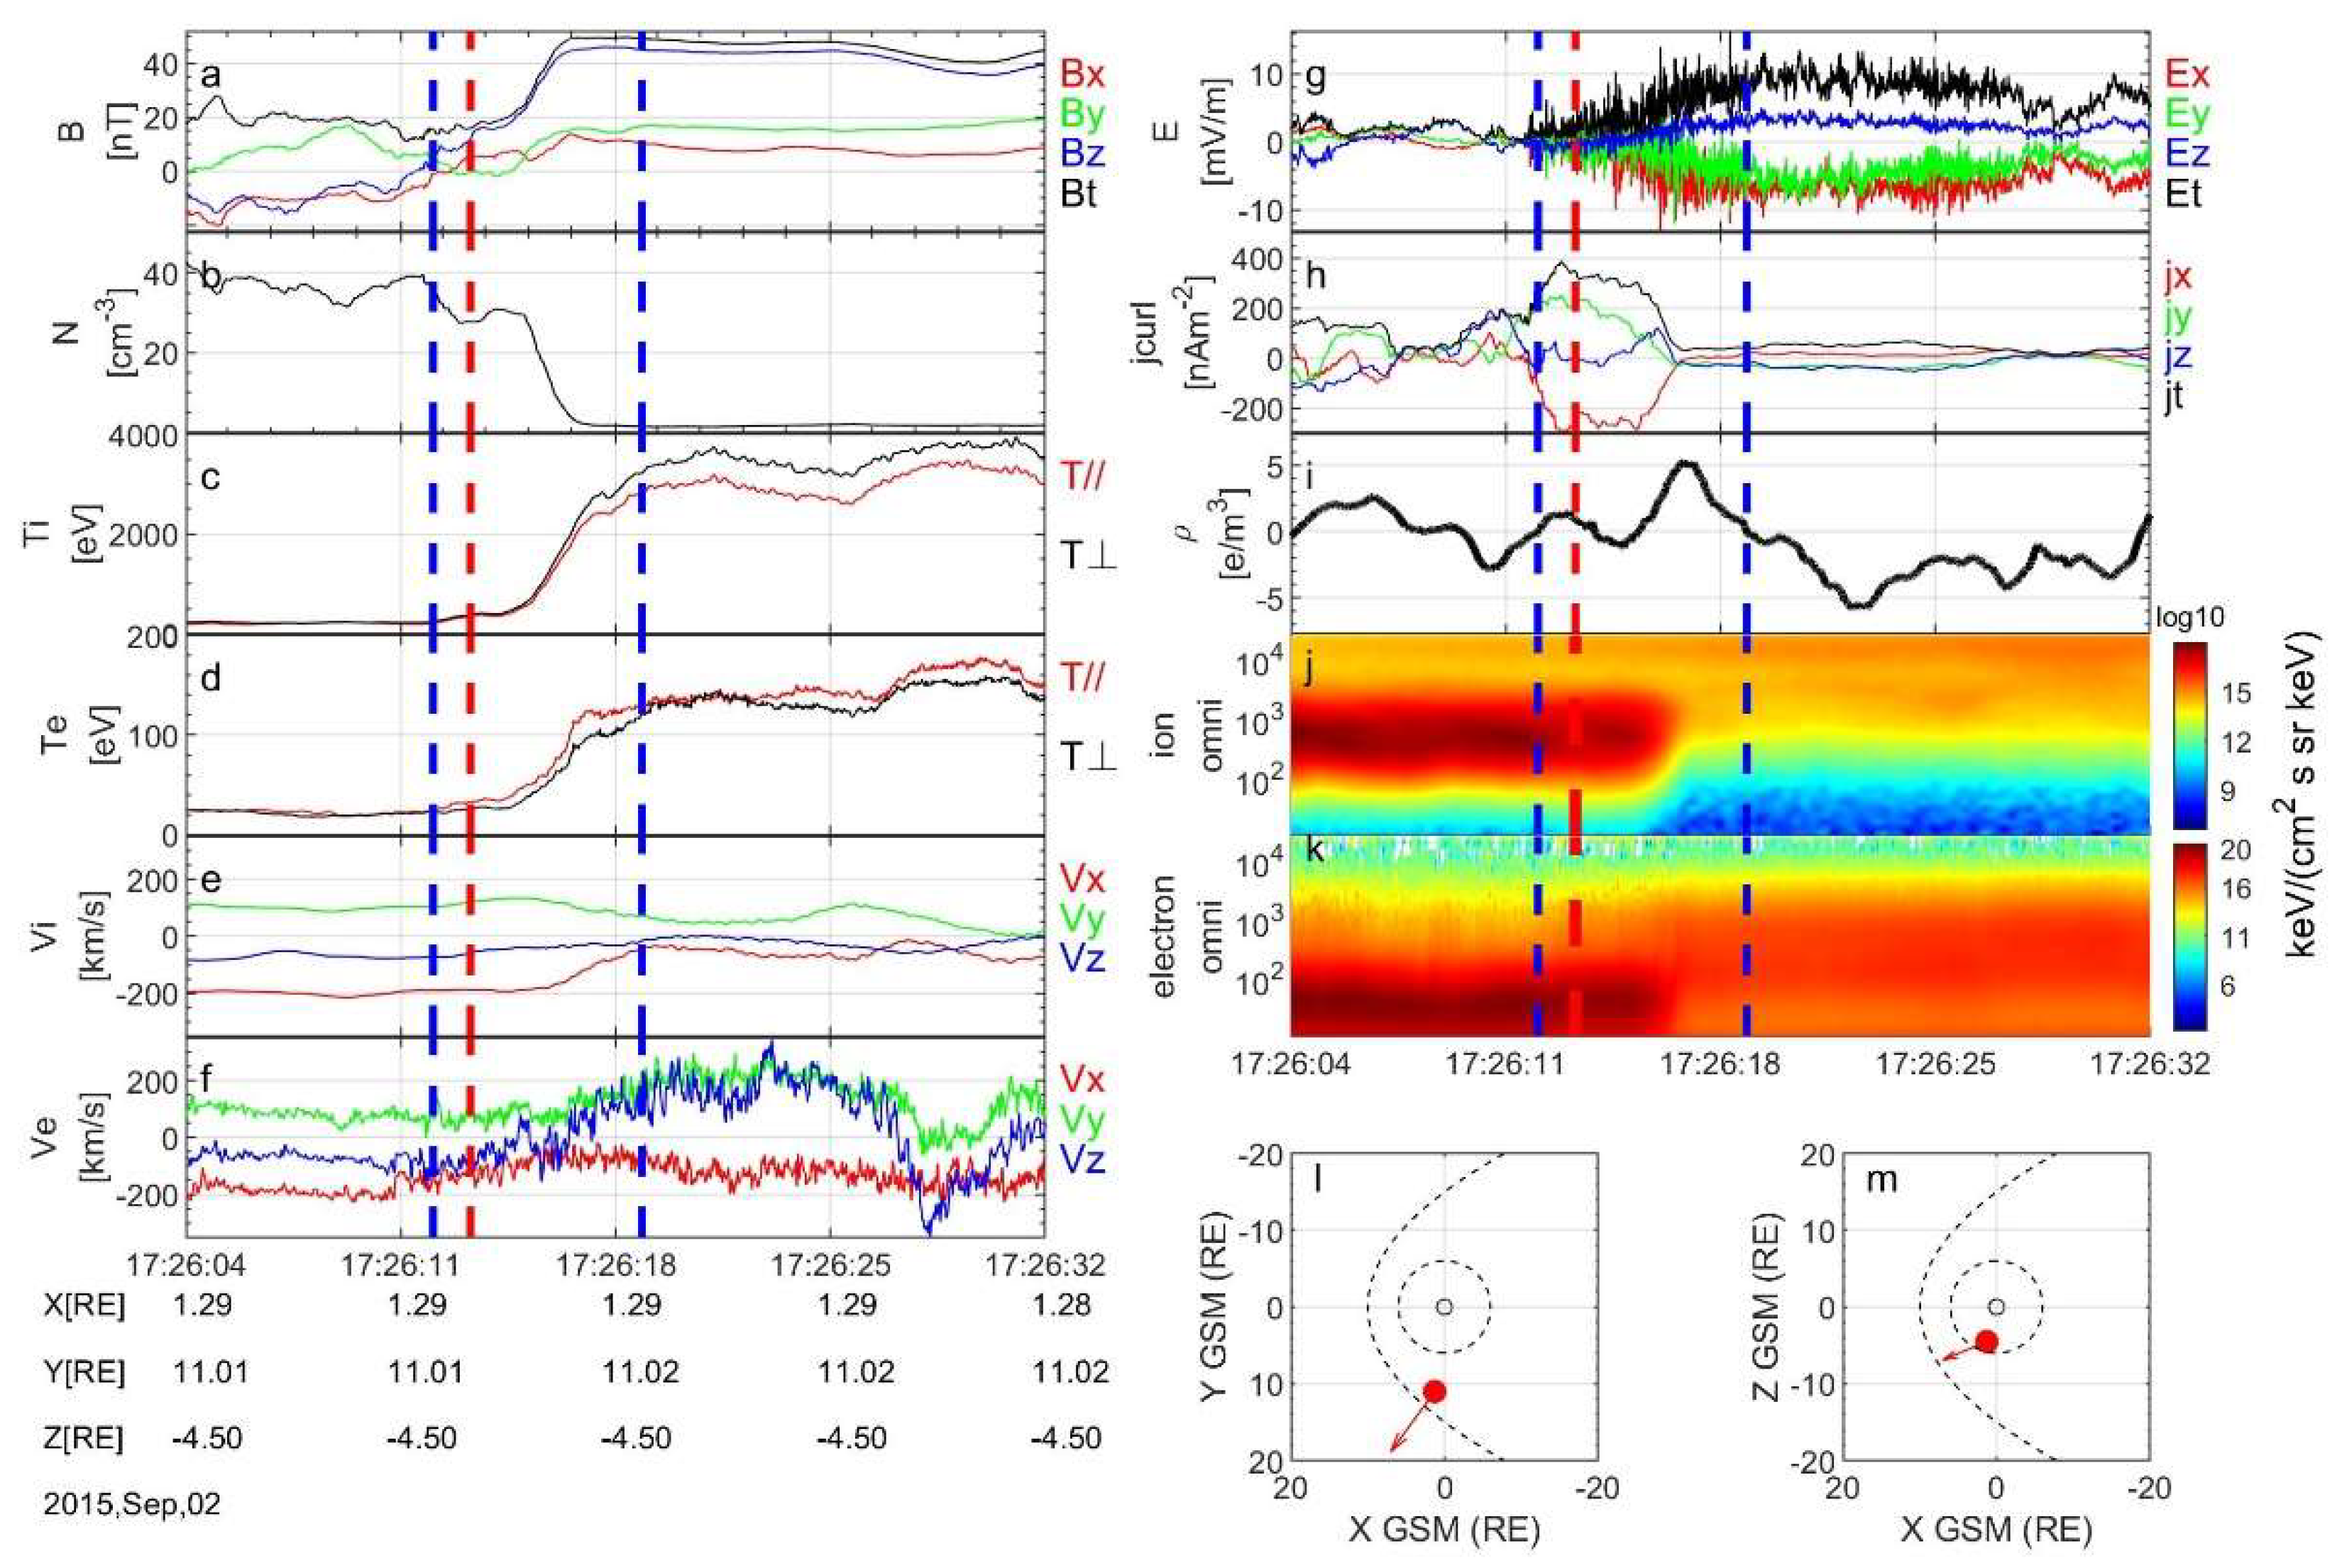
Figure 1. An example of a burst-mode interval crossing the magnetopause observed by MMS between 17:26:04 UT and 17:26:32 UT on 2 September 2015 in GSM coordinate. (a) Three components of the magnetic fields and magnetic field strength; (b) electron number density; (c) ion temperature; (d) electron temperature; (e) three components of the ion bulk velocity; (f) three components of the electron bulk velocity; (g) three components of the electric field and electric field strength; (h) three components of the current density and current density strength; (i) charge density; (j) ion and (k) electron omnidirectional differential energy flux; and (l,m) satellite location, where the red arrows show the normal direction of the magnetopause. The red dashed line marks α = 170 , and the blue dashed line marks the inner and outer boundaries of the charge layer.
Magnetochemistry 10 00037 g001
Figure 2. (a) The magnetic fields in the LMN coordinate system; (b) the electric fields in the LMN coordinate system and the Fourier fitting of the electric field; (c) the smoothed electric fields in the N direction measured by four spacecraft; (d) the charge density.
Magnetochemistry 10 00037 g002
Figure 3. An example of a burst-mode interval crossing the magnetopause observed by MMS between 22:16:53 UT and 22:17:05 UT on 10 January 2016 in GSM coordinate. (a) Three components of the magnetic fields and magnetic field strength; (b) electron number density; (c) ion temperature; (d) electron temperature; (e) three components of the ion bulk velocity; (f) three components of the electron bulk velocity; (g) three components of the electric field and electric field strength; (h) three components of the current density and current density strength; (i) charge density; (j) ion and (k) electron omnidirectional differential energy flux; (l,m) satellite location, where the red arrows show the normal direction of the magnetopause. The red dashed line marks α = 170 , and the blue dashed line marks the inner and outer boundaries of the charge layer.
Magnetochemistry 10 00037 g003
Figure 4. (a) The magnetic fields in the LMN coordinate system; (b) the electric fields in the LMN coordinate system; (c) the smoothed electric fields in the N direction measured by four spacecraft; (d) the charge density; (e) the parallel current from the curlometer (black), ion (red), and electron (blue).
Magnetochemistry 10 00037 g004
Figure 5. Statistical distribution of the locations of crossing events: (a) positive charge on the outside and negative charge on the inside of the magnetosphere, marked by red dots; (b) negative charge on the outside and positive charge on the inside of the magnetosphere, marked by blue dots; (c) the PCL thickness in relation to azimuthal distribution in MP-PCL-NCL-MSPH events; (d) the NCL thickness in relation to azimuthal distribution in MP-NCL-PCL-MSPH events.
Magnetochemistry 10 00037 g005
Disclaimer/Publisher’s Note: The statements, opinions and data contained in all publications are solely those of the individual author(s) and contributor(s) and not of MDPI and/or the editor(s). MDPI and/or the editor(s) disclaim responsibility for any injury to people or property resulting from any ideas, methods, instructions or products referred to in the content.