Article

Taxonomic Comparison, Antioxidant and Antibacterial Activities of Three Ebenus pinnata Ait. ecotypes (Fabaceae) from Algeria

by
Tassadit Zemouri
1,
Amirouche Chikhoune
2,
Hassina Benmouhoub
1 and
Mohamed Sahnoune
1,*
1
Laboratory of Ecology and Environment, Department of Environment and Biological Sciences, Faculty of Nature and Life Sciences, University of Bejaia, Targa Ouzemmour, 06000 Bejaia, Algeria
2
Laboratory of Microbial Ecology, Department of Food Science, Faculty of Nature and Life Sciences, University of Bejaia, Targa Ouzemmour, 06000 Bejaia, Algeria
*
Author to whom correspondence should be addressed.
Horticulturae 2023, 9(8), 879; https://doi.org/10.3390/horticulturae9080879
Submission received: 14 July 2023 / Revised: 27 July 2023 / Accepted: 29 July 2023 / Published: 3 August 2023
(This article belongs to the Special Issue Morphology, Palynology and Phytochemicals of Medicinal Plants)

Abstract

:
Ebenus pinnata is not known as a traditional medicinal plant, but modern research has revealed its richness in components of medicinal value. Yet, the species remains understudied. Here, we assess the climate effect on its morphology, pollen grains size, chromosome numbers, pollen fertility, and antioxidant and antibacterial activities. Plant material was collected from the humid, sub-humid, and semi-arid areas of Northeastern Algeria. Data treatment by principal component analysis and/or cluster analysis and ANOVA post hoc tests revealed three significantly discriminated ecotypes correlated with the climate stage. Significant differences were detected for whole plant morphology, pollen size, and antioxidant activity. No differences were revealed for chromosome numbers, pollen fertility, and antibacterial activity. The studied material showed a chromosome number of 2n = 14, high pollen fertility (94.04 ± 2.64–95.01 ± 2.02%), small pollen grains (polar axis: 17.95 ± 1.10–19.47 ± 1.27 µm; equatorial axis: 12.80 ± 1.18–13.03 ± 0.99 µm), high antioxidant activity (TPC: 50.79 ± 0.51–56.89 ± 0.46 mg/g; DPPH: 71.18 ± 2.24–95.67 ± 2.02 mg/g; RP: 11.09 ± 1.24–25.88 ± 0.26 mg/g), and efficient antibacterial activity (Inhibition area diameter: 9.25 ± 1.06–12.00 ± 1.41 mm). The climate seems to exert a significant impact on multiple aspects of the plant’s biology. It would be interesting to assess the genetic basis of this phenomenon in E. pinnata and other species.

1. Introduction

The genus Ebenus comprises twenty species, fourteen of which are endemic to Turkey [1,2]. The six other species outside Turkey are E. cretica L. in Crete; E. sibthorpii DC. In Southeastern Greece and the Aegean Sea Islands; E. stellata Boiss. In Iran, Oman, Afghanistan, Pakistan, and India; E. lagopus Boiss. in Southern Iran; E. armitagei Schweinf. and Taubertin in Libya and Egypt; E. pinnata Ait. in Libya, Tunisia, Algeria, and Morocco [3,4,5].
Morphologically, the genus Ebenus distinguishes itself from other genera of the tribe Hedysareae mainly by its corolla, which is shorter than the calyx teeth, and its one-lomented pod enclosed within the calyx tube [3,6,7]. It constitutes a monophyletic group within the Hedysaroid clade [7], with its ancestral area of origin inferred in the Mediterranean Region [8] and its main center of diversity located in Turkey [9].
Pollen grains in Ebenus species are radially symmetrical, isopolar, tricolpate, prolate, and rarely perprolate; they have an intine of 0.5 µm and an exine of 1 µm, with reticulate ornamentations and more or less narrow lumina; they have a polar diameter of 24–40 µm and an equatorial diameter of 12.4–20 µm, with elliptical outlines on an equatorial view and circular to subcircular outlines on a polar view [10,11,12].
All Ebenus species so far investigated show a chromosome number of 2n = 2x = 14 [10,13,14,15,16]. The karyotypes are symmetric and include a pair of satellite chromosomes with chromosome lengths of 1.93–4.22 µm [10,14].
Ebenus plants are used in traditional folk medicine to treat various health disorders in Turkey [17,18]. Ebenus haussknechtii Bornm. ex Hub.-Mor. is used to prevent skin problems, hypertension, and stomach diseases [17]. The analysis of its chemical composition identified various natural compounds (including two flavonoid glycosides and a methylinositol) with very significant antimicrobial activity [17]. As to E. hirsuta Jaub. and Spach., it is used to treat kidney disorders [18,19]. Its aerial parts contain mainly hyperoside, rutin, hesperidin, tannic acid, and p-coumaric acid [20]. Its extracts display strong antigenotoxic effects and significant activity against bacteria and fungi [20]. Similarly, E. laguroides Boiss. and E. macrophylla Jaub. and Spach. have proven to be with significant antioxidant and antibacterial activities due to various chemical compounds, especially rutin, the dominant component in Ebenus species [21]. Analyses of roots and aerial parts extracts of E. boissieri Barbey have revealed immunomodulatory and antitumor activity inducing apoptosis in breast cancer cells [22], caspase-mediated apoptosis on the cervical cancer cell line Hela [23], and cytotoxic and apoptotic effects on the human lung cancer cell line A549 [24]. In addition to its osteoprotective role, E. cretica is very rich in flavonoids and isoflavones, such as formononetin, maesopsin glucoside (aurone), and other compounds [25]. E. cretica administration exerts a significant beneficial effect on bone density loss in ovariectomized rats [26]. Mitrocotsa et al. [27] report a long list of important components isolated from E. cretica and E. sibthorpii DC, including D-pinitol, quercetin, isorhamnetin glycosides, and, especially, rutin-7,4′-di-O-methyl ether, 8,4′-dimethoxy-7-hydroxy-isoflavone, and ionyl glycosides icaricide B1 and B2. Phytochemical tests of E. stellata extracts, known for their anticonvulsant and microbial activities, have revealed the presence of coumarins, alkaloids, cardiac glycosides, flavonoids, quinone, saponins, steroids, terpenoids, and tannins [28,29]. More information about the medicinal properties and antimicrobial activities of Ebenus plants can be found in Zemouri et al. [30] and references therein.
Ebenus pinnata is a spontaneous, uncultivated, and self-pollinated herbaceous species (pers. obs.), restricted to the northern parts of Morocco, Algeria, Tunisia, and Lybia [5]. The plant, as green fodder, is as palatable to livestock as other legumes (pers. obs.). No other traditional use is mentioned for it in literature. No specific data are found in the literature on its morphological and palynological variability. Two cytotypes have been mentioned for E. pinnata: one with 2n = 14 from Morocco and Algeria [13,15,16] and the second with 2n = 18 from Morocco [31]. A study of the chemical composition of E. pinnata plants from Tunisia has detected the presence of several secondary metabolites, including ombuoside, kaempferol 3-O-rutinoside, rutin, and catechin, which proved to be with significant antioxidant activity [32,33], conferring thus a potential medicinal value to the plant.
Despite its wide distribution all over the northern part of North Africa and its potential medicinal value, E. pinnata remains insufficiently investigated from both taxonomic and phytochemical points of view. In the present study, we compare three Algerian E. pinnata populations from different climate stages (humid, sub-humid, and semi-arid) using multivariate whole plant morphology, pollen grains size and shape, pollen fertility, karyology, antioxidant, and antibacterial activities. The aim is to highlight the climate impact on those aspects of plant biology. The results are statistically evaluated and discussed.

2. Materials and Methods

The taxonomic analysis, including morphometrics, multivariate analyses, cytogenetics, and pollen study, were achieved in the Laboratory of Ecology and Environment of University of Bejaia (Department and County of Bejaia, Northeastern Algeria). Antioxidant and antibacterial activities were assessed in the Laboratory of Microbial Ecology of the same university.

2.1. Plant Material

The whole plant morphology was studied on plants harvested from populations located in three different climate stages (humid, sub-humid, and semi-arid) [34]. The plants were kept fresh using plastic bags and moistened paper until study in the laboratory. More details are given in Table 1. Altogether, 126 plants were sampled: 44 specimens from the humid stage, 55 from the sub-humid, and 27 from the semi-arid.
In addition to fresh plants reserved for multivariate morphological analysis, inflorescences were collected from at least five plants at different stages of development: young floral buds for meiosis analysis, flowers just before anthesis for pollen fertility assessment, and pollen grains measurements. The material was in situ fixed in 10 mL tubes containing absolute ethanol–glacial acetic acid-chloroform (6:3:1) [35].
The plant material destined for chemical extractions was collected on March 2023 from the same populations as for morphology. A total of 400 to 500 g of fresh leaves and young stems (at the beginning of young inflorescences occurrence) were harvested from each climate stage. The plant material was spread on paper sheets for ten days under sun-free conditions. The sun-free dried plant material was then powdered and stored in sealed glass containers for further use [36].

2.2. Whole Plant Morphology Analysis

Forty-four quantitative morphological characters (Table 2, characters 1–44) were measured on the 126 fresh plants harvested from the three climate stages (see above and Table 1). Measurements were performed using a tape measure for stem height, a sliding caliper for stem diameter, and a ruler for the dimensions of internodes, leaves, inflorescences, etc. Graph paper was used to measure small features, such as hairs, flower parts, pods, and seeds, under a binocular magnifier. To minimize errors because of character misappreciation, the same researcher (T. Zemouri) performed all the morphometric scorings. Qualitative traits of color and hairiness are uniform, so they were not included in the analysis.

2.3. Reagents Required for Pollen and Meiosis Study

2.3.1. Fixative Solution

Absolute ethanol (SIGMA-ALDRICH, 24103-2.5L-R, St. Louis, MO 63103 USA); Glacial acetic acid (BIOCHEM Chemopharma, 101132500, Europe Office, ZA Cosne-Sur-Loire, France); Chloroform (Carlo Erba, 438601, Val-De-Reuil, France).

2.3.2. Lactopropionic Orcein Preparation

Orcein (BIOCHEM Chemopharma, 520280905, Europe Office: ZA Cosne-Sur-Loire, France); Lactic acid (80%) (PANREAC, 131034, E-08110 Montcada i Reixac (Barcelona) Spain); Propionic acid (BIOCHEM chemopharma, 116150500, Montreal, QC, Canada).

2.3.3. Cotton Blue Preparation

Anilin blue (SCHARLAU, AZ 01000025, SCHALAB S.L., Barcelona, Spain); Glycerin (BIOCHEM Chemopharma, 201061000, Montreal, Quebec H2Y DA4); Lactic acid (85%): PANREAC, 131034, E-08110 Montcada i Reixac (Barcelona), Spain); Phenol cristals (SIGMA-ALDRICH, 242322, St. Louis, MO, USA).

2.4. Pollen Grains Size and Shape

In situ fixed flowers just before anthesis (see above) were used to recover anthers on a microscope slide containing a drop of lactopropionic orcein prepared according to Dyer [37]. The anthers were dissected under a stereomicroscope to recover pollen grains. After eliminating anther debris, a cover glass was carefully applied over the stain drop. After 10 min, pollen grains are well stained. The observations were performed under an Optika B-353A (Optika, SN 373686, Ponteranica, BG, Italy) light microscope. Pollen grains were photographed at 40× magnification. Five flowers from different racemes were used for each population. Altogether, 235 pollen grains (humid: 116; sub-humid: 78; semi-arid: 41) were measured for their polar (P) and equatorial (E) axes; the rate P/E and the product PxE were calculated. Pollen grains shapes and number of colpi were scored.

2.5. Meiosis Analysis

In situ fixed young floral buds were used (see above). In a drop of lactopropionic orcein [37] on a slide, after 5–6 min in a water bath (Memmert, L210.0187, Schwabach, FRG, Germany) at 60 °C, floral buds were dissected to recover the young anthers. Under a cover glass, the anthers were squashed with the thumb to eject the pollen mother cells. The observations were made under an Optika B-353A light microscope to search for under-division mother cells. The best metaphases, I and II, were photographed at 100x magnification.

2.6. Pollen Fertility Assessment

In situ fixed flowers (see above), just before anthesis, were used. In a small drop of distilled water on a slide, the anthers of a flower were recovered by dissecting and pressing them with needles to obtain the maximum of pollen grains. After drying the drop of water with slight heating on a hotplate, a small drop of cotton blue [35] was added to the dried spot. Pollen grains stain after 10 min at room temperature. The observations were made under a coverslip at 40× magnification on an Optika B-353A light microscope. A total of 10 to 30 flowers from different plants were used. A total of 700 to 900 pollen grains per flower were screened. Well-stained grains with uniform outlines were considered fertile, whereas the light-stained ones, with irregular outlines and relatively small sizes, were counted sterile. Pollen fertility rate (TF) is expressed as
TF   % = Number   of   fertile   grains Total   number   of   fertile   and   sterile   grains × 100

2.7. Determination of Antioxidant Activity

2.7.1. Chemical Reagents

All chemicals were of analytical reagent grade. Folin–Ciocalteu reagent (catalog number 106060250), trichloroacetic acid ≥ 99.0% purity (catalog number 120130500), sodium carbonate anhydrous (catalog number 319060500) were from Biochem, Chemopharma (Montreal, QC, Canada. Potassium ferricyanide ≥ 99.5% purity (catalog number 316050250) was from Biochem (Chemopharma, GA, USA). Gallic acid (catalog number 91215-100MG); 2-2-diphenyl-1-picrylhydrazyl (catalog number 669237-1G) were from Sigma–Aldrich GmbH (St. Louis, MO, USA). Ferric chloride 97 % (catalog number 236489-100G), ethanol absolute (catalog number 1070172511-2,5L), and dimethyl sulfoxide (catalog number 472301-500ML) were from Sigma–Aldrich GmbH (Sternheim, Germany).

2.7.2. Plant Extract Preparation

The dried and finely powdered plant material from each of the three climate stages (5 g for each assay) was extracted with 100 mL of absolute ethanol for 6 h or continued until the extract gave no coloration, using a Soxhlet apparatus (Behr Labor-Technik GmbH, Düsseldorf, Nordrhein-Westfalen, Germany). At the end of the extraction, the liquid extract was filtered and evaporated in a vacuum at 40 °C to complete dryness, using a Büchi rotavapor R-200 (BÜCHI Labortechnik Flawil, Switzerland) [36]. The extraction yield was calculated using the following equation:
Extract   yield   % = Mass   of   extract   g Mass   of   dry   leaves   sample   g × 100

2.7.3. Total Phenolic Content

The total phenolic content of plant extracts was measured by the Folin–Ciocalteu reagent GAEent assay, using the method described by Singleton et al. [38] with a few modifications. A diluted solution of each extract (200 µL) was mixed with 750 µL of Folin–Ciocalteu reagent (previously diluted with water 1:10 v/v). This mixture was maintained at ambient temperature for 5 min, after which 400 µL of sodium carbonate solution (75 g/L in water) was added. The mixture was left to stand for 1 hr at room temperature. The absorption was measured, in triplicate, at 765 nm against water blank, using ultraviolet-visible (UV-Vis) spectrophotometer (Shimadzu, China). The total phenolic contents of the extracts were calculated using the calibration curve of gallic acid standard. Results were given in mg of gallic acid equivalent (GAE)/g of dry extract.

2.7.4. DPPH Free Radical Scavenging Assay

Free radical scavenging activity was determined using the 2, 2-diphenyl-1-picrylhydrazyl free radical (DPPH) method [39] with some modifications. A total of 25 µL from each extract were added to 975 µL of 100 µM methanolic solution of DPPH. The mixture was shaken and left in the dark at room temperature. After 30 min, the absorbance was recorded, in triplicate, at 512 nm, using an ultraviolet-visible (UV-Vis) spectrophotometer), and compared to the absorbance of blank sample containing 25 µL of methanol and the same amount of DPPH solution. A standard calibration curve was obtained using different gallic acid concentrations. Antioxidant activity was expressed as mg gallic acid equivalent (GAE)/g of dry extract.

2.7.5. Reducing Power Assay

The method was based on [40] procedures with modifications. A total of 0.125 mL of each extracted sample was mixed with 2.5 mL phosphate buffer (0.2 M, pH 6.6) and 2.5 mL of potassium ferricyanide [K3Fe (CN)6] (1%). The mix was incubated in water bath at 50 °C for 10 min, followed by addition of 2.5 mL of trichloroacetic acid (10%) and then centrifuged at 1500 rpm for 10 min. Finally, 2.5 mL of the upper layer solution was mixed with distilled water (2.5 mL) and FeCl3 (0.5 mL, 0.1%). The absorbance was recorded, in triplicate, at 700 nm. Reducing power assay was expressed as mg gallic acid equivalent (GAE)/g of dry extract.

2.8. Screening of the Antibacterial Activity

2.8.1. Bacterial Strains

The antibacterial activity test of E. pinnata extracts included six foodborne pathogen bacteria provided by Pasteur Institute (Algiers, Algeria) and identified with the ATCC number (American Type Culture Collection). The Gram-negative bacteria: Escherichia coli ATCC 25922, Pseudomonas aeruginosa ATCC 27853, Vibrio cholerae ATCC 14035, Salmonella typhi ATCC 14028, and the Gram-positive bacteria: Staphylococcus aureus ATCC 25923 and Methicillin-resistant S. aureus ATCC 43300 (MRSA) were studied. All strains were grown in nutrient agar (NA) and incubated at 37 °C for 18–24 h until the stationary growth phase was reached [41].

2.8.2. Antibacterial Test

The antibacterial activity was conducted using agar well-diffusion method in accordance with the National Committee for Clinical Laboratory Standards [41]. Inoculum containing 106 colony-forming units per milliliter (CFU/mL) of each bacterial culture to be tested were evenly spread on the surface of Mueller Hinton agar plates using sterile swabs. Subsequently, wells of 6 mm diameter were punched into the agar medium and filled with 40 μL (5 mg/mL) of plant extract dissolved in dimethyl sulfoxide (DMSO) and allowed to diffuse at room temperature for 2 h. The plates were then incubated in the upright position at 37 °C for 24 h. A well containing the same volume of DMSO served as a negative control. After incubation, the diameters (mm) of the growth inhibition zones were measured. All tests were repeated in triplicate.

2.9. Statistical Evaluation

Whole plant morphology and pollen size data were treated using principal components analysis (PCA) and/or cluster analysis. Before performing cluster analysis, variable values were standardized by centering (Xi = xi − mean). Mean values were compared using Tukey’s honest significant difference test for unequal-size samples (unequal N HSD test), Fisher’s least significant difference (LSD), or the Student’s t-test for paired (dependent) samples. Homogeneity of variances was checked using Levene’s test. Statistical analyses and homogeneity tests were performed using Statistica 8.0 programs [42].

3. Results

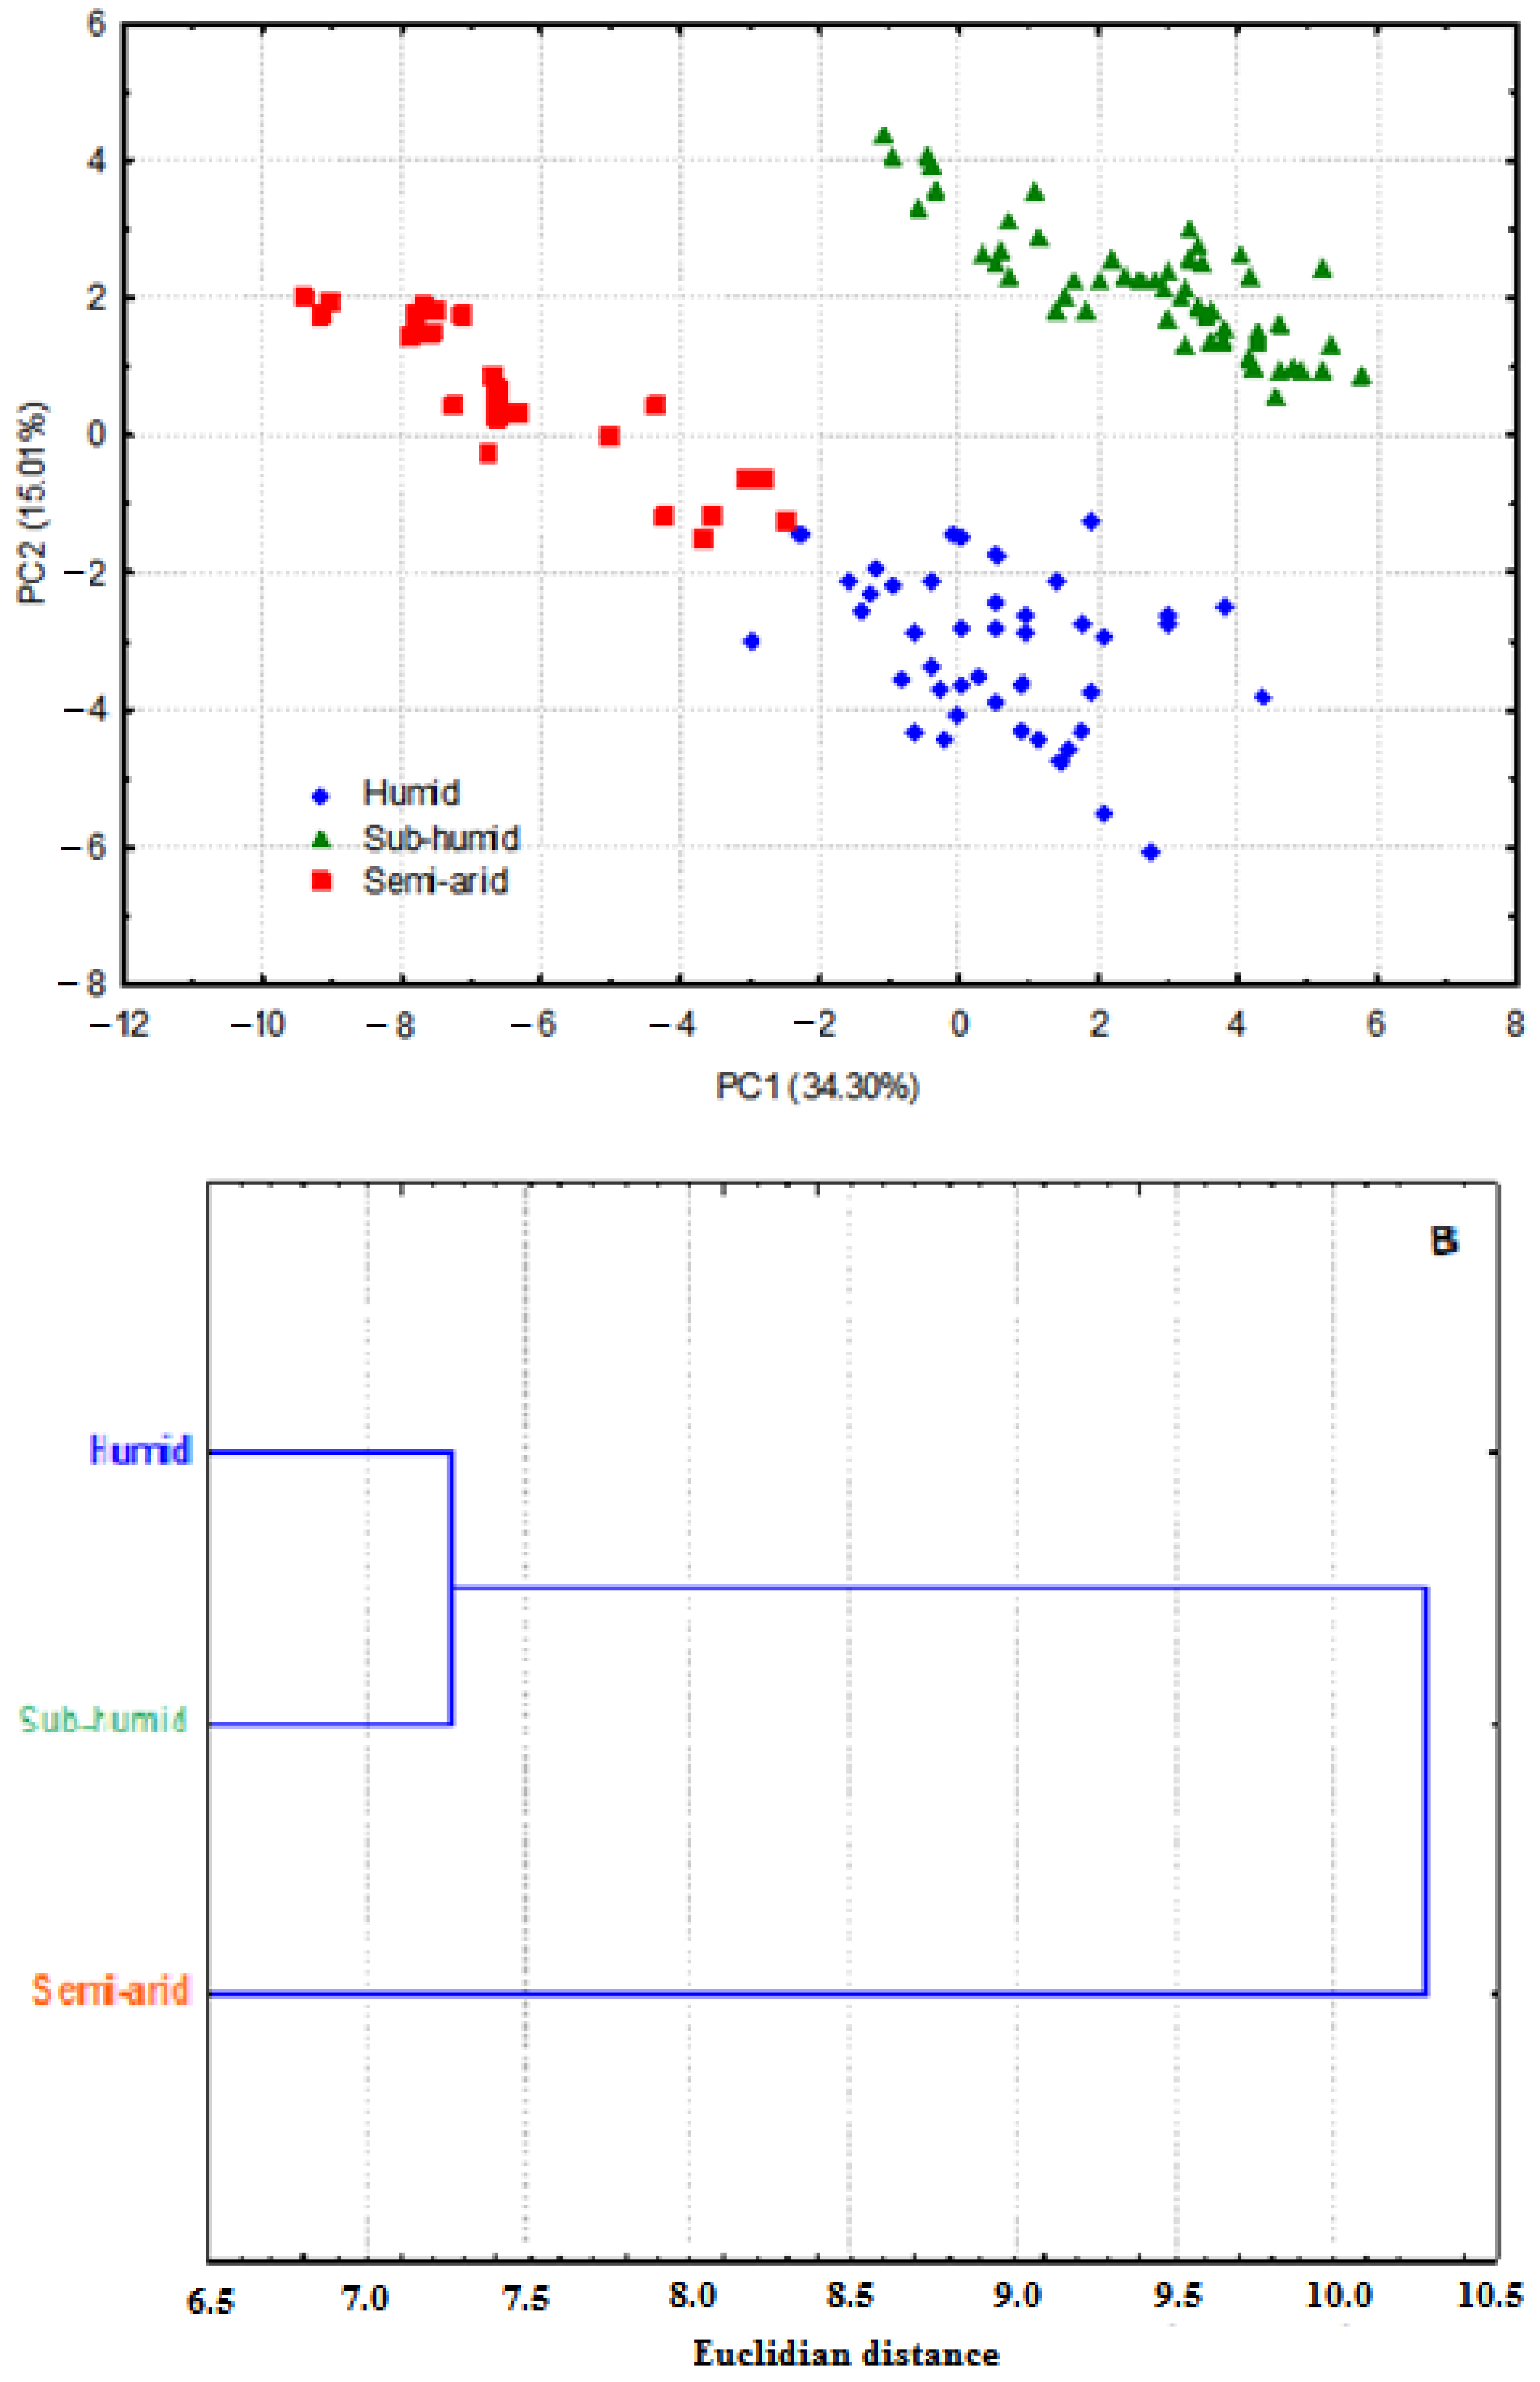
3.1. Whole Plant Morphology

All the studied populations showed a hemicryptophyte habit (aerial parts dying after fructification and sprouting up from the base the next season) except in rare cases where some plant stems tend to be evergreen, especially in humid spots. All the plants appear the same for their qualitative traits: Greenish–brownish hairy stems with long upright white hairs; glaucous leaves, thickly hairy leaflets on both sides, appressed hairs; purple corolla parts.
The analysis of the quantitative characters (Table 2, characters 1–44; see Supplementary Materials S1 for the raw data matrix) by PCA yielded the scatterplot in Figure 1A (Planes 1–2), where the three studied groups are perfectly separated. On planes 1–3, 1–4, and 1–5 of the PCA (Appendix B), the semi-arid population was confirmed to be a separate group from the other two merged groups (humid and sub-humid). The cumulated explained variance for the five axes is 68.67%. The characters explaining the separation of the groups in Figure 1A are given in Table 3 and Appendix A.
Table 3 details the morphological comparison of the three groups. There are significant differences for all morphological characters except DI (diameter of inflorescence), WFB (Width of the flower bract), LC2 (Length of the corolla), and LHCT (Length of hairs at the base of the calyx teeth). The morphological comparison of the three groups is better summarized by the cluster analysis in Figure 1B, where the “semi-arid” population shows up as a remote group in relation to the closer but different “humid” and “sub-humid” groups.

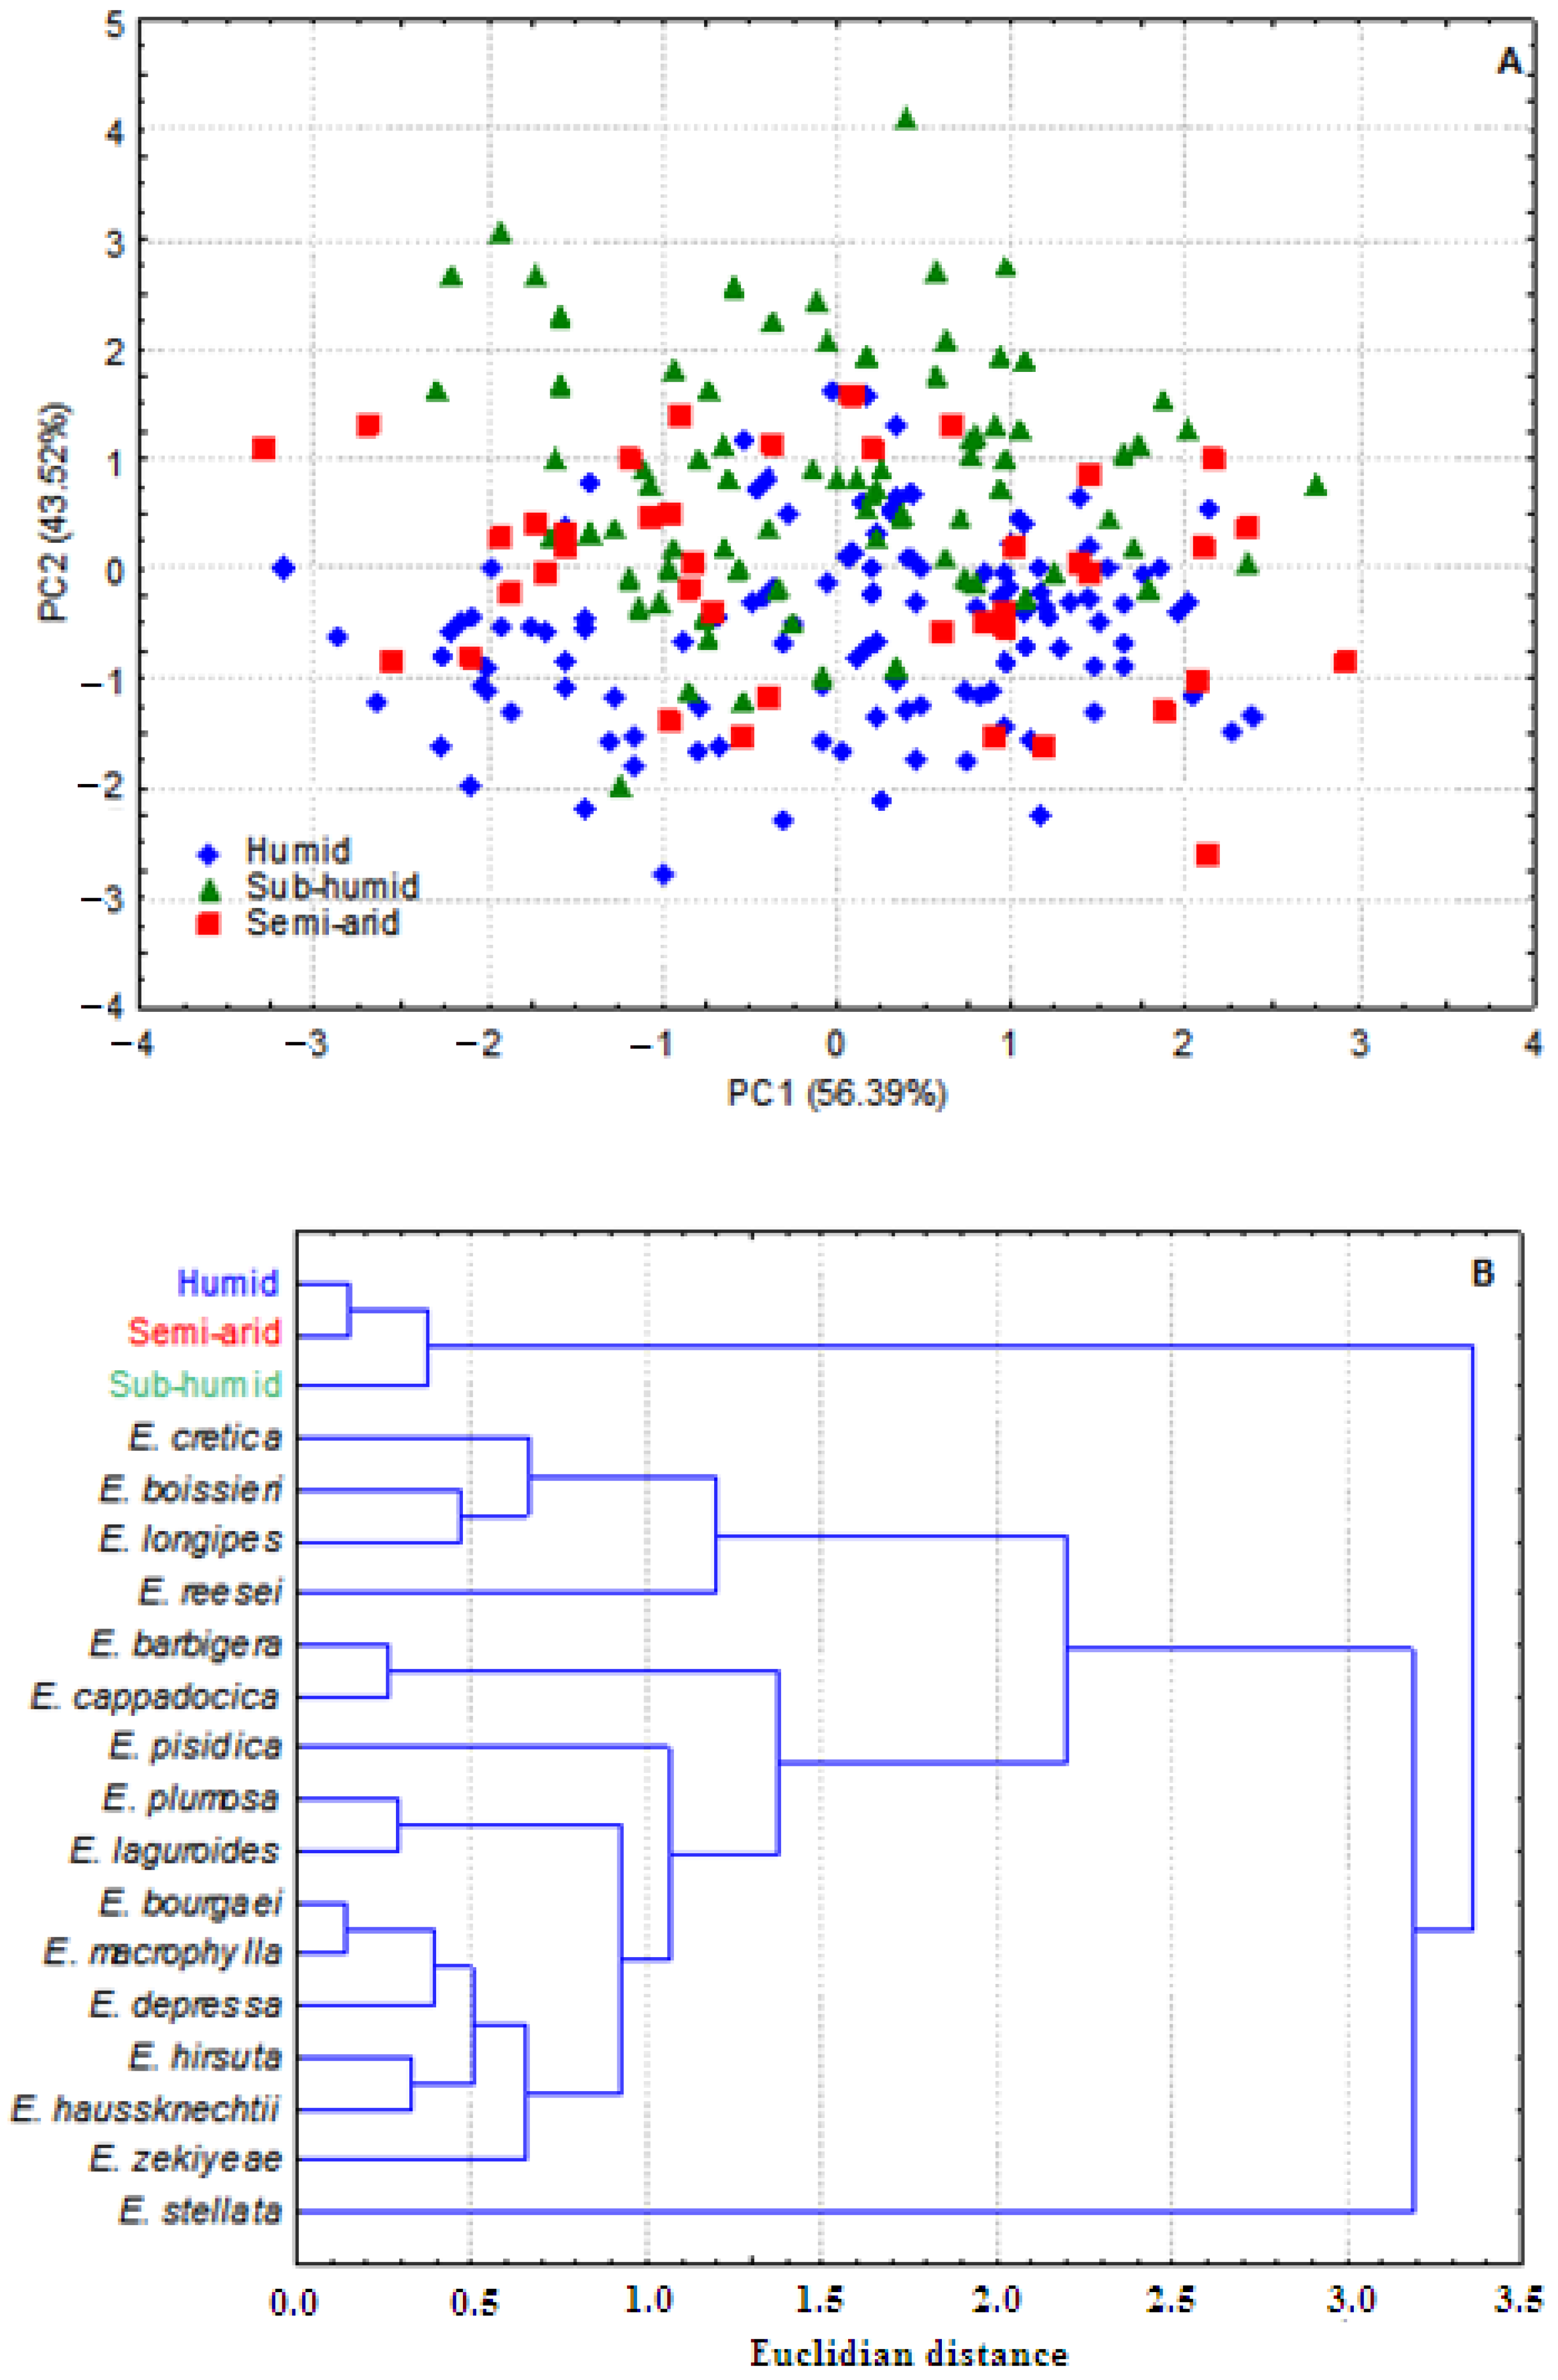
3.2. Pollen Grains Size

The results on pollen grains size are summarized in Table 3 (Characters 45–48). There are significant differences between groups for the polar axis (P), P/E, and PxE, but none were revealed for the equatorial axis (E). On the PCA scatterplot of Figure 2A (see Supplementary Materials S2 for raw data), the three groups appear to be merged in relation to Axis 1, explained by E and P/E. However, in relation to Axis 2, explained by P, it is clear that the “sub-humid” group has most of the highest values of P. Most of the lowest values of P are in the “humid” group, and those of the “semi-arid” group are mostly in the middle position between the two other groups. The dendrogram of Figure 2B shows that the “sub-humid” group is far distant from the other two groups. This topology is incongruent with that based on whole plant morphology (Figure 1B), where the “semi-arid” was the remote group. The cluster of the three groups of E. pinnata studied here appears as an outgroup of the other Ebenus species (Figure 2B).
In addition to this statistical evaluation, our observations showed that the pollen grains of the studied material are prolate (P = c. 1.5 × E), isopolaric, radially symmetrical, tricolpate with a circular outline on the polar view, and they have an elliptical outline on the equatorial view and reticulate ornamentations on their surface (Figure 3G–I) for all the studied material.

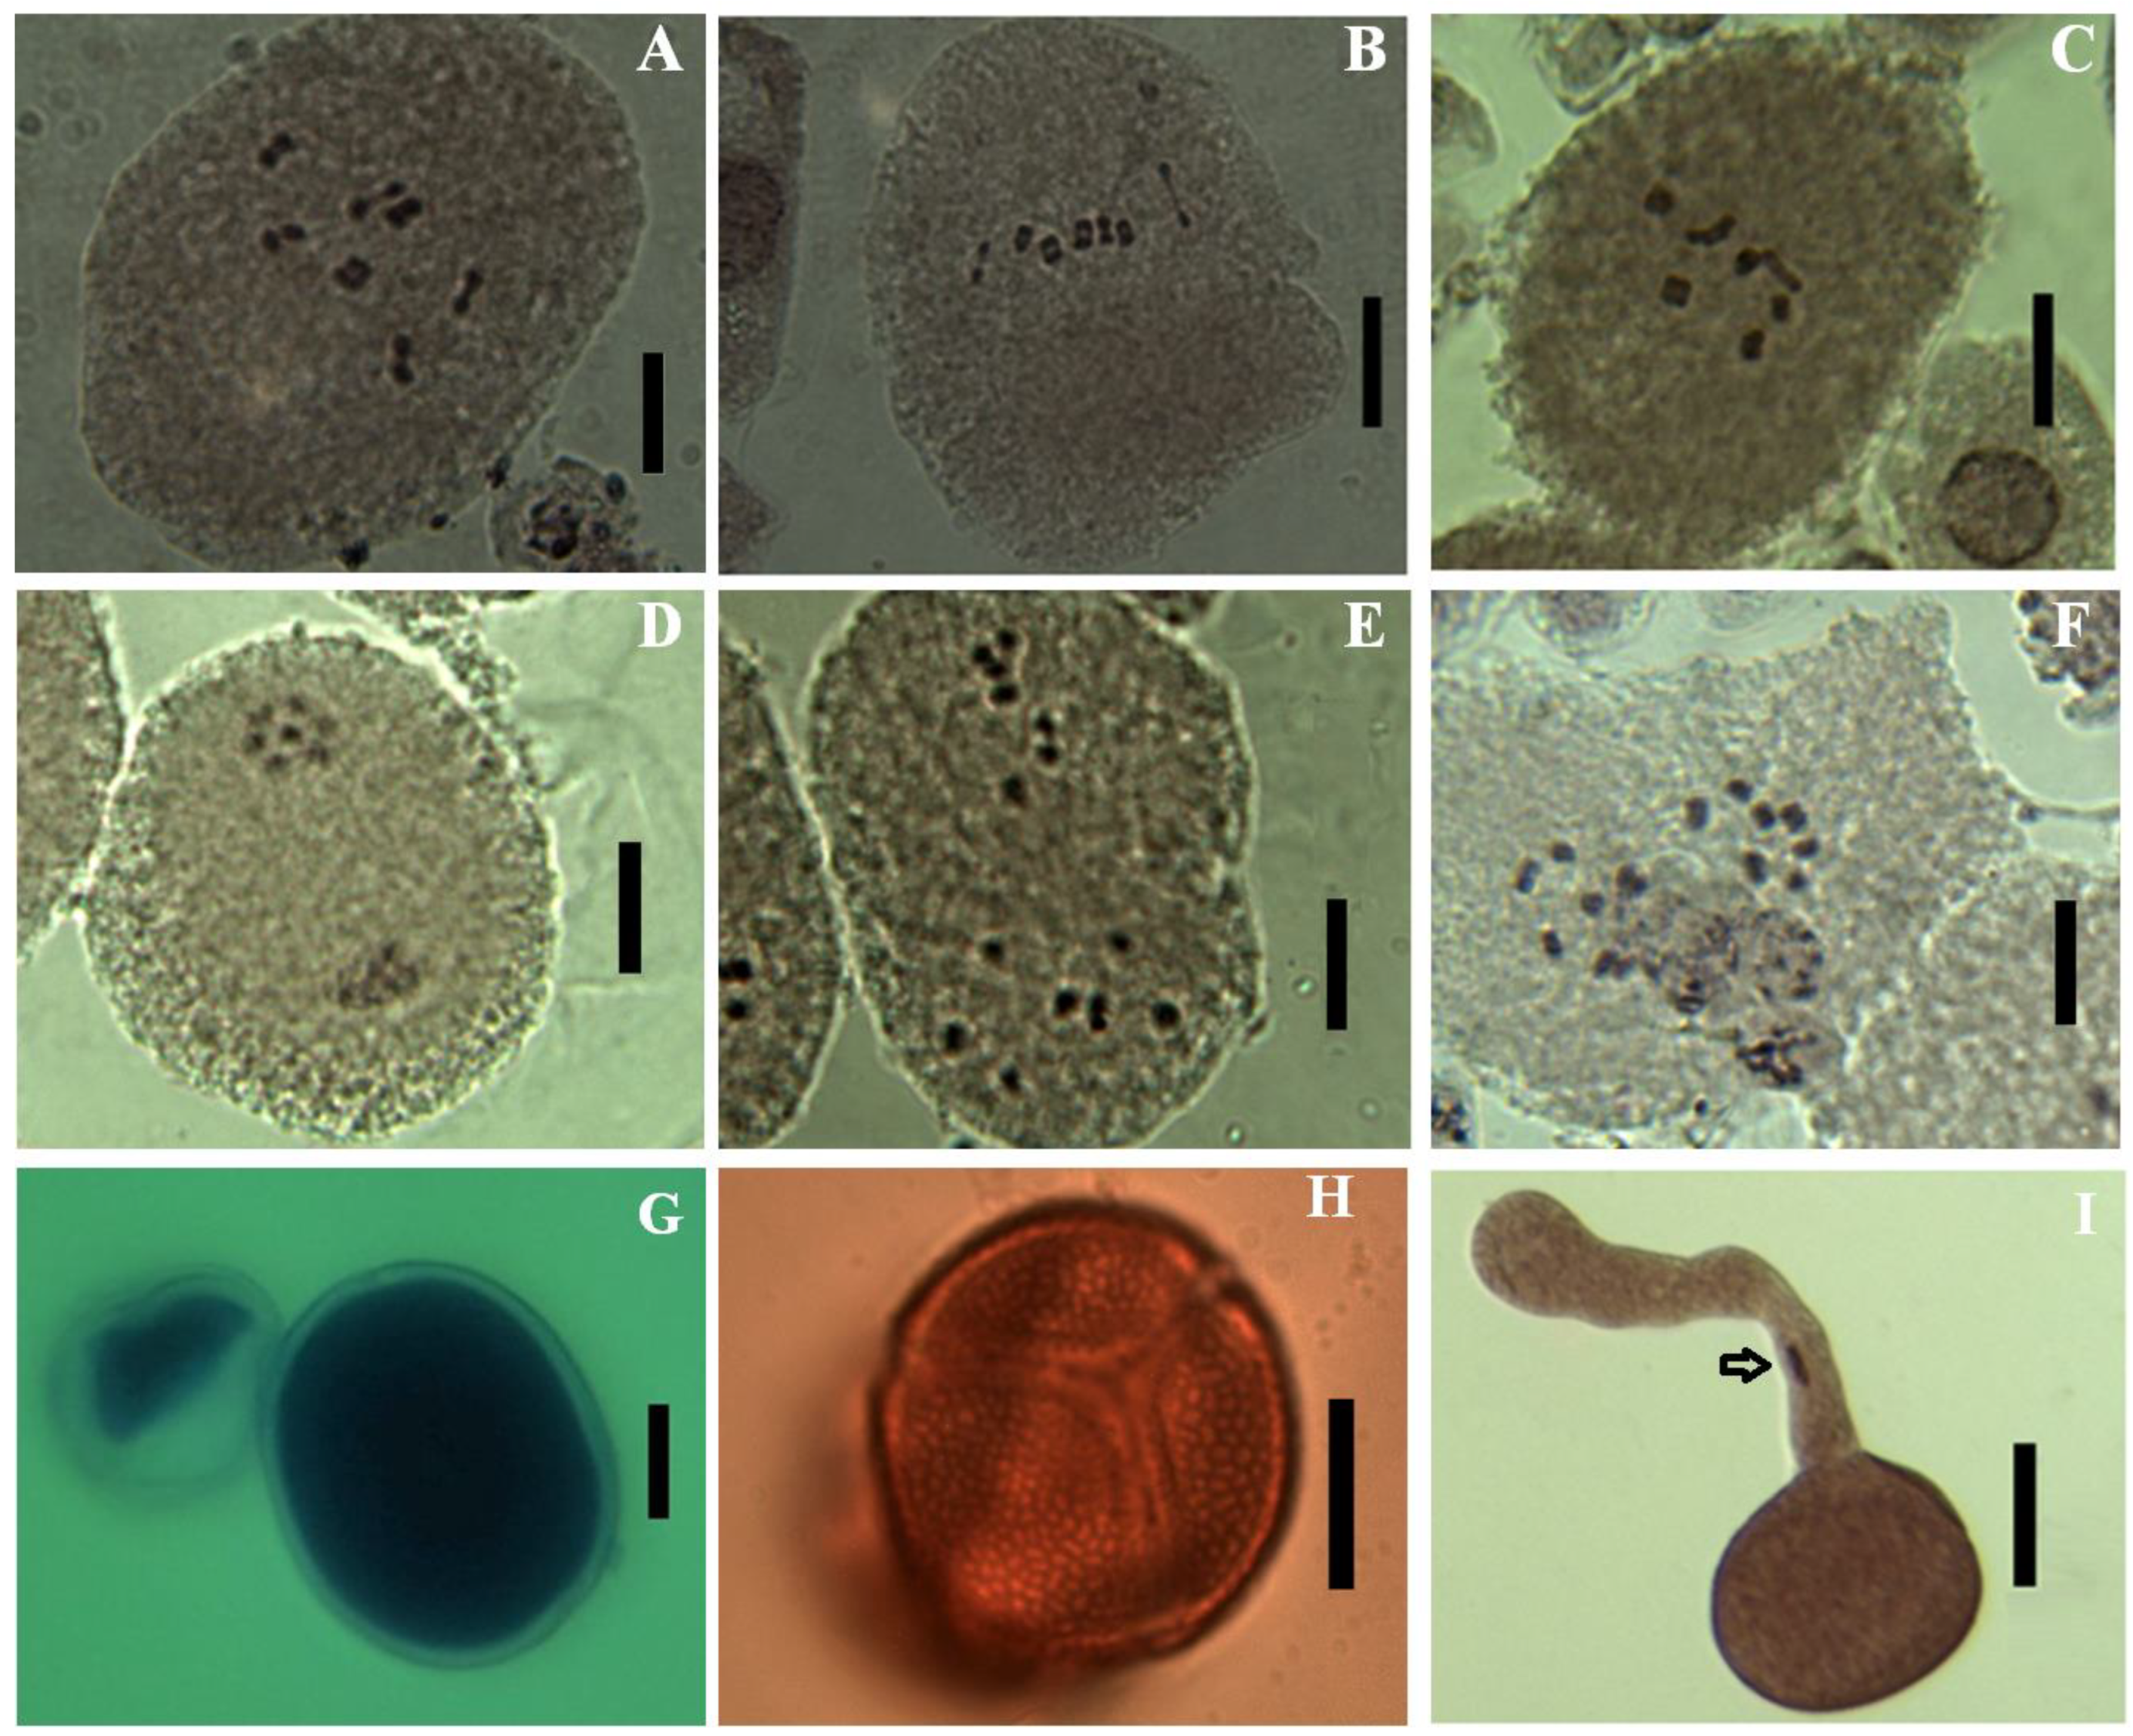
3.3. Chromosome Numbers, Meiotic Abnormalities and Pollen Fertility

For all three groups, seven bivalents in metaphase I and seven chromosomes in metaphase II were repeatedly counted (Figure 3A–F), which clearly confirms a chromosome number of 2n = 2x = 14, with a base number of x = 7. In metaphase I, there are often five bivalents with circular pairing and two with linear pairing. No multivalents were observed, and chromosome segregation at anaphase–telophase I was regular since metaphase II was always with n = 7.
Meiosis abnormalities were often absent, and cytomixis was observed only in very few cases. Pollen fertility rates were high for all the assessed flowers of the three groups (Table 3 and Supplementary Materials S3). Pollen fertility rates were 89.64–98.71% in the “humid” group, 89.01–98.07% in the “sub-humid” and 91.97–97.85% in the “semi-arid” (see Supplementary Materials S3 for pollen fertility raw data). No significant differences were detected among groups for pollen fertility (Table 3, line 49).

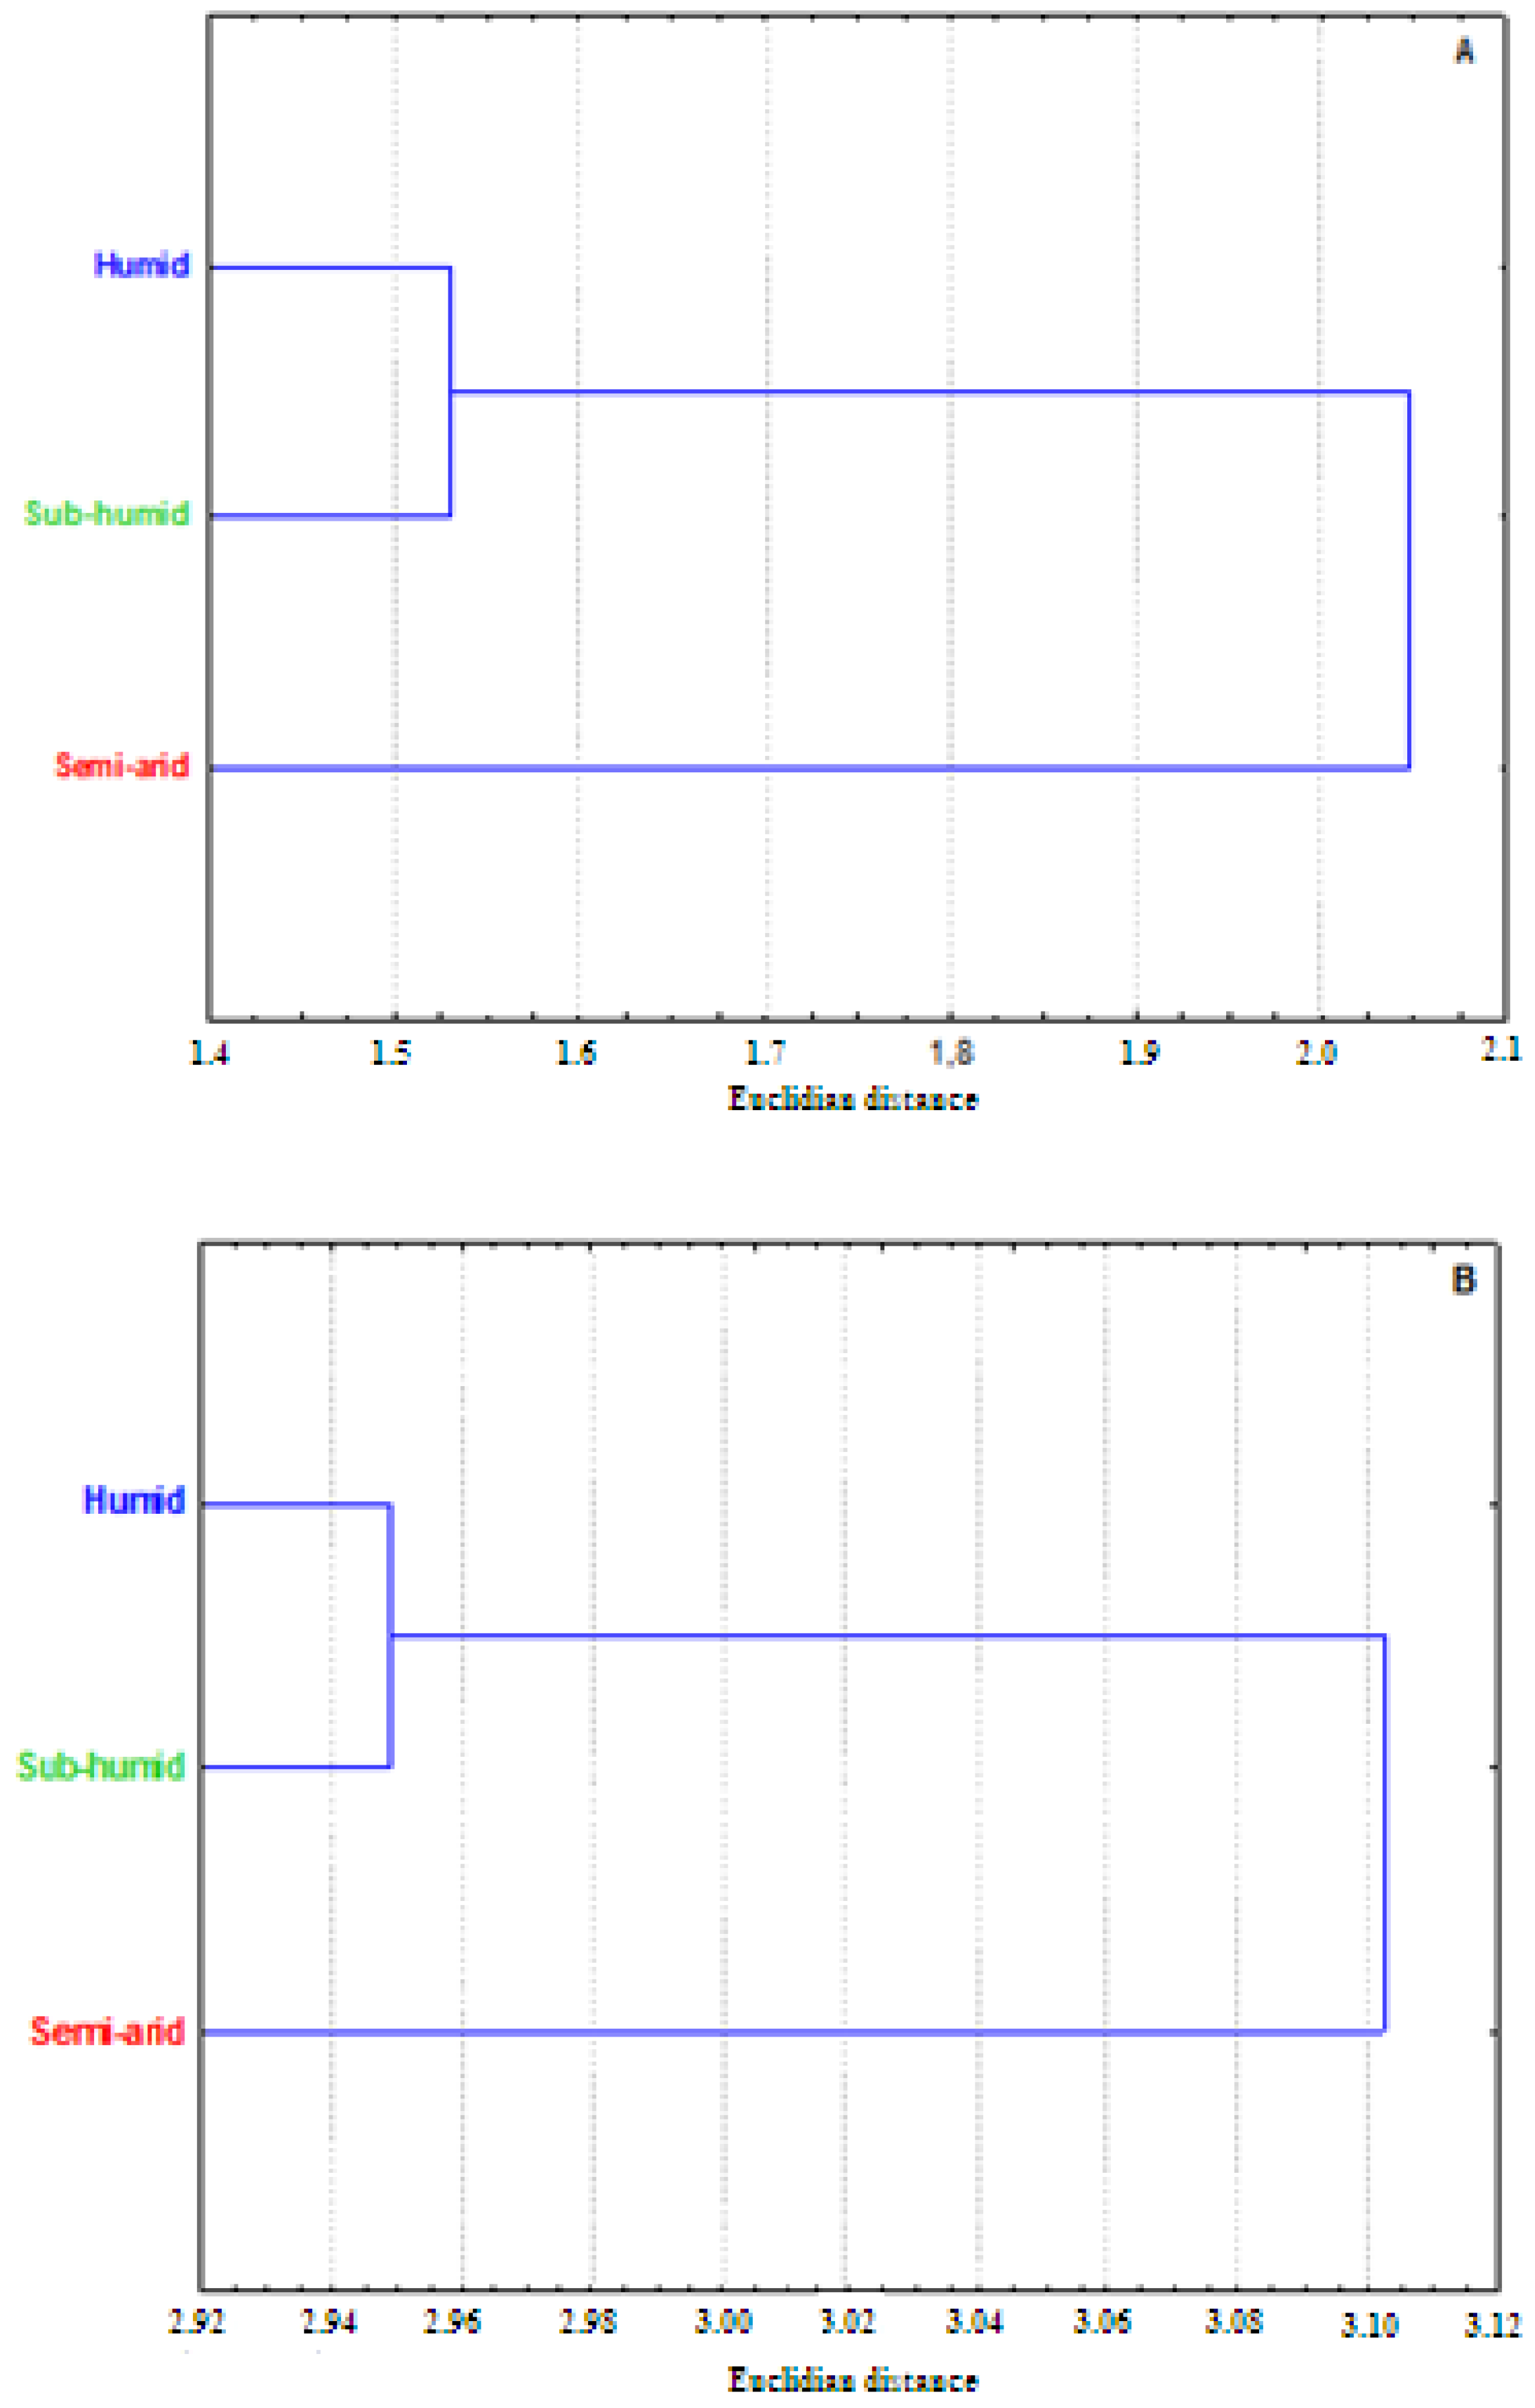
3.4. Antioxidant Activity

The antioxidant capacities of the studied extracts were evaluated by two in vitro methods: the free DPPH radical scavenging test and the reducing power assay. The results are shown in Table 4.
In our results, E. pinnata extract from the semi-arid area (sample 3) had statistically (p < 0.05) the highest value of total phenolic content (56.89 ± 0.46 mg GAE/g dry extract), followed by samples one and two, with similar concentrations. Sample three also expressed the best scavenging activity (95.67 ± 2.02 mg GAE/g dry extract) and reducing power (25.88 ± 0.26 mg GAE/g dry extract), followed by the sub-humid sample and then the humid one. On cluster analysis (Figure 4), the “semi-arid’ sample behaved as a remote group in relation to the closer “humid” and “sub-humid” ones.

3.5. Antibacterial Activity

The antibacterial activity results, displayed in Table 4, revealed that all studied extracts were potentially effective in inhibiting microbial growth. Although statistical analysis showed no significant difference between the three extracts, the semi-arid sample seems more active against the four microorganisms tested, namely Staphylococcus aureus, Methicillin-resistant S. aureus, Vibrio cholera, and Salmonella typhi with inhibition diameters (ID) of 10.50 ± 1.50, 10.33 ± 0.58, 11.75 ± 3.89, and 11.77 ± 1.36 mm, respectively. On the other hand, the sub-humid sample tends to be more efficient against Escherichia coli and Pseudomonas aeruginosa, with an ID of 12.00 ± 1.41 and 11.75 ± 0.35 mm, respectively. The cluster analysis dendrogram based on the data in Table 4 is shown in Figure 4, in which the semi-arid sample appears as a far distant group from the two other closer groups.

4. Discussion

Morphologically, the three ecotypes proved to be well-discriminated (Figure 1). They are significantly different for most characters, including those of the reproductive system (Table 3, Appendix A). The differences are slight but significant. The “semi-arid” ecotype behaved as a remote group in relation to the other close “humid” and “sub-humid” groups. Is this morphological divergence due to phenotypic plasticity alone? Or is it underpinned by a genetic divergence, too, due to differential adaption to ecological niches? The latter hypothesis seems supported by pollen data (see below) and preliminary karyological and molecular results. A thorough molecular genetic analysis is required to clarify the question.
Based on pollen data, the three groups discriminated well, too (Table 3, Appendix A). The “sub-humid” group showed larger pollen size than the two close “humid” and “semi-arid” groups. This situation is well rendered by the cluster analysis in Figure 2B. When compared to other E. species, using literature data, the three groups constituted a separate cluster within which distances between groups are of the same range as those separating other accepted Ebenus species (Figure 2B). This observation supports the hypothesis that the phenotypic differences between the three groups have a genetic basis. Moreover, the pollen grain size (as expressed by PxE) of the three groups is highly correlated (R = 0.89, p = 0.30) with the total haploid chromosome length (THCL) of the three groups (unpublished data). PxE/THCL (µm2/µm) values are, in increasing order, 229.76/23.82 (humid), 236.64/26.98 (semi-arid), and 253.69/28.33. This is not the case in other Ebenus species since their pollen grain sizes are not correlated (R = 0.22, p = 0.72) with their haploid total chromosome lengths (Appendix C). Pollen size is not always positively correlated to genome size across taxa [43]. A pollen grain is not just plant cells with their nuclei, cytoplasm, membranes, and walls. It is, above all, the exine whose structure and thickness reflect evolutionary history and selective adaptation to various aspects of the environment. The variability of the exine structure and thickness seems to be at the origin of the lack of a positive correlation between pollen and genome size across taxa.
The chromosome number for all three ecotypes (Figure 4) is 2n = 2x = 14 (x = 7), the same as already reported from Morocco [13] and Algeria [15,16]. Preliminary results of an underway karyomorphological study show significant differences in chromosome lengths of material from the three climate stages involved here. On the karyogram reported by Gadoum and Hamma [15], there are two pairs of chromosomes with two pairs of large satellites. The four extra chromosomes of the 2n = 18 reported for a Moroccan population by Parra et al. [31] may correspond to those four large satellites mistaken for chromosomes.
According to Siddiqui and Alrumman [44] and the references therein, cytomixis is a phenomenon induced by both genetic and environmental factors; it occurs in mutants, hybrids, aneuploids, and stressed plants (heat, cold, drought, parasites, and pollution), leading to reduced pollen fertility. In our case, very scarce cytomixis and associated abnormalities were encountered while screening meiosis preparations, which is in accordance with the high pollen fertility rates assessed (89.01–98.71%) (Table 3 and Appendix A). From this perspective, it can be drawn that the local E. pinnata populations are in perfect equilibrium with their environment, without any aberrations occurring due to mutation, aneuploidy, or hybridization between diverging genotypes.
In the present study, the antioxidant and antimicrobial activities of Ebenus pinnata ethanol extracts revealed an interesting potential that could be used as an alternative medicinal source. Reports concerning E. pinnata phytochemicals and biological activities are very scarce. In the study by Abreu et al. [33], the measurement of the antioxidant activity of methanol extract from E. pinnata aerial parts collected from Tunisia has revealed an interesting potential. The authors linked this activity specifically to the presence of four phenolic compounds: ombuoside, kaempferol-3-O-rutinoside, rutin, and catechin, as evoked in the introduction. In another study from Algeria in relation to antioxidant parameters of methanol extracts of nine species, Nouioua and Gaamoune [45] have reported that E. pinnata extracts show a relatively high DPPH radical scavenging activity (IC50 of 12.25 ± 2.80 µg/mL) compared to eight other taxa from Eastern Algeria. They have also reported that this plant contains 8.57 ± 0.16 mg GAE/g dry extract of TPC. The latter performances are very low compared with those obtained in the present study (Table 4).
The antioxidant potency of the semi-arid extract sample was found to be stronger when compared with the two other samples (humid and sub-humid) for both assays. From these results, it is assumed that its high level of phenolics might have contributed to the observed antioxidant abilities. The present findings are in agreement with other studies reporting a high correlation between total phenolics and antioxidant activity [46]. However, the absence of statistically significant differences in the total phenolic content values of humid and sub-humid samples, combined with relatively high differences in DPPH and RP values between these samples, could be explained by the presence of other non-phenolic compounds, in particular carotenoids and terpenoids, which contribute to the antioxidant properties of the extracts. In addition, due to differences in the environmental growing conditions of these plants, the types of components and their proportions can vary considerably, resulting in a variation in the contribution of individual and synergistic activities and, consequently, a variation in biological properties [47].
In light of the antimicrobial results, it was observed that all extracts showed comparable power at the analyzed concentration. The main causes of the small differences observed in these results were the various bio-contents of the analyzed samples that were harvested from different bioclimatic stages (humid, sub-humid, and semi-arid). However, sometimes, the same species could have different bioactive values since many factors may be responsible for these changes, such as harvesting period, water availability, environmental factors (climate and altitude), and technological factors [48,49]. Indeed, Kabtni et al. [50] have investigated the influence of climate variation on the phenolic composition and antioxidant activity of Medicago minima populations selected from different provenances in Tunisia. They have concluded that the highest phenolic contents are observed in populations from the semi-arid area with a BSK climate and an altitude higher than 550 m, which agrees with the findings of this study. The accumulation of a higher level of phenolic compounds and the expression of the best antioxidant activity for E. pinnata grown under a semi-arid climate characterized by high temperature and low precipitation can be related to hydric and thermal stresses [51,52].

5. Conclusions

The three plant groups from the humid, sub-humid, and semi-arid climate stages are similar regarding stem and leaf color and hairiness as well as flower color. However, morphometrics revealed slight but significant differences for most quantitative morphological traits, with the semi-arid being far different from the two other closer humid and sub-humid groups. Pollen fertility rates were high for all the studied material (94.04 ± 2.64–95.01 ± 2.02%). All groups showed prolate, isopolaric, and tricolpate pollen grains with reticulate ornamentations. Their polar and equatorial axes were 17.95 ± 1.10–19.47 ± 1.27 µm and 12.80 ± 1.18–13.03 ± 0.99 µm, respectively, with the biggest pollen grains found in the sub-humid group. TPC, DFFH, and RP values (mg GAE/g EXT) were 50.79 ± 0.51–56.89 ± 0.46, 71.18 ± 2.24–95.67 ± 2.02, and 11.09 ± 1.24–25.88 ± 0.26, with the highest values found in the semi-arid group. The extracts showed activity against all the six bacterial strains tested; the diameters of activity zones ranged from 9.25 ± 1.06 mm (semi-arid extract vs. Pseudomonas aeruginosa) to 12.00 ± 1.41 mm (sub-humid extract vs. Escherichia coli). The same chromosome number of 2n = 2x = 14 was repeatedly counted. Pollen grain size seems positively correlated to karyotype length (genome size). In sum, the climate seems to exert a significant impact on the biology of the plant.
Experimental cultures and molecular analysis are required to check the genetic basis hypothesis of the phenotypic heterogeneity of the groups. It would be interesting to apply the present study to other species.

Supplementary Materials

The following supporting information can be downloaded at: https://www.mdpi.com/article/10.3390/horticulturae9080879/s1, Supplementary Materials S1: Whole plant morphology raw data; Supplementary Materials S2: Pollen grains size raw data; Supplementary Materials S3: Pollen fertility rates raw data.

Author Contributions

Conceptualization: M.S. and T.Z.; Plant material collect: M.S. and T.Z.; Morphometrics scoring: T.Z.; Meiosis and pollen grains analysis: T.Z. and H.B.; Antioxidant and antibacterial activities analysis: A.C. and T.Z.; Statistic evaluation: M.S.; Results interpretations, M.S., T.Z., A.C. and H.B., Original draft preparation: M.S. and A.C. (for antioxidant and antibacterial activities); Supervision: M.S.; Final version preparation M.S. and T.Z. All authors have read and agreed to the published version of the manuscript.

Funding

The study was carried out in the framework of research activities of the Laboratory of Ecology and Environment (University of Bejaia, Algeria) supported by Direction Générale de la Recherche Scientifique et du Développement Technologique (DGRSDT), Ministry of High Education and Scientific Research (MESRS), Republic of Algeria.

Data Availability Statement

The data used in this research are provided as Supplementary files attached to the article.

Acknowledgments

We would like to warmly thank all the technical staffs of the Laboratory of Ecology and Environment and the Laboratory of Microbial Ecology for their full availability during the preparation of this research.

Conflicts of Interest

The authors declare no conflict of interest.

Appendix A

Detailed morphological comparison of Ebenus pinnata plants from different climate stages.

Appendix B

Detailed whole plant morphology PCA results.

Appendix C

Pollen grains size vs. karyotype length.

References

  1. Aytaç, Z. The genus Ebenus L. (Leguminosae/Fabaceae) in Turkey. Karaca Arbor. Mag. 2000, 5, 145–171. [Google Scholar]
  2. Aytaç, Z.; Yildirim, H. Ebenus zekiyeae (Fabaceae), a new species from Turkey. Ann. Bot. Fenn. 2018, 55, 25–29. [Google Scholar] [CrossRef]
  3. Aytaç, Z.; Suludere, Z.; Pınar, M. Examination of the leaflets hairs and stoma structures with the electron microscope of the genus Ebenus L. (Leguminosae) in Turkey. Biodicon 2015, 8, 32–50. [Google Scholar]
  4. Boissier, E. Flora Orientalis: Save Enumeratio Plantarum in Oriente a Græcia et Ægypto ad Indfiæ Fines Hucusque Observatarum; NCSU Libraries: Genevae, Switzerland, 1872; Volume 2. [Google Scholar]
  5. Dobignard, A.; Chatelain, C. Index Synonymique de la Flore D’afrique du Nord. Dicotyledoneae: Fabaceae-Nymphaeaceae; Conservatoire et Jardin botaniques de la ville de Genève et ECWP: Genève, Switzerland, 2012; Volume 4, 431p. [Google Scholar]
  6. Huber-Morath, A. 1970: Ebenus L. In Flora of Turkey and the East Aegean Islands; Davis, P.H., Ed.; Edinburgh University Press: Edinburgh, UK; Volume 3, pp. 590–596.
  7. Amirahmadi, A.; Kazampour-Osaloo, S.; Moein, F.; Kaveh, A.; Maassoumi, A.A. Molecular systematics of the tribe Hedysareae (Fabaceae) based on nrDNA ITS and plastid trnL-F and matK sequences. Plant Syst. Evol. 2014, 300, 729–747. [Google Scholar] [CrossRef]
  8. Kaveh, A.; Kazampour-Osaloo, S. Estimation of Ebenus species divergence time based on nrDNA ITS and matK cpDNA sequences. In Proceedings of the 4th National Congress of Plants, Tehran, Iran, 12–13 May 2015. [Google Scholar]
  9. Ghanavati, F.; Amirabadizadeh, H. Pollen grain morphology in Iranian Hedysareae (Fabaceae). Crop Breed. J. 2012, 2, 25–33. [Google Scholar] [CrossRef]
  10. Aytaç, Z.; Ünal, F.; Pinar, M.N. Morphological, palynological, and cytotaxonomical study of Ebenus longipes Boiss. & Bal. and E. argentea Siehe ex Bornm. (Leguminosae) from Turkey. Isr. J. Plant Sci. 2000, 48, 321–326. [Google Scholar] [CrossRef]
  11. Pinar, N.M.; Vural, C.; Zytac, Z. Pollen morphology of Ebenus L. (Leguminosae: Subfamily Papilionoideae) in Turkey. Pak. J. Bot. 2000, 32, 303–310. [Google Scholar]
  12. Halbritter, H.; Auer, W.; Igersheim, A.; Ebenus cretica. In PalDat-A Palynological Database. 2020. Available online: https://www.paldat.org/pub/Ebenus_cretica/305777;jsessionid=B9B8A714C47DE9C0CB28F0595C4D0398 (accessed on 25 January 2021).
  13. Molero, J.; Montserrat-Marti, J.M. Números cromosomáticos de plantas marroquíes. Collect. Bot. 1986, 16, 351–354. [Google Scholar]
  14. Aksoy, H.; Ünal, F.; Aytaç, Z. Karyological study on four endemic Ebenus L. taxa (Leguminosae) in Turkey. Caryologia 2001, 54, 307–311. [Google Scholar] [CrossRef]
  15. Gadoum, N.; Hamma, A. Etude Cytogénétique de L’espèce Ebenus pinnata Aiton (Fabaceae) du Golfe de Béjaïa et de la Vallée de la Soummam. Master’s Thesis, Université Abderrahmane Mira de Bejaia, Algérie, North Africa, 2016; 58p. Available online: http://univ-bejaia.dz/dspace/123456789/10254 (accessed on 8 July 2023).
  16. Hadawat, A.K.; Madani, S. Etude Cytogénétique de Quelques Populations d’Ebenus pinnata Ait. (Fabacées) de la Région de Béjaïa. Master’s Thesis, Université Abderrahmane Mira de Bejaia, Algérie, North Africa, 2022; 49p. Available online: http://univ-bejaia.dz/dspace/123456789/21618 (accessed on 8 July 2023).
  17. Uyar, Z.; Böke, N.; Türkay, E.; Koz, Ö.; Yas, A.I.; Kırmızıgül, S. Flavonoid glycosides and methylinositol from Ebenus haussknechtii. Nat. Prod. Res. 2006, 20, 999–1007. [Google Scholar] [CrossRef]
  18. Özdemir, E.; Alpınar, K. An ethnobotanical survey of medicinal plants in western part of central Taurus Mountains: Aladaglar (Nigde–Turkey). J. Ethnopharmacol. 2015, 166, 53–65. [Google Scholar] [CrossRef] [PubMed]
  19. Kültür, S.; Gürdal, B.; Sari, A.; Melikoğlu, G. Traditional herbal remedies used in kidney diseases in Turkey: An overview. Turk. J. Bot. 2021, 45, 269–287. [Google Scholar] [CrossRef]
  20. Ceylan, R.; Katani, J.; Zengina, G.; Mati, S.; Aktumsek, A.; Boroja, T.; Stanic, S.; Vladimir Mihailovic, V.; Guler, G.O.; Boga, M.; et al. Chemical and biological fingerprints of two Fabaceae species (Cytisopsis dorycniifolia and Ebenus hirsuta): Are they novel sources of natural agents for pharmaceutical and food formulations? Ind. Crops Prod. 2016, 84, 254–262. [Google Scholar] [CrossRef]
  21. Bektas, E.; Kaltalioglu, K.; Sahin, H.; Turkmen, Z.; Kandemir, A. Analysis of phenolic compounds, antioxidant and antimicrobial properties of some endemic medicinal plants. Int. J. Second. Metab. 2018, 5, 75–86. [Google Scholar] [CrossRef]
  22. İmir, N.; Aydemir, E.; Şimşek, E.; Göktürk, R.; Yesilada, E.; Fişkin, K. Cytotoxic and immunomodulatory effects of Ebenus boissieri Barbey on breast cancer cells. Genet. Mol. Res. 2016, 15, 1–11. [Google Scholar] [CrossRef] [PubMed]
  23. Simsek, E.; Imir, N.; Aydemir, E.R.; Gokturk, R.S.; Yesilada, E.; Fiskin, K. Caspase-mediated apoptotic effects of Ebenus boissieri Barbey extracts on human cervical cancer Cell Line HeLa. Pharmacogn. Mag. 2017, 13, 254–259. [Google Scholar] [CrossRef] [Green Version]
  24. Aydemir, E.A.; Simsek, E.; Imir, N.; Göktürk, R.S.; Yesilada, E.; Fiskin, K. Cytotoxic and apoptotic effects of Ebenus boissieri Barbey on human lung cancer Cell Line A549. Pharmacogn. Mag. 2015, 11 (Suppl. 1), S37. [Google Scholar] [CrossRef] [Green Version]
  25. Kounadi, S.; Aligiannis, N.; Pongratz, I.; Lelovas, P.; Ismini, D.; Skaltsounis, A. Estrogenic activity of the methanolic extract of Ebenus cretica L. Planta Medica 2011, 77, PM168. [Google Scholar] [CrossRef]
  26. Dontas, I.; Kounadi, S.; Aligiannis, N.; Galanos, A.; Skaltsounis, A.; Lelovas, P. Plant extract administration and mild daily exercise increase bone density of ovariectomized rats. In Abstracts of 14th FELASA congress 2019, PC41, p. 157. Lab. Anim. 2019, 53, 28–203. [Google Scholar]
  27. Mitrocotsa, D.; Skaltsounis, A.-L.S.; Harvala, C.; Tillequin, F. Flavonoid and terpene glycosides from European Ebenus species. Biochem. Syst. Ecol. 1999, 27, 305–307. [Google Scholar] [CrossRef]
  28. Khodaparast, A.; Sayyah, M.; Sardari, S. Anticonvulsant activity of hydroalcoholic extract and aqueous fraction of Ebenus stellata in mice. Iran. J. Basic Med. Sci. 2012, 15, 811–819. [Google Scholar]
  29. Zameer, S.; Ali, S.; Gulmeena Tareen, R.B. Identification of volatile constituents and antimicrobial activity of Ebenus stellata. Gu J. Phytosciences 2022, 2, 214–222. [Google Scholar]
  30. Zemouri, T.; Chikhoune, A.; Benmouhoub, H.; Sahnoune, M. Taxonomic Comparison, Antioxidant and Antibacterial Activities of Three Ecotypes of Ebenus pinnata Ait. (Fabaceae) from Algeria. Preprints 2023, 2023071339. [Google Scholar] [CrossRef]
  31. Parra, R.; Valdés, B.; Gordillo, I.; Venanzi, R. Meditenanean chromosome number reports. Flora Mediterr. 1999, 9, 323–387. [Google Scholar]
  32. Braham, H.; Ben Jannet, H.; Castedo, L.; Mighri, Z. Isolation, for the first time, of a flavonoid glycoside and the (±)-catechin from the aerial parts of Ebenus pinnata. J. De La Société Chim. De Tunis. 2004, 6, 153–160. [Google Scholar]
  33. Abreu, P.M.; Braham, H.; Ben Jannet, H.; Mighri, Z.; Matthew, S. Antioxidant compounds from Ebenus pinnata. Fitoterapia 2007, 78, 32–34. [Google Scholar] [CrossRef]
  34. Mebarki, A. Hydrologie des Bassins de l’Est Algérien: Ressources en Eau, Aménagement et Environnement. Ph.D. Thesis, Université Mentouri de Constantine, Algérie, North Africa, 2005; 360p. [Google Scholar]
  35. Mertens, T.R.; Hamnersmith, R.L. Genetic Laboratory Investigations; Eleventh, Ed.; Prentice Hall Inc.: Upper Saddle River, NJ, USA, 1998. [Google Scholar]
  36. Herzi, N.; Bouajila, J.; Camy, S.; Romdhane, M.; Condoret, J.S. Comparison of different methods for extraction from Tetraclinis articulata: Yield, chemical composition and antioxidant activity. Food Chem. 2013, 141, 3537–3545. [Google Scholar] [CrossRef] [Green Version]
  37. Dyer, A.F. The use of lactopropionic orcein in rapid squash. Methods for chromosome preparations. Stain. Technol. 1963, 38, 85–90. [Google Scholar] [CrossRef]
  38. Singleton, V.L.; Orthofer, R.; Lamuela-Raventos, R.M. Analysis of total phenols and other oxidation substrates and antioxidants by means of Folin-Ciocalteu RGAEent. Methods Enzymol. 1999, 299, 152–178. [Google Scholar] [CrossRef]
  39. Blois, M.S. Antioxidant determinations by the use of a stable free radical. Nature 1958, 181, 1199–1200. [Google Scholar] [CrossRef]
  40. Oyaizu, M. Studies on products of browning reaction: Antioxidative activities of products of browning reaction prepared from glucosamine. Jpn. J. Nutr. Diet. 1986, 44, 307–315. [Google Scholar] [CrossRef] [Green Version]
  41. NCCLS (National Committee for Clinical Laboratory Standards). Performance Standard for Antimicrobial Disc Susceptibility Tests; Approved Standard; Villanova, P.A., Ed.; Publication M2-A5; National Committee for Clinical Laboratory Standards: Wayne, PA, USA, 1993. [Google Scholar]
  42. Statistica, version 8.0. Data analysis software system. Statsof, Inc.: Tulsa, OK, USA, 2007.
  43. Knight, C.A.; Clancy, R.B.; Götzenberger, L.; Dann, L.; Beaulieu, J.M. On the relationship between pollen size and genome size. J. Bot. 2010, 2010, 612017. [Google Scholar] [CrossRef] [Green Version]
  44. Siddiqui, S.; Alrumman, S.A. Methomyl, imbraclaobrid and clethodim induced cytomixis and syncytes behaviors in PMCs of Pisum sativum L: Causes and outcomes. Saudi J. Biol. Sci. 2022, 29, 103390. [Google Scholar] [CrossRef] [PubMed]
  45. Nouioua, W.; Gaamoune, S. Antioxidant, antimicrobial and anti-inflammatory activities development of methanol extracts of some species growing in the massif of Boutaleb, Setif, Algeria. Int. J. Pharm. Nat. Med. 2018, 6, 15–20. [Google Scholar]
  46. Zhang, Y.; Wang, Z. Phenolic composition and antioxidant activities of two Phlomis species: A correlation study. Comptes Rendus Biol. 2009, 332, 816–826. [Google Scholar] [CrossRef]
  47. Martins, N.; Barros, L.; Ferreira, I.C. In vivo antioxidant activity of phenolic compounds: Facts and gaps. Trends Food Sci. 2016, 48, 1–12. [Google Scholar] [CrossRef] [Green Version]
  48. Ahuja, I.; de Vos, R.C.; Bones, A.M.; Hall, R.D. Plant molecular stress responses face climate change. Trends Plant Sci. 2010, 15, 664–674. [Google Scholar] [CrossRef]
  49. Rabeta, M.S.; Nur Faraniza, R. Total phenolic content and ferric reducing antioxidant power of the leaves and fruits of Garcinia atrovirdis and Cynometra cauliflora. Int. Food Res. J. 2013, 20, 1691–1696. [Google Scholar]
  50. Kabtni, S.; Sdouga, D.; Bettaib Rebey, I.; Save, M.; Trifi-Farah, N.; Fauconnier, M.L.; Marghali, S. Influence of climate variation on phenolic composition and antioxidant capacity of Medicago minima populations. Sci. Rep. 2020, 10, 8293. [Google Scholar] [CrossRef]
  51. De Abreu, I.N.; Mazzafera, P. Effect of water and temperature stress on the content of active constituents of Hypericum brasiliense Choisy. Plant Physiol. Biochem. 2005, 43, 241–248. [Google Scholar] [CrossRef] [PubMed]
  52. Al-Huqail, A.; El-Dakak, R.M.; Sanad, M.N.; Badr, R.H.; Ibrahim, M.M.; Soliman, D.; Khan, F. Effects of climate temperature and water stress on plant growth and accumulation of antioxidant compounds in sweet basil (Ocimum basilicum L.) leafy vegetable. Scientifica 2020, 2020, 3808909. [Google Scholar] [CrossRef] [PubMed] [Green Version]
Figure 1. Multivariate analysis of morphological characters of three Ebenus pinnata ecotypes. (A): Principal Components Analysis based on 44 quantitative traits measured on 126 fresh plants (see Table 1, Table 2 and Table 3 for more details). (B). Cluster Analysis of centered mean values of the 44 quantitative traits using the unweighted pair group method with arithmetic mean (UPGMA).
Horticulturae 09 00879 g001
Figure 2. Multivariate analysis of pollen size. (A). Principal Components Analysis based on three pollen grains traits (polar axis P, equatorial axis E and their rate P/E) measured for the three Ebenus pinnata ecotypes. Axis 1 is explained by E and P/E with respectively R = 0.98 and R = −0.78; Axis 2 is explained by P with R = 0.94. (B). Cluster Analysis based on the centered mean values of three pollen traits (P, E and P/E).
Horticulturae 09 00879 g002
Figure 3. Haploid phase chromosomes and pollen grains in Ebenus pinnata. (AC): Metaphase I of the “humid”, “sub-humid”, and “semi-arid” groups respectively (7 bivalents); (DF): Metaphase II in the three groups respectively (7 chromosomes); (G): Cotton blue-stained fertile pollen grain (on the right) and sterile pollen grain (on the left); (H): Polar view of a lactopropionic orcein stained pollen grain showing three symmetrical colpi and reticulate ornamentations; (I): Lactopropionic orcein stained pollen grain with its pollen tube and nucleus (arrow). The scale bar corresponds to 10 µm.
Horticulturae 09 00879 g003
Figure 4. Cluster Analysis of antioxidant and antibacterial activities of three ecotypes of Ebenus pinnata from different climate stages. (A). Antioxidant activity; (B). Antibacterial activity. Data source in Table 4.
Horticulturae 09 00879 g004
Table 1. Characteristics, sampling dates, sample sizes and codes of the populations used in multivariate morphological study. H: Humid; SH: Sub-humid SA: Semi-arid.
Climate stageHumidSub-humidSemi-arid
Locality nameKherrata SemaounBoudjelil
Population CodeHSHSA
GPS Localization36° 31′33.3″ N
5° 16′49.73″
36° 37′27.16″ N
4° 49′7.20″ E
36° 22′11″ N
4° 26′48.30″ E
Altitude/
Exposure
612 m/East195 m/West270 m/East
SoilRed clayBrown clayWhite ground
Plant formationRoad bankGarrigue, GrasslandGrassland, Sparse garrigue
Rainfall 1 (mm)800–1000 600–800600–800
Number of plants445527
Sampling date/
Plant codes
08/06/2015/H01-H20
03/06/2015/H21-H35
15/07/2015/H236-H44
20/05/2015/SH01-SH15
09/06/2015/SH16-SH25
09/06/2015/SH26- SH34
20/05/2015/SH35-SH47
28/06/2016 SH48-SH55
13/05/2015/SA01-SA13
07/06/2015/SA14-SA27
1 Mebarki [34].
Table 2. Morphological characters used in the morphological multivariate study.
NoCodingCharacter NameType 1Unit
1DBPDiameter at the base of the plantCcm
2LLSLength of the longest stemCcm
3NSNumber of stemsDStems
4DLSDiameter of the longest stem Cmm
5LINLength of the third internode Ccm
6NINumber of inflorescences (racemes)DRaceme
7LS1Length of stipulesCmm
8WSWidth of stipulesCmm
9LLLength of the leaf (3rd node)Ccm
10WLWidth of the leaf (3rd node)Ccm
11LPLength of the petioleCcm
12NPLNumber of pairs of leaflets (3rd node)DPairs
13LNLPLowest number of leaflets pairs DPairs
14HNLPHighest number of leaflets pairsDPairs
15LLBLength of the leaflet bladeCcm
16WLBWidth of the leaflet bladeCmm
17LIPLength of the inflorescence peduncle (3rd node)Ccm
18HIHeight of the inflorescenceCcm
19DIDiameter of the inflorescenceCcm
20LNFLowest number of flowersDFlower
21HNFHighest number of flowersDFlower
22LFBLength of the flower bractCmm
23WFBWidth of the flower bractCmm
24LC1Length of the flower calyxCmm
25LC2Length of the corollaCmm
26TLWTotal length of the wingCmm
27WWBWidth of the wing bladeCmm
28WBWWidth at the base of the wingCmm
29WMWWidth at the middle of the wingCmm
30TWKTotal width of the keelCmm
31LWPKLength of the widest part of the keelCmm
32TLKTotal length of the keelCmm
33TLSTotal length of the standardCmm
34LSBLength of the standard bladeCmm
35WSBWidth of the standard bladeCmm
36LSPLength of the standard ‘petiolule’Cmm
37LCMLength of the calyx at maturityCmm
38LCTLength of the calyx tube at maturity Cmm
39LHCTLength of hairs at the base of the calyx teethCmm
40LPMLength of the pod at maturityCmm
41WPMWidth of the pod at maturityCmm
42LS2Length of the seedCmm
43WSWidth of the seedCmm
44LRLength of the radicleCmm
Extra variables (Not included in multivariate analyses)
45PPolar diameter of pollen grainsCµm
46EEquatorial diameter of pollen grainsCµm
47P/ERate of P and E diameters of pollen grainsC
48PxEProduct of P * E.Cµm2
49PFPollen fertility rateC%
1 C: Continuous, D: Discrete.
Table 3. Morphological comparison of Ebenus pinnata plants from different climate stages. Values are expressed as Mean ± SD (See Appendix A for more details). Explanatory R values of PC1 and PC2 of Figure 1 are shown in bold. Mean values with different capital letters are statistically different (Unequal N HSD Test, α = 0.05), with A < B < C. Lowercase letters a and b compare the polar (P) against the equatorial (E) axis of pollen grains (t-Test for dependent samples, α < 0.001); with a < b. See abbreviation full names at the foot of the table 1.
NoTrait
Code
R1R2HumidSub-HumidSemi-Arid
1DBP0.49−0.240.73 ± 0.19 B0.73 ± 0.33 B0.55 ± 0.25 A
2LLS0.800.1068.22 ± 18.38 B89.28 ± 28.93 C 44.41 ± 19.79 A
3NS0.23−0.609.55 ± 6.52 B4.65 ± 2.47 A3.11 ± 2.41 A
4DLS0.47−0.414.19 ± 1.12 B3.75 ± 1.01 AB3.16 ± 1.11 A
5LIN0.670.165.27 ± 1.04 B6.53 ± 1.57 C4.36 ± 1.58 A
6NI0.52−0.3957.57 ± 28.25 B47.89 ± 32.23 B17.89 ± 23.80 A
7LS10.660.1710.98 ± 1.67 A13.60 ± 2.74 B10.10 ± 2.71 A
8WS0.56−0.134.22 ± 0.75 B4.41 ± 0.74 B3.64 ± 1.00 A
9LL0.77−0.0510.01 ± 2.06 B10.85 ± 2.60 B6.91 ± 1.93 A
10WL0.67−0.065.19 ± 0.80 B5.55 ± 0.88 B4.64 ± 0.66 A
11LP0.730.034.56 ± 1.21 B5.23 ± 1.61 B2.96 ± 0.98 A
12NPL0.43−0.074.73 ± 0.50 B4.78 ± 0.50 B4.11 ± 0.97 A
13LNLP−0.18−0.292.80 ± 0.55 B2.45 ± 0.50 A2.81 ± 0.68 B
14HNLP0.43−0.234.98 ± 0.15 B4.91 ± 0.35 B4.52 ± 0.89 A
15LLB0.700.032.45 ± 0.33 B2.66 ± 0.35 C2.15 ± 0.36 A
16WLB0.22−0.637.77 ± 1.51 B6.14 ± 1.21 A6.18 ± 1.46 A
17LIP0.56−0.3122.00 ± 3.17 B21.29 ± 3.56 B18.20 ± 3.94 A
18HI0.43−0.495.21 ± 1.41 B4.40 ± 0.75 A3.88 ± 1.61 A
19DI0.33−0.162.44 ± 0.31 A2.40 ± 0.25 A2.30 ± 0.31 A
20LNF0.240.2411.84 ± 8.05 A16.64 ± 7.17 B13.56 ± 9.89 AB
21HNF0.66−0.4156.43 ± 11.83 C49.44 ± 9.47 B33.93 ± 17.42 A
22LFB0.080.298.15 ± 0.62 A8.60 ± 0.89 B8.46 ± 1.04 AB
23WFB0.06−0.123.29 ± 0.32 A3.25 ± 0.18 A3.19 ± 0.43 A
24LC1−0.050.2512.72 ± 0.94 A13.21 ± 0.90 B13.38 ± 1.06 B
25LC20.13−0.258.21 ± 0.44 A8.05 ± 0.24 A7.98 ± 0.70 A
26TLW0.400.871.79 ± 0.08 A3.54 ± 0.13 C2.40 ± 0.07 B
27WWB0.450.851.37 ± 0.09 A2.45 ± 0.07 C1.67 ± 0.05 B
28WBW−0.670.231.10 ± 0.10 A1.14 ± 0.06 A1.38 ± 0.04 B
29WMW−0.020.890.43 ± 0.05 A0.89 ± 0.07 C0.83 ± 0.07 B
30TWK−0.86−0.344.21 ± 0.23 B3.62 ± 0.10 A4.99 ± 0.09 C
31LWPK−0.86−0.253.47 ± 0.26 B3.12 ± 0.08 A4.14 ± 0.08 C
32TLK−0.81−0.296.36 ± 0.36 B5.94 ± 0.11 A6.99 ± 0.08 C
33TLS−0.89−0.026.65 ± 0.45 B6.30 ± 0.23 A8.04 ± 0.08 C
34LSB−0.86−0.295.13 ± 0.47 B4.49 ± 0.12 A6.06 ± 0.05 C
35WSB−0.87−0.394.67 ± 0.36 B3.36 ± 0.16 A6.04 ± 0.10 C
36LSP−0.310.381.72 ± 0.47 A1.81 ± 0.16 A2.02 ± 0.10 B
37LCM−0.420.6713.19 ± 0.48 A14.50 ± 0.89 B15.26 ± 0.18 C
38LCT0.040.812.80 ± 0.14 A3.29 ± 0.12 C3.19 ± 0.12 B
39LHCT−0.150.223.27 ± 0.05 A3.28 ± 0.07 A3.29 ± 0.03 A
40LPM−0.850.145.09 ± 0.09 A5.08 ± 0.11 A5.99 ± 0.10 B
41WPM−0.710.403.04 ± 0.10 A3.15 ± 0.13 B3.46 ± 0.07 C
42LS2−0.87−0.062.35 ± 0.07 B2.19 ± 0.10 A3.00 ± 0.08 C
43WS−0.850.062.05 ± 0.05 A2.02 ± 0.05 A2.34 ± 0.05 B
44LR−0.77−0.342.14 ± 0.05 B2.02 ± 0.07 A2.25 ± 0.05 C
45PNANA17.95 ± 1.10 Ab19.47 ± 1.27 Bb18.43 ± 1.08 Ab
46ENANA12.80 ± 1.18 Aa13.03 ± 0.99 Aa12.84 ± 1.37 Aa
47P/ENANA1.41 ± 0.10 A1.50 ± 0.11 B1.45 ± 0.15 AB
48PxENANA230.56 ± 31.60 A254.31 ± 30.81 B237.16 ± 32.74 A
49PFNANA94.04 ± 2.64 A95.01 ± 2.02 A94.97 ± 2.11 A
1 SD: Standard deviation; PC1 and PC2: Principal Components (axes) 1 and 2; R1 and R2: Pearson’s coefficient of correlation with PC1 and PC2, respectively; NA: Not attributed. See Table 2 for trait code full names and measure units; Unequal HSD test: Honest significant difference for unequal size samples.
Table 4. Comparison of antioxidant and antibacterial activities of three samples of Ebenus pinnata ethanolic extracts from different climate stages. For each parameter, values are expressed as Min–Max (upper line) and Mean ± SD (lower line). All tests were repeated in triplicate. Different capital letters indicate significant differences between mean values according to the Fisher’s least significant difference (LSD) test (α = 0.01 for antioxidant parameters, and α = 0.05 for antibacterial activity, with C > B > A).
Parameters/StrainsSample 1
(Humid)
Sample 2
(Sub–Humid)
Sample 3
(Semi–Arid)
Antioxident activity 1TPC (mg GAE/g EXT)50.32–51.33
50.79 ± 0.51
A
50.93–53.02
52.04 ± 1.05
A
56.49–57.40
56.89 ± 0.46
B
DPPH (mg GAE/g EXT)68.62–72.74
71.18 ± 2.24
A
82.93–88.56
86.39 ± 3.02
B
93.53–97.54
95.67 ± 2.02
C
RP (mg GAE/g EXT)10.27–12.52
11.09 ± 1.24
A
16.45–17.94
17.21 ± 0.75
B
25.64–26.16
25.88 ± 0.26
C
Antioxidant activity 2Escherichia coli10–13
11.50 ± 2.12
A
11–13
12.00 ± 1.41
A
10–13
11.50 ± 2.12
A
Staphylococcus aureus10–10.4
10.20 ± 0.28
A
8.5–10
9.50 ± 0.87
A
9–12
10.50 ± 1.50
A
Pseudomonas aeruginosa8.8–11
9.90 ± 1.56
A
11.5–12
11.75 ± 0.35
A
8.5–10
9.25 ± 1.06
A
Methicillin-resistant S.aureus (MRSA)9–10.4
9.80 ± 0.72
A
9–10
9.60 ± 0.53
A
10–11
10.33 ± 0.58
A
Vibrio cholerae9–10
9.50 ± 0.71
A
8–11.2
9.60 ± 2.26
A
9–14.5
11.75 ± 3.89
A
Salmonella typhi9.6–11
10.53 ± 0.81
A
8.9–13
11.30 ± 2.14
A
10.3–13
11.77 ± 1.36
A
1 TPC: Total polyphenol content; DPPH: radical scavenging activity; RP: Reducing power assay. 2 Expressed as the diameter (mm) of the inhibition area.
Disclaimer/Publisher’s Note: The statements, opinions and data contained in all publications are solely those of the individual author(s) and contributor(s) and not of MDPI and/or the editor(s). MDPI and/or the editor(s) disclaim responsibility for any injury to people or property resulting from any ideas, methods, instructions or products referred to in the content.

