Article

Genome-Wide Association Study Detects Loci Involved in Scab Susceptibility in Japanese Apricot

1
Japanese Apricot Laboratory, Wakayama Fruit Tree Experiment Station, 1416-7 Higashi-Honjo, Minabe-cho, Hidaka-gun, Wakayama 645-0021, Japan
2
Graduate School of Agricultural Science, Kobe University, 1-1 Rokkodai, Nada-ku, Kobe 657-8501, Hyogo, Japan
3
Faculty of Agriculture, Setsunan University, 45-1 Nagaotoge-cho, Hirakata 573-0101, Osaka, Japan
*
Author to whom correspondence should be addressed.
Current address: Wakayama Fruit Tree Experiment Station, 751-1, Oki, Aridagawa-cho, Arida-gun, Wakayama 643-0022, Japan.
Horticulturae 2023, 9(8), 872; https://doi.org/10.3390/horticulturae9080872
Submission received: 4 July 2023 / Revised: 17 July 2023 / Accepted: 22 July 2023 / Published: 31 July 2023
(This article belongs to the Special Issue Genetics and Molecular Breeding in Fruit Tree Orchards)

Abstract

:
Japanese apricot (Prunus mume) is an important fruit tree in East Asia. ‘Nanko’, the primary cultivar of Japanese apricots, usually suffers from scab, a disease caused by Venturia carpophila. However, there have been few reports on the phenotypic variation in scab resistance/susceptibility and the underlying genetic factors. In this study, we investigated the severity of naturally occurring scabs based on fruit lesions in 108 Japanese apricot accessions over four consecutive years. In each year, both resistant and susceptible accessions were observed, and significant annual correlations were detected among the ratios of diseased fruits (Rt; 0.52–0.76) and among the disease severity indices (Sv; 0.55–0.79). We also conducted a genome-wide association study (GWAS) based on exon-targeted resequencing, and significant peaks were detected in the data from 2017 and 2018. The candidate genes involved in disease resistance are located near nine single-nucleotide polymorphisms. These genes may be associated with the susceptibility of ‘Nanko’ lineages to scab. These findings shed light on the phenotypic and genetic profiles of scab resistance in P. mume and will assist future breeding programs with improving scab resistance.

1. Introduction

Japanese apricot (Prunus mume) is a deciduous fruit tree that originated in China [1,2,3]. It is a stone (hardened mesocarp) fruit tree belonging to the family Rosaceae. Approximately 58% of the crops are harvested in Wakayama Prefecture, Japan [4]. The primary cultivar is ‘Nanko’, which accounts for 54.7% of the total cultivated area (ca. 5000 ha) [5]. The fruits are processed into umeboshi (pickled fruit), ume-shu (liquor), and syrup. Fruit extracts reportedly have health benefits, such as antiallergy, anticancer, antibacterial, and antiviral properties [6,7,8,9].
The ‘Nanko’ cultivar has long faced a significant problem with a fungal disease referred to as scab, caused by Venturia carpophila (synonym: Cladosporium carpophilum), which leads to the development of black spots on the fruit surface (Figure 1) and reduces its commercial value [10]. In addition, this fungus infects and causes economic damage to other stone fruits, including peaches (Prunus persica), almonds (Prunus dulsis), and apricots (Prunus armeniaca). Therefore, chemical controls are required [11]. Notably, scab disease has not been reported in the Japanese plum (Prunus salicina) (https://www.naro.go.jp/project/results/laboratory/fruit/2002/fruit02-26.html) (accessed on 1 May 2023). However, the emergence of fungicide-resistant strains of V. carpophila has been reported in the Wakayama Prefecture [12]. Similarly, in apple trees (Malus domestica), which belong to the family Rosaceae, the occurrence of fungicide-resistant Venturia inaequalis, which causes scab disease, has become a serious problem [13]. Therefore, to ensure the sustainability of fruit cultivation, management practices other than chemical control, including disease resistance, should be considered.
Despite being an economic concern for Japanese apricots and other stone fruit tree crops, there have been limited reports on the phenotypic variation in scab resistance/susceptibility, underlying genetic factors, and the development of DNA markers. Previously, some PCR-based molecular markers, such as random amplified polymorphic DNA [14], simple sequence repeats [15,16], and chloroplast markers [17], have been used for cultivar identification. Recently, genome-wide single-nucleotide polymorphisms (SNPs) have become available with the development of next-generation sequencing technology [18,19]. However, the loci controlling agriculturally useful traits in Japanese apricots are largely unknown, and the currently available DNA markers are limited to the selection of self-compatibility traits, targeting the S-RNase gene [20]. The principal challenges in genetic analysis and fruit tree breeding are related to the large individual sizes and long juvenile periods of trees, which make it difficult to segregate populations and conduct continuous trait evaluations [21].
The main objective of this study was to investigate the genetic factors that control scab resistance and susceptibility. In order to achieve this goal, phenotypic observations of scab resistance and susceptibility in Japanese apricots were performed using 108 accessions maintained in the experimental orchard of the Japanese Apricot Laboratory, Wakayama Fruit Tree Experiment Station. Fruits from a single tree per accession were employed to investigate naturally occurring scabs in the field. Considering the annual variations, the observations were repeated over 4 years to evaluate the symptoms. A genome-wide association study (GWAS) was conducted, and candidate genomic regions for scab resistance were estimated. Here, we report nine SNPs possibly involved in severe scab susceptibility in ‘Nanko’ linages. These SNPs could be utilized as selection markers, particularly in cross-breeding populations using ‘Nanko’ as a parent.

2. Results

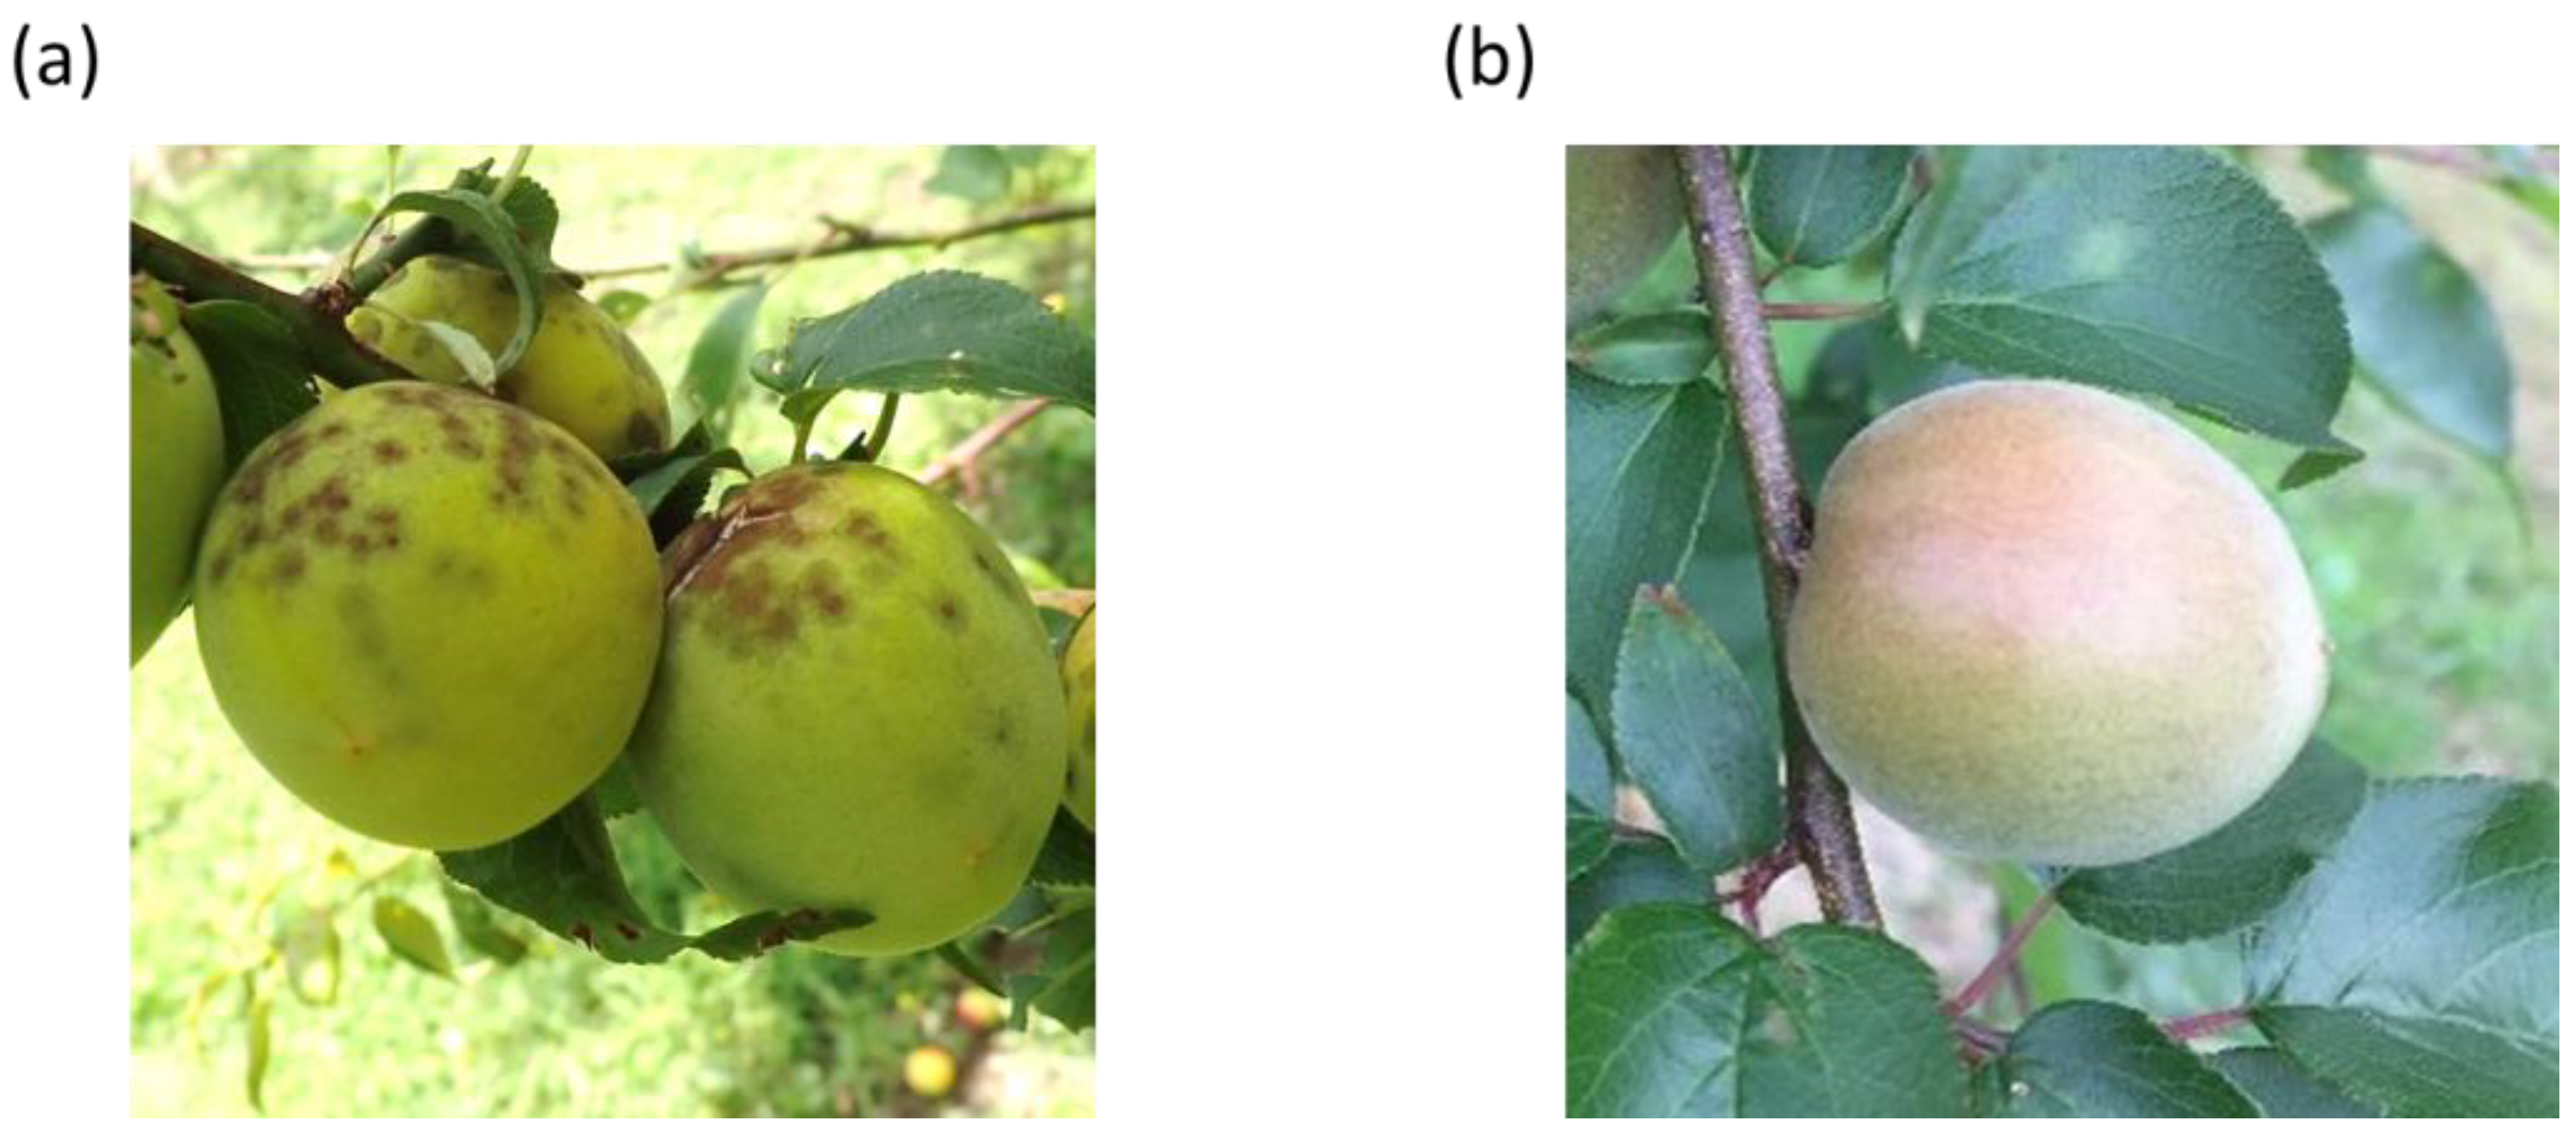
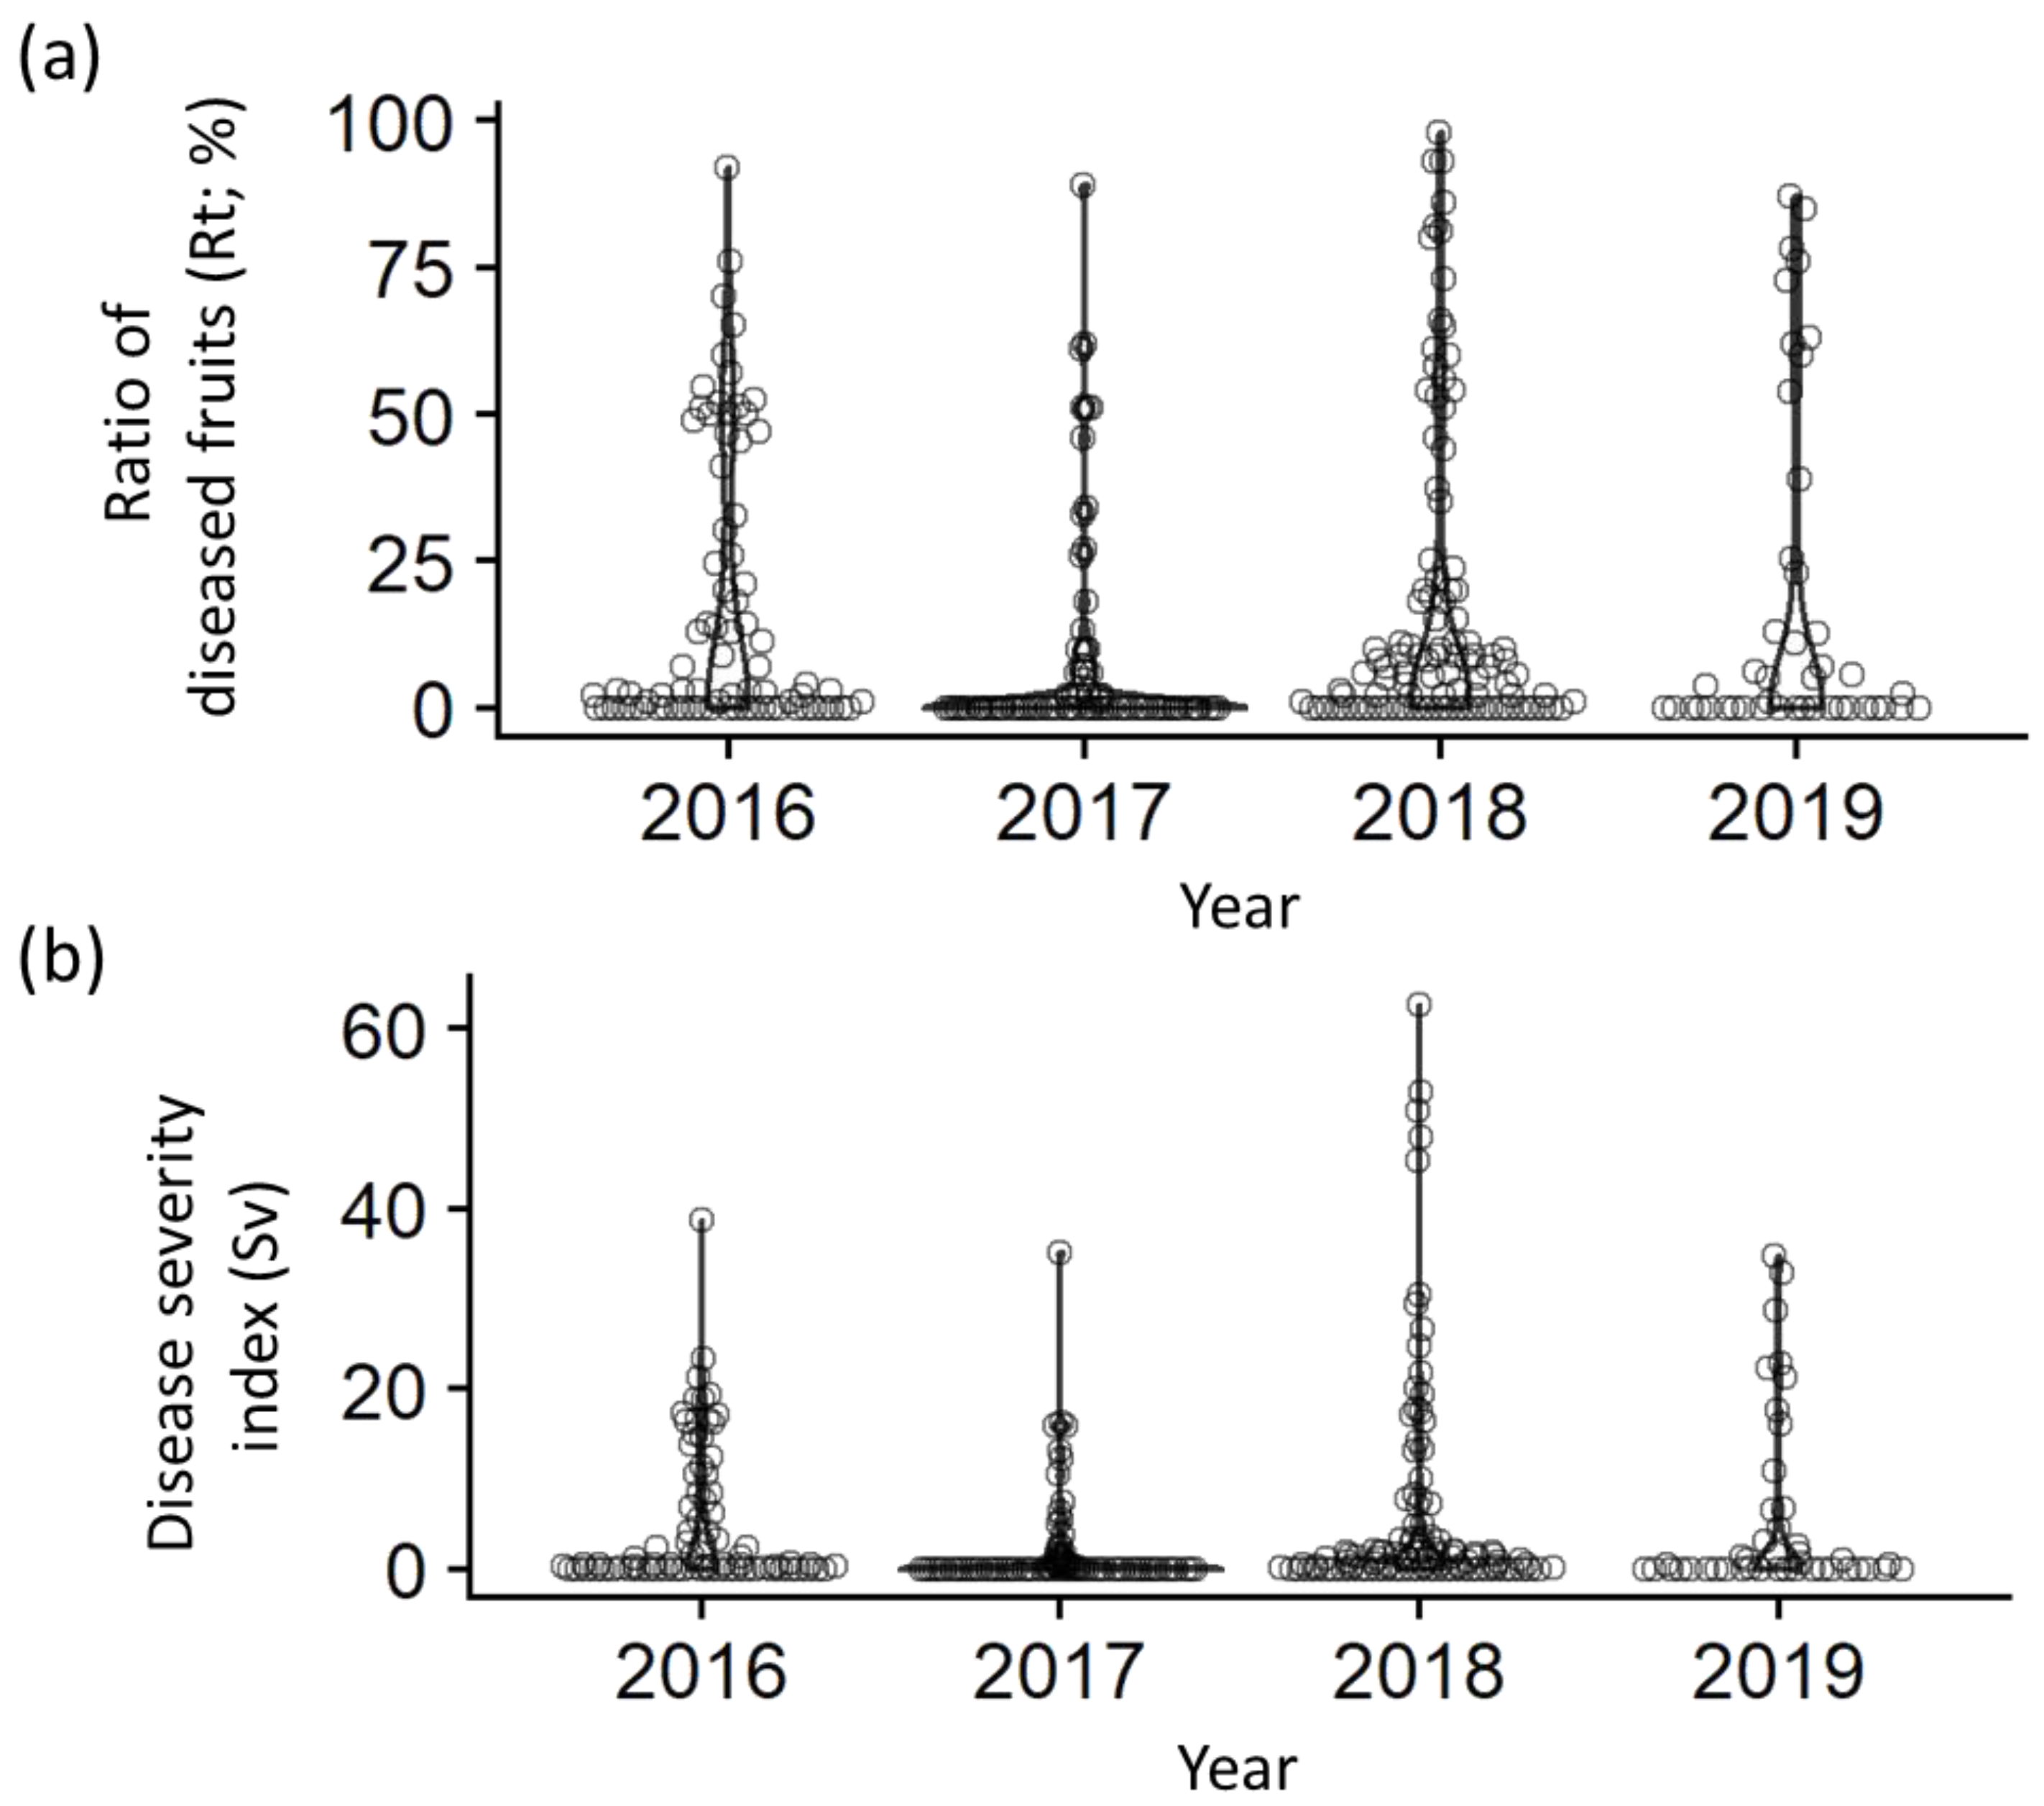
2.1. Phenotypic Variation of Scab Resistance

A total of 108 Japanese apricot accessions were used to evaluate scab resistance and susceptibility. These specimens consisted of 45 fruit (F), 11 small-fruit (FS), 37 ornamental (O), and 5 Taiwanese (T) accessions, as well as eight hybrids between P. mume and P. armeniaca (AM) and two hybrids between P. mume and P. salicina (SM). Accessions that showed the fruit set were used for trait evaluation each year (79 accessions in 2016, 83 in 2017, 103 in 2018, and 44 in 2019). Naturally occurring scab infections were observed in 100 fruits (or all fruits if the number of fruits was ˂100) of each accession and were categorized by the number of lesions per fruit as follows: 0, no symptoms; 1, 1–3 lesions; 2, 4–8 lesions; 4, 9–20 lesions; and 6, >20 lesions. The ratio of diseased fruits (Rt; %) and the disease severity index (Sv; considers the number of lesions per fruit) [22,23] were calculated (Table S1).
The results showed substantial variation in both the Rt and Sv among the accessions. ‘Garyubai’, ‘Kensaki’, and ‘Koyokoume’ did not exhibit any symptoms (Rt and Sv = 0). In contrast, ‘W2’ (Rt: 89.0–92.1%, Sv: 35.2–38.8), ‘Nanko’ (Rt: 62.0–92.9%, Sv: 16.2–50.8), and ‘Tenjin’ (Rt: 50.0–98.0, Sv: 12.3–62.7) were severely affected by scab. In the plots, most accessions were clustered around zero and a small number of highly susceptible accessions were distributed for both Rt and Sv throughout the survey period (Figure 2). Among the accessions surveyed, ‘Benisashi’ (F), ‘Ellching’ (T), ‘Inabungo’ (AM), ‘Jizoume’ (F), ‘JO1028-6’ (F), ‘Kotsubunanko’ (F), ‘Nanko’ (F), ‘Sadayuume’ (F), ’Seiko’ (F), ‘Sumomoume’ (SM), ‘Tenjin’ (F), and ‘W2’ (F) were ranked within the top 10 in Sv score for at least 2 years out of the 4 years surveyed.
Spearman’s rank correlation coefficients were calculated for all possible combinations to assess the annual variation in scab resistance/susceptibility traits (Table 1 and Table 2). Statistically significant rank correlations were obtained for all combinations, with values ranging from 0.52 (2017 vs. 2018) to 0.76 (2018 vs. 2019) for Rt, and from 0.55 (2016 vs. 2018 and 2016 vs. 2019) to 0.79 (2018 vs. 2019) for Sv, indicating a moderate correlation.

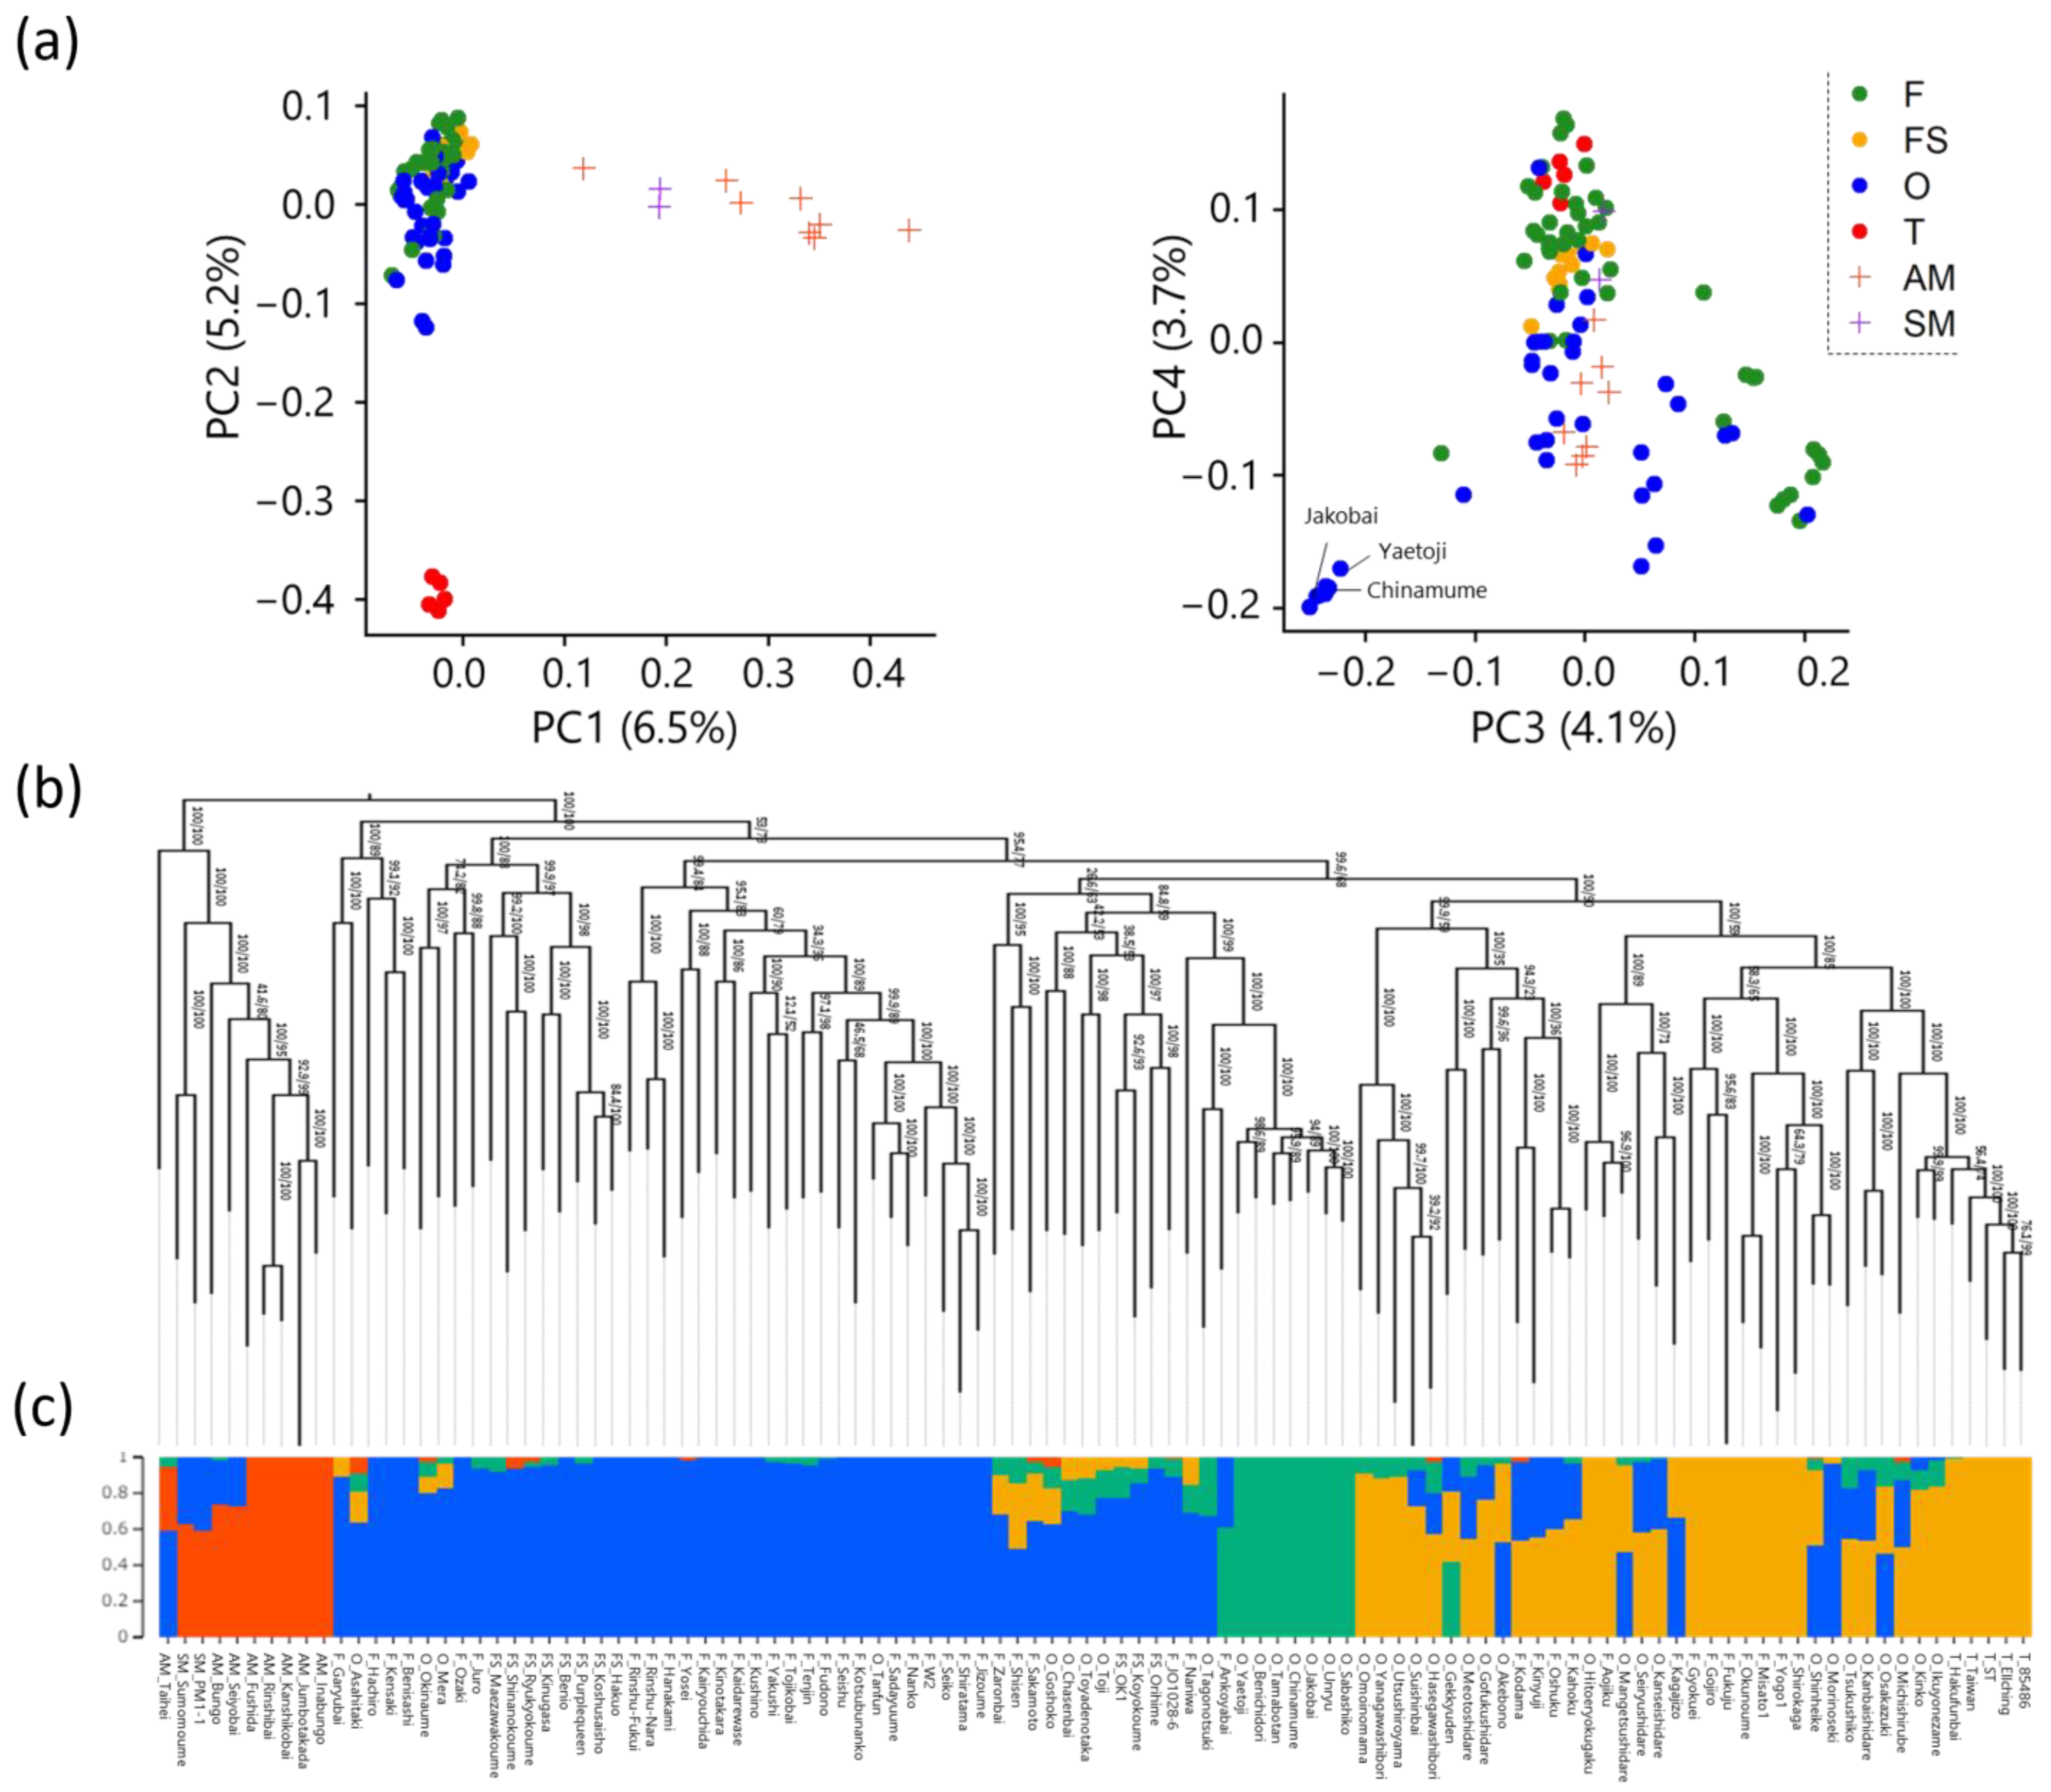
2.2. Population Structure of Japanese Apricot Accessions

Raw sequence reads of 108 accessions were quality-trimmed and then mapped onto LG1-8 of Peach v2.0 genome [24], with repeated sequences masked. Duplicate reads were removed and SNP calling was performed. Quality filtering and removal of positions with a missing rate > 0.2 (loci with DP ˂ 8 were considered as missing) were conducted, followed by the imputation of missing data. Subsequently, SNPs with a minor allele frequency ˂ 0.03 were removed, and SNPs in strong linkage disequilibrium (LD) (r2 > 0.5) were pruned. The resulting dataset was subjected to principal component analysis (PCA), phylogenetic tree construction, and Bayesian clustering analysis using ADMIXTURE [25].
PCA, which shrinks the dimensions of large genotype data, revealed that the F, FS, O, AM, and SM populations were clearly separated in PC1 (Figure 3a). In PC2, the Taiwanese population (T population) was distinctly separated from the others. However, in PC3 and PC4, although some ornamental accessions (such as ‘Yaetoji’, ‘Chinamume’, and ‘Jakobai’) were plotted separately, the other populations showed no well-defined clustering. In the phylogenetic tree, the AM and SM populations formed a distinct cluster, whereas the other populations showed ambiguous clustering according to the usage type (F, FS, and O) (Figure 3b). Furthermore, ADMIXTURE analysis revealed that the cross-validation error was minimized at K = 4, indicating the optimal number of clusters. In the bar plot for K = 4, the AM and SM populations (red bars), as well as some ornamental accessions (e.g., ‘Yaetoji’, ‘Chinamume’, and ‘Jakobai’; green bars), formed separate clusters, whereas the other populations were grouped into two major clusters (blue and orange bars; Figure 3c).
These results confirm that the AM, SM, and T populations have distinct structures compared with the other populations. Therefore, these populations were excluded from further analysis, and the remaining populations were subjected to the GWAS.

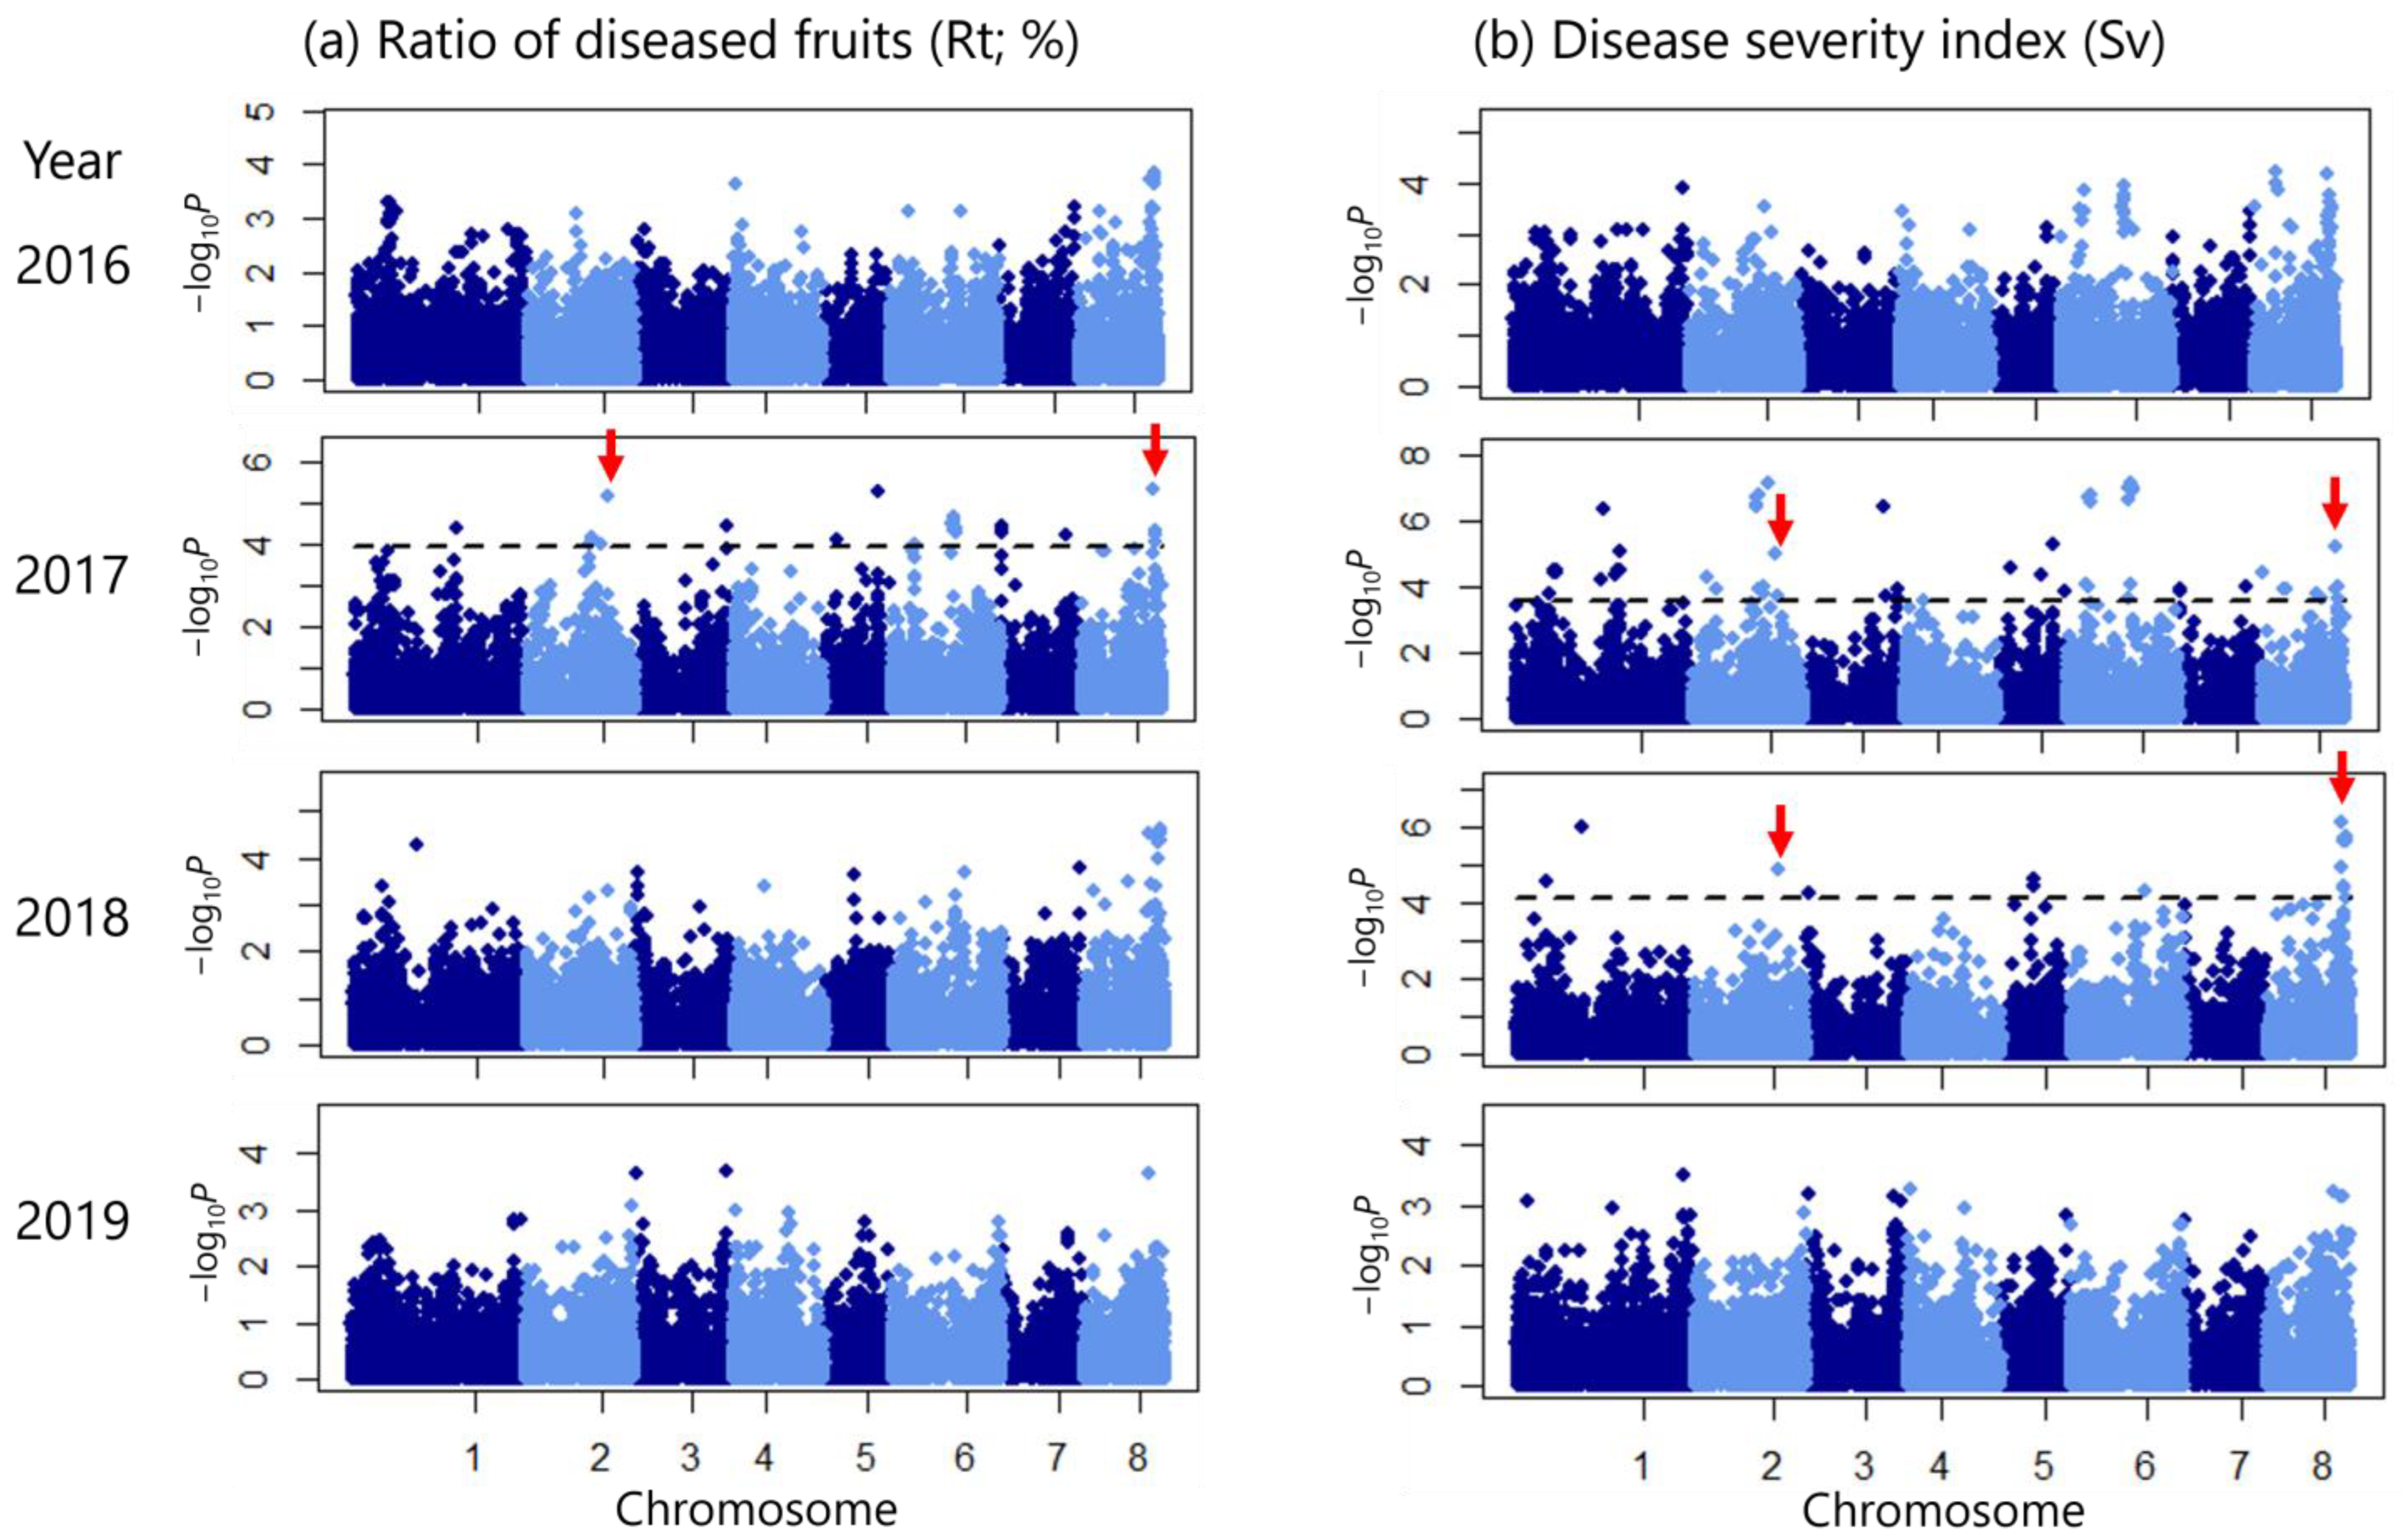
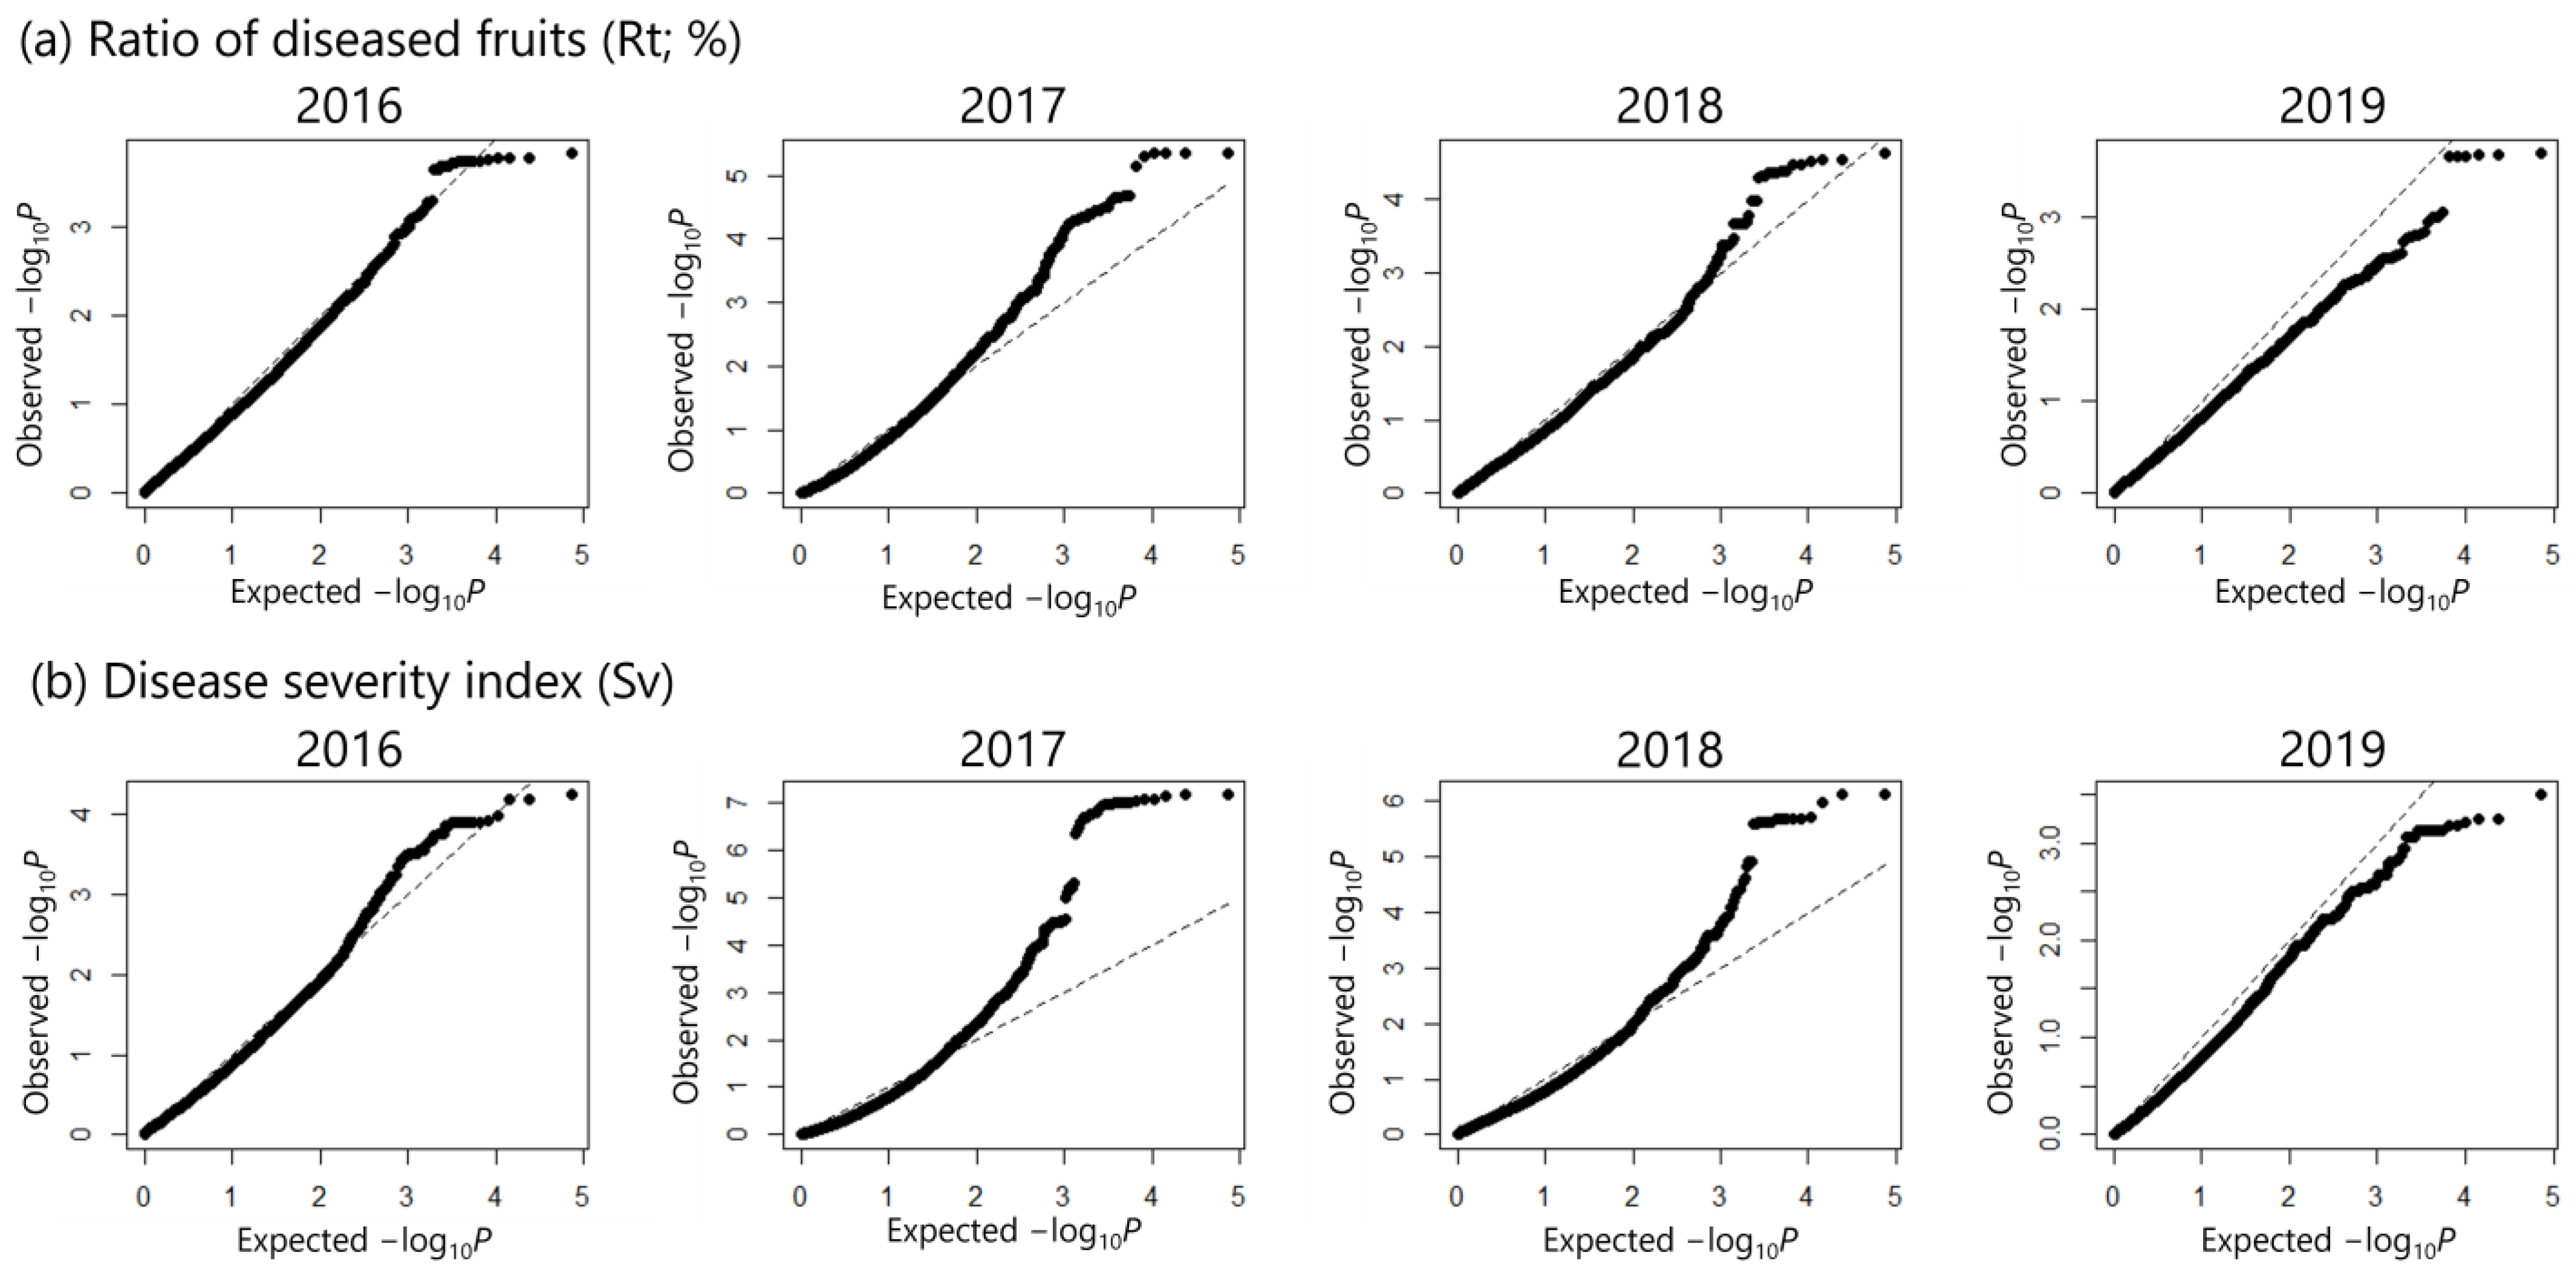
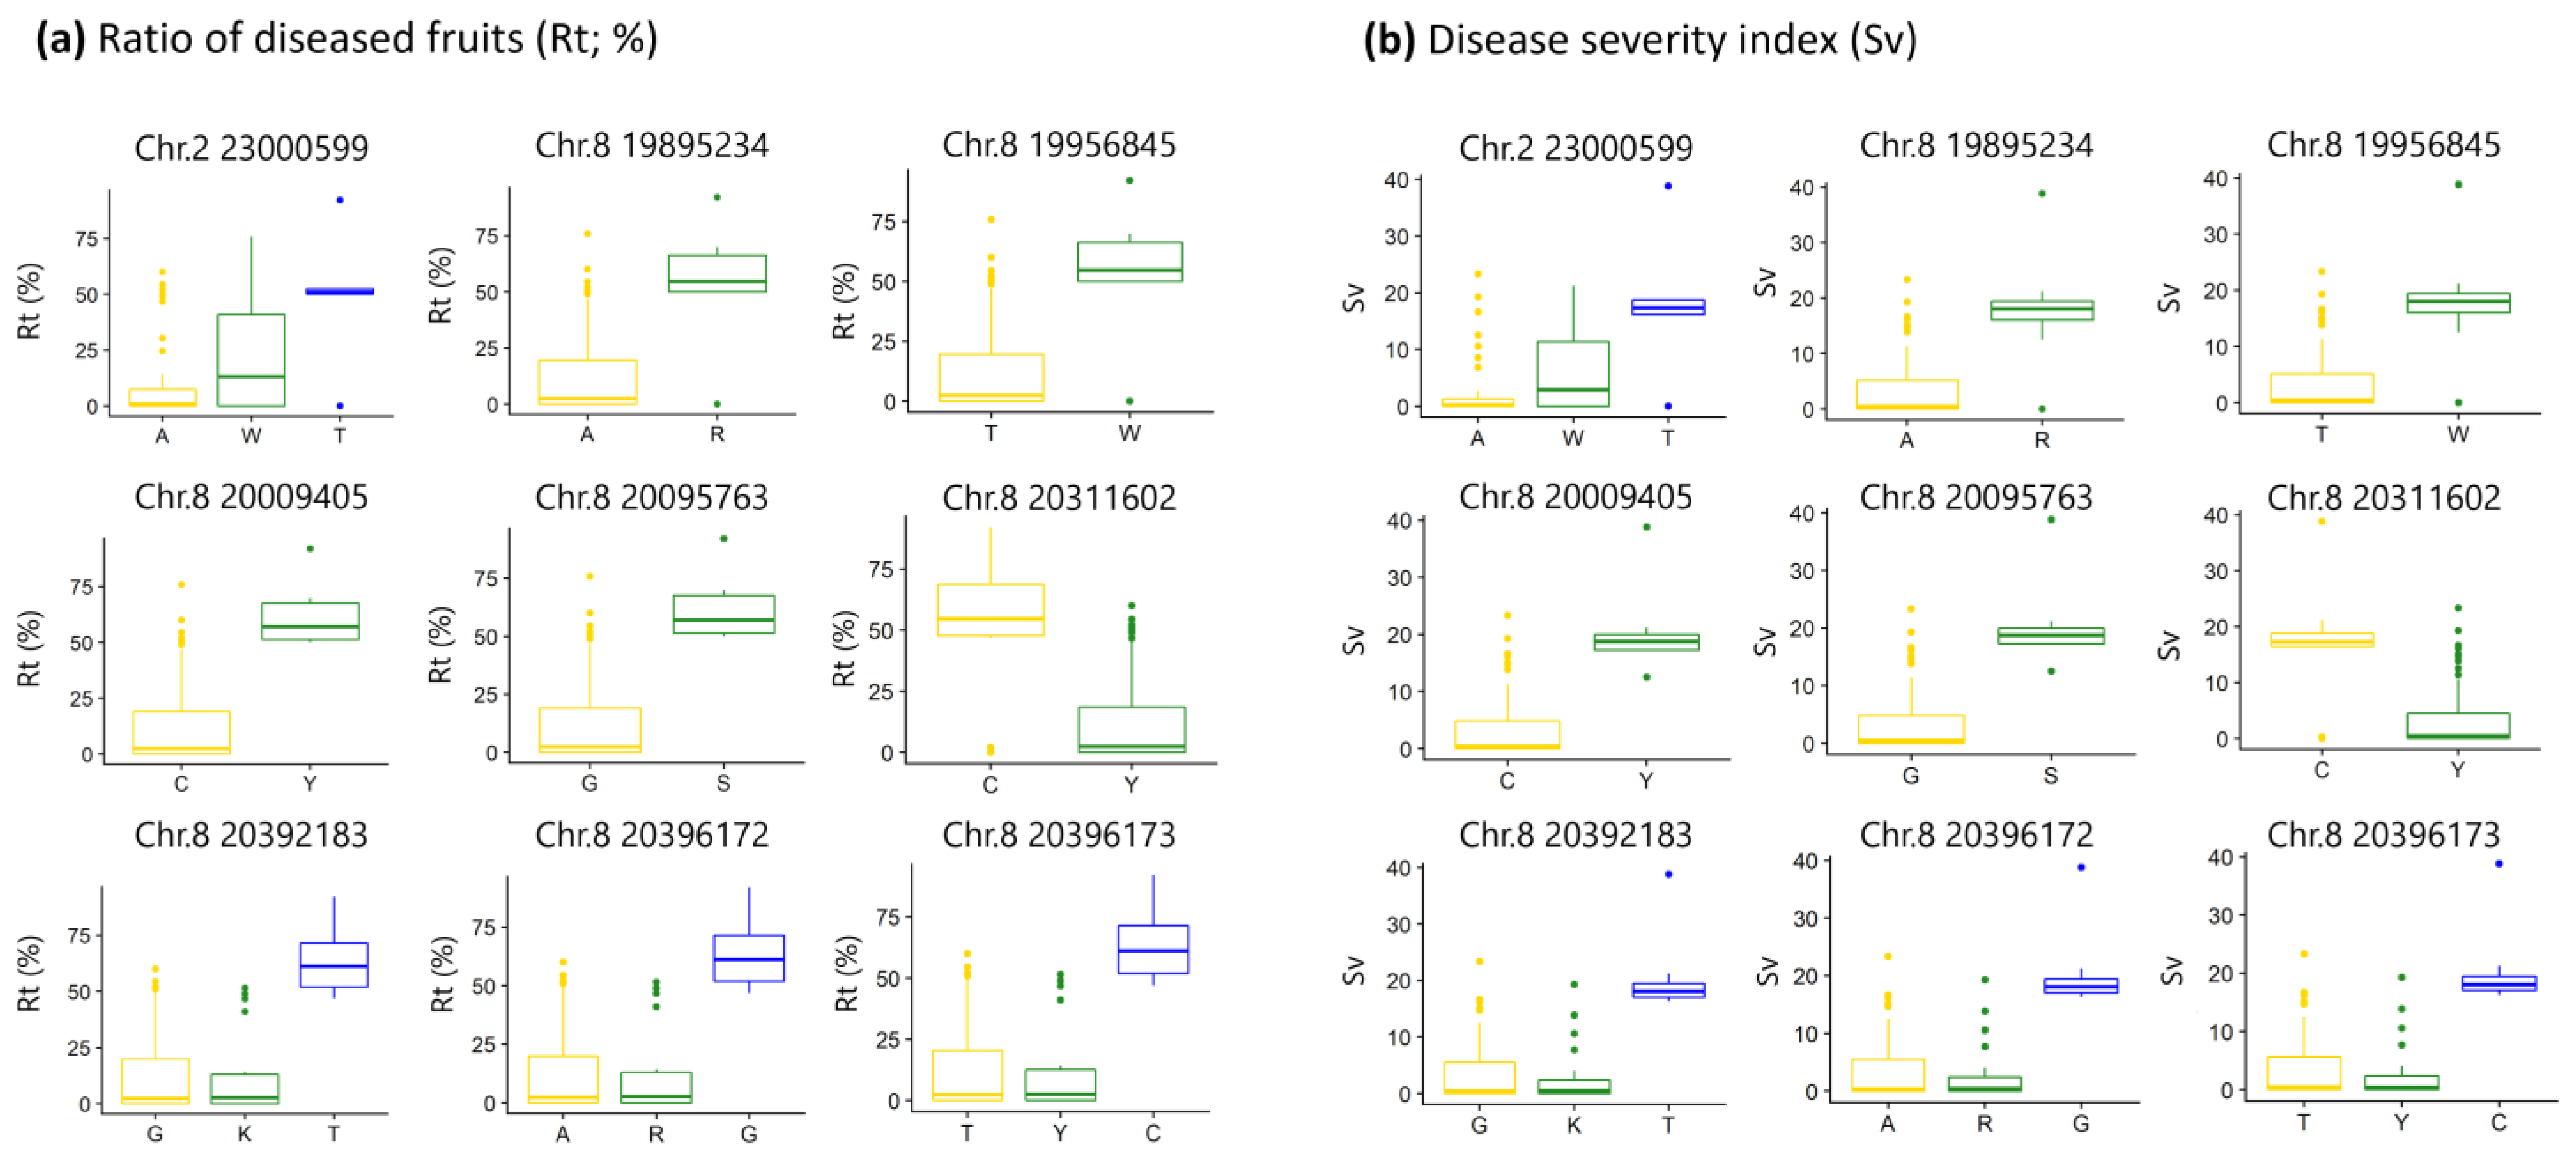
2.3. Multi-Year GWAS Identifies SNPs Associated with Disease Severity

A GWAS was conducted on 93 Japanese apricot accessions, excluding the AM, SM, and T populations, based on the results of the population structure analysis. Genotype data were extracted from the SNP set, excluding positions with missing rates > 0.2 (minDP ˂ 8), and imputed using Beagle [26]. Only the SNPs with minor allele frequencies > 0.03 were selected. The GWAS was performed using the mixed linear model method in TASSEL [27]. The ADMIXTURE results (K = 4) were inputted as the population structure, and the kinship matrix obtained as the output by TASSEL was inputted as the pedigree structure.
Overall, the results of the GWAS using the Rt data were more conservative than those using the Sv data (Figure 4). Inflation of peak detection was not observed based on the quantile–quantile (Q–Q) plots for each year, in which most of the observed p-values followed a uniform distribution (Figure 5). In 2019, the observed p-values were lower than expected, indicating lower power of the GWAS, possibly due to the insufficient sample size (Figure 5). A GWAS involving the use of Rt data showed that 42 SNPs exceeded the threshold (false discovery rate [FDR] < 0.1) in 2017 (Figure 4a, Table S2). A GWAS involving Sv data detected 98 significant SNPs (FDR < 0.1) in 2017 and 27 SNPs in 2018 (Figure 4b; Tables S3 and S4). No significant peaks were observed in the GWAS using trait values from 2016 and 2019. However, the Manhattan plots generally showed a shape similar to those from 2017 and 2018 (Figure 4), supporting the results obtained in 2017 and 2018. Among the significant peaks, nine SNPs were consistently detected in both 2017 and 2018, with one SNP located on chromosome 2 and eight located on chromosome 8 (Figure 4b, Tables S3 and S4). These SNPs were also detected in Rt in 2017 (Figure 4a, Table S2). Among these SNPs, Rt and Sv tended to be higher in accessions with a homozygous T genotype at SNP 23,000,599 on chromosome 2; accessions with heterozygous genotypes at SNPs 19,895,234, 19,956,845, 20,009,405, and 20,095,763 on chromosome 8; accessions with a homozygous C genotype at SNP 20,311,602; and accessions with homozygous T, G, and C genotypes at SNPs 20,392,183, 20,396,172, and 20,396,173 (Figure 6 and Figures S1–S3, Table S5).

2.4. Candidate Genes for Scab Severity

To identify candidate genes near the nine significant GWAS peaks detected over multiple years, we first defined LD blocks around these peaks using HaploView [28]. We regarded a gene harboring a significant SNP as a candidate gene for SNPs where LD blocks could not be defined because the genotyping method used in this study targeted the genic region [18]. According to the genomic regions defined above, we obtained information for candidate genes (e.g., functional annotations for expressed protein) from the Phytozome 13 database (https://phytozome-next.jgi.doe.gov/) (accessed on 1 May 2023) based on the annotation of P. persica [24].
No LD block was defined around SNP 23,000,599 on chromosome 2; however, the SNP was located on Prupe.2G190600 (no definition available) (Table 3). An LD block of ca. 8.3 kb was defined around SNP 19,895,234 on chromosome 8 with two genes: Prupe.8G217900 (protein kinase domain/leucine-rich repeat/leucine-rich repeat N-terminal domain) and Prupe.8G218000 (no definition is available). Similarly, no LD block was defined around SNP 19,956,845 on chromosome 8; however, the SNP was located on Prupe.8G219000 (a tetratricopeptide repeat protein). Only a small LD block of 210 bp was defined around SNP 20009405; however, the SNP was located on Prupe.8G220100 (a leucine-rich repeat). No LD block was defined around 20,095,763, but the SNP was located on Prupe.8G221600 (ribophorin II). Near 20,311,602, an LD block of ca. 5.1 kbp was defined. Three genes, namely Prupe.8G226500, Prupe.8G226600, and Prupe.8G226700 (oxidoreductase, 2OG-Fe II oxygenase family protein), were located within this LD block. Finally, an LD block of approximately 18.9 kbp was defined around three SNPs, namely 20,392,183, 20,396,172, and 20,396,173. Four genes, namely Prupe.8G227300, Prupe.8G227400, Prupe.8G227500 (LOB domain-containing protein), and Prupe.8G227600 (poly [ADP-ribose] polymerase 1), were located within this block (Table 3).

3. Discussion

In this study, we conducted multiyear trait evaluations using 108 accessions of Japanese apricots to obtain data on their resistance and susceptibility to scab disease (Table S1). The annual correlations for Rt and Sv were not very high, indicating that the scab severity of fruits may be influenced by climatic conditions, such as temperature, humidity, and precipitation. Therefore, we conducted an annual analysis of the Rt and Sv data in the GWAS. A small number of accessions exhibited strong susceptibility to scabs, whereas most accessions showed resistance (Figure 2). Furthermore, accessions with high Rt and Sv values (for example, ‘W2’, ‘Tenjin’, and ‘Kotsubunanko’) tended to be genetically related to ‘Nanko’ (Tables S1 and S5, Figure 3). In these accessions, the genotypic patterns of the GWAS peaks consistently detected over multiple years were highly similar (Table S5). ‘Nanko’ has been a major cultivar in Japan for over 50 years since its registration in 1966 and is extensively cultivated in the Wakayama Prefecture [1,5]. In modern agricultural environments where a single variety is cultivated on a large scale for an extended period, the evolution of pathogenic races specific to the variety can be enhanced [29]. It is possible that ‘Nanko’ (or its ancestors), perhaps originally not highly susceptible to scab, experienced the co-evolution of the pathogen V. carpophila because of its large-scale, long-term (>50 years) cultivation, possibly involving the breakdown of the resistance genes. The complete genome of V. carpophila has already been published; therefore, future research focusing on the genetic diversity of this pathogen may facilitate elucidation of the mechanisms of resistance/susceptibility to scabs in Japanese apricots [11].
To the best of our knowledge, no studies have investigated the large-scale variation in scab resistance among other Prunus fruit tree species. However, in apples, the resistance/susceptibility to scabs (caused by V. inaequalis) has been evaluated in 177 accessions [30]. Among the 61 cultivated apple (M. domestica) varieties, only 8 showed resistance to scab, indicating a breakdown of resistance. Notably, these eight resistant varieties were developed by introducing the resistance gene Rvi6 derived from Malus floribunda 821 through breeding. It is essential to promote resistance breeding in Japanese apricots to diversify variety groups and establish an agricultural system that is not overly dependent on ‘Nanko’.
The GWAS results showed reproducibility of significant associations on chromosomes 2 and 8 (Figure 4). The SNPs consistently detected for Rt in 2017 and for Sv in 2017 and 2018 could partly explain the strong susceptibility to scab in the ‘Nanko’ family (Table S5). First, in ‘Nanko’, except for the SNP 23,000,599 on chromosome 2, all other SNPs were associated with the susceptible genotype. Other accessions with the same genotype as ‘Nanko’ included ‘Tanfun’ and ‘Sadayuume. ’ Furthermore, in ‘W2’, which tended to be more susceptible than ‘Nanko’, the susceptible genotype was observed in all nine SNPs (Table S5). Accessions having the same genotype as ‘W2’ included ‘Tenjin’ and ‘Kotsubunanko’. All the accessions were in close proximity in the phylogenetic tree (Figure 3). Therefore, the significant associations identified in this study potentially harbor genomic regions that contribute to the high susceptibility to scab in the ‘Nanko’ family. An example is the difference in scab susceptibility among ‘W2’, ‘Seiko’, and ‘Seishu’, all offsprings of ‘Nanko’. ‘Seiko’, having moderate resistance to scab, was developed by crossing ‘Nanko’ with ‘Jizoume’, while ‘Seishu’, having strong resistance, was developed by crossing ‘Nanko’ with ‘Kensaki’ [31,32]. There was a significant variation in the resistance level, with ‘Seiko’ having a marginally lower disease severity than ‘Nanko’, while ‘Seishu’ showed lower disease severity than that of ‘Seiko’ (Table S5). This difference can be partially explained by the nine SNPs identified in this study. In ‘Seiko’, four SNPs on chromosome 8 (SNP 19,895,234–20,095,763) exhibited resistant genotypes, while SNP 20,311,602–20,396,173 remained the susceptible type, and ‘Seishu’ showed the resistance genotype in all nine SNPs (Table S5). Note that ‘W2’ is a full sibling of ‘Seiko’ having typical susceptibility to scab, as described above. Therefore, the SNPs identified in this study may serve as selection markers for scab resistance, particularly in segregated populations derived from crosses involving ‘Nanko’. However, in other lineages, there were some susceptible varieties despite having resistance genotypes in all the nine SNPs, as seen in ‘Jizoume’, ‘Inabungo’, and ‘Ellching’. Other loci that were not detected in the present study may be involved in the susceptibility of these accessions to scabs. A GWAS is a powerful method for estimating causal genetic loci in fruit trees without segregating populations. However, this methodology has limitations, such as the inability to detect loci with small effects and rare variants [33]. In addition, annual variations in the severity of naturally occurring scabs in the field may affect the detection of the responsible loci. Further approaches, such as inoculation methods, are required to confirm these results.
Several candidate genes were identified near these nine SNPs (Table 3). Some of these genes, such as the leucine-rich repeat genes Prupe.8G217900 and Prupe.8G220100, have been implicated in disease resistance in Arabidopsis and play a role in recognizing proteins secreted by pathogens [34]. The tetratricopeptide repeat protein (Prupe.8G219000) is also involved in disease resistance. Ribophorin II (RPN2) (Prupe.8G221600) is associated with susceptibility to powdery mildew [35]. Additionally, 2OG-Fe II oxygenase family proteins (Prupe.8G226500, Prupe.8G226600, and Prupe.8G226700) and oxidoreductases have been linked to susceptibility to downy mildew [36]. LOB domain-containing proteins (Prupe.8G227300, Prupe.8G227400, and Prupe.8G227500) are negative regulators of the susceptibility of Arabidopsis to the root-infecting fungus Fusarium oxysporum [37], and they are also involved in susceptibility to bacterial canker in citrus [38]. Finally, poly [ADP-ribose] polymerase 1 (Prupe.8G227600) recognizes pathogen-associated molecular patterns and is involved in pathogen infection responses [39]. These genes represent candidates that are likely to contribute to our understanding of the susceptibility of Japanese apricot varieties to scab. Experimental confirmation, such as the measurement of expression levels, is necessary to clarify the roles of these genes.

4. Conclusions

In this study, we identified nine SNPs harboring genes that may contribute to the susceptibility of the ‘Nanko’ lineage to scab. The SNPs can potentially be used as selection markers for improving disease resistance in ‘Nanko’—one of the major varieties in Japan. Different genetic loci may be involved in scab resistance observed in other lineages. Increasing the sample size is likely to lead to the discovery of more genetic loci; however, achieving this is challenging for large fruit trees with long juvenile periods. The application of genomic prediction, as attempted in apples, Japanese pears, and citrus, may provide a promising approach for introducing minor resistance loci [40,41,42]. The trait data obtained in this study will be valuable for advancing the breeding of Japanese apricot varieties with improved disease resistance. Further exploration of genetic loci related to other diseases will contribute to the sustainable development of the Japanese apricot industry.

5. Materials and Methods

5.1. Plant Materials

One hundred and eight Japanese apricot accessions maintained at the Japanese Apricot Laboratory, Wakayama Fruit Tree Experiment Station (Minabe-cho, Hidaka-gun, Wakayama, Japan), were used in this study (Table S1). The number of accessions in each group was as follows: F, 45; FS, 11; O, 37; T, 5; AM, 8; and SM, 2. The trees were managed without fungicide application during the survey period (2016–2019).

5.2. Evaluation of Scab Resistance

Accessions that fruited during the survey period were selected. To determine the natural prevalence of scab disease, investigations were conducted from May 16 to 17 May 2016, 1 June 2017, 1 June 2018, and 16 June 2019, in which 100 fruits per tree (or all fruits if <100) were examined. The Rt (%) and Sv were calculated [22,23]. Disease severity was classified based on the number of lesions per fruit as follows: score 0, no symptoms; score 1, 1–3 lesions; score 2, 4–8 lesions; score 4, 9–20 lesions; and score 6, ≥21 lesions. Sv was calculated as follows:
Sv = Σ (score × number of fruits with corresponding severity)/(6 × number of fruits surveyed) × 100
Spearman’s rank correlation coefficients were calculated using the R package “Psych”.

5.3. Genome-Wide Genotyping Using the Target Capture Method

For the accessions ‘Inabungo’ (AM), ‘JO1028-6’ (F), ‘OK1’ (FS), ‘Rinshibai’ (AM), ‘Seishu’ (F), and ‘W2’ (F), resequencing was performed based on the target capture method [18]. DNA was extracted from 100 mg of green branches sampled in February 2019, using a DNeasy Plant Mini Kit (Qiagen, Hilden, Germany). The gDNA-seq libraries for the Illumina platform were prepared using a HyperPlus Kit (Kapa Biosystems, Wilmington, MA, USA). Libraries were barcoded for each sample using single 8-bp NEXTflex adapters (Bioo Scientific, Austin, TX, USA) and enriched via PCR using PrimeSTAR Max (Takara Bio, Shiga, Japan) with the following protocol: 3 min at 95 °C; followed by eight cycles of 10 s at 95 °C, 30 s at 65 °C, and 30 s at 72 °C; and a final extension step for 5 min at 72 °C. Subsequently, libraries containing the target regions (15,171 exons) were enriched using MyBaits Customs Design Kit 1–20 K probes (Arbor Biosciences, Ann Arbor, MI, USA). The sequences of the target genes and designed probes are available in a public database (https://doi.org/10.5281/zenodo.8141088) (accessed on 13 July 2023). We pooled equal amounts of the constructed gDNA libraries. Target hybridization was performed according to the manufacturer’s protocol. The conditions for PCR enrichment of target-captured libraries were as follows: 3 min at 95 °C; followed by 14 cycles of 10 s at 95 °C, 30 s at 65 °C, and 30 s at 72 °C; and a final extension step for 5 min at 72 °C. Sequencing was performed using the Illumina NovaSeq 6000 platform (paired-end 150 bp). SRA run accession numbers for all sequences are listed in Table S1.
Publicly available sequencing data [18] were used for other accessions. The SRA accession numbers are listed in Table S1.

5.4. Read Processing and SNP Calling

Raw sequencing reads were processed using PEAT Linux v1.2.4 [43] to remove adapter sequences, and quality trimming was performed using Trimmomatic 0.39 [44]. The quality trimming conditions were set as follows: LEADING, 20; TRAILING, 20; SLIDING WINDOW, 10:20; and MINLEN, 20. The processed reads were then mapped to the peach (P. persica) v2.0 reference genome (repeat-masked version) [24] on LG1-8 using BWA-MEM (version 0.7.17-r1188) [45], and the resulting alignments were converted to BAM files using SAMtools 1.9 [46]. Subsequently, PCR-duplicated reads were marked using Picard 2.26.10 (http://broadinstitute.github.io/picard/) (accessed on 1 May 2013), and SNP calling was performed using HaplotypeCaller of GATK4 (version 4.2.5.0) [47] to generate gVCF files. These files were combined into a single VCF file using Genomics DBImport and GenotypeGVCFs of GATK4. Only SNP variants were extracted from the VCF file, and quality filtering was performed using VariantFiltration of GATK4. The filtering criteria were QD < 5.0, FS > 50.0, SOR > 3.0, MQ < 50.0, MQRankSum < –2.5, ReadPosRankSum < –1.0, and ReadPosRankSum > 3.5. The resulting VCF file was applied to the BAM files using the BaseRecalibrator of GATK4, and the abovementioned process was repeated. The final VCF file generated through these steps was used for further analysis.

5.5. Population Structure Analysis

Before analysis, loci with missing rates exceeding 20% (those with DP < 8 were considered missing) were excluded from the VCF file obtained earlier using VCFtools 0.1.16 [48]. Imputation was performed using Beagle 5.2 [26], and loci with minor allele frequency ˂ 0.03 were excluded. Subsequently, SNP pairs with r2 values > 0.5 were pruned by sliding a window of 50 SNPs with a step of 3 SNPs using PLINK v1.90b6.24 [49]. The resulting SNP set was used for the population structure analysis. PCA using PLINK, maximum likelihood phylogenetic analysis using IQTree 2.0.3 [50], and analysis using ADMIXTURE 1.3.0 [25] were conducted. In the phylogenetic analysis, ModelFinder [51] was used for phylogenetic model selection and ultrafast bootstrap approximation [52] was employed to assess clade support. In the ADMIXTURE analysis, a cross-validation error analysis was performed to determine the optimal number of clusters (K value), according to the software manual.

5.6. GWAS

A GWAS was conducted on 93 Japanese apricot accessions based on the results of the population structure analysis, excluding the AM, SM, and T populations. Genotype data were extracted from the SNP set, excluding positions with a missing rate exceeding 0.2 (minDP < 8), and were then imputed using Beagle 5.2 [26]. SNPs with a minor allele frequency > 0.03 were further selected. GWAS was performed using the mixed linear model method in TASSEL 5.2 [27]. Optimal ADMIXTURE analysis results (K = 4) were used as the population structure. The kinship matrix output obtained using TASSEL was inputted as the pedigree structure.
To identify candidate genes in the vicinity of significant GWAS peaks detected over multiple years, we first attempted to define LD blocks around these peaks using HaploView 4.2 [28]. For SNPs in which LD blocks could not be defined, we regarded the gene harboring the significant SNP as a candidate gene because the genotyping method used in the current study targeted the genic region [18]. According to the genomic regions defined above, we obtained information of candidate genes (e.g., functional annotations for expressed protein) from the Phytozome 13 database (https://phytozome-next.jgi.doe.gov/) (accessed on 1 May 2023) based on the annotation of P. persica [24].

Supplementary Materials

The following supporting information can be downloaded at: https://www.mdpi.com/article/10.3390/horticulturae9080872/s1. Figure S1: Box plots of trait values in 2017 for genotypes at nine SNPs detected in multiple years in GWAS; Figure S2: Box plots of trait values in 2018 for genotypes at nine SNPs detected in multiple years in GWAS; Figure S3: Box plots of trait values in 2019 for genotypes at nine SNPs detected in multiple years in GWAS; Table S1: Ratio of diseased fruits (Rt) and disease severity index (Sv) observed among 108 Japanese apricot accessions in 4 years (2016–2019); Table S2: Significant GWAS peaks (FDR < 0.1) for Rt in 2017; Table S3: Significant GWAS peaks (FDR < 0.1) for Sv in 2017; Table S4: Significant GWAS peaks (FDR < 0.1) for Sv in 2018; Table S5: Rt, Sv, and genotypes at nine significant GWAS peaks detected in multiple years.

Author Contributions

Conceptualization, K.N.; methodology, K.N. and T.K.; validation, K.N., T.K. and Y.K.; formal analysis, K.N.; investigation, K.N., T.K., Y.K., R.I. and T.I.; resources, K.N., T.K. and Y.K.; data curation, K.N. and T.K.; writing—original draft preparation, K.N.; writing—review and editing, R.I. and T.I.; supervision, R.I. and T.I.; project administration, K.N.; and funding acquisition, K.N. All authors have read and agreed to the published version of the manuscript.

Funding

This research was funded by JSPS KAKENHI, grant number JP18K14449, to K.N. and Wakayama Prefecture.

Data Availability Statement

Raw FASTQ reads for Prunus mume accessions sequenced in this study were deposited in the Sequence Read Archive (SRA) under accession number DRA016280. The SRA run accession numbers for all sequence reads are listed in Table S1.

Acknowledgments

We are deeply grateful to the researchers and technicians at the Japanese Apricot Laboratory, Wakayama Fruit Tree Experiment Station, for maintaining the Prunus mume accessions.

Conflicts of Interest

The authors declare no conflict of interest.

References

  1. Mega, K.; Tomita, E.; Kitamura, S.; Saito, S.; Mizukami, S. The Grand Dictionary of Horticulture; Aoba, T., Ed.; Shogakukan: Tokyo, Japan, 1988; ISBN 978-4-09-305111-8. [Google Scholar]
  2. Horiuchi, S.; Yoshida, M.; Kariya, H.; Nakamura, T.; Hasebe, H.; Suzaki, T.; Sakitani, T. Nihonnoume Sekainoume; Yokendo: Tokyo, Japan, 1996. [Google Scholar]
  3. Chen, J. China Mei Flower (Prunus Mume) Cultivars in Colour; China Forestry Publishing House: Beijing, China, 2017. [Google Scholar]
  4. Ministry of Agriculture, Forestry and Fisheries Japan the 96th Statistical Yearbook of Ministry of Agriculture, Forestry and Fisheries: MAFF. Available online: https://www.maff.go.jp/e/data/stat/96th/index.html (accessed on 5 May 2023).
  5. Ministry of Agriculture, Forestry and Fisheries Japan Survey on Production Dynamics of Specialty Fruit Trees (in Japanese). Available online: https://www.e-stat.go.jp/stat-search/file-download?statInfId=000040042773&fileKind=0 (accessed on 5 May 2023).
  6. Ikeda, K.; Nishide, M.; Tsujimoto, K.; Nagashima, S.; Kuwahara, T.; Mitani, T.; Koyama, A.H. Antiviral and Virucidal Activities of Umesu Phenolics on Influenza Viruses. Jpn. J. Infect. Dis. 2020, 73, 8–13. [Google Scholar] [CrossRef] [PubMed]
  7. Enomoto, S.; Yanaoka, K.; Utsunomiya, H.; Niwa, T.; Inada, K.; Deguchi, H.; Ueda, K.; Mukoubayashi, C.; Inoue, I.; Maekita, T.; et al. Inhibitory Effects of Japanese Apricot (Prunus Mume Siebold et Zucc.; Ume) on Helicobacter Pylori-Related Chronic Gastritis. Eur. J. Clin. Nutr. 2010, 64, 714–719. [Google Scholar] [CrossRef] [PubMed]
  8. Kono, R.; Nakamura, M.; Nomura, S.; Kitano, N.; Kagiya, T.; Okuno, Y.; Inada, K.; Tokuda, A.; Utsunomiya, H.; Ueno, M. Biological and Epidemiological Evidence of Anti-Allergic Effects of Traditional Japanese Food Ume (Prunus Mume). Sci. Rep. 2018, 8, 11638. [Google Scholar] [CrossRef] [PubMed]
  9. Bailly, C. Anticancer Properties of Prunus Mume Extracts (Chinese Plum, Japanese Apricot). J. Ethnopharmacol. 2020, 246, 112215. [Google Scholar] [CrossRef]
  10. Fisher, E.E. Venturia Carpophila Sp.Nov., the Ascigerous State of the Apricot Freckle Fungus. Trans. Br. Mycol. Soc. 1961, 44, 337-IN4. [Google Scholar] [CrossRef]
  11. Chen, C.; Bock, C.H.; Wood, B.W. Draft Genome Sequence of Venturia Carpophila, the Causal Agent of Peach Scab. Stand. Genom. Sci. 2017, 12, 68. [Google Scholar] [CrossRef]
  12. Takeda, T.; Hishiike, M.; Numaguchi, K. Occurrence of QoI-Resistant Strains of Cladosporium Carpophilum Causing Japanese Apricot Scab in Wakayama Prefecture. Ann. Rept. Kansai Pl. Prot. 2022, 64, 75–80. [Google Scholar] [CrossRef]
  13. Mori, M.; Yamana, T. Occurrence of DMI-Resistant Strains of Venturia Inaequalis Causing Apple Scab in Hokkaido. Ann. Rept. Soc. Pl. Prot. Nort. Jap. 2022, 76–80. [Google Scholar] [CrossRef]
  14. Shimada, T.; Haji, T.; Yamaguchi, M.; Takeda, T.; Nomura, K.; Yoshida, M. Classification of Mume (Prunus mume Sieb. et Zucc.) by RAPD Assay. J. Jpn. Soc. Hort. Sci. 1994, 63, 543–551. [Google Scholar] [CrossRef]
  15. Numaguchi, K.; Ishio, S.; Kitamura, Y.; Nakamura, K.; Ishikawa, R.; Ishii, T. Microsatellite Marker Development and Population Structure Analysis in Japanese Apricot (Prunus mume Sieb. et Zucc.). Hort. J. 2019, 88, 222–231. [Google Scholar] [CrossRef]
  16. Hayashi, K.; Shimazu, K.; Yaegaki, H.; Yamaguchi, M.; Iketani, H.; Yamamoto, T. Genetic Diversity in Fruiting and Flower-Ornamental Japanese Apricot (Prunus mume) Germplasms Assessed by SSR Markers. Breed Sci. 2008, 58, 401–410. [Google Scholar] [CrossRef]
  17. Ohta, S.; Hayashi, K.; Yaegaki, H.; Mitsui, N.; Omura, M.; Nishitani, C.; Yamamoto, T. Genetic Relationship among Fruiting and Flower-Japanese Apricot Characterized by Chloroplast DNA Markers. DNA Polymorph. 2006, 14, 138–140. [Google Scholar]
  18. Numaguchi, K.; Akagi, T.; Kitamura, Y.; Ishikawa, R.; Ishii, T. Interspecific Introgression and Natural Selection in the Evolution of Japanese Apricot (Prunus mume). Plant J. 2020, 104, 1551–1567. [Google Scholar] [CrossRef] [PubMed]
  19. Zhang, Q.; Zhang, H.; Sun, L.; Fan, G.; Ye, M.; Jiang, L.; Liu, X.; Ma, K.; Shi, C.; Bao, F.; et al. The Genetic Architecture of Floral Traits in the Woody Plant Prunus Mume. Nat. Commun. 2018, 9, 1702. [Google Scholar] [CrossRef]
  20. Tao, R.; Habu, T.; Yamane, H.; Sugiura, A.; Iwamoto, K. Molecular Markers for Self-Compatibility in Japanese Apricot (Prunus mume). HortScience 2000, 35, 1121–1123. [Google Scholar] [CrossRef]
  21. McClure, K.A.; Sawler, J.; Gardner, K.M.; Money, D.; Myles, S. Genomics: A Potential Panacea for the Perennial Problem. Am. J. Bot. 2014, 101, 1780–1790. [Google Scholar] [CrossRef]
  22. Groth, J.V.; Ozmon, E.A.; Busch, R.H. Repeatability and Relationship of Incidence and Severity Measures of Scab of Wheat Caused by Fusarium Graminearum in Inoculated Nurseries. Plant Dis. 1999, 83, 1033–1038. [Google Scholar] [CrossRef]
  23. Cardoso, J.E.; Santos, A.A.; Rossetti, A.G.; Vidal, J.C. Relationship between Incidence and Severity of Cashew Gummosis in Semiarid North-Eastern Brazil. Plant Pathol. 2004, 53, 363–367. [Google Scholar] [CrossRef]
  24. Verde, I.; Jenkins, J.; Dondini, L.; Micali, S.; Pagliarani, G.; Vendramin, E.; Paris, R.; Aramini, V.; Gazza, L.; Rossini, L.; et al. The Peach v2.0 Release: High-Resolution Linkage Mapping and Deep Resequencing Improve Chromosome-Scale Assembly and Contiguity. BMC Genom. 2017, 18, 225. [Google Scholar] [CrossRef]
  25. Alexander, D.H.; Novembre, J.; Lange, K. Fast Model-Based Estimation of Ancestry in Unrelated Individuals. Genome Res. 2009, 19, 1655–1664. [Google Scholar] [CrossRef]
  26. Browning, B.L.; Zhou, Y.; Browning, S.R. A One-Penny Imputed Genome from Next-Generation Reference Panels. Am. J. Hum. Genet. 2018, 103, 338–348. [Google Scholar] [CrossRef]
  27. Bradbury, P.J.; Zhang, Z.; Kroon, D.E.; Casstevens, T.M.; Ramdoss, Y.; Buckler, E.S. TASSEL: Software for Association Mapping of Complex Traits in Diverse Samples. Bioinformatics 2007, 23, 2633–2635. [Google Scholar] [CrossRef] [PubMed]
  28. Barrett, J.C.; Fry, B.; Maller, J.; Daly, M.J. Haploview: Analysis and Visualization of LD and Haplotype Maps. Bioinformatics 2005, 21, 263–265. [Google Scholar] [CrossRef]
  29. McDonald, B.A.; Stukenbrock, E.H. Rapid Emergence of Pathogens in Agro-Ecosystems: Global Threats to Agricultural Sustainability and Food Security. Philos. Trans. R. Soc. Lond. B Biol. Sci. 2016, 371, 20160026. [Google Scholar] [CrossRef]
  30. Papp, D.; Gao, L.; Thapa, R.; Olmstead, D.; Khan, A. Field Apple Scab Susceptibility of a Diverse Malus Germplasm Collection Identifies Potential Sources of Resistance for Apple Breeding. CABI Agric. Biosci. 2020, 1, 16. [Google Scholar] [CrossRef]
  31. Kitamura, Y.; Takeda, T.; Numaguchi, K.; Tsuchida, Y.; Negoro, K.; Hayashi, K.; Iwamoto, K.; Hishiike, M.; Naka, K.; Shimazu, K. Breeding of scab-resistant Japanese apricot (Prunus mume Sieb. et Zucc.) “Seiko” and evaluation of possibility for fungicide-saving cultivation. Bull. Wakayama Prefect. Exp. Station. Agric. Forest. Fish. 2018, 6, 27–35. [Google Scholar]
  32. Numaguchi, K.; Kitamura, Y.; Takeda, T.; Shimomura, Y.; Tsunaki, K.; Kashiwamoto, T.; Shimazu, K.; Hishiike, M.; Iwamoto, K.; Negoro, K.; et al. Breeding of Japanese apricot (Prunus mume Sieb. et Zucc.) ‘Seishu’. Bull. Wakayama Prefect. Exp. Station. Agric. Forest. Fish. 2021, 9, 73–85. [Google Scholar]
  33. Korte, A.; Farlow, A. The Advantages and Limitations of Trait Analysis with GWAS: A Review. Plant Methods 2013, 9, 29. [Google Scholar] [CrossRef]
  34. Jones, D.A.; Jones, J.D.G. The Role of Leucine-Rich Repeat Proteins in Plant Defences. In Advances in Botanical Research; Andrews, J.H., Tommerup, I.C., Callow, J.A., Eds.; Academic Press: Cambridge, MA, USA, 1997; Volume 24, pp. 89–167. [Google Scholar]
  35. Weis, C.; Pfeilmeier, S.; Glawischnig, E.; Isono, E.; Pachl, F.; Hahne, H.; Kuster, B.; Eichmann, R.; Hückelhoven, R. Co-Immunoprecipitation-Based Identification of Putative BAX INHIBITOR-1-Interacting Proteins Involved in Cell Death Regulation and Plant–Powdery Mildew Interactions. Mol. Plant Pathol. 2013, 14, 791–802. [Google Scholar] [CrossRef]
  36. Van Damme, M.; Huibers, R.P.; Elberse, J.; Van den Ackerveken, G. Arabidopsis DMR6 Encodes a Putative 2OG-Fe(II) Oxygenase That Is Defense-Associated but Required for Susceptibility to Downy Mildew. Plant J. 2008, 54, 785–793. [Google Scholar] [CrossRef]
  37. Thatcher, L.F.; Powell, J.J.; Aitken, E.A.B.; Kazan, K.; Manners, J.M. The Lateral Organ Boundaries Domain Transcription Factor LBD20 Functions in Fusarium Wilt Susceptibility and Jasmonate Signaling in Arabidopsis. Plant Physiol. 2012, 160, 407–418. [Google Scholar] [CrossRef]
  38. Hu, Y.; Zhang, J.; Jia, H.; Sosso, D.; Li, T.; Frommer, W.B.; Yang, B.; White, F.F.; Wang, N.; Jones, J.B. Lateral Organ Boundaries 1 Is a Disease Susceptibility Gene for Citrus Bacterial Canker Disease. Proc. Natl. Acad. Sci. USA 2014, 111, E521–E529. [Google Scholar] [CrossRef] [PubMed]
  39. Rissel, D.; Peiter, E. Poly(ADP-Ribose) Polymerases in Plants and Their Human Counterparts: Parallels and Peculiarities. Int. J. Mol. Sci. 2019, 20, 1638. [Google Scholar] [CrossRef]
  40. Minamikawa, M.F.; Takada, N.; Terakami, S.; Saito, T.; Onogi, A.; Kajiya-Kanegae, H.; Hayashi, T.; Yamamoto, T.; Iwata, H. Genome-Wide Association Study and Genomic Prediction Using Parental and Breeding Populations of Japanese Pear (Pyrus Pyrifolia Nakai). Sci. Rep. 2018, 8, 11994. [Google Scholar] [CrossRef]
  41. Minamikawa, M.F.; Nonaka, K.; Kaminuma, E.; Kajiya-Kanegae, H.; Onogi, A.; Goto, S.; Yoshioka, T.; Imai, A.; Hamada, H.; Hayashi, T.; et al. Genome-Wide Association Study and Genomic Prediction in Citrus: Potential of Genomics-Assisted Breeding for Fruit Quality Traits. Sci. Rep. 2017, 7, 4721. [Google Scholar] [CrossRef] [PubMed]
  42. Roth, M.; Muranty, H.; Di Guardo, M.; Guerra, W.; Patocchi, A.; Costa, F. Genomic Prediction of Fruit Texture and Training Population Optimization towards the Application of Genomic Selection in Apple. Hortic. Res. 2020, 7, 148. [Google Scholar] [CrossRef]
  43. Li, Y.-L.; Weng, J.-C.; Hsiao, C.-C.; Chou, M.-T.; Tseng, C.-W.; Hung, J.-H. PEAT: An Intelligent and Efficient Paired-End Sequencing Adapter Trimming Algorithm. BMC Bioinform. 2015, 16, S2. [Google Scholar] [CrossRef] [PubMed]
  44. Bolger, A.M.; Lohse, M.; Usadel, B. Trimmomatic: A Flexible Trimmer for Illumina Sequence Data. Bioinformatics 2014, 30, 2114–2120. [Google Scholar] [CrossRef]
  45. Li, H. Aligning Sequence Reads, Clone Sequences and Assembly Contigs with BWA-MEM. arXiv 2013, arXiv:1303.3997. [Google Scholar]
  46. Li, H.; Handsaker, B.; Wysoker, A.; Fennell, T.; Ruan, J.; Homer, N.; Marth, G.; Abecasis, G.; Durbin, R. The Sequence Alignment/Map Format and SAMtools. Bioinformatics 2009, 25, 2078–2079. [Google Scholar] [CrossRef]
  47. Auwera, G.A.; O’Connor, B.D. Genomics in the Cloud: Using Docker, GATK, and WDL in Terra; O’Reilly Media: Sebastopol, CA, USA, 2020. [Google Scholar]
  48. Danecek, P.; Auton, A.; Abecasis, G.; Albers, C.A.; Banks, E.; DePristo, M.A.; Handsaker, R.E.; Lunter, G.; Marth, G.T.; Sherry, S.T.; et al. The Variant Call Format and VCFtools. Bioinformatics 2011, 27, 2156–2158. [Google Scholar] [CrossRef]
  49. Purcell, S.; Neale, B.; Todd-Brown, K.; Thomas, L.; Ferreira, M.A.R.; Bender, D.; Maller, J.; Sklar, P.; de Bakker, P.I.W.; Daly, M.J.; et al. PLINK: A Tool Set for Whole-Genome Association and Population-Based Linkage Analyses. Am. J. Hum. Genet. 2007, 81, 559–575. [Google Scholar] [CrossRef]
  50. Minh, B.Q.; Schmidt, H.A.; Chernomor, O.; Schrempf, D.; Woodhams, M.D.; von Haeseler, A.; Lanfear, R. IQ-TREE 2: New Models and Efficient Methods for Phylogenetic Inference in the Genomic Era. Mol. Biol. Evol. 2020, 37, 1530–1534. [Google Scholar] [CrossRef]
  51. Kalyaanamoorthy, S.; Minh, B.Q.; Wong, T.K.F.; von Haeseler, A.; Jermiin, L.S. ModelFinder: Fast Model Selection for Accurate Phylogenetic Estimates. Nat. Methods 2017, 14, 587–589. [Google Scholar] [CrossRef]
  52. Minh, B.Q.; Nguyen, M.A.T.; von Haeseler, A. Ultrafast Approximation for Phylogenetic Bootstrap. Mol. Biol. Evol. 2013, 30, 1188–1195. [Google Scholar] [CrossRef]
Figure 1. Fruits of scab-susceptible accessions of ‘Nanko’ (a) and scab-resistant accessions of ‘Seishu’ (b). Severe symptoms of scab are observed on the fruit surface of ‘Nanko’.
Horticulturae 09 00872 g001
Figure 2. Distribution of phenotypic values for scab resistance in Japanese apricot. (a) Ratio of diseased fruits (Rt; %). (b) Disease severity index (Sv).
Horticulturae 09 00872 g002
Figure 3. Population structure analysis of Japanese apricot accessions. (a) Principal component analysis. (b) Maximum likelihood phylogenetic analysis. (c) ADMIXTURE analysis for the optimal value of K = 4. The membership proportions in each cluster are shown with lengths of the colored bars (y-axis).
Horticulturae 09 00872 g003
Figure 4. Manhattan plots for scab resistance traits from genome-wide association studies. (a) Rt (%). (b) Sv. Dashed lines indicate a false discovery rate (FDR) of 0.1. Significant single-nucleotide polymorphisms (SNPs) commonly detected for Rt in 2017 and for Sv in 2017 and 2018 are indicated by red arrows.
Horticulturae 09 00872 g004
Figure 5. Quantile–quantile (Q-Q) plots for genome-wide association analyses of scab resistance traits. (a) Rt (%), (b) Sv.
Horticulturae 09 00872 g005
Figure 6. Box plots of trait values in 2016 for genotypes at nine SNPs detected multiple years in GWAS. (a) Rt (%). (b) Sv. Genotypes: A, T, C, and G: Homozygote for each base. K, R, S, W, and Y: Heterozygote of A/T, A/G, C/G, A/T, and C/T, respectively.
Horticulturae 09 00872 g006
Table 1. Annual correlations of Rt values.
Year2016201720182019
2016 0.62 a0.560.54
20175.28 × 10−9 b 0.520.59
20182.83 × 10−71.03 × 10⁻⁶ 0.76
20196.28 × 10−41.18 × 10−42.24 × 10−9
a Values above the diagonal are Spearman’s rank correlation coefficients. b Values below the diagonal are p-values for each rank correlation coefficient.
Table 2. Annual correlations of Sv values.
Year2016201720182019
2016 0.61 a0.550.55
20171.01 × 10−8 b 0.560.63
20184.02 × 10−75.98 × 10⁻⁸ 0.79
20194.95 × 10−43.07 × 10−41.92 × 10−10
a Values above the diagonal are Spearman’s rank correlation coefficients. b Values below the diagonal are p-values for each rank correlation coefficient.
Table 3. Significant genome-wide association peaks detected in multiple years and candidate genes.
Chr.PositionLD Block aCandidate GeneGene Description b
223000599NAPrupe.2G190600NA
81989523419895155–
19903433
Prupe.8G217900Protein kinase domain (Pkinase)//Leucine-rich repeat (LRR_1)
//Leucine-rich repeat N-terminal domain (LRRNT_2)
Prupe.8G218000NA
819956845NAPrupe.8G219000Tetratricopeptide repeat protein, TPR
82000940520009216–
20009426
Prupe.8G220100Leucine-rich repeat (LRR_1)
820095763NAPrupe.8G221600Ribophorin II
82031160220306531–
20311602
Prupe.8G226500Oxidoreductase, 2OG-Fe II oxygenase family protein
Prupe.8G226600Oxidoreductase, 2OG-Fe II oxygenase family protein
Prupe.8G226700Oxidoreductase, 2OG-Fe II oxygenase family protein
820392183
20396172
20396173
20377283–
20396173
Prupe.8G227300Lob domain-containing protein 17-related
Prupe.8G227400Lob domain-containing protein 17-related
Prupe.8G227500Lob domain-containing protein 16
Prupe.8G227600Poly [ADP-ribose] polymerase 1
a Linkage disequilibrium (LD) block defined by HaploView containing significant SNPs. b Gene description in Phytozome 13 (https://phytozome-next.jgi.doe.gov/) (accessed on 1 May 2023), NA: gene description not available.
Disclaimer/Publisher’s Note: The statements, opinions and data contained in all publications are solely those of the individual author(s) and contributor(s) and not of MDPI and/or the editor(s). MDPI and/or the editor(s) disclaim responsibility for any injury to people or property resulting from any ideas, methods, instructions or products referred to in the content.

