Article

Reduction of Pericarp Browning and Microbial Spoilage on Litchi Fruits in Modified Atmosphere Packaging

Department of Agricultural, Food and Forest Sciences (SAAF), Università degli Studi di Palermo, Viale delle Scienze, 90128 Palermo, Italy
*
Author to whom correspondence should be addressed.
Horticulturae 2023, 9(6), 651; https://doi.org/10.3390/horticulturae9060651
Submission received: 10 May 2023 / Revised: 27 May 2023 / Accepted: 29 May 2023 / Published: 1 June 2023
(This article belongs to the Section Postharvest Biology, Quality, Safety, and Technology)

Abstract

:
The pericarp browning and postharvest microbiological decay of litchi fruit (Litchi chinensis Sonn cv Kwai Mai) significantly reduce its commercial potential in the fresh market. In this study, different combinations of modified atmosphere packaging (MAP) were applied at 5 ± 1 °C based on the use of natural gases that are innocuous to human health and an alternative to commercially adopted sulfur dioxide (SO2) treatment. The results showed that control fruits, after 6 days of storage, begin to show the first symptoms of decay, revealed by the appearance of lesions and microbial infections determined by total mesophilic microorganisms and molds. This is not the case in the MAP-treated fruits and the MAP 3-treated (5% O2 + 20% CO2 + 75% N2) fruits that show the best results. The control fruits, moreover, turned completely brown by the end of the storage period. The MAP 3 treatment was the most effective in preventing browning and the loss of the red pericarp color and vitamin content and in maintaining acceptable SSC/TA levels and flavor. In addition, a microbiological analysis revealed that all the MAP-treated litchi fruits did not harbor undesirable microorganisms during the entire cold storage period. In conclusion, the MAP 3 conditions delayed pericarp browning and maintained the better organoleptic quality of litchi fruits.

1. Introduction

The litchi fruit (Litchi chinensis Sonn.) belongs to tropical and subtropical regions, but today, it is grown in many regions worldwide. More recently, thanks to climate change, it has also spread to Italy where it is cultivated in Sicily [1], along with other tropical species, such as mango [2], avocado [3], papaya [4] and loquat [5], following a process that can be defined as the ‘tropicalization’ of Mediterranean fruit cultivation. Litchi is a nonclimacteric crop that stands out due to its bright red color, shiny epicarp and the juiciness of its flesh [6,7]. As a result of several studies, it has gained increasing commercial interest for its organoleptic and nutraceutical value [8,9,10]. However, its high perishability results in a short shelf life due to a great physiological change after harvest [11]. Peel browning and pathological decay are its main problems, as they damage its brilliance. The main causes of the browning phenomenon are due to peroxidase (POD), polyphenol oxidase (PPO) and laccase (LAC), respectively [12]. Furthermore, it was observed that membrane destruction accelerates enzymatic browning and reactive oxygen species (ROS) overproduction in fruit. Thus, the preservation of the membrane structure is useful for maintaining its quality and extending its shelf life. The key enzyme responsible for the degradation of phospholipids is Phospholipase D (PLD), which occurs as a lightning event in postharvest senescent tissues [13]. This enzyme catalyzes products, including linoleic and phosphatidic acids, that act as signals to activate the oxylipin and signal transduction pathway cellular signal, which may be involved in the production of the wound signal responsible for the wound-induced increase in activity, phenol accumulation and enzymatic browning in plant tissues [14,15]. Changes in pH from acidic to basic, together with the excessive production of H2O2 and O2, also affect the discoloration of anthocyanin pigments, limiting the shelf life [16,17]. To counter this problem, postharvest technologies, such as heating, cooling, rapid refrigeration or SO2 fumigation treatment, have been applied in the past to inhibit enzymatic browning and pathological diseases and, at the same time, to maintain the organoleptic quality of the fruit [18,19,20,21]. Recent studies show that the use of fumigation with SO2 causes altered taste, the deposition of undesirable substances on the peel, and health risks to producers, distributors and consumers [11]. Furthermore, one of the global challenges includes the implementation of the use of natural alternatives to synthetic treatments that are simple to apply and can be considered safe for the global litchi industry [22,23,24]. Among the possible means to be used, there is dipping in citric and ascorbic acids only or in combination with other agents, such as chitosan [25] and oxalic acid [26], or the use of a controlled (CA) or modified atmosphere (MAP) [27,28] to improve the shelf life of products [22,29,30,31,32,33]. As for the MAP technique, it proves to be decisive in reducing the respiration rate of the fruits and thus their degradation and inhibits the proliferation of aerobic bacteria [32,33,34,35], thanks to the suitable combination of food gases, such as nitrogen (N2), oxygen (O2) and carbon dioxide (CO2). It has also been shown that CO2 exerts actions on the density of bacterial and viral populations and simultaneously on the expression of the toxin genes of some food pathogens [36]. MAP is a useful technology that can be considered effective in managing browning and preserving the overall quality of products [31,32]. MAP is considered commercially suitable as it is relatively more economical and has no damaging effects on the packaged products [37]. It also maintains higher relative humidity, contributes to the prevention of enzymatic browning, and inhibits the development of microbial spoilage during the postharvest storage of fruits and vegetables [38]. Furthermore, due to the absence of certain toxic residues, MAP technology has managed to gain public acceptance. It has been reported that MAP in combination with antimicrobials [24], chitosan coating [39] and 1-methylcyclopropene [40] has been used to manage the browning of harvested litchi fruits. However, several studies have been conducted on the impact of MAP on the control of decay and the biochemical characteristics and activities of the POD and PPO enzymes of litchi fruits without considering the shelf life of the fruits and the problem of increased food waste if these products are not marketed before their aesthetic deterioration. The aim of the present work was to study the effects of MAP on epicarp browning and loss of texture, two of the most important factors affecting consumer choice, and to consider the food safety of the fruits, with the aim of increasing their shelf life. Therefore, different gas mixtures were used during 9 days of cold storage at 5 ± 1 °C and 90 ± 5% of relative humidity (RH).

2. Materials and Methods

2.1. Vegetal Material

Four kg of litchi fruit (Litchi chinensis Sonn. cv Kwai Mai) were taken from the ‘COLLURA’ farm (38°03′30.0″ N 14°36′40.9″ E) in Sant’Agata di Militello (ME), Sicily. In total, 200 fruits were picked at commercial harvest, using skin color as an index of maturity [41,42]. Litchi fruits of regular shape and uniform size without any defects were selected. The fruit were harvested at commercial maturity from a homogenous size and checked for biotic or abiotic changes on the peel. Commercial maturity was assessed based on the ripening index (MI), which, as reported by Underhill and Wong [43], recommends a Brix°: total acid ratio of at least 40 for harvesting. The samples were previously sanified using a 2% sodium hypochlorite solution for 20 min and then allowed to dry.

2.2. Experimental Design

Fruits were divided into four subsamples (50 fruits per group) and submitted to the following treatments:
MAP 1 (10% O2 + 20% CO2 + 70% N2);
MAP 2 (20% O2 + 20% CO2 + 60% N2);
MAP 3 (5% O2 + 20% CO2 + 75% N2);
CTR (control sample).
Each of the four lots was divided into three replicates of 100 g of fruits per bag. After treatment, the fruits were sealed in polyamide/polyethylene (PA/PE) bags composed of PA 80% and PE 20%, 90 µm in thickness and 500 cm3 in volume, with an oxygen permeability of 47.6 cm2/(m2 day atm) and a water vapor transmission rate of 3.9 g/(m2 day atm), according to Tinebra et al. [44]. The bags were cold stored at 5 ± 1 °C and relative humidity of 90 ± 5% for 9 days. Every three days (d0, d3, d6, d9), physical, chemical, microbiological, nutritional, pathological and sensory analyses were performed.

2.3. Daily Pathological Surveys

Surveys were carried out for a period of 9 days and consisted of a visual evaluation of symptoms (lesions) and signs (molds) on each fruit. The contamination level was assessed according to an empiric classification suggested by Saleh and Al-Thani [45]:
No decay (N.D.): healthy fruit, level 0;
Slight decay (S.D.): 1–4 lesions (spots), level 1;
Moderate contamination (M.D.): 5–10 lesions, level 2;
High decay (H.D.): more than 10 lesions (fruit covered with spots), level 3.

2.4. Decay Index (DI)

The decay index was evaluated according to the methodology by Morcia et al. [46], Barrera Bello et al. [47] and Perdones et al. [48]. The physical damage due to the presence of fungi and, therefore, the peel deterioration was visually evaluated and calculated through the following Equation (1):
D I = 1 n + 2 n + 3 n + 4 n   N
where n is the number of fruits classified for each level of contamination, and N is the total number of fruits analyzed for each treatment in the considered interval.

2.5. Peel Color

A Minolta colorimeter (Chroma Meter CR-400, Konica Minolta Sensing Inc., Tokyo, Japan) was used to evaluate the peel color change. The color space is shown as follows: brightness (L* value), redness (a*) and yellowness (b*), using the CIELAB L*a*b* system.
Prior to the analysis of the samples, the instrument was calibrated using a standard white plate. In addition, with the values of L*, a* and b*, the browning of the litchi was calculated using the formulas of Ruangchaket and Sajjaanantakul [49] Equation (2):
B I = 100   x 0.31 / 0.17
where x = (a* + 1.75L*)/(5.645L* + a* − 0.3012b*)

2.6. Soluble Solids Content (SSC) and Titratable Acidity (TA)

The juice was extracted from the litchi by means of a centrifuge (Ariete, Florence, Italy), and it was used to determine the SSC (expressed as °Brix) using a digital refractometer (Atago Co., Ltd., Tokyo, Japan). The titratable acidity (TA, expressed as g of malic acid per L) was determined using a Crison compact titrator pH meter (Crison Instruments, SA, Barcelona, Spain). Titration was carried out to a pH point of 8.2, using 5 mL of juice diluted with 50 mL of distilled water.

2.7. Firmness (F)

Fruit firmness was assessed using a texture analyzer TA.XTplus (Stable Microsystems, Ltd., Surrey, UK) with a load cell of 25 kg and test speed of 0.5 mm/s. Texture was evaluated on 5 fruit × 3 replicates.

2.8. Maturity Index (M.I.)

It was determined through the following equation described by Peralta-Ruiz et al. [50]:
M I = S S C T A

2.9. Proximate Analysis

Chemical composition of the flesh was determined through the AOAC (Association of Official Analytical Chemists) methods [51] in terms of water content and total sugar content. Potassium (K), sodium (Na), calcium (Ca) and iron (Fe) were determined using atomic absorption spectroscopy following wet mineralization, while phosphorus (P) was determined using a colorimetric method [52,53].

2.10. Vitamin Analysis

Thiamine (Vit. B1), Riboflavin (Vit. B2), Niacin (Vit. B3) and Ascorbic Acid (Vit. C) were extracted and determined according to previously reported methods. Vit. B1, B2 and B3 were extracted using 0.1 N HCl [54] or a solution of 1% (v/v) H2SO4 [55]. Quantification was performed via HPLC equipped with a fluorometric detector [54,55]. Finally, Vit. C was extracted with 10 mL of 1% (v/v) HPO3 for 45 min from dried extract previously prepared. After filtration, 1 mL was mixed with 9 mL of C12H7NCl2O2, and the absorbance was measured at 515 nm against a blank after 30 min. Vitamin C was quantified using a calibration curve of authentic L-ascorbic acid (0.02–0.12 mg/100 g). All analyses were performed in triplicate, and data were expressed as mg per 100 g [53].

2.11. Organic Acid Analysis

Organic acids were extracted according to the procedure of Ding et al. [56]. One gram of frozen tissue was ground in 3 mL of 95% (v/v) ice-cold methanol, and the mixture was shaken for 10 min and filtered. The pellet was twice more extracted and with 3 mL of 80% (v/v) ice-cold methanol each time. The filtrate collected was combined and evaporated under vacuum at <35 °C until the methanol was removed. The residue was dissolved in 25 mL water; the solution was then centrifuged to remove undissolved materials. One milliliter of supernatant was passed through a 0.45 μm membrane filter, and the filtrate was then analyzed using high-performance ion-exchange chromatography (HPIC, Dionex Ultimate 3000, Dionex Corp., Sunnyvale, CA, USA) according to the method of Chen et al. [57].

2.12. Microbiological Analysis

The hygiene and safety aspects of CTR and MAP-treated litchi fruits were evaluated using plate counts. Each fruit (15 g) was firstly homogenized by a stomacher [58] and then serially diluted to a ratio of 1:10 [59]. Cell suspensions were plated on selective agar media to allow the development of total mesophilic microorganisms (TMMs) on plate count agar (PCA) (Biotec, Grosseto, Italy) incubated at 30 °C for 72 h; Pseudomonas spp. on Pseudomonas agar base (PAB) (Condalab, Madrid, Spain) incubated at 25 °C for 48 h; yeasts on yeast peptone dextrose (YPD) agar (Sigma-Aldrich, Milan, Italy) incubated at 30 °C for 48 h; molds on potato dextrose agar (PDA) (Microbiol Diagnostici, Uta, Italy) incubated at 25 °C for 7 d; members of the Enterobacteriaceae family on violet red bile glucose agar (VRBGA) (Condalab) incubated at 37 °C for 24 h; Escherichia coli on Coliform Chromogenic Medium (CHROM) agar (Condalab) incubated at 37 °C for 24 h; Salmonella spp. on Hektoen enteric agar (HEA) (Microbiol Diagnostici) incubated at 37 °C for 24 h; and Listeria monocytogenes on Listeria selective agar base (LSAB) (Oxoid, Hampshire, UK) incubated at 37 °C for 24 h.
All plate counts were performed using the spread plate method, except those for the members of Enterobacteriaceae family, which were plated using pour plate [44]. Microbiological analyses were carried out in triplicate at each sampling time.

2.13. Sensory Analysis

Ten semitrained judges with extensive experience in the sensory evaluation of food performed a hedonic liking test on litchi fruit previously prepared for sensory analysis. The method used a 9-point hedonic scale (1 = ‘extremely disliked’, 5 = ‘neither liked nor disliked’, 9 = ‘extremely liked’) [22,60]. The panel test consisted of a total of 15 parameters: flesh color (FC); firmness (C), fruity odor (FO), exotic fruit odor (EXO), off-odor (OFO), sweet (S), acid (A), juicy (J), astringent (AS), pungent (PU), fruit flavor (FRF), exotic fruit flavor (EXF), alcohol flavor (ALF), off-flavor (OFF) and overall evaluation (OVE). These parameters were chosen for the sensory analysis of litchi fruit at day 0 (as fresh fruit) and after 3, 6 and 9 days of cold storage and were performed both for treated and untreated samples. Furthermore, at the end of each tasting, a glass of water was provided to the consumers to rinse their mouths.

2.14. Statistical Analysis

All data collected, presented as mean ± standard deviation (SD), were subjected to statistical analysis according to an experimental factorial scheme with 5 repetitions (n = 5), using the statistical package Minitab 17.1 (Minitab Inc., State College, PA, USA, 2013). For each experimental variable, the analysis of variance (ANOVA) was performed, and significant differences among mean values were appreciated using Tukey’s test at p ≤ 0.05. For each treatment, different letters indicate significant differences between sampling dates.

3. Results

3.1. Daily Pathological Surveys and Decay Index (DI)

The visual observation of both the CTR and treated litchi fruits was carried out throughout the course of the experiment (d0; d3; d6; and d9) to assess the possible presence of pathogenic microorganisms on their epicarp. As shown in Figure 1, the different treatments best preserved the fruit during the experiment, acting as an inhibitory medium against pathogens. We can see an increase in the appearance of pathological lesions from day 6 of storage onwards (d6). This was more visible in the CTR fruits than in the MAP-treated fruits. The MAP 3 treatment (5% O2 + 20% CO2 + 75% N2) provided the best results in controlling decay; this treatment showed no lesions or signs for the entire duration of storage. Currently, synthetic fungicides, chemical preservatives and fumigation with sulphur dioxide (SO2) are the most popular methods of delaying fruit decay and prolonging shelf life [61]. However, the use of chemicals has generated increasing public concern over the potential risks to human health and environmental pollution. Furthermore, as reported by Sivakumar [62], the pericarp of litchi consists of numerous segments, resulting in a rough surface structure. During storage, spores germinate, penetrate the pericarp of the fruit through microfractures that form during fruit development, packaging operations or transport and subsequently, colonize the surface of the fruit [62]. According to Wang et al. [63], commercial fumigation with SO2 also intensified microfracturing in litchi fruit. Microcracks provide a gateway for microorganisms to colonize the fruit surface [64]. The MAP treatments, therefore, can probably be inferred to have reduced the incidence of microfractures in the fruit and, furthermore, as reported by Hess-Pierce and Kader [65], the incidence of lesions may have been reduced by CO2 exposure. Finally, Palou et al. [66] also found a clear inhibition of fungal growth on naturally infected ‘Wonderful’ pomegranates exposed to 5 kPa O2 and 15 kPa CO2 at 8.9 °C.

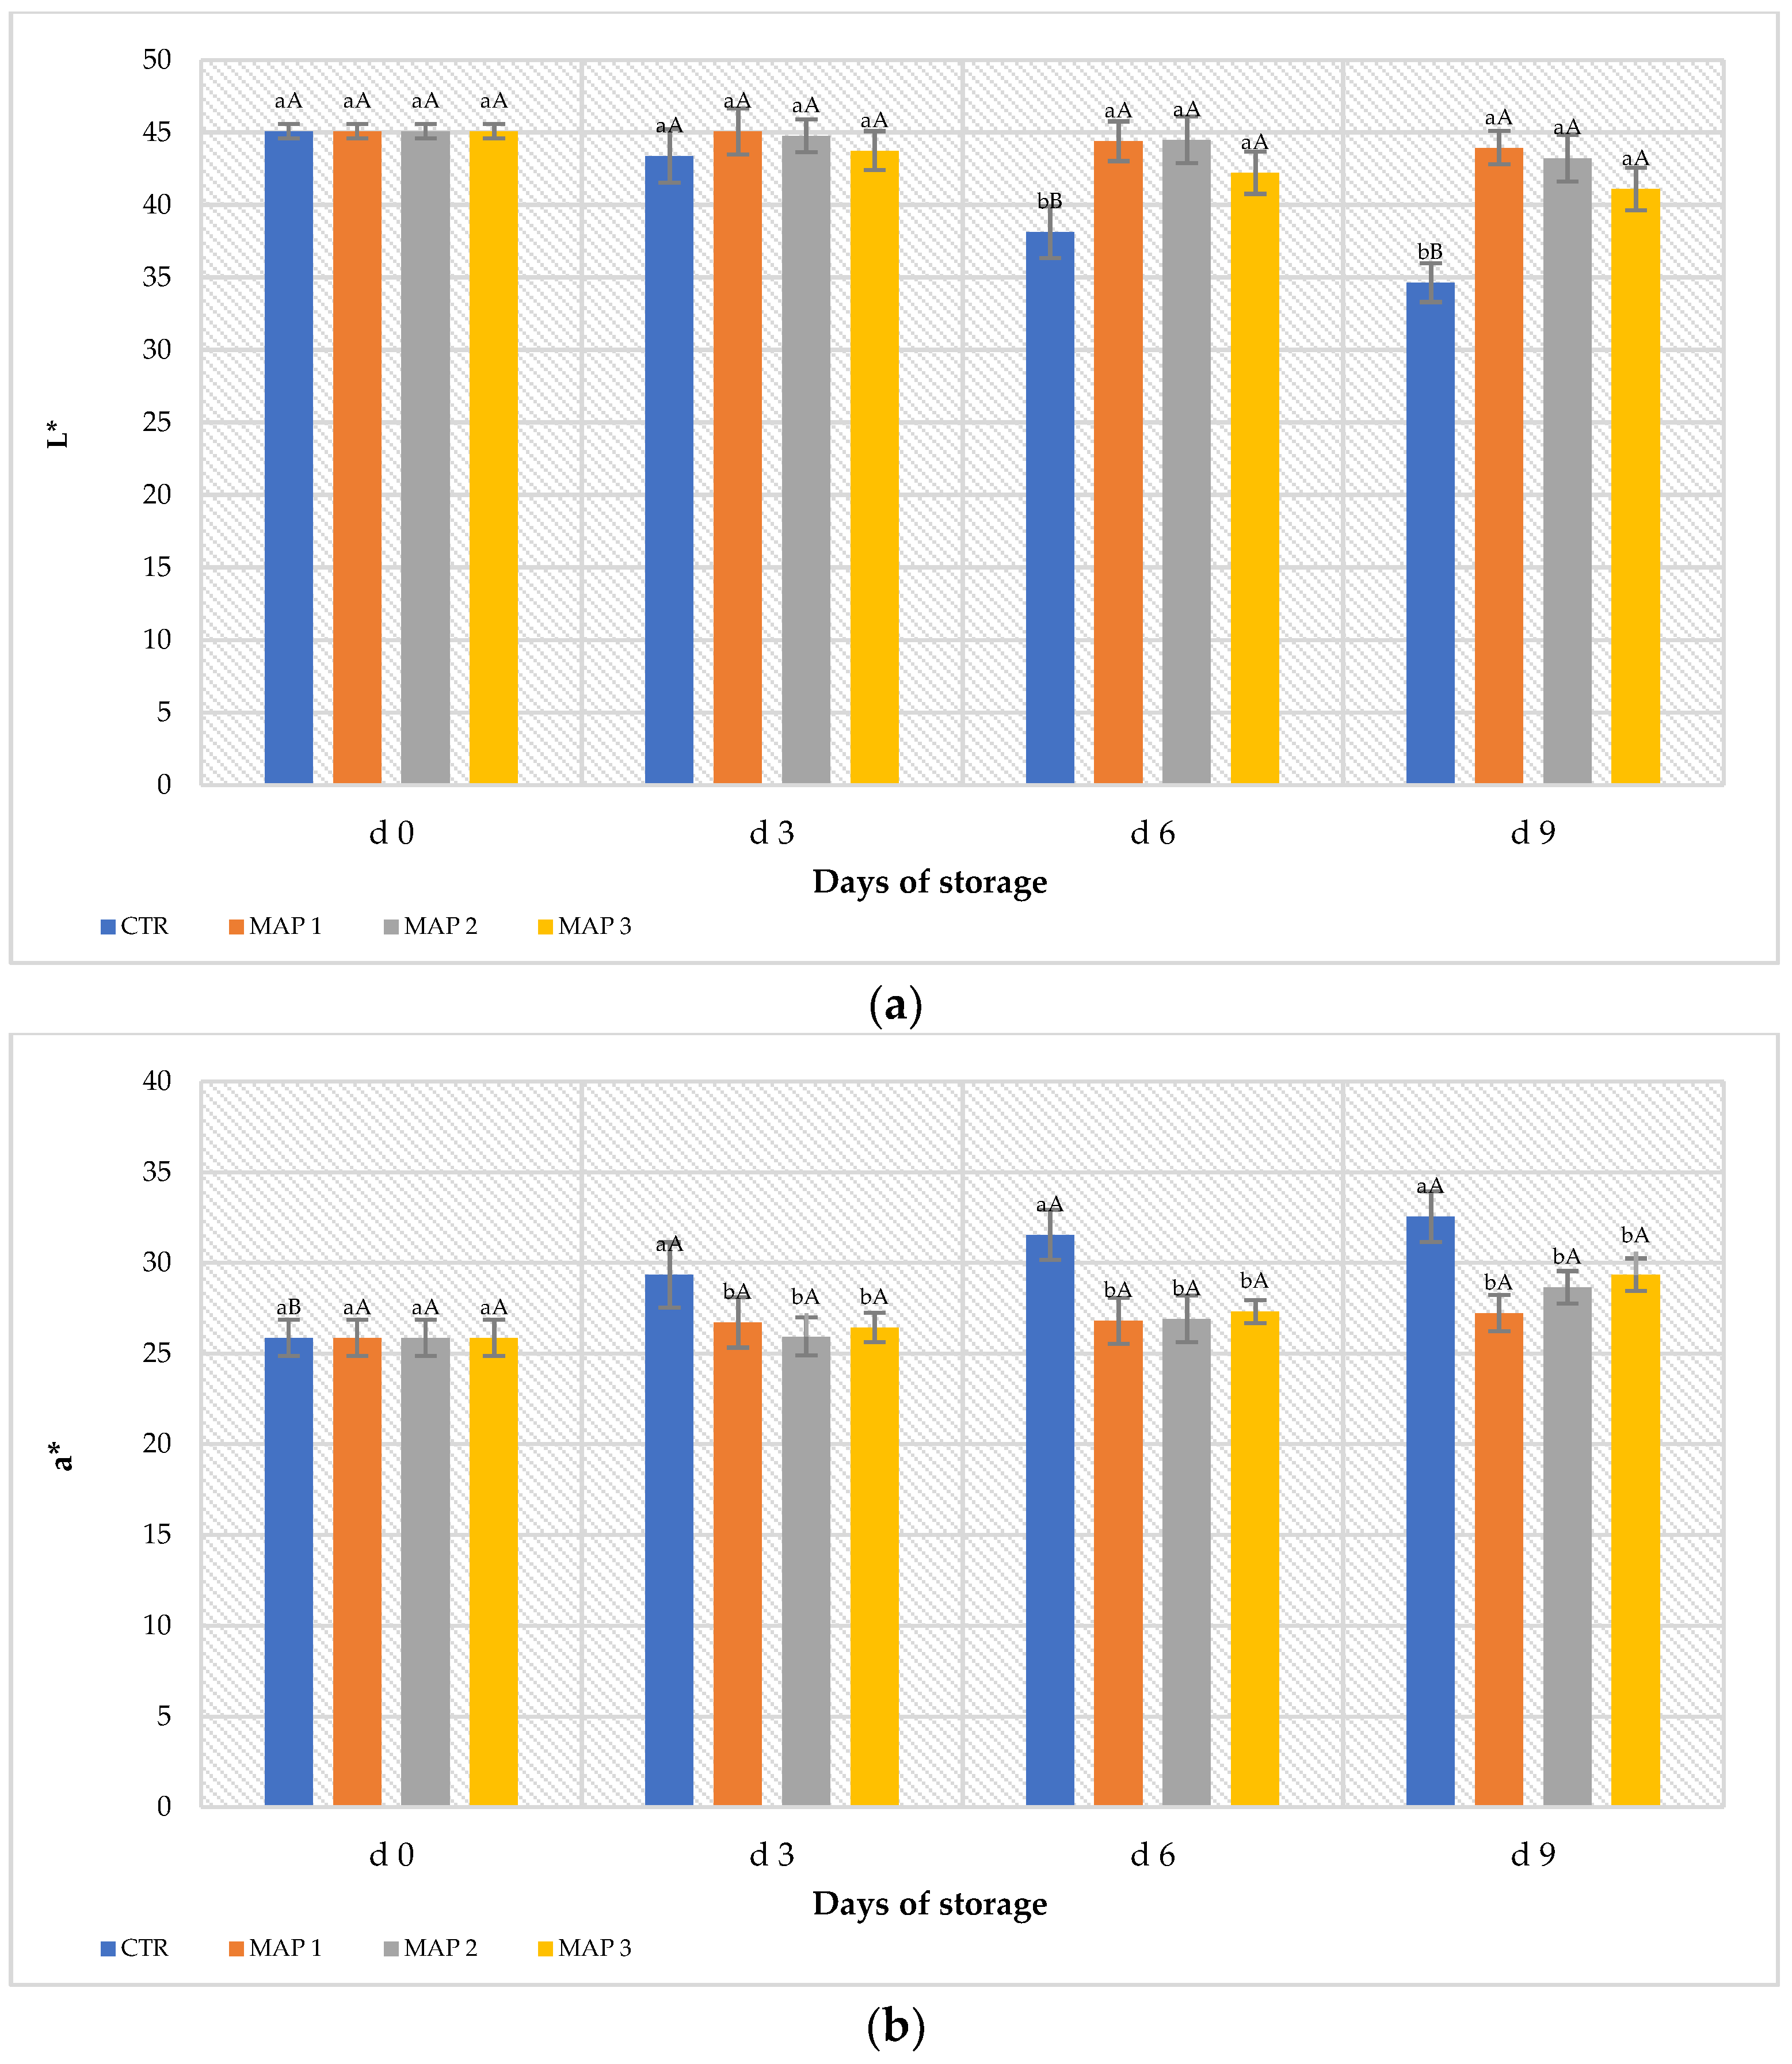
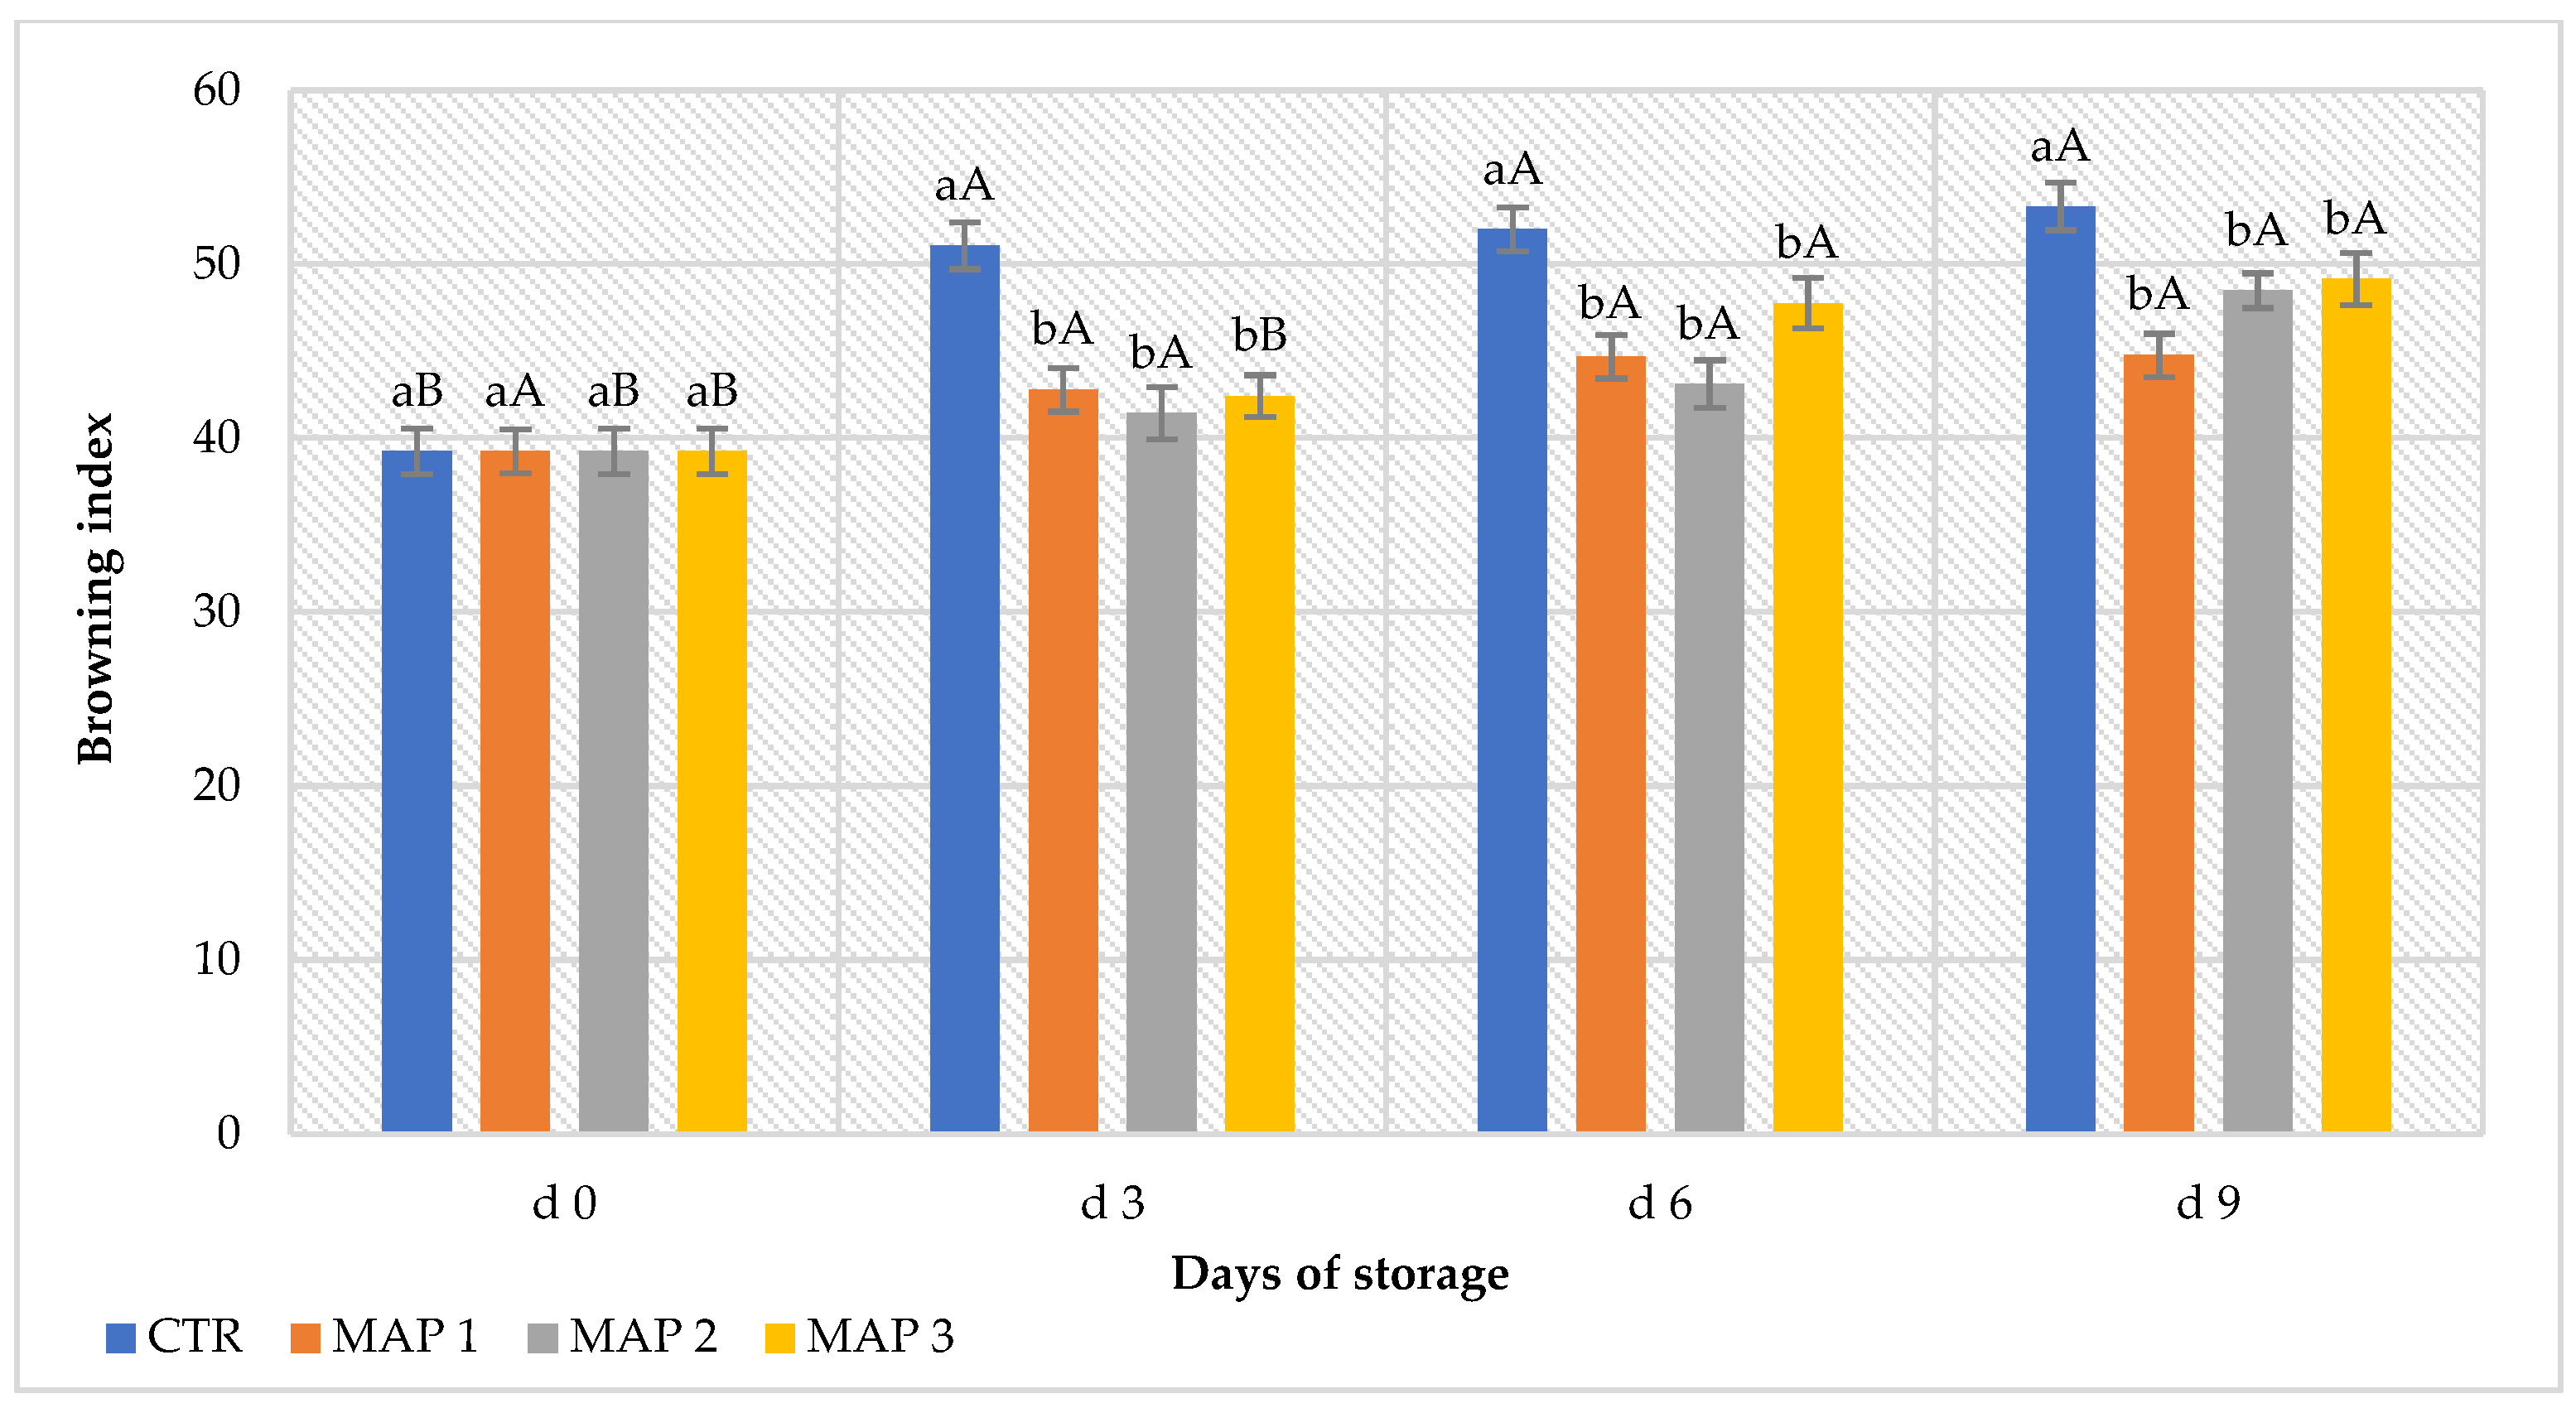
3.2. Peel Color Decay and Browning Index
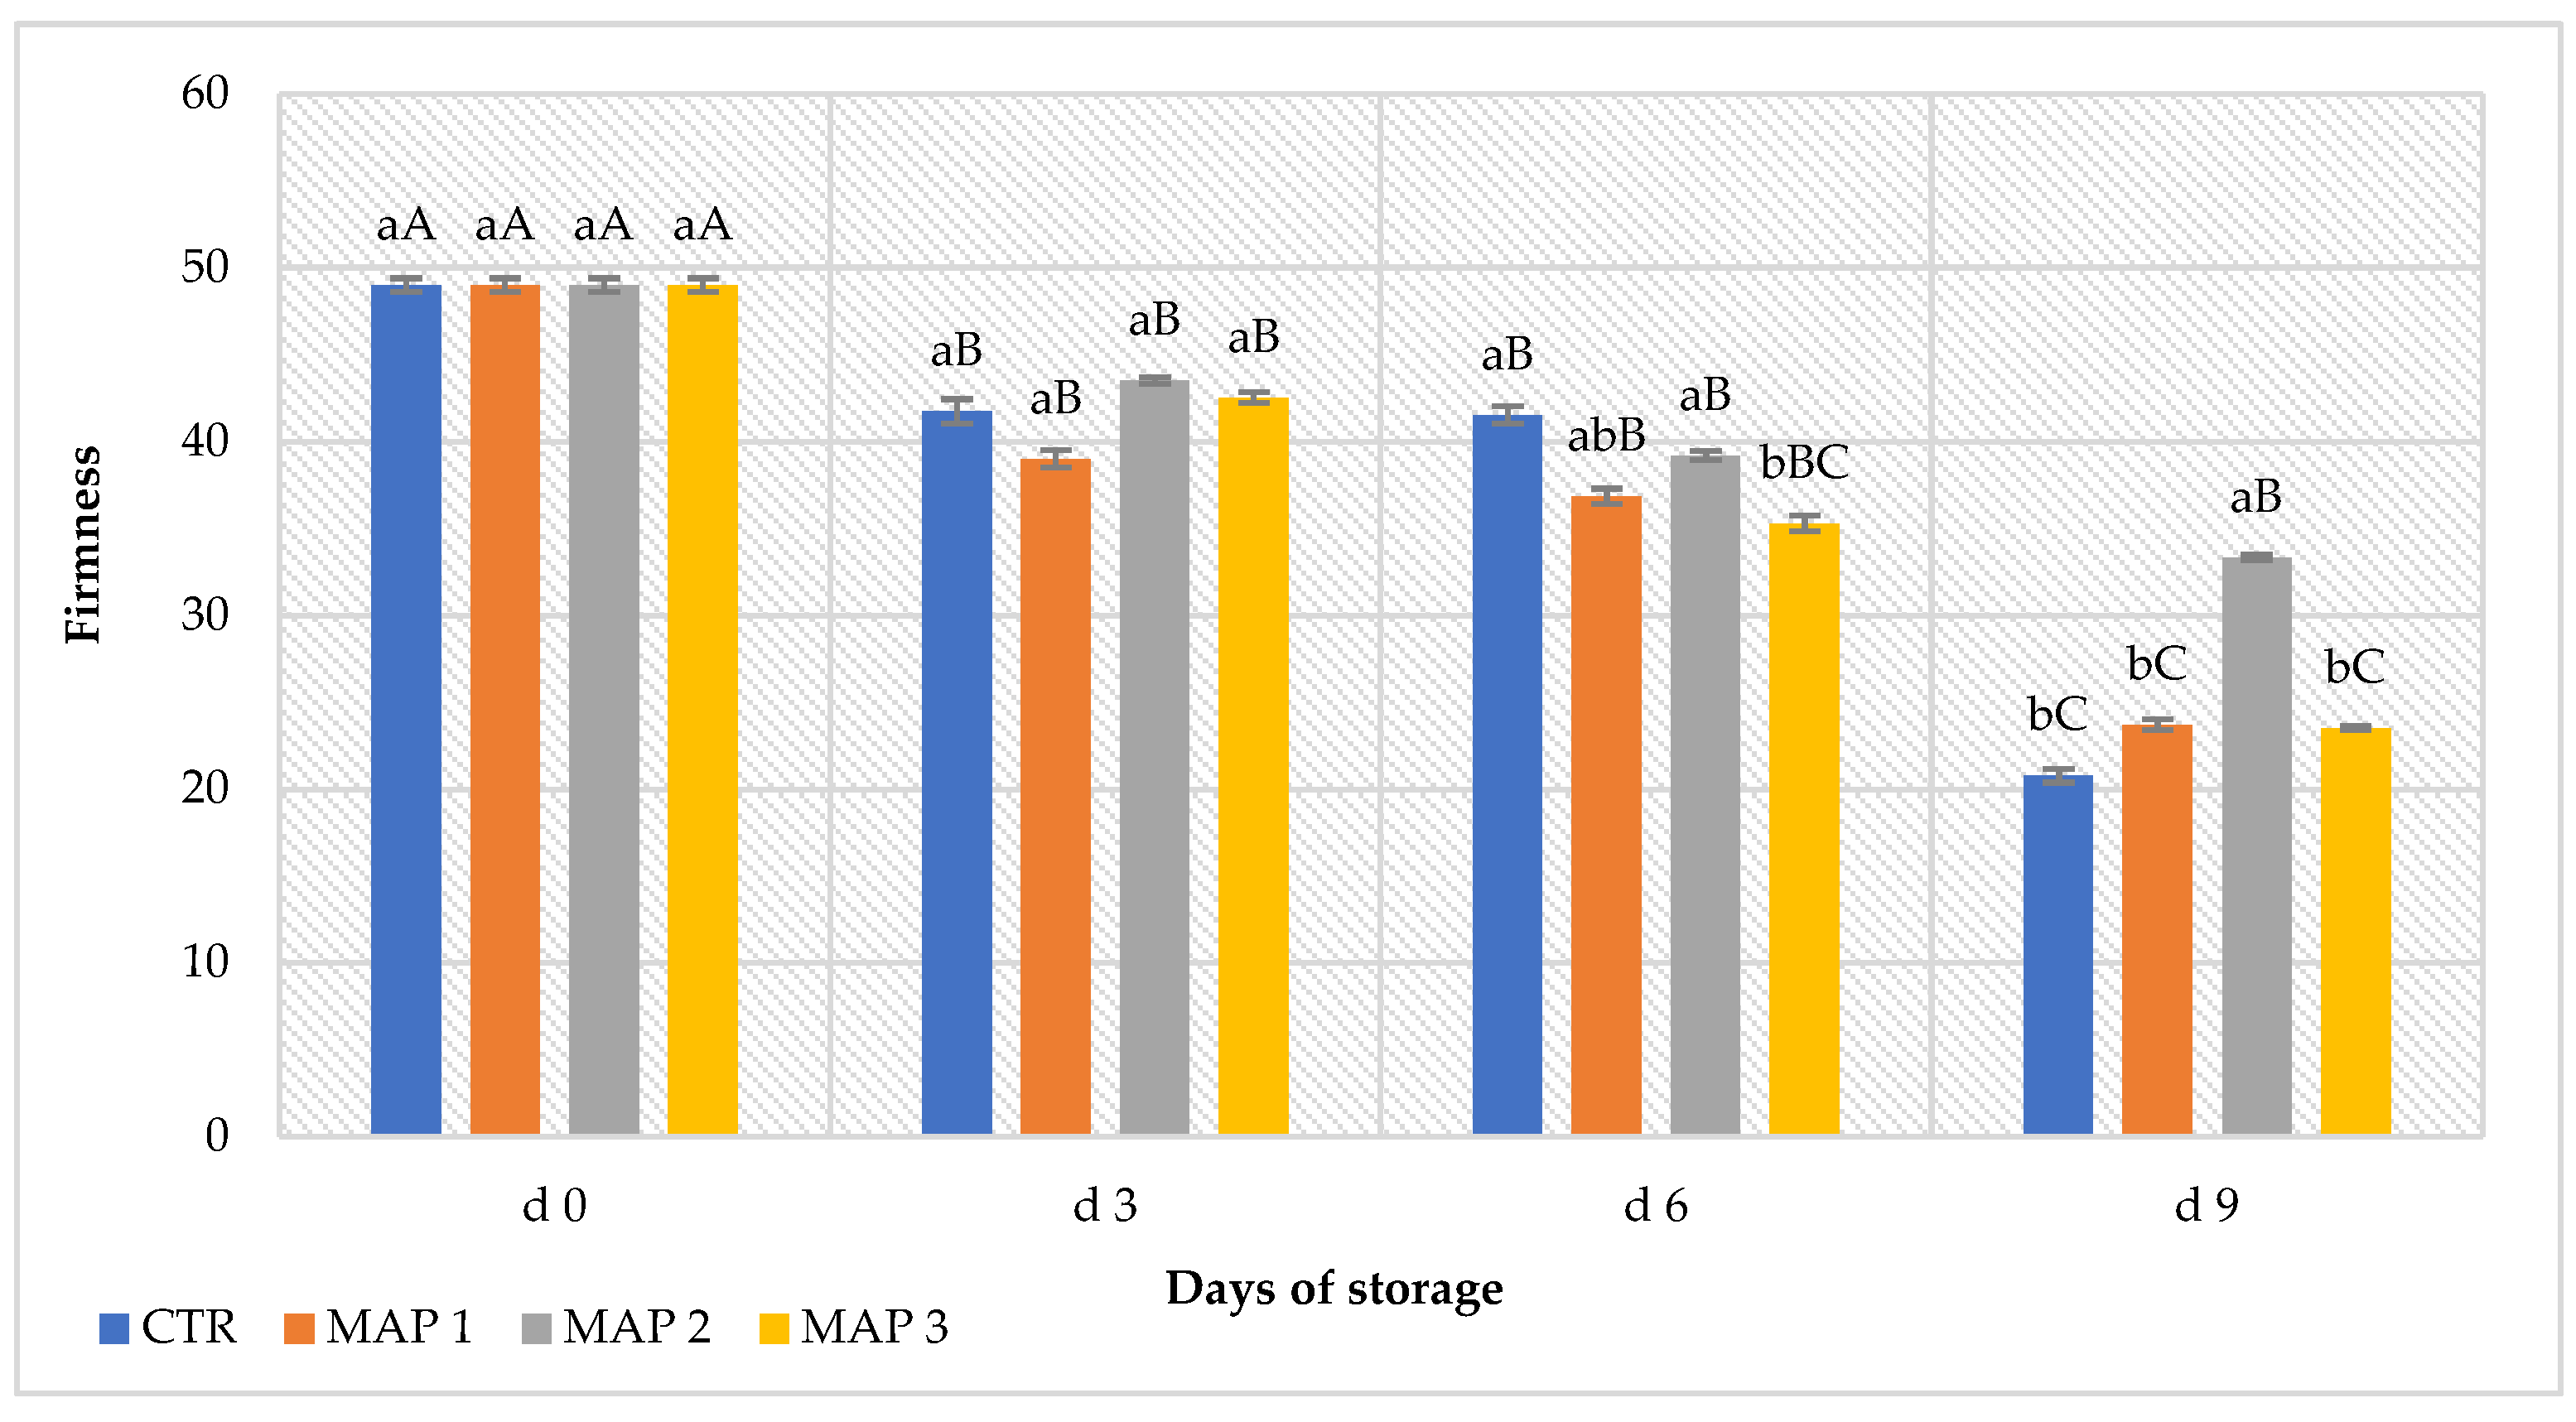
Chromaticity parameters L* and a* in the control and treated fruit underwent changes over the 9-day storage period (Figure 2). As can be seen in Figure 2a,b, compared to the control fruit, slower decreases in L* and a* values were observed in the MAP-treated fruit, suggesting that brightness and redness persisted in the MAP-treated fruit. As we can see from Figure 2b, the parameter a* increased more in the CTR fruits than in the MAP-treated fruits. Moreover, the increase is particularly evident from the sixth day of storage (d6) and was confirmed by analyses of epicarp browning. The typical bright red skin color of these fruits is a commercially important parameter for consumer purchase [67], and postharvest decay and pericarp browning were identified as major problems restricting the expansion of the industry in litchi-exporting countries [11]. These problems are mainly attributed to the degradation of red pigments, oxidation of peel phenols and explosion of reactive oxygen species (ROS) [68]. According to some studies, their red color (a* value) tends to increase, moving into brown tones. Usually, the variation of red is due to the rapid degradation of flavones, carotenoids and chlorophyll [17]. Similar results were obtained in red raspberry and mulberry by studying the degradation kinetics of the anthocyanins of their juice [69,70]. On the other hand, the lowest O2 concentration in the MAP 3 package (5% O2 + 20% CO2 + 75% N2) would seem to relate back to a positive effect on the visual quality of the fruit. The presence of high N2 concentrations, on the other hand, seems to have maintained the initial characteristics of the package. In fact, the CTR bags were gas-free at the end of the storage period, while the bags with MAP 2 (20% O2 + 20% CO2 + 60% N2) were slightly more deflated than the MAP 1 (10% O2 + 20% CO2 + 70% N2) and MAP 3 (5% O2 + 20% CO2 + 75% N2) ones, which were characterized by a higher percentage of N2 in the gas mixture. Browning of the peel in the CTR fruits showed a continuous increasing trend until the end of the storage period (Figure 3). In the MAP-treated fruit, the BI remained at values around 40% until the sixth day of storage (d6). This value then increased slightly in the treated fruit compared to the CTR fruit, which showed a BI value of 60% on the ninth day of storage.
Browning of the pericarp, as a marker of senescence, is a primary factor limiting the quality and shelf life of litchi fruits [9]. In the present study, the lowest O2 concentration in the MAP 3 package (5% O2 + 20% CO2 + 75% N2) would seem to relate back to a positive effect on the visual quality of the fruit. The presence of high N2 concentrations in the MAP, on the other hand, seems to have maintained the initial characteristics of the package by avoiding mechanical damage to the fruit and thus avoiding an acceleration of physiological senescence. The presence of N2 in the bags makes it possible to reduce gas losses and keep the fruits qualitatively better [32]. Furthermore, as oxygen is the receptor for polyphenol oxidase, it appears that the treatment in MAP 3 inhibited its activation because the O2 concentration within the bag was minimal (5%) initially compared to the other treatments and decreased during storage. However, no pulp decay phenomena were activated, as confirmed by the evaluation of the firmness descriptor in the sensory analysis. This phenomenon is probably because the pH remained above 4.5 and, thus, no acetaldehyde, the main contributor toward fermentation processes, was formed [22,71]. A study conducted by Jiang et al. [72] demonstrated that a brief exposure of litchi fruits to high concentrations of N2 inhibits the production of ethanol in a nonsignificant way, while if the same treatment is carried out for 2, 4 or 6 days of storage, the significance of the application of the treatment increases. Similar results were obtained by storing apples and pears at low O2 concentrations [73]. According to Saquet et al. [14], the browning of some fruits could be associated with the elevated concentration of ATP present in the tissues, with a consequent loss of the compartmentalization between the enzymes and their substrates, which causes enzymatic browning. Concerning the flesh quality, the more the surface color darkness, the more it will be characterized by a loss of weight and texture, with an associated loss of organoleptic and sensory quality [74].

3.3. Firmness

Generally, the loss of fruit firmness during the storage period occurs mainly due to the transformation of water-insoluble protopectins to water-soluble pectins [75], regardless of how they are processed. Furthermore, as reported by Sivakumar et al. [11], the loss of firmness in litchi fruits is often associated with water loss. However, during the cold-storage period, firmness decreased. This phenomenon, caused by normal physiological decay processes, showed significant differences (p < 0.05) between the treated and CTR fruits. As highlighted in Figure 4, the firmness of litchi fruits stored in MAP showed no statistically significant differences from the CTR up to 3 days of storage, whereas, starting from the 6th day of storage, substantial decay of this parameter was observed in the CTR fruits and in MAP 1 (10% O2 + 20% CO2 + 70% N2) and MAP 3 (5% O2 + 20% CO2 + 75% N2). In contrast, the treatment in MAP 2 (20% O2 + 20% CO2 + 60% N2) maintained higher firmness values up to the 9th day of storage. In fact, the loss of firmness in litchi in MAP 2 was much slower than in the other treatments and the CTR fruits. The initial firmness (fresh fruit at day 0) was 49.05 N, and it decreased in the CTR by 57.6%, in MAP 1 by 51.6%, in MAP 2 by 32% and in MAP 3 by 52% after 9 days of storage. According to the data obtained, we can confirm that MAP has the advantage of reducing and preventing the loss of firmness and, therefore, weight loss by maintaining a higher RH around the fruit inside the bag that prevents water loss due to transpiration. Similar results were reported by Lemmer and Kruger [76]. Other authors reported that maintaining firmness at low temperatures slowed the respiration rate and organic acid losses during the storage period [61]. In the fruits considered, probably the presence of nitrogen inside the package of MAP-treated fruits inhibited the loss of liquid, maintaining a high firmness and making the fruit appreciable to the panelists (see sensory evaluation).

3.4. Chemical Composition

As shown in Table 1, the content of soluble solids (SSC) and the water content of litchi fruits decreased during storage according to other studies [74]. However, concerning the water content, just the CTR treatment shows significant differences (p < 0.05) between the treated fruit; from d0 to d9, it shows a water content loss from 83.87 ± 0.57 g/100 FW to 80.14 ± 0.07 g/100 FW with a percentage loss in the water content of 4.44%, while the other treatments show no significant differences. These results agree with what was found in the analysis of the evolution of firmness in litchi fruits. In samples with MAP, water loss was minor as the film acted as a barrier between the environment and the fruits. Moreover, fruits rich in MAP show a reduced loss of water, probably, also thanks to the concentration of CO2 inside the bags, which limits the evapotranspiration of the fruits, prolonging their shelf life. Similar results were found in other fruit packaged in a modified atmosphere, such as pomegranate [32,77], mango and pineapple [78], mulberry [33] and others. Moreover, litchi browning was well correlated with desiccation due to the lower RH around the fruit, which affects color retention, results in the loss of membrane permeability and increases browning [79]. Therefore, from the data obtained relating to the evolution of browning and water content, we can state that the MAP technology was able to maintain a high RH by slowing down the senescence of the treated fruits in comparison with the CTR fruits. Concerning the soluble solids content, only MAP 2 (20% O2 + 20% CO2 + 60% N2) remains unchanged during the storage period. Specifically, the SSC increases from day 6 of storage for the CTR, MAP 1 (10% O2 + 20% CO2 + 70% N2) and MAP 3 (5% O2 + 20% CO2 + 75% N2), while in MAP 2, it increases at day 3 of storage and then stabilizes. At day 9 of storage, there is an increase in soluble solids of 16.17% for the CTR, 19.24% for MAP 1, 14.70% for MAP 2 and 23.77% for MAP 3. The MAP 2 conditions were, therefore, more advantageous for the maintenance of the SSC, although an increase in the SSC concentration is physiological in litchi as it corresponds to the progression of ripening [80]. Finally, regarding the maturity index (MI), the CTR fruits experienced an increase (p < 0.05) in this index at as early as 3 days of storage (a 32.20% increase by the ninth day of storage), while for fruits stored in MAP, there seems to have been a slowdown in the rate of ripening, resulting in lower MI values. Specifically, the MAP treatments resulted in an increase in the maturity index of 14.61%, 18.42% and 20% in MAP 1, MAP 2 and MAP 3, respectively.

3.5. Organic Acids

As may be observed in Table 2, the fruits of all the treatments exhibit a reduction in organic acid content during the 9-day storage period, with no significant differences between treatments. Fumaric and malic acids are particularly present in litchi fruits during the entire observation period. The reduction in the concentration of organic acids as ripening progresses reflects the conversion of sugars into acids [81]. Fruit acidification was also observed in litchi stored at low temperatures for 3 weeks [82]. Further support comes from a study on litchi stored at 22 °C in paper or plastic bags [83]. It appears that as the litchi ripens, the sharp drop in sugars and the increase in acidity indicate an altered Krebs cycle function [81]. As reported by Somboonkaew and Terry [84], this could be because organic acids are an important source for general metabolism, including the respiratory cycle of tricarboxylic acid in harvested fruits. Finally, the maintenance of citric acids in the pulp of litchi fruits may be due to the protective O2 barrier or the reduced oxygen supply on the fruit surface that inhibited respiration, both in the CTR fruits, stored in passive packaging, and in MAP-stored fruits [85].

3.6. Proximate Composition

The analysis of the results regarding the proximate composition of litchi fruits, as can be seen from Table 3, shows a concentration of minerals in agreement with that reported by the USDA Nutrient [86]. In general, a decrease in the composition of K, Na, Ca, P and Fe is observed in all treatments and during the entire observation period (9 days). In particular, K undergoes a greater decrease in its concentration in the CTR-treated fruits than in the MAP-treated fruits. In contrast, the composition of the other minerals, Na, Ca, P and Fe, undergoes a decrease during the first 3 days of storage in all treatments and then stabilizes until the end of the observation period. These results confirm what has been reported in the literature, namely that litchi pulp is recommended as a good source of nutrients, such as vitamins and minerals [87].

3.7. Vitamin Composition

Vitamin C content, as can be seen from Table 4, decreased more rapidly in the CTR fruits than in the other treatments (32%). Furthermore, no significant difference was found between the three MAP treatments (a 26%, 28% and 30% loss, respectively). Therefore, a significant difference was only found between the MAP and CTR treatments. This could be because the MAP treatment reduces cell degradation, maintains the fluids inside the fruit and delays all the senescence phenomena of the pulp, keeping inside the pericarp the organic acids, sugars, vitamins and proteins present in the fresh fruit [88]. As can be seen in Table 4, the CTR fruit underwent a much faster decrease in all the vitamin components analyzed, showing a significant difference between the MAP-treated and CTR fruit. The MAP-treated fruits, although they had a decreasing trend during the storage period, remained with higher values and, in the case of thiamine, even stabilized concentrations, especially in MAP 3 (5% O2 + 20% CO2 + 75% N2), until the last day of storage (d9). The most unstable vitamin component, on the other hand, proved to be riboflavin, which suffered a significant peak loss in MAP 3 on the third day of storage, while the CTR did not differ from the MAP treatments throughout the storage period.

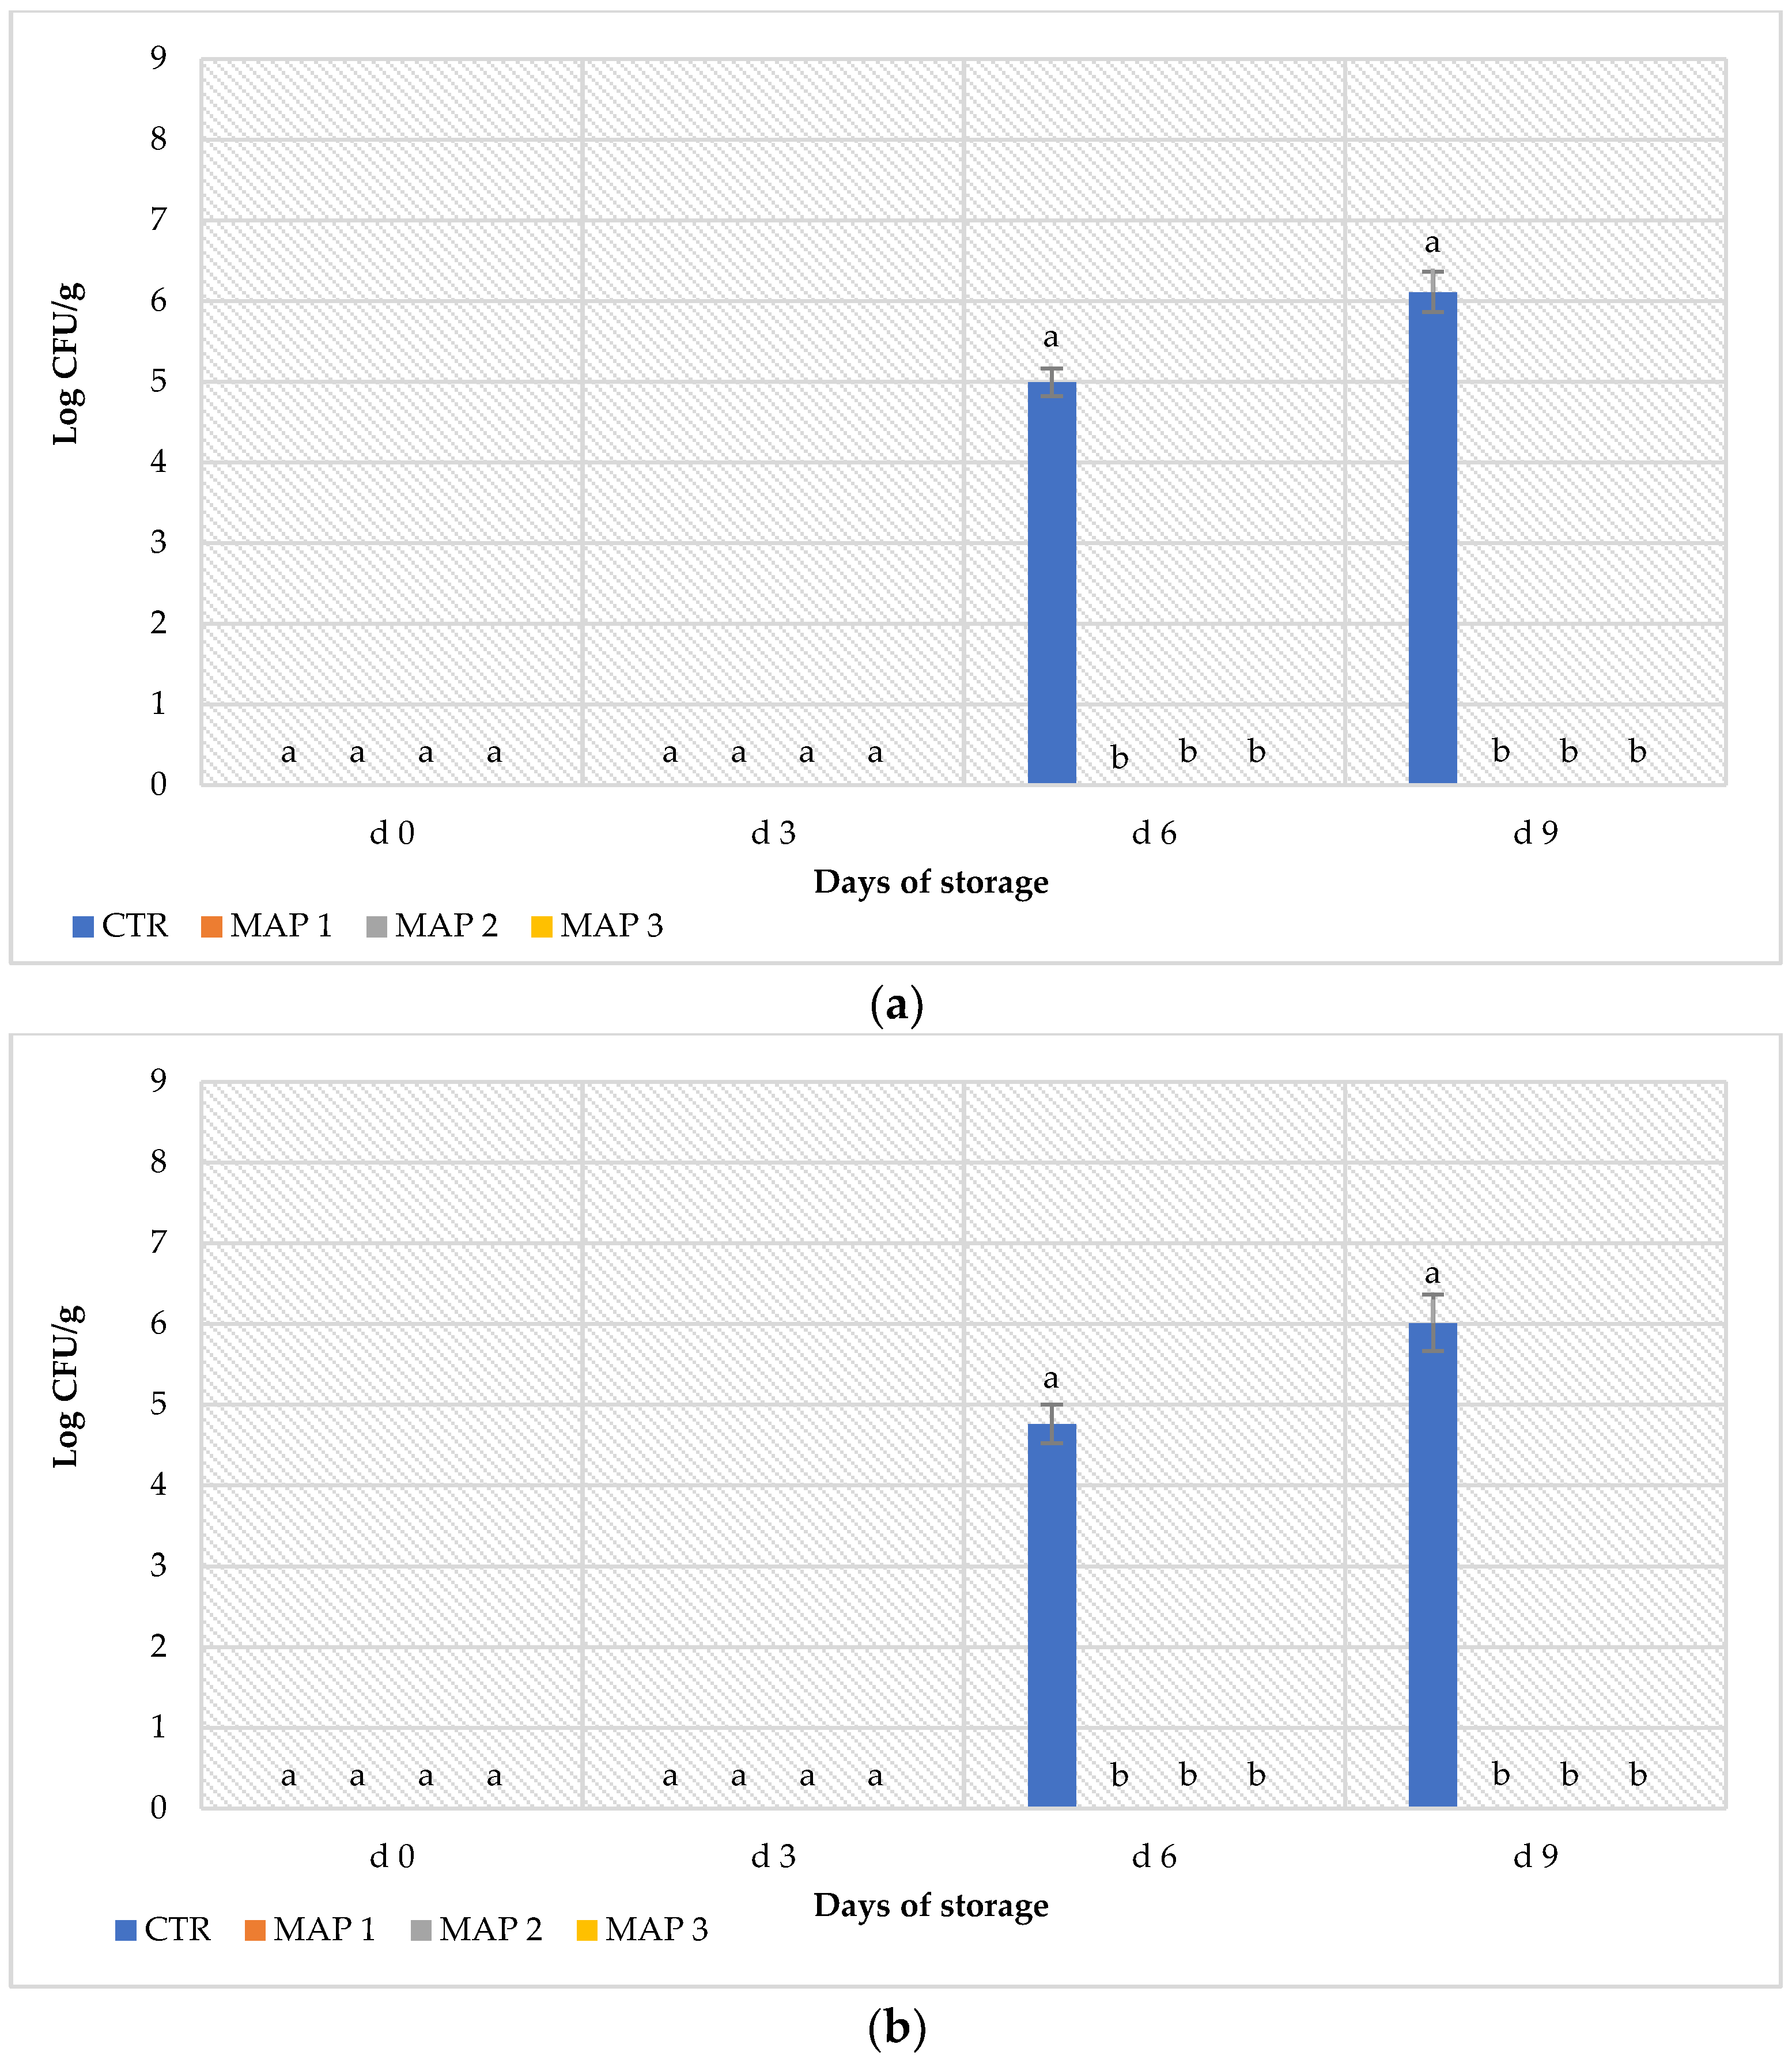
3.8. Microbiological Evolution during Refrigerated Storage

Litchi is a highly perishable fruit due to its susceptibility to different microbial infections determined by bacteria and unicellular and filamentous fungi [42,89]. Therefore, as with all horticultural products, the evaluation of the microbial composition of litchi fruits during cold storage deserves particular attention [90]. Pseudomonas and yeasts, responsible for the physicochemical modification and generation of off-odors and flavors of fruits and vegetables [91,92], were below the detection limit at each collection time. No colonies of Enterobacteriaceae, a family that includes inflammogenic enteric pathogens [93], were detected in any sample object of investigation. The results of the specific search for Escherichia coli, Listeria monocytogenes and Salmonella spp., responsible for food-borne diseases outbreaks [94], did not reveal any colony in either of the samples analyzed. Figure 5a shows the viable counts of TMMs and molds harbored on the CTR and MAP-treated litchi fruits during refrigerated storage. Generally, litchi fruits show an initial amount of TMMs and molds between 102 and 103 CFU/g [95], while in this study, none of the samples analyzed soon after production and after 3 d of refrigerate storage scored positively for the presence of these microbial groups. These results clearly indicated the respect of the food safety and hygiene criteria during the sanification and manipulation of litchi fruits. Significant differences (p < 0.05) were found from the third sampling time (6 d) for the levels of TMMs (Figure 5a) and molds (Figure 5b) among the CTR and MAP-treated litchi fruits.
These microorganisms were found at about 105 CFU/g in the CTR production and reached levels of 106 CFU/g after 9 d of refrigerated storage, exceeding the threshold recommended for human consumption [96,97]. Interestingly, the development of TMMs and molds were inhibited in all MAP-treated litchi fruits, confirming the ability of this treatment to extend the shelf life of fresh food [98]. To our knowledge, no previous work has evaluated the microbiological aspects of MAP-treated litchi fruits, and for this purpose, any comparison with the literature data is not possible. However, the absence of TMMs and molds in all MAP samples can be explained by the presence in these packaging systems of 20% of CO2, which is able to inhibit microbial growth [99].

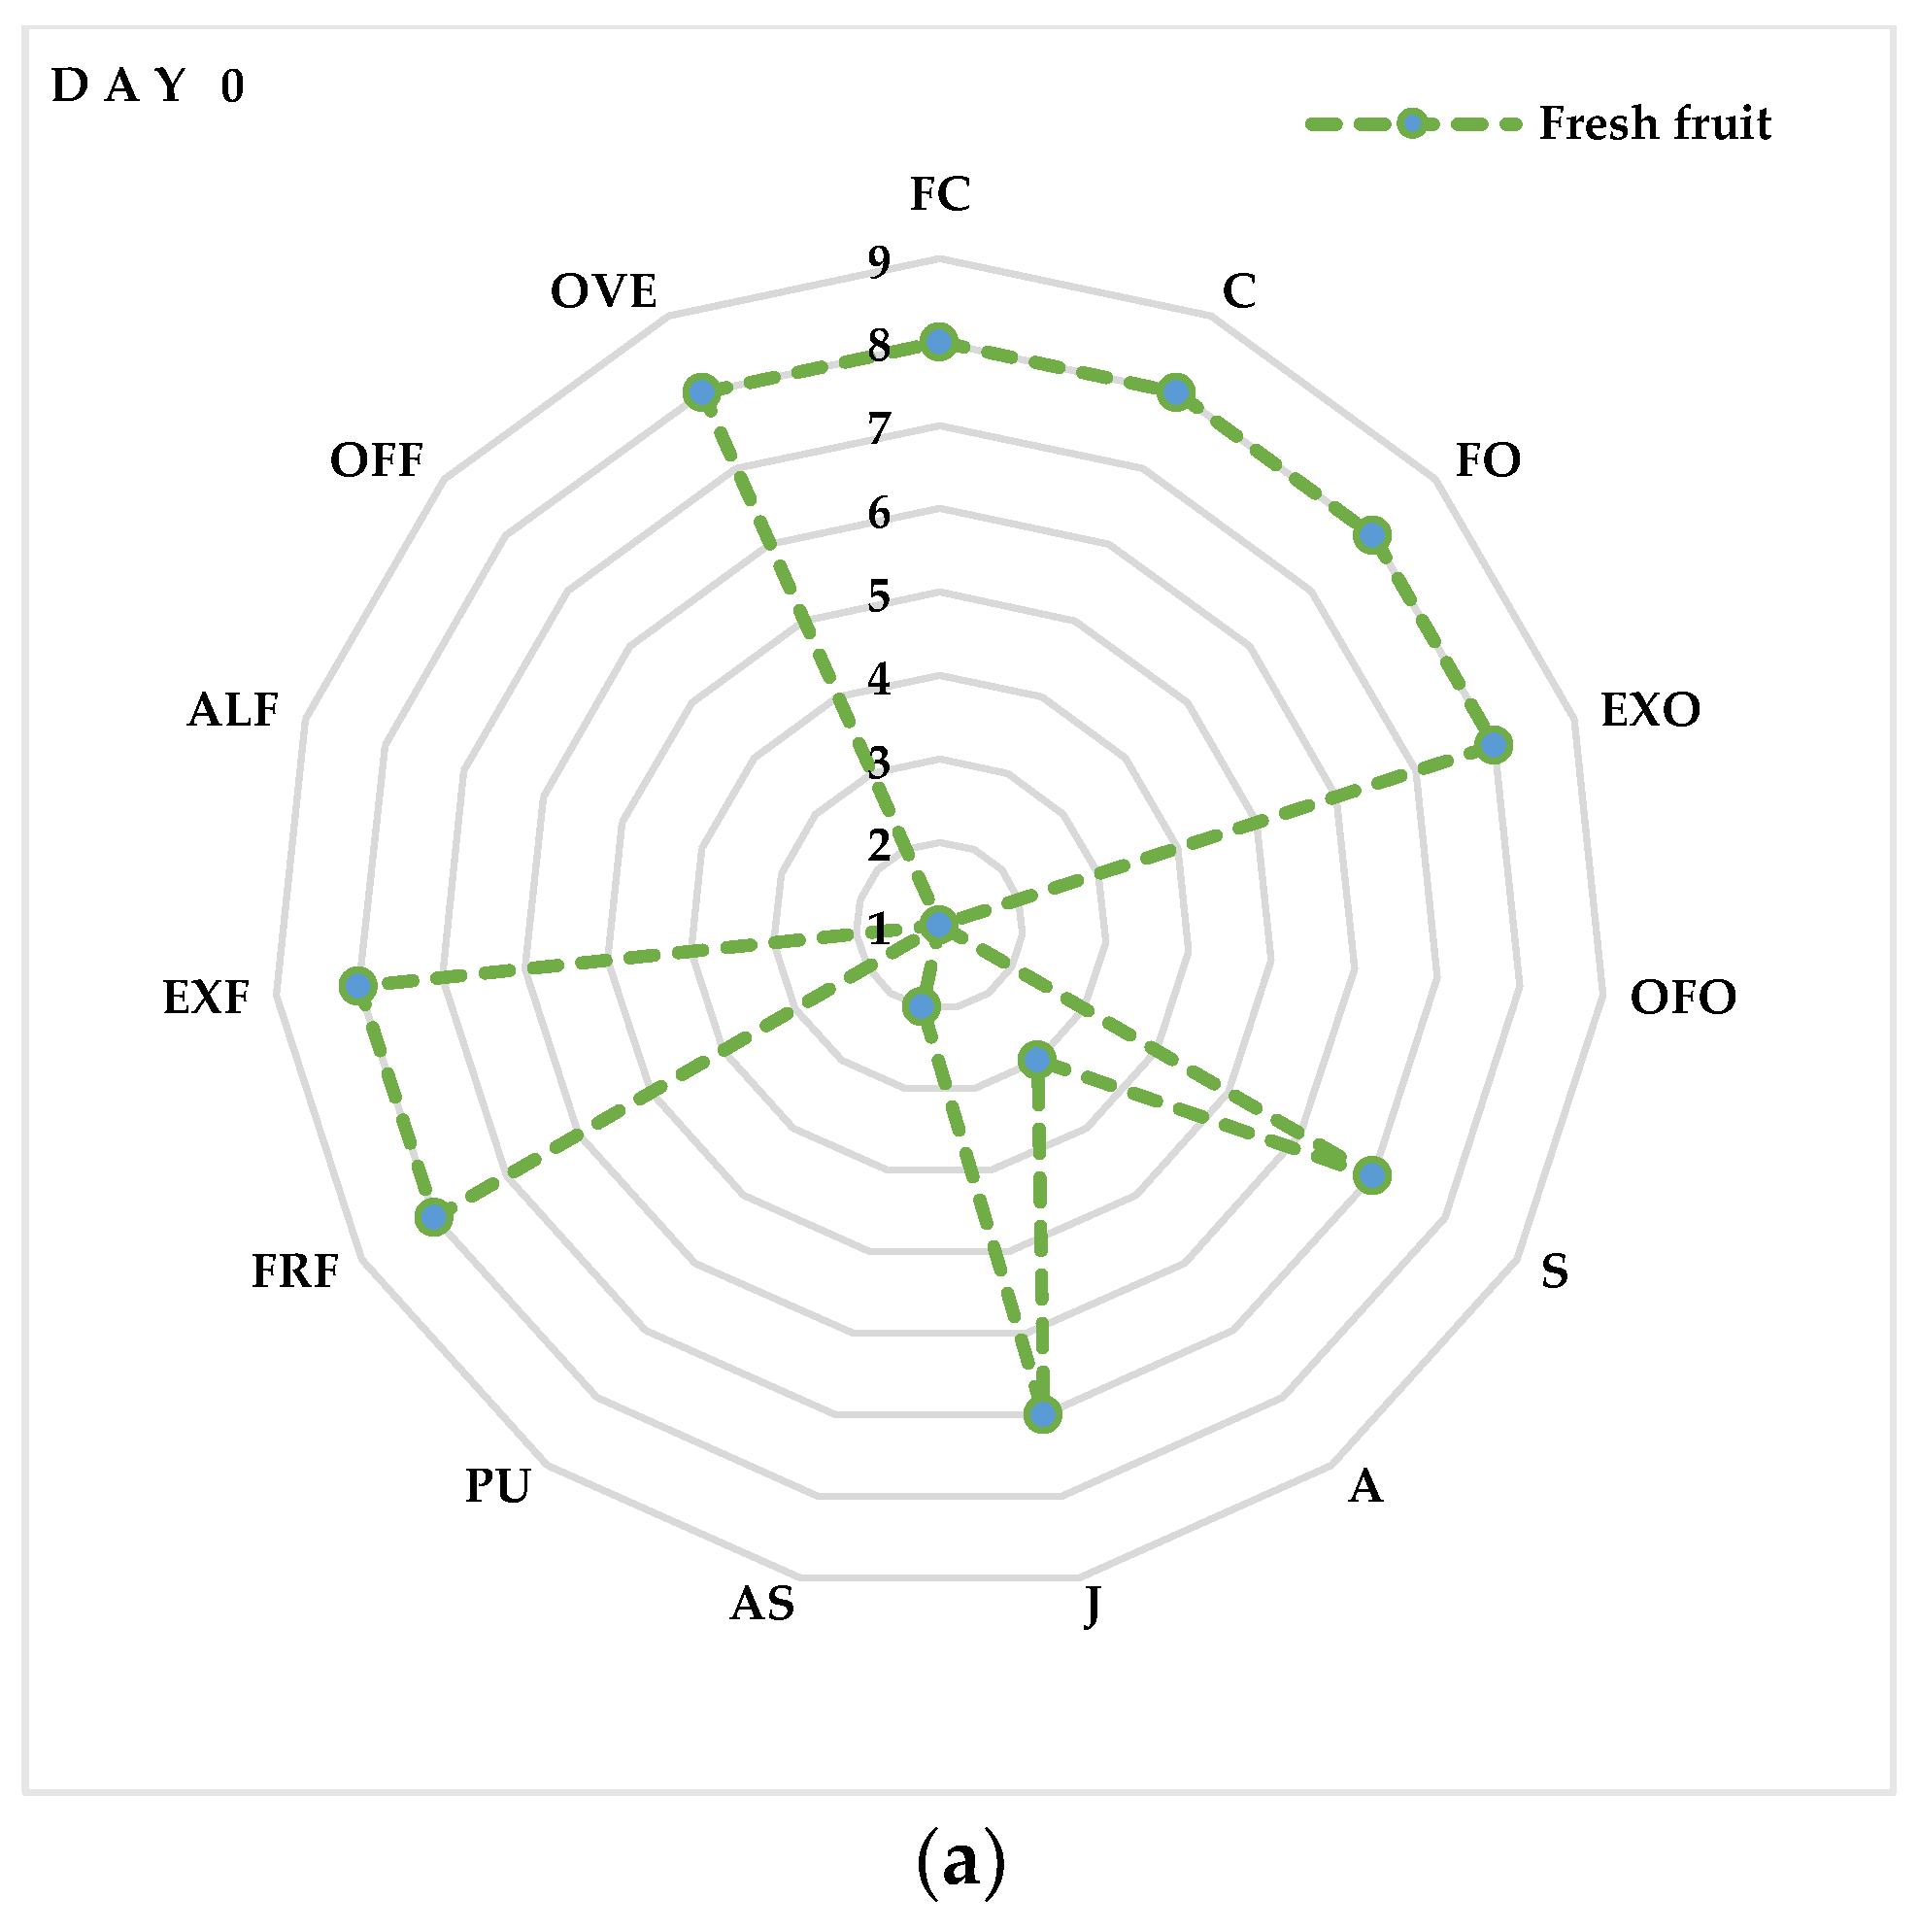
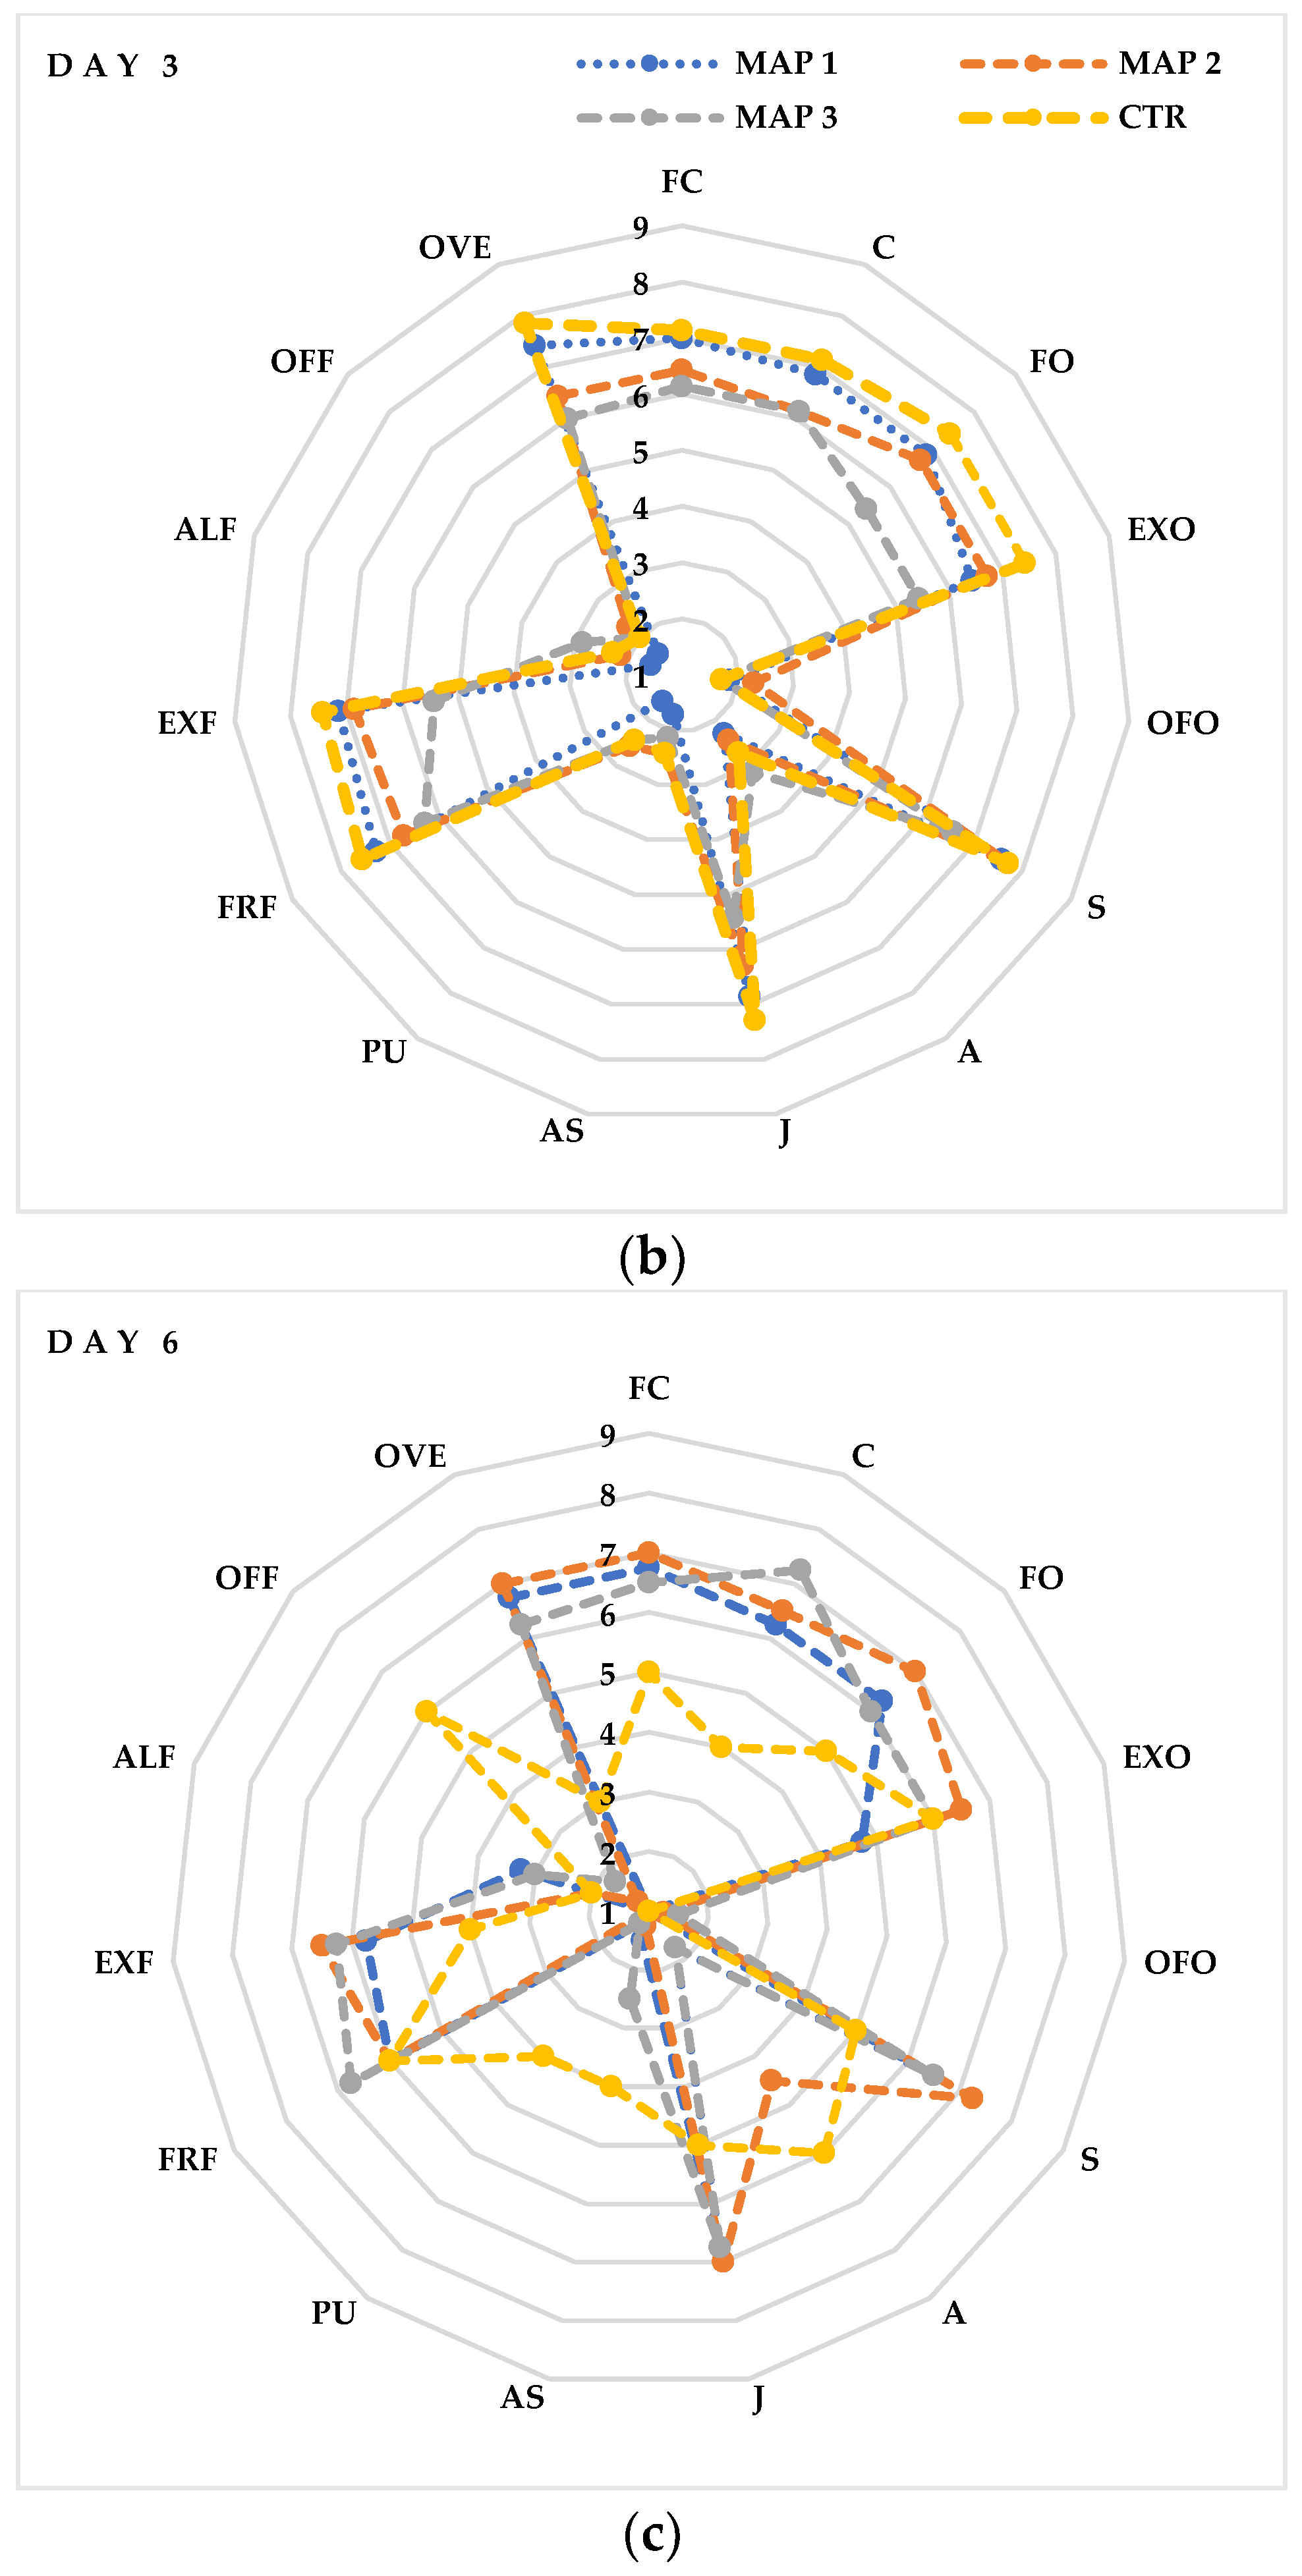
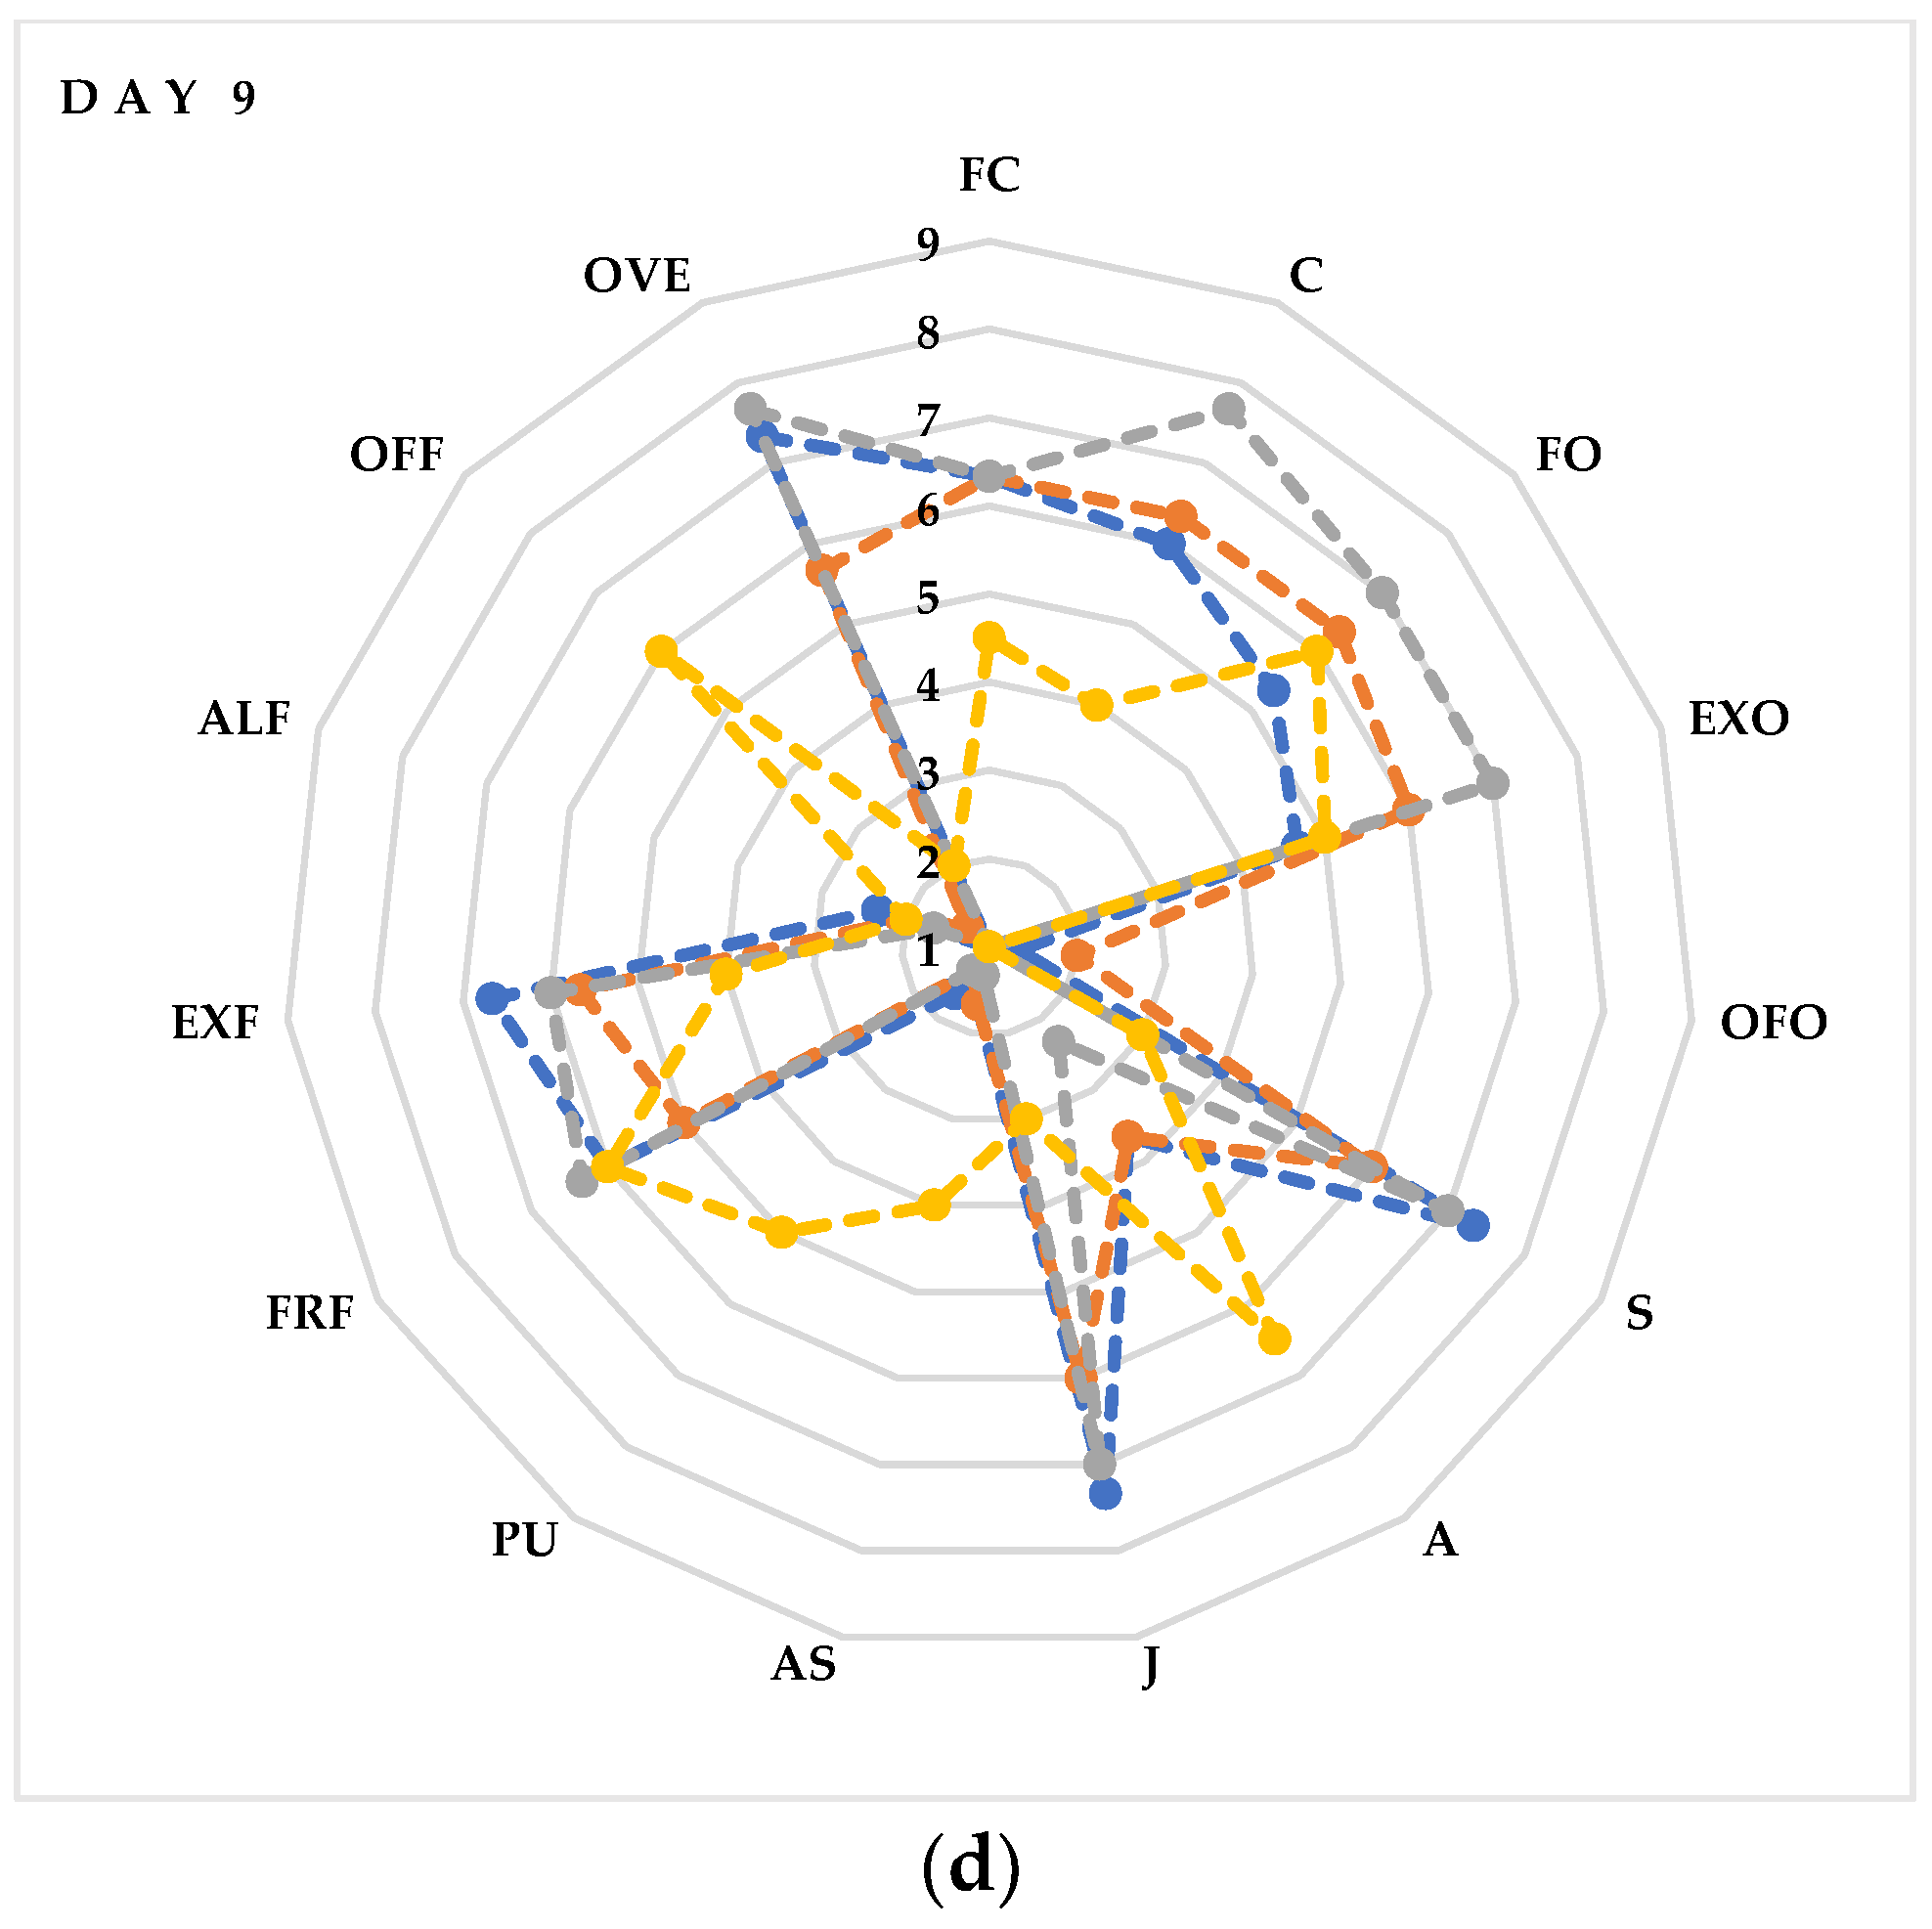
3.9. Sensory Analysis

A sensory evaluation showed that fresh litchi fruits (Figure 6a) were highly valued for FC, C, FO, EXO, FRF and EXF, reaching almost the maximum score (8). These values maintained a high score (7) even after 3 days of storage (Figure 6b) in the CTR and MAP 1 fruits (10% O2 + 20% CO2 + 70% N2), while they decreased slightly in the MAP 2- (20% O2 + 20% CO2 + 60% N2) and MAP 3-treated fruits (5% O2 + 20% CO2 + 75% N2). No negative descriptors appear, however, that could be associated with the production of unpalatable compounds, such as acetaldehyde. Substantial differences begin to be seen from the sixth day of storage (Figure 6c) between the MAP-treated and CTR fruits. In fact, as we can see from Figure 6c, the MAP2-treated fruits maintain high values of positive descriptors of FC, FO, EXO, S and J. In contrast, the MAP 1- and MAP 3-treated fruits show slightly lower values of positive descriptors. Interestingly, starting from day 6, negative descriptors (OFF and PU) begin to appear in the CTR fruits compared to the MAP fruits in which these descriptors maintain values of 1 (absence of the descriptor). Finally, on the last day of analysis, the fruits (Figure 6d) with the best quality characteristics are those treated with MAP 3. In fact, these fruits maintain values of 7 in the descriptors C, FO, EXO, S and J. Similar values are also maintained by the MAP 1- and MAP 2-treated fruits, while the CTR fruits are evaluated negatively for the occurrence and persistence of the descriptors OFF, PU and A. As reported in other studies, the taste scale of the pulp and/or the color scale may reflect the quality of the litchi fruit, and, in addition, the decrease in the taste scale is well associated with the decrease in the color scale [100]. Therefore, from the data obtained, we can say that the MAP treatment maintained the quality attributes and prolonged shelf life. These beneficial effects should be mainly attributed to the protective effects of gases around the fruits that prevent browning, slow respiration and juice escape and slow down senescence.

4. Conclusions

MAP has a positive effect on the containment of epicarp burnishing and loss of consistency. The MAP 1 and MAP 2 treatments extended the shelf life of the fruit up to nine days. The MAP 3 treatments (5% O2 + 20% CO2 + 75% N2) provided the best results in the control of decay and in the maintenance of the external and internal quality of the fruit. In fact, from a microbiological point of view, packaging litchi fruits in modified atmospheres containing 20% of CO2 is an optimal strategy to prevent microbial deterioration. As for quality traits, the skin color, brightness and redness were slowed down in the MAP-treated fruit for browning and loss of firmness. This could be due to the solubility in the water of N2, which is 0.016 g L−1. The increased ability of MAP 3 to delay physiological decay may be due to the ability of nitrogen to dissolve in the aqueous layer of the fruit and, thus, inactivate some chemically active sites on the enzymes. Finally, the reduced level of oxygen in the MAP 3 mixture has certainly avoided the activation of anaerobic metabolism, maintained the organoleptic characteristics of litchi and prolonged its shelf life. Fruits treated with MAP show a reduced loss of water and maintained their SSC, with a lower ripening index compared to the CTR ones. Furthermore, the vitamin content generally decreased more rapidly in the CTR fruits than in the other treatments. Moreover, the MAP-treated fruits maintained the best values of sensory positive descriptors during storage. Finally, MAP treatment maintained the quality attributes and prolonged fruit shelf life. These beneficial effects should be mainly attributed to the protective effects of gases around the fruits that prevent browning, slow respiration and juice escape and slow down senescence. In particular, MAP 3 seems to maintain the better organoleptic quality of litchi fruits.

Author Contributions

Conceptualization, I.T. and V.F.; methodology, R.G., E.P. and V.F.; validation, I.T., R.P., V.F. and R.G.; formal analysis, P.R., I.T., A.P. and R.P.; investigation, I.T., R.P., P.R., R.G., A.P. and V.F.; data curation, R.G., I.T. and R.G.; writing—original draft preparation, I.T., R.P. and R.G.; writing—review and editing, R.G. and V.F. All authors have read and agreed to the published version of the manuscript.

Funding

This research was funded by the “Tecnologie innovative di processo e di prodotto standardizzate e certificate per la filiera dei frutti tropicali” (TINFRUT) project, supported by PSR Sicilia 2014–2020—Regione Sicilia—Assessorato Regionale dell’Agricoltura dello Sviluppo Rurale e della Pesca Mediterranea, Dipartimento Regionale dell’ Agricoltura—Servizio 5—Ricerca, Assistenza Tecnica, Divulgazione Agricola ed altri Servizi alle Aziende Programma di Sviluppo Rurale SOTTOMISURA 16.1 “Sostegno per la costituzione e la gestione dei gruppi operativi del PEI in materia di produttività e sostenibilità dell’agricoltura”.

Data Availability Statement

The data presented in this study are available on request from the corresponding author.

Acknowledgments

The authors would like to thank the Collura farm for the plant material and technical support.

Conflicts of Interest

The authors declare no conflict of interest.

References

  1. Farina, V.; Gianguzzi, G.; D’Asaro, A.; Mazzaglia, A.; Palazzolo, E. Fruit production and quality evaluation of four litchi cultivars (Litchi chinensis Sonn.) grown in Mediterranean climate. Fruits 2017, 72, 203–211. [Google Scholar] [CrossRef]
  2. Fratianni, A.; Adiletta, G.; Di Matteo, M.; Panfili, G.; Niro, S.; Gentile, C.; Farina, V.; Cinquanta, L.; Corona, O. Evolution of carotenoid content, antioxidant activity and volatiles compounds in dried mango fruits (Mangifera Indica L.). Foods 2020, 9, 1424. [Google Scholar] [CrossRef]
  3. Migliore, G.; Farina, V.; Guccione, G.D.; Schifani, G. Quality determinants of avocado fruit consumption in Italy. Implic. Small Farms. Calit. 2018, 19, 148–153. [Google Scholar]
  4. Adiletta, G.; Di Matteo, M.; Albanese, D.; Farina, V.; Cinquanta, L.; Corona, O.; Magri, A.; Petriccione, M. Changes in physico-chemical traits and enzymes oxidative system during cold storage of ‘Formosa’ papaya fresh cut fruits grown in the mediterranean area (Sicily). Ital. J. Food Sci. 2020, 32, 845–857. [Google Scholar]
  5. Mazzaglia, A.; Lanza, C.; Farina, V.; Barone, F. Evaluation of fruit quality in loquat using both chemical and sensory analyses. III Int. Symp. Loquat 2010, 887, 345–349. [Google Scholar]
  6. Baoyao, W.; Li, H.; Jianwen, T.; Min, J. Chemical Compositional Characterization of Ten Litchi Cultivars. In Proceedings of the 2011 International Conference on New Technology of Agricultural, Zibo, China, 27–29 May 2011; pp. 1007–1011. [Google Scholar]
  7. Pandey, N.; Joshi, S.K.; Singh, C.; Kumar, S.; Rajput, S.; Khandal, R. Enhancing shelf life of litchi (Litchi chinensis) fruit through integrated approach of surface coating and gamma irradiation. Radiat. Phys. Chem. 2013, 85, 197–203. [Google Scholar] [CrossRef]
  8. Chen, Z.; He, M.; Zhou, Y.; Chen, X.; Zhu, H.; Yang, B.; Jiang, Y.; Qu, H. Degradation of water-soluble polysaccharides in pulp of litchi during storage. Food Chem. 2023, 402, 134289. [Google Scholar] [CrossRef]
  9. Jiang, Y.; Duan, X.; Joyce, D.; Zhang, Z.; Li, J. Advances in understanding of enzymatic browning in harvested litchi fruit. Food Chem. 2004, 88, 443–446. [Google Scholar] [CrossRef]
  10. Veerappan, K.; Natarajan, S.; Chung, H.; Park, J. Molecular Insights of Fruit Quality Traits in Peaches, Prunus persica. Plants 2021, 10, 2191. [Google Scholar] [CrossRef]
  11. Sivakumar, D.; Korsten, L.; Zeeman, K. Postharvest management on quality retention of litchi during storage. Fresh Prod. 2007, 1, 66–75. [Google Scholar]
  12. Sun, J.; You, X.; Li, L.; Peng, H.; Su, W.; Li, C.; He, Q.; Liao, F. Effects of a phospholipase D inhibitor on postharvest enzymatic browning and oxidative stress of litchi fruit. Postharvest Biol. Technol. 2011, 62, 288–294. [Google Scholar] [CrossRef]
  13. Li, M.; Hong, Y.; Wang, X. Phospholipase D-and phosphatidic acid-mediated signaling in plants. Biochim. Et Biophys. Acta BBA Mol. Cell Biol. Lipids 2009, 1791, 927–935. [Google Scholar] [CrossRef]
  14. Saquet, A.; Streif, J.; Bangerth, F. Energy metabolism and membrane lipid alterations in relation to brown heart development in ‘Conference’pears during delayed controlled atmosphere storage. Postharvest Biol. Technol. 2003, 30, 123–132. [Google Scholar]
  15. Wang, T.; Hu, M.; Yuan, D.; Yun, Z.; Gao, Z.; Su, Z.; Zhang, Z. Melatonin alleviates pericarp browning in litchi fruit by regulating membrane lipid and energy metabolisms. Postharvest Biol. Technol. 2020, 160, 111066. [Google Scholar] [CrossRef]
  16. Ali, S.; Khan, A.S.; Malik, A.U.; Shahid, M. Effect of controlled atmosphere storage on pericarp browning, bioactive compounds and antioxidant enzymes of litchi fruits. Food Chem. 2016, 206, 18–29. [Google Scholar] [CrossRef]
  17. Zhang, Z.; Pang, X.; Ji, Z.; Jiang, Y. Role of anthocyanin degradation in litchi pericarp browning. Food Chem. 2001, 75, 217–221. [Google Scholar] [CrossRef]
  18. Jacobi, K.K.; Wong, L.S.; Giles, J.E. Lychee (Litchi chinensis Sonn.) fruit quality following vapour heat treatment and cool storage. Postharvest Biol. Technol. 1993, 3, 111–119. [Google Scholar] [CrossRef]
  19. Ray, P.; Rani, R.; Singh, S. Effect of temperature and sulphur treatments on storage behaviour of litchi fruits. Indian J. Hortic. 2004, 61, 292–295. [Google Scholar]
  20. Farina, V.; Sortino, G.; Saletta, F.; Passafiume, R.; Giuffré, D.; Gianguzzi, G.; Inglese, P.; Liguori, G. Effects of rapid refrigeration and modified atmosphere packaging on litchi (Litchi chinensis Sonn.) fruit quality traits. Chem. Eng. 2017, 58, 415–420. [Google Scholar]
  21. Liu, J.; Sun, J.; Pan, Y.; Yun, Z.; Zhang, Z.; Jiang, G.; Jiang, Y. Endogenous melatonin generation plays a positive role in chilling tolerance in relation to redox homeostasis in litchi fruit during refrigeration. Postharvest Biol. Technol. 2021, 178, 111554. [Google Scholar] [CrossRef]
  22. Passafiume, R.; Tinebra, I.; Gaglio, R.; Settanni, L.; Sortino, G.; Allegra, A.; Farina, V. Fresh-Cut Mangoes: How to Increase Shelf Life by Using Neem Oil Edible Coating. Coatings 2022, 12, 664. [Google Scholar] [CrossRef]
  23. Sivakumar, D.; Terry, L.A.; Korsten, L. An overview on litchi fruit quality and alternative postharvest treatments to replace sulfur dioxide fumigation. Food Rev. Int. 2010, 26, 162–188. [Google Scholar] [CrossRef]
  24. Sivakumar, D.; Arrebola, E.; Korsten, L. Postharvest decay control and quality retention in litchi (cv. McLean’s Red) by combined application of modified atmosphere packaging and antimicrobial agents. Crop Prot. 2008, 27, 1208–1214. [Google Scholar] [CrossRef]
  25. Ducamp-Collin, M.-N.; Ramarson, H.; Lebrun, M.; Self, G.; Reynes, M. Effect of citric acid and chitosan on maintaining red colouration of litchi fruit pericarp. Postharvest Biol. Technol. 2008, 49, 241–246. [Google Scholar] [CrossRef]
  26. Zheng, X.; Tian, S. Effect of oxalic acid on control of postharvest browning of litchi fruit. Food Chem. 2006, 96, 519–523. [Google Scholar] [CrossRef]
  27. Tian, S.-P.; Li, B.-Q.; Xu, Y. Effects of O2 and CO2 concentrations on physiology and quality of litchi fruit in storage. Food Chem. 2005, 91, 659–663. [Google Scholar] [CrossRef]
  28. Sivakumar, D.; Korsten, L. Influence of modified atmosphere packaging and postharvest treatments on quality retention of litchi cv. Mauritius. Postharvest Biol. Technol. 2006, 41, 135–142. [Google Scholar] [CrossRef]
  29. Jiang, F.; Zhou, L.; Zhou, W.; Zhong, Z.; Yu, K.; Xu, J.; Zou, L.; Liu, W. Effect of modified atmosphere packaging combined with plant essential oils on preservation of fresh-cut lily bulbs. LWT 2022, 162, 113513. [Google Scholar] [CrossRef]
  30. Lashkari, E. Effect of Modified Atmosphere Packaging (MAP) on the Stability of Anthocyanins and Degradation of Phenolic Compounds during Postharvest Storage of Pomegranate Fruit. Food Nutr. Sci. 2022, 13, 316–335. [Google Scholar] [CrossRef]
  31. Luna, M.C.; Tudela, J.A.; Tomas-Barberan, F.A.; Gil, M.I. Modified atmosphere (MA) prevents browning of fresh-cut romaine lettuce through multi-target effects related to phenolic metabolism. Postharvest Biol. Technol. 2016, 119, 84–93. [Google Scholar] [CrossRef]
  32. Tinebra, I.; Scuderi, D.; Sortino, G.; Inglese, P.; Farina, V. Effects of argon-based and nitrogen-based modified atmosphere packaging technology on the quality of pomegranate (Punica granatum L. cv. Wonderful) Arils. Foods 2021, 10, 370. [Google Scholar] [CrossRef]
  33. Tinebra, I.; Sortino, G.; Inglese, P.; Fretto, S.; Farina, V. Effect of different modified atmosphere packaging on the quality of mulberry fruit (Morus alba L. cv Kokuso 21). Int. J. Food Sci. 2021, 2021, 8844502. [Google Scholar] [CrossRef]
  34. Zhang, M.; Meng, X.; Bhandari, B.; Fang, Z.; Chen, H. Recent application of modified atmosphere packaging (MAP) in fresh and fresh-cut foods. Food Rev. Int. 2015, 31, 172–193. [Google Scholar] [CrossRef]
  35. Sun, Y.; Zhao, X.; Ma, Y.; Guan, H.; Liang, H.; Wang, D. Inhibitory effect of modified atmosphere packaging on Escherichia coli O157: H7 in fresh-cut cucumbers (Cucumis sativus L.) and effectively maintain quality during storage. Food Chem. 2022, 369, 130969. [Google Scholar] [CrossRef]
  36. Artin, I.; Carter, A.T.; Holst, E.; Lövenklev, M.; Mason, D.R.; Peck, M.W.; Rådström, P. Effects of carbon dioxide on neurotoxin gene expression in nonproteolytic Clostridium botulinum type E. Appl. Environ. Microbiol. 2008, 74, 2391–2397. [Google Scholar] [CrossRef]
  37. Ali, S.; Sattar Khan, A.; Ullah Malik, A.; Anjum, M.A.; Nawaz, A.; Shoaib Shah, H.M. Modified atmosphere packaging delays enzymatic browning and maintains quality of harvested litchi fruit during low temperature storage. Sci. Hortic. 2019, 254, 14–20. [Google Scholar] [CrossRef]
  38. Oliveira, M.; Abadias, M.; Usall, J.; Torres, R.; Teixidó, N.; Viñas, I. Application of modified atmosphere packaging as a safety approach to fresh-cut fruits and vegetables–A review. Trends Food Sci. Technol. 2015, 46, 13–26. [Google Scholar] [CrossRef]
  39. De Reuck, K.; Sivakumar, D.; Korsten, L. Effect of integrated application of chitosan coating and modified atmosphere packaging on overall quality retention in litchi cultivars. J. Sci. Food Agric. 2009, 89, 915–920. [Google Scholar] [CrossRef]
  40. De Reuck, K.; Sivakumar, D.; Korsten, L. Integrated application of 1-methylcyclopropene and modified atmosphere packaging to improve quality retention of litchi cultivars during storage. Postharvest Biol. Technol. 2009, 52, 71–77. [Google Scholar] [CrossRef]
  41. Semeerbabu, M.; Kudachikar, V.; Revathy, B.; Usha Devi, A. Effect of post-harvest treatments on shelf-life and quality of litchi fruit stored under modified atmosphere at low temperature. J. Food Sci. Technol. 2007, 44, 107–109. [Google Scholar]
  42. Kumar, S.; Mishra, B.; Saxena, S.; Bandyopadhyay, N.; More, V.; Wadhawan, S.; Hajare, S.N.; Gautam, S.; Sharma, A. Inhibition of pericarp browning and shelf life extension of litchi by combination dip treatment and radiation processing. Food Chem. 2012, 131, 1223–1232. [Google Scholar] [CrossRef]
  43. Underhill, S.J.; Wong, L. A maturity standard for lychee (Litchi chinensis Sonn.). Acta Hortic. 1989, 269, 181–188. [Google Scholar] [CrossRef]
  44. Tinebra, I.; Passafiume, R.; Scuderi, D.; Pirrone, A.; Gaglio, R.; Palazzolo, E.; Farina, V. Effects of Tray-Drying on the Physicochemical, Microbiological, Proximate, and Sensory Properties of White-and Red-Fleshed Loquat (Eriobotrya Japonica Lindl.) Fruit. Agronomy 2022, 12, 540. [Google Scholar] [CrossRef]
  45. Saleh, I.; Al-Thani, R. Fungal food spoilage of supermarkets’ displayed fruits. Vet. World 2019, 12, 1877. [Google Scholar] [CrossRef]
  46. Morcia, C.; Malnati, M.; Terzi, V. In vitro antifungal activity of terpinen-4-ol, eugenol, carvone, 1, 8-cineole (eucalyptol) and thymol against mycotoxigenic plant pathogens. Food Addit. Contam. Part A 2012, 29, 415–422. [Google Scholar]
  47. Barrera Bello, E.; Gil Loaiza, M.; García Pajón, C.M.; Durango Restrepo, D.L.; Gil González, J.H. Empleo de un recubrimiento formulado con propóleos para el manejo poscosecha de frutos de papaya (Carica papaya L. cv. Hawaiana). Rev. Fac. Nac. De Agron. Medellín 2012, 65, 6497–6506. [Google Scholar]
  48. Perdones, A.; Sánchez-González, L.; Chiralt, A.; Vargas, M. Effect of chitosan–Lemon essential oil coatings on storage-keeping quality of strawberry. Postharvest Biol. Technol. 2012, 70, 32–41. [Google Scholar] [CrossRef]
  49. Ruangchakpet, A.; Sajjaanantakul, T. Effect of browning on total phenolic, flavonoid content and antioxidant activity in Indian gooseberry (Phyllanthus emblica Linn.). Agric. Nat. Resour. 2007, 41, 331–337. [Google Scholar]
  50. Peralta-Ruiz, Y.; Tovar, C.G.; Sinning-Mangonez, A.; Bermont, D.; Cordero, A.P.; Paparella, A.; Chaves-López, C. Colletotrichum gloesporioides inhibition using chitosan-Ruta graveolens L essential oil coatings: Studies in vitro and in situ on Carica papaya fruit. Int. J. Food Microbiol. 2020, 326, 108649. [Google Scholar] [CrossRef]
  51. Williams, S. Official Methods of Analysis of the Association of Official Analytical Chemists, 14th ed.; Association of Official Analytical Chemists, Inc.: Arlington, VA, USA, 1984; ISBN 978-0-935584-24-0. [Google Scholar]
  52. Fogg, D.N.; Wilkinson, N.T. The colorimetric determination of phosphorus. Analyst 1958, 83, 406–414. [Google Scholar] [CrossRef]
  53. Palazzolo, E.; Letizia Gargano, M.; Venturella, G. The nutritional composition of selected wild edible mushrooms from Sicily (southern Italy). Int. J. Food Sci. Nutr. 2012, 63, 79–83. [Google Scholar] [CrossRef]
  54. Ollilainen, V.; Vahteristo, L.; Uusi-Rauva, A.; Varo, P.; Koivistoinen, P.; Huttunen, J. The HPLC determination of total thiamin (vitamin B1) in foods. J. Food Compos. Anal. 1993, 6, 152–165. [Google Scholar] [CrossRef]
  55. Bueno-Solano, C.; López-Cervantes, J.; Campas-Baypoli, O.; Cortez-Rocha, M.; Casillas-Hernández, R.; Milan-Carrillo, J.; Sánchez-Machado, D. Quantitative HPLC analysis of riboflavin and aromatic amino acids in three forms of shrimp hydrolysates. J. Liq. Chromatogr. Relat. Technol. 2009, 32, 3009–3024. [Google Scholar] [CrossRef]
  56. Ding, C.-K.; Chachin, K.; Ueda, Y.; Imahori, Y.; Wang, C.Y. Metabolism of phenolic compounds during loquat fruit development. J. Agric. Food Chem. 2001, 49, 2883–2888. [Google Scholar] [CrossRef]
  57. Chen, F.; Liu, X.; Lin, H.; Chen, L. Determination of the organic acids from the fruit and leaf of loquat by ion-exchange chromatography. J. Fujian Agric. For. Univ. Nat. Sci. 2004, 33, 195–199. [Google Scholar]
  58. Solís, L.; Sánchez, E.; García, S.; Heredia, N. Traditional Methods for Detection of Foodborne Pathogens. In Microbiologically Safe Foods; John Wiley & Sons: Hoboken, NJ, USA, 2008; pp. 525–545. [Google Scholar]
  59. Health Canada. MFHPB-18 Determination of the Aerobic Colony Count in Foods. 2015. Available online: https://www.canada.ca/en/health-canada/services/food-nutrition/research-programs-analytical-methods/analytical-methods/compendium-methods/methods-microbiological-analysis-foods-compendium-analytical-methods.html (accessed on 20 April 2023).
  60. Farina, V.; Passafiume, R.; Tinebra, I.; Scuderi, D.; Saletta, F.; Gugliuzza, G.; Gallotta, A.; Sortino, G. Postharvest application of aloe vera gel-based edible coating to improve the quality and storage stability of fresh-cut papaya. J. Food Qual. 2020, 2020, 8303140. [Google Scholar] [CrossRef]
  61. Zhang, D.; Quantick, P.C. Effects of chitosan coating on enzymatic browning and decay during postharvest storage of litchi (Litchi chinensis Sonn.) fruit. Postharvest Biol. Technol. 1997, 12, 195–202. [Google Scholar] [CrossRef]
  62. Sivakumar, D.; Regnier, T.; Demoz, B.; Korsten, L. Effect of different post-harvest treatments on overall quality retention in litchi fruit during low temperature storage. J. Hortic. Sci. Biotechnol. 2005, 80, 32–38. [Google Scholar] [CrossRef]
  63. Wang, J.; Chen, H.; Zhou, Q.; Zhang, X. Effects of bagging on the fruit quality in Litchi chinensis fruit and pesticide residues in it. Ying Yong Sheng Tai Xue Bao J. Appl. Ecol. 2003, 14, 710–712. [Google Scholar]
  64. Pesis, E.; Long, P.; Hewett, E. Compositional changes in kiwifruit infected with Botrytis cinerea 1. In vivo studies. New Zealand J. Crop Hortic. Sci. 1991, 19, 405–412. [Google Scholar] [CrossRef]
  65. Hess-Pierce, B.; Kader, A. Carbon Dioxide-Enriched Atmospheres Extend Postharvest Life of Pomegranate Arils. In Proceedings of the 7th International Controlled Atmosphere Research Conference CA ’97 Fresh Cut Fruits and Vegetables and MAP, Davis, CA, USA, 13–18 July 1997; Volume 5. [Google Scholar]
  66. Palou, L.; Crisosto, C.H.; Garner, D. Combination of postharvest antifungal chemical treatments and controlled atmosphere storage to control gray mold and improve storability of ‘Wonderful’pomegranates. Postharvest Biol. Technol. 2007, 43, 133–142. [Google Scholar] [CrossRef]
  67. Jiang, Y.; Wang, Y.; Song, L.; Liu, H.; Lichter, A.; Kerdchoechuen, O.; Joyce, D.; Shi, J. Postharvest characteristics and handling of litchi fruit—An overview. Aust. J. Exp. Agric. 2006, 46, 1541–1556. [Google Scholar] [CrossRef]
  68. Lai, D.; Shao, X.; Xiao, W.; Fan, C.; Liu, C.; He, H.; Tian, S.; Kuang, S. Suppression of fruit decay and maintenance of storage quality of litchi by Photorhabdus luminescens Hb1029 treatment. Sci. Hortic. 2020, 259, 108836. [Google Scholar] [CrossRef]
  69. Chen, J.; Du, J.; Li, M.; Li, C. Degradation kinetics and pathways of red raspberry anthocyanins in model and juice systems and their correlation with color and antioxidant changes during storage. LWT Food Sci. Technol. 2020, 128, 109448. [Google Scholar] [CrossRef]
  70. Zou, B.; Xu, Y.; Wu, J.; Yu, Y.; Xiao, G. Phenolic compounds participating in mulberry juice sediment formation during storage. J. Zhejiang Univ. Sci. B 2017, 18, 854–866. [Google Scholar] [CrossRef] [PubMed]
  71. Neog, M.; Saikia, L. Control of post-harvest pericarp browning of litchi (Litchi chinensis Sonn.). J. Food Sci. Technol. 2010, 47, 100–104. [Google Scholar] [CrossRef] [PubMed]
  72. Jiang, Y.; Su, X.; Duan, X.; Lin, W.; Li, Y. Anoxia Treatment for Delaying Skin Browning, Inhibiting Disease Development and Maintaining the Quality of Litchi Fruit. Food Technol. Biotechnol. 2004, 42, 131–134. [Google Scholar]
  73. Saquet, A.; Streif, J.; Bangerth, F. Changes in ATP, ADP and pyridine nucleotide levels related to the incidence of physiological disorders in ‘Conference’pears and ‘Jonagold’apples during controlled atmosphere storage. J. Hortic. Sci. Biotechnol. 2000, 75, 243–249. [Google Scholar] [CrossRef]
  74. Zhang, Z.; Hu, M.; Yun, Z.; Wang, J.; Feng, G.; Gao, Z.; Shi, X.; Jiang, Y. Effect of tea seed oil treatment on browning of litchi fruit in relation to energy status and metabolism. Postharvest Biol. Technol. 2017, 132, 97–104. [Google Scholar] [CrossRef]
  75. Kays, S.J. Postharvest Physiology of Perishable Plant Products; Van Nostrand Reinhold: New York, NY, USA, 1991. [Google Scholar]
  76. Lemmer, D.; Kruger, F. Identification and quantification of the factors influencing sulphur dioxide residue levels in South African export litchi fruit. Acta Hortic. 2000, 558, 331–337. [Google Scholar] [CrossRef]
  77. Artés, F.; Villaescusa, R.; Tudela, J. Modified atmosphere packaging of pomegranate. J. Food Sci. 2000, 65, 1112–1116. [Google Scholar] [CrossRef]
  78. Martínez-Ferrer, M.; Harper, C.; Pérez-Muntoz, F.; Chaparro, M. Modified atmosphere packaging of minimally processed mango and pineapple fruits. J. Food Sci. 2002, 67, 3365–3371. [Google Scholar] [CrossRef]
  79. Jiang, Y.; Fu, J. Postharvest browning of litchi fruit by water loss and its prevention by controlled atmosphere storage at high relative humidity. LWT Food Sci. Technol. 1999, 32, 278–283. [Google Scholar] [CrossRef]
  80. Pu, H.; Liu, D.; Wang, L.; Sun, D.-W. Soluble solids content and pH prediction and maturity discrimination of lychee fruits using visible and near infrared hyperspectral imaging. Food Anal. Methods 2016, 9, 235–244. [Google Scholar] [CrossRef]
  81. Pesis, E.; Dvir, O.; Feygenberg, O.; Arie, R.B.; Ackerman, M.; Lichter, A. Production of acetaldehyde and ethanol during maturation and modified atmosphere storage of litchi fruit. Postharvest Biol. Technol. 2002, 26, 157–165. [Google Scholar] [CrossRef]
  82. Gaur, G.; Bajpai, P. Post harvest physiology of litchi fruits. II. Progress. Hortic. 1979, 11, 5–16. [Google Scholar]
  83. Paull, R.E.; Chen, N.J. Effect of storage temperature and wrapping on quality characteristics of litchi fruit. Sci. Hortic. 1987, 33, 223–236. [Google Scholar] [CrossRef]
  84. Somboonkaew, N.; Terry, L.A. Physiological and biochemical profiles of imported litchi fruit under modified atmosphere packaging. Postharvest Biol. Technol. 2010, 56, 246–253. [Google Scholar] [CrossRef]
  85. Jiang, Y.; Li, J.; Jiang, W. Effects of chitosan coating on shelf life of cold-stored litchi fruit at ambient temperature. LWT-Food Sci. Technol. 2005, 38, 757–761. [Google Scholar] [CrossRef]
  86. USDA NUTRIENT. Available online: https://fdc.nal.usda.gov/fdc-app.html#/food-details/169086/nutrients (accessed on 14 April 2023).
  87. Cabral, T.A.; de Morais Cardoso, L.; Pinheiro-Sant’Ana, H.M. Chemical composition, vitamins and minerals of a new cultivar of lychee (Litchi chinensis cv. Tailandes) grown in Brazil. Fruits 2014, 69, 425–434. [Google Scholar] [CrossRef]
  88. Sinha, N.K.; Sidhu, J.; Barta, J.; Wu, J.; Cano, M.P. Handbook of Fruits and Fruit Processing; John Wiley & Sons: Hoboken, NJ, USA, 2012; ISBN 1-118-35263-7. [Google Scholar]
  89. Visuthiwan, S.; Assatarakul, K. Kinetic modeling of microbial degradation and antioxidant reduction in lychee juice subjected to UV radiation and shelf life during cold storage. Food Control 2021, 123, 107770. [Google Scholar] [CrossRef]
  90. Mahajan, P.V.; Caleb, O.J.; Gil, M.I.; Izumi, H.; Colelli, G.; Watkins, C.B.; Zude, M. Quality and safety of fresh horticultural commodities: Recent advances and future perspectives. Food Packag. Shelf Life 2017, 14, 2–11. [Google Scholar] [CrossRef]
  91. Caldera, L.; Franzetti, L.V.; van Coillie, E.; de Vos, P.; Stragier, P.; De Block, J.; Heyndrickx, M. Identification, enzymatic spoilage characterization and proteolytic activity quantification of Pseudomonas spp. isolated from different foods. Food Microbiol. 2016, 54, 142–153. [Google Scholar] [CrossRef]
  92. Barth, M.; Hankinson, T.R.; Zhuang, H.; Breidt, F. Microbiological Spoilage of Fruits and Vegetables. In Compendium of the Microbiological Spoilage of Foods and Beverages; Springer: New York, NY, USA, 2009; pp. 135–183. [Google Scholar]
  93. Jiang, H.; Ling, Z.; Zhang, Y.; Mao, H.; Ma, Z.; Yin, Y.; Wang, W.; Tang, W.; Tan, Z.; Shi, J. Altered fecal microbiota composition in patients with major depressive disorder. Brain Behav. Immun. 2015, 48, 186–194. [Google Scholar] [CrossRef]
  94. Nguyen, T.T.; Van Giau, V.; Vo, T.K. Multiplex PCR for simultaneous identification of E. coli O157: H7, Salmonella spp. and L. monocytogenes in food. 3 Biotech 2016, 6, 205. [Google Scholar] [CrossRef] [PubMed]
  95. Fong-in, S.; Nimitkeatkai, H.; Prommajak, T.; Nowacka, M. Ultrasound-assisted osmotic dehydration of litchi: Effect of pretreatment on mass transfer and quality attributes during frozen storage. J. Food Meas. Charact. 2021, 15, 3590–3597. [Google Scholar] [CrossRef]
  96. Li, Z.; Yang, H.; Fang, W.; Huang, X.; Shi, J.; Zou, X. Effects of Variety and Pulsed Electric Field on the Quality of Fresh-Cut Apples. Agriculture 2023, 13, 929. [Google Scholar] [CrossRef]
  97. Thomas, L.V.; Ingram, R.E.; Yu, S.; Delves-Broughton, J. Investigation of the effectiveness of Ascopyrone P as a food preservative. Int. J. Food Microbiol. 2004, 93, 319–323. [Google Scholar] [CrossRef] [PubMed]
  98. Qu, P.; Zhang, M.; Fan, K.; Guo, Z. Microporous modified atmosphere packaging to extend shelf life of fresh foods: A review. Crit. Rev. Food Sci. Nutr. 2022, 62, 51–65. [Google Scholar] [CrossRef]
  99. Chouliara, E.; Badeka, A.; Savvaidis, I.; Kontominas, M.G. Combined effect of irradiation and modified atmosphere packaging on shelf-life extension of chicken breast meat: Microbiological, chemical and sensory changes. Eur. Food Res. Technol. 2008, 226, 877–888. [Google Scholar] [CrossRef]
  100. Jiang, Y.; Li, Y. Effects of low-temperature acclimation on browning of litchi fruit in relation to shelf life. J. Hortic. Sci. Biotechnol. 2003, 78, 437–440. [Google Scholar] [CrossRef]
Figure 1. Decay index (D.I.) rated from 1 to 4 on litchi fruit measured for 9 days post-treatment in cold storage at 5 ± 1 °C. Values are expressed as mean ± SD. Means with the same letter are not significantly different at p ≤ 0.05 (Tukey’s test). CTR: control fruit; MAP 1: (10% O2 + 20% CO2 + 70% N2); MAP 2: (20% O2 + 20% CO2 + 60% N2); MAP 3: (5% O2 + 20% CO2 + 75% N2). Lowercase letters indicate differences for the same treatment during the storage period. Where there are no letters, differences are not statistically significant.
Horticulturae 09 00651 g001
Figure 2. Color decay in terms of (a) L* (brightness) and (b) a* (redness) during 9 days of storage. The columns indicate the means, and the bars indicate the standard deviation (n = 5). Lowercase letters indicate significant differences (p < 0.05) between treatments on the same storage day; uppercase letters indicate significant differences (p < 0.05) for the same treatment throughout the storage period (d0 to d9).
Horticulturae 09 00651 g002
Figure 3. Progress of the browning state of the peel during 9 days of storage. The columns indicate the means, and the bars indicate the standard deviation (n = 5). Lowercase letters indicate significant differences (p < 0.05) between treatments on the same storage day; uppercase letters indicate significant differences (p < 0.05) for the same treatment throughout the storage period (d0 to d9).
Horticulturae 09 00651 g003
Figure 4. Loss of firmness of litchi fruits during 9 days of storage. The columns indicate the means, and the bars indicate the standard deviation (n = 5). Lowercase letters indicate significant differences (p < 0.05) between treatments on the same storage day; uppercase letters indicate significant differences (p < 0.05) for the same treatment throughout the storage period (d0 to d9).
Horticulturae 09 00651 g004
Figure 5. Microbial loads of control and MAP-treated litchi samples. (a) Plate count agar (PCA) for total mesophilic microorganisms (TMMs); (b) potato dextrose agar (PDA) for molds. Results indicate the mean values ± standard deviation (S.D.) of three plate counts. Histograms followed by different letters are significantly different according to Tukey’s test (p < 0.05).
Horticulturae 09 00651 g005
Figure 6. Sensory profile of litchi fruits after (a) 0 (day 0), (b) 3 (day 3), (c) 6 (day 6), (d) 9 (day 9) days of cold storage at 5 ± 1 °C and 90 ± 5% RH. The values indicate the means ± standard deviation (n = 5). Legend: flesh color (FC); firmness (C), fruity odor (FO), exotic fruit odor (EXO), off-odor (OFO), sweet (S), acid (A), juicy (J), astringent (AS), pungent (PU), fruit flavor (FRF), exotic fruit flavor (EXF), alcohol flavor (ALF), off-flavor (OFF) and overall evaluation (OVE).
Horticulturae 09 00651 g006aHorticulturae 09 00651 g006bHorticulturae 09 00651 g006c
Table 1. Change in water, soluble solids content and maturity index. The values indicate the means ± standard deviation (n = 5), and the * indicates the significant differences (p < 0.05) for the same treatment throughout the storage period (d0 to d9).
Days of Storage
Treatmentsd0d3d6d9
Water content (g/100 g FW)CTR83.87 ± 0.5782.89 ± 0.8781.07 ± 0.8880.14 ± 0.07
MAP 183.87 ± 0.5783.07 ± 0.1683.22 ± 0.4780.80 ± 0.51
MAP 283.87 ± 0.5783.01 ± 0.1682.89 ± 0.1480.86 ± 0.43
MAP 383.87 ± 0.5783.32 ± 0.7582.74 ± 0.7381.30 ± 0.29
Soluble solids content
(°Brix)
CTR16.32 ± 0.1117.34 ± 0.2618.92 ± 0.0518.96 ± 0.05
MAP 116.32 ± 0.1117.00 ± 0.1218.59 ± 0.1319.46 ± 0.15
MAP 216.32 ± 0.1118.06 ± 0.1618.11 ± 0.1518.72 ± 0.14
MAP 316.32 ± 0.1118.04 ± 0.219.44 ± 0.220.20 ± 0.12
Maturity index
(MI = SSC/TA)
CTR69.84 ± 1.1273.33 ± 2.0883.00 ± 3.6192.33 * ± 4.51
MAP 169.84 ± 1.1274.05 ± 1.5079.48 ± 1.3780.05 ± 1.10
MAP 269.84 ± 1.1274.24 ± 0.6579.45 ± 2.2382.71 ± 0.59
MAP 369.84 ± 1.1273.52 ± 1.1479.59 ± 2.7483.87 ± 1.26
Table 2. Concentration of organic acid (malic, fumaric and citric acids) during storage period (d0 to d9). The value indicates the means ± standard deviation (n = 5).
Days of Storage
Treatmentsd0d3d6d9
Malic a. (mg/100 g FW)CTR3.482 ± 0.4082.890 ± 0.1962.598 ± 0.2192.585 ± 0.133
MAP 13.482 ± 0.4082.928 ± 0.4142.863 ± 0.4492.619 ± 0.360
MAP 23.482 ± 0.4082.873 ± 0.6652.861 ± 0.1502.545 ± 0.504
MAP 33.482 ± 0.4082.891 ± 0.5082.867 ± 0.2312.699 ± 0.173
Fumaric a. (mg/100 g FW)CTR0.111 ± 0.0930.098 ± 0.0440.089 ± 0.0810.089 ± 0.063
MAP 10.111 ± 0.0930.079 ± 0.0800.079 ± 0.0900.075 ± 0.062
MAP 20.111 ± 0.0930.080 ± 0.0230.079 ± 0.0410.079 ± 0.069
MAP 30.111 ± 0.0930.079 ± 0.0470.079 ± 0.0280.076 ± 0.059
Citric a.
(mg/100 g FW)
CTR1.656 ± 0.0681.336 ± 0.3991.249 ± 0.2611.225 ± 0.123
MAP 11.656 ± 0.0681.656 ± 0.2011.523 ± 0.2641.345 ± 0.213
MAP 21.656 ± 0.0681.649 ± 0.1191.526 ± 0.3991.241 ± 0.127
MAP 31.656 ± 0.0681.554 ± 0.0451.436 ± 0.3991.125 ± 1.233
Table 3. Concentration of mineral compounds (K, Na, Ca, P, Fe) during storage period. The values indicate the means ± standard deviation (n = 5). Lowercase letters indicate significant differences (p < 0.05) between treatments on the same storage day; uppercase letters indicate significant differences (p < 0.05) for the same treatment throughout the storage period (d0 to d9).
Days of Storage
Treatmentsd0d3d6d9
K
(mg/100 g FW)
CTR38.72 aA ± 0.3032.26 bA ± 1.1924.93 bB ± 1.2018.99 aB ± 0.38
MAP 138.72 aA ± 0.3035.92 aA ± 2.6321.76 bB ± 1.6320.46 aB ± 1.07
MAP 238.72 aA ± 0.3037.19 aA ± 1.5931.93 aA ± 1.1920.99 aB ± 0.38
MAP 338.72 aA ± 0.3036.98 aA ± 1.6232.59 aA ± 1.4324.23 aB ± 1.30
Na
(mg/100 g FW)
CTR10.18 aA ± 0.757.42 aA ± 0.187.32 aA ± 0.187.28 aA ± 0.33
MAP 110.18 aA ± 0.758.79 aA ± 0.647.39 aA ± 0.157.64 aA ± 0.35
MAP 210.18 aA ± 0.758.78 aA ± 0.677.76 aA ± 0.207.68 aA ± 0.33
MAP 310.18 aA ± 0.758.74 aA ± 0.687.32 aA ± 0.187.32 aA ± 0.32
Ca
(mg/100 g FW)
CTR15.88 aA ± 0.5213.10 aA ± 0.1012.13 aA ± 1.7711.46 aA ± 0.22
MAP 115.88 aA ± 0.5214.54 aA ± 0.7312.19 aA ± 0.0911.49 aA ± 0.34
MAP 215.88 aA ± 0.5214.20 aA ± 0.0712.17 aA ± 0.6411.53 aA ± 0.17
MAP 315.88 aA ± 0.5214.46 aA ± 0.8012.13 aA ± 0.1012.13 aA ± 0.10
P
(mg/100 g FW)
CTR44.71 aA ± 1.5935.63 bA ± 0.2925.63 bB ± 0.2924.91 aB ± 0.08
MAP 144.71 aA ± 1.5943.46 aA ± 0.9535.46 aA ± 0.5725.61 aB ± 0.08
MAP 244.71 aA ± 1.5941.49 aA ± 1.2135.63 aA ± 0.2924.90 aB ± 0.07
MAP 344.71 aA ± 1.5944.06 aA ± 1.0136.06 aA ± 0.2525.96 aB ± 0.33
Fe
(mg/100 g FW)
CTR0.29 aA ± 0.020.10 aA ± 0.010.10 aA ± 0.010.09 aA ± 0.02
MAP 10.29 aA ± 0.020.23 aA ± 0.040.11 aA ± 0.020.10 aA ± 0.02
MAP 20.29 aA ± 0.020.20 aA ± 0.010.15 aA ± 0.010.12 aA ± 0.02
MAP 30.29 aA ± 0.020.24 aA ± 0.040.17 aA ± 0.010.13 aA ± 0.01
Table 4. Concentration of vitaminic components (niacin, riboflavin, thiamine, ascorbic acid) during storage period. The values indicate the means ± standard deviation (n = 5). Lowercase letters indicate significant differences (p < 0.05) between treatments on the same storage day; uppercase letters indicate significant differences (p < 0.05) for the same treatment throughout the storage period (d0 to d9).
Days of Storage
Treatmentsd0d3d6d9
Niacin
(mg/100 g FW)
CTR 0.743 aA ± 0.0830.463 bB ± 0.0490.463 bB ± 0.00490.383 aB ± 0.023
MAP 10.743 aA ± 0.0830.667 aA ± 0.1200.530 aA ± 0.0100.401 aB ± 0.012
MAP 20.743 aA ± 0.0830.603 aA ± 0.0070.530 aA ± 0.0200.390 aB ± 0.007
MAP 30.743 aA ± 0.0830.580 aA ± 0.0530.523 aA ± 0.0250.403 aB ± 0.006
Riboflavin
(mg/100 g FW)
CTR0.090 aA ± 0.0170.080 aA ± 0.0200.080 aA ± 0.0200.068 aA ± 0.017
MAP 10.090 aA ± 0.0170.060 aA ± 0.0100.077 aA ± 0.0150.073 aA ± 0.021
MAP 20.090 aA ± 0.0170.053 aA ± 0.0150.080 aA ± 0.0200.069 aA ± 0.031
MAP 30.090 aA ± 0.0170.053 aA ± 0.0150.077 aA ± 0.0250.083 aA ± 0.006
Thiamine
(mg/100 g FW)
CTR0.031 aA ± 0.0010.025 aA ± 0.0020.025 aA ± 0.0020.021 aA ± 0.008
MAP 10.031 aA ± 0.0010.027 aA ± 0.0010.027 aA ± 0.0010.025 aA ± 0.001
MAP 20.031 aA ± 0.0010.027 aA ± 0.0010.027 aA ± 0.0010.024 aA ± 0.005
MAP 30.031 aA ± 0.100.027 aA ± 0.0010.026 aA ± 0.0010.026 aA ± 0.05
Ascorbic acid (mg/100 g FW)CTR77.667 aA ± 2.52154.667 aA ± 2.51754.667 aB ± 2.51752.889 aB ± 2.524
MAP 177. 667 aA ± 2.52173.333 aA ± 2.08268.000 aA ± 2.60657.667 aB ± 2.642
MAP 277. 667 A ± 2.52174.333 aA ± 1.08264.000 aA ± 1.64655.667 aB ± 3.654
MAP 377.667 aA ± 2.52171.211 aA ± 2.21362.000 aA ± 3.60654.333 aB ± 2.509
Disclaimer/Publisher’s Note: The statements, opinions and data contained in all publications are solely those of the individual author(s) and contributor(s) and not of MDPI and/or the editor(s). MDPI and/or the editor(s) disclaim responsibility for any injury to people or property resulting from any ideas, methods, instructions or products referred to in the content.

