Article

Mesh Crop Cover Optimizes the Microenvironment in a Tropical Region and Modifies the Physiology and Metabolome in Tomato

by
Victoria A. Delgado-Vargas
1,
Gloria I. Hernández-Bolio
2,
Emanuel Hernández-Núñez
2,
Hélène Gautier
3,
Oscar J. Ayala-Garay
1,* and
René Garruña
4,*
1
Colegio de Postgraduados, Postgrado de RGP-Fisiología Vegetal, Carretera México-Texcoco Km 36.5, Montecillo, Texcoco 56230, México, Mexico
2
Departamento de Recursos del Mar, Centro de Investigación y de Estudios Avanzados del IPN, Unidad Mérida, Antigua Carretera a Progreso Km 6, Cordemex, Loma Bonita Xcumpich, Mérida 97310, Yucatán, Mexico
3
INRAE, UR1115, Plantes et Systèmes de Culture Horticoles, Domaine St Paul, Site Agroparc, 84914 Avignon, France
4
CONACYT-Instituto Tecnológico de Conkal. Avenida Tecnológico s/n. Conkal 97345, Yucatán, Mexico
*
Authors to whom correspondence should be addressed.
Horticulturae 2023, 9(6), 636; https://doi.org/10.3390/horticulturae9060636
Submission received: 25 April 2023 / Revised: 16 May 2023 / Accepted: 23 May 2023 / Published: 29 May 2023
(This article belongs to the Special Issue Effects of Light Quantity and Quality on Horticultural Crops)

Abstract

:
In tropical regions, high light levels can lead to increased photooxidative damage in plants. Thus, reducing solar radiation could have a substantial impact on crop performance. This study aimed to evaluate the physiological responses and metabolic profile of two tomato varieties grown in microenvironments modified with cover meshes under a high light level and a warm climate. The experiment was achieved under high solar irradiance and an unfavorably high temperature. The varieties “Moneymaker” (MM) and “Campeche 40” (C40) were grown from 45 to 130 days after sowing at four solar irradiance levels: 100% (T1), 80% (T2), 75% (T3), and 50% (T4). In both varieties, the plants grown under the lowest irradiances (T3 and T4) were the tallest, with larger leaf areas, and accumulated more aerial and root biomass. Under moderate shading (T2), plants took better advantage of the light and had the highest photochemical quenching coefficient (qP) (C40 = 0.60 and MM = 0.48) and the highest electron transport rate (ETR). However, T3 and T4 plants had the highest net assimilation rate (23.6 and 23.9 µmol m−2 s−1 in C40, and 22.7 and 22.6 µmol m−2 s−1 in MM, respectively) and the highest A/Ci coefficients. Although both tomato varieties accumulate similar metabolites, MM leaves accumulate more glucose and C40 leaves accumulate more proline and valine. Furthermore, MM leaves accumulate more glycine and GABA under high radiation, and C40 leaves accumulate more proline and valine than leaves under 50% shade (T4). We conclude that using meshes in areas with high irradiance could be an alternative to reduce abiotic stress factors in plants.

1. Introduction

Tomato (Solanum lycopersicum L.) is the world’s second most economically important vegetable [1]. These plants are typically cultivated in warm, tropical, and subtropical climates, under both open field and protected agriculture conditions. However, high solar radiation and temperature can affect production in tropical regions since the optimum crop temperature is 25/15 °C (day/night) [2]. Indeed, Boote et al. [3] consider tomato to be a species sensitive to high temperatures.
Xu et al. [4] reported that increased maximum temperatures negatively affect reproductive development and crop physiology. In some cases, it has been observed that temperatures above 34 °C and high environmental humidity reduced flower pollen and ovule development and increased flower malformation [5]. One of the problems in tropical regions is that their environmental characteristics can cause morpho-anatomical, physiological, and biochemical changes in tomatoes; for example, between 35 and 40 °C, the Rubisco enzyme undergoes reversible inhibition, but at higher temperatures, the inhibition is irreversible [6]. In addition to photosynthesis, water relations and hormonal balance can also be affected [7], negatively impacting both fresh and dry mass of fruits due to changes in primary or secondary metabolism [8]. A study in tomato plants showed that photosynthesis and growth parameters were enhanced when solar radiation increased [9], and the temperature was close to optimal for tomato. However, in a tropical region with unfavorably high temperatures, both solar radiation and temperature can influence the growth of tomato plants [10].
Thus, projections of rising global temperatures pose a challenge to agricultural production worldwide [11], especially in tropical areas where the excess electromagnetic radiation from the sun will increase air temperature above the thermal optimum for crops [12], especially tomato. In this sense, employing crop cover meshes could modify the microenvironment by reducing the radiation reaching the plants and generating a near-optimum microenvironment [13]. The meshes most commonly used in agriculture are black, as they provide shade equally throughout the entire band of the electromagnetic spectrum; their main objective is to reduce irradiance without modifying the quality of light [14]. While numerous types of plastic mesh are currently used to promote optimal crop growth and development [13], more information needs to be available regarding the effects of meshes on plant physiology, growth, and, in particular, leaf composition. For example, a metabolomic study was conducted to distinguish between mature green and red ripe tomato fruits, enabling the authors to create a list of amino acids and secondary components that define each of the tomato ripening stages [15]. In this sense, detecting the presence and measuring the concentration of specific metabolites are essential to understanding the functioning of a biological system. A previous study demonstrated that nuclear magnetic resonance (NMR) could be utilized for metabolomics since it yields substantial qualitative and quantitative information about plant metabolites [16]. Additional advantages of 1H-NMR metabolomics include its non-destructive nature, the possibility of detecting signals from diverse polarity metabolites, and simple spectra processing [17]. The interpretation of spectroscopic data is now easier since they can be compared with available databases [18].
Therefore, this research aimed to evaluate the physiological responses and metabolic profile of two tomato varieties grown in microenvironments modified with cover meshes in a tropical region with a warm climate.

2. Materials and Methods

2.1. Experimental Site and Plant Material

The experiment was carried out in the experimental area of the Instituto Tecnológico de Conkal in Yucatán, Mexico (21.07° NL; 89.52° WL and 8 m.a.s.l.). Two tomato varieties were planted: (1) “Moneymaker” (MM), which is a commercial temperate-climate variety with indeterminate growth, produces ball-type fruits, and is considered a world reference in studies of the species [19]; and (2) “Campeche 40 “ (C40), which is a landrace variety of the state of Campeche in Mexico, where the climate is warm–subhumid, has indeterminate growth, and produces kidney-type fruits [20].

2.2. Crop Establishment and Management

Seed sowing was performed in 200-cavity polystyrene trays, with Canadian moss (Sunshine, Springfield, OH, USA) used as substrate. Fertilization began 15 days after sowing (das) with the appearance of the first pair of leaflets; the fertilizer 19-19-19 (N:P:K) + 1% M.E. (Poly-Feed, Haifa, Mexico) was applied in the irrigation water three times a week at a concentration of 1 g L−1.
At 45 das, the plants were transplanted into 40 × 50 cm black polyethylene bags; the substrate used was a mixture of soil and vermicompost at a 70:30 (v/v) ratio, previously disinfected by the vaporization method. The population density was 3.5 plants m−2. Agronomic management was performed according to Guzmán et al. [21]. Conventional tutoring was performed throughout the crop, and the leaves below the first fruit cluster and the shoots in axillary buds were pruned every 15 days. Steiner’s [22] solution (electrical conductivity of 3.5 dS m−1 and a pH of 5.5 to 6) was applied for fertilization at the time of transplanting.

2.3. Treatments and Characterization of Microenvironments

The experiment consisted of eight treatments: two varieties (MM and C40) and four solar irradiance intensities: T1 = open field, 100% irradiance; T2 = white anti-aphid mesh tunnel, 80% irradiance; T3 = gray anti-aphid mesh tunnel, 75% irradiance; T4 = tunnel with white anti-aphid mesh plus black shade mesh, 50% irradiance.
In each treatment, the microenvironment was characterized by a weather station (Onset HOBO U30, Bourne, MA, USA). Sensors were placed inside the tunnel at canopy height, and the station was programmed to record data every 30 s and average them every 10 min. The meteorological variables evaluated included solar radiation (R), photosynthetic photon flux density (PPFD), air temperature (AT), and relative humidity (RH). Diurnal curves (6 am to 7 pm) were constructed using the data.

2.4. Morphological Variables and Biomass Distribution

Destructive sampling was carried out at 130 das during the fruit-filling stage. In each sampling, four plants were used for each treatment and were evaluated for height, the total number of leaves, and leaf area. An area integrator (LICOR LI-3100, Lincoln, NE, USA) was used to measure the leaf area. The plants were separated by organs and dried in a forced air oven at 70 °C until constant weight mass (~72 h).

2.5. Leaf Photochemistry and Gas Exchange

The quantum efficiency of photosystem II (PSII) was evaluated with a pulse-amplitude-modulated fluorometer (PAM Walz, Effeltrich, Germany). The following variables were measured as proposed by Samaniego-Gámez et al. [23]: maximum photochemical quantum yield of PSII (Fv/Fm) and potential activity of PSII (Fv/F0) (where Fv is variable fluorescence (Fm-F0), F0 is initial fluorescence, and Fm is maximum fluorescence), photochemical quenching coefficient (qP) and non-photochemical quenching coefficient (NPQ), electron transport rate (ETR), and effective quantum yield of PSIIPSII). The saturating light was an 8000 µmol m−2 s−1 pulse of actinic light. Nine light pulses (from 0 to 1500 µmol m−2 s−1) were used for the ETR and ΦPSII curves. Measurements on the third fully developed leaf from the apex were taken at noon on 120 das.
Gas exchange variables were measured at 115 das (at the reproductive stage of the third cluster). An infrared gas analyzer (LICOR LI-6400, Lincoln, NE, USA) was used to evaluate the net CO2 assimilation rate (AN), stomatal conductance (gs), intercellular carbon (Ci), transpiration (E), and water-use efficiency (WUE). Five plants per treatment and three leaves per plant were evaluated; the leaves were from the upper part of the canopy and were fully expanded. Measurements were made from 6 am to 6 pm to record physiological responses during the diurnal course [24].

2.6. Metabolic Profile by NMR

From each plant, 6 g of leaves was collected and dried for 12 h at room temperature (25 °C) and then at 50 °C for 24 h in a convection oven. The dried leaves were ground, and 48 mg was stored in amber glass jars until extraction of the metabolites [25]. For extraction, the samples were transferred to a 2 mL Eppendorf tube, to which 750 µL of phosphate buffer in deuterated water with 0.05% trimethylsilylpropanoic acid sodium salt (D2O/TSP) and 750 µL of deuterated methanol (MeOD) were added. Extraction was carried out by sonication for 20 min, and, subsequently, the samples were centrifuged at 13,000 rpm for 10 min, after which 800 µL of the supernatant was taken and transferred to a 5 mm NMR tube for recording.
The 1H-RMN spectra were recorded on a Varian 600 MHz AR Premium Compact spectrometer (Agilent, Santa Clara, CA, USA). Each 1H-RMN spectrum was recorded at 25 °C with 128 scans (nt) under the following parameters: acquisition time (at) of 3.2 s, pulse width (pw) of 30 °C, and a relaxation time (d1) of 1.5 s, requiring about 10 min to record each sample. A presaturation sequence (PRESAT) was used to suppress the residual water signal. The raw spectra obtained from the 1H-NMR were processed with MNOVA software and spectral intensities were normalized with a value of 100 with respect to the TSP signal. A manual TSP reference was performed by placing it at δ 0.0 ppm, and it was apodized with a Gaussian basis function (LB = 0.3 Hz). Spectra were reduced to 0.04 ppm integrated regions (bins) from δ −0.5 to 10. The residual water signal (δ 4.75–4.90 region) and methanol signal (δ 3.29–3.32 region) were excluded from the matrix. The data matrix obtained from the 1H-NMR analysis of the metabolic profile of both varieties contained the intensities of 247 bins (integrated regions) for each of the 48 samples.
Metabolite identification was performed using a representative 1H-RMN spectrum (600 MHz) (nt = 1024), from which the chemical shifts of metabolites characteristic of the species were obtained using 1H-NMR spectra libraries. Assignment of the metabolites corresponding to the selected signals with respect to the VIP (variable importance in projection) statistics and the loading plot was performed by comparison of the chemical shifts and coupling patterns of the detected signals with those reported in previous studies [25,26], the Chenomx NMR Mixture Analysis database, “https://www.chenomx.com/ (accessed on 15 January 2023)”, and the Human Metabolome Database (HMDB), “https://hmdb.ca/ (accessed on 15 January 2023)”.

2.7. Experimental Design and Statistical Analysis

A completely randomized split-plot experimental design was used; the main plots were the irradiance levels (T1, T2, T3, and T4) and the secondary plots were the varieties (MM and C40). Each plot had 20 replicates. An analysis of variance (ANOVA) was applied, and means were compared using Tukey’s test (p < 0.05). The results were analyzed using InfoSat Ver 2013 and Sigmaplot Ver 2004 statistical software. Principal component analysis (PCA) was performed using the matrix of spectral intensities with Pareto scaling in MetaboAnalyst software “https://www.metaboanalyst.ca/MetaboAnalyst/home.xhtml (accessed on 15 January 2023)”. Subsequently, a partial least squares discriminant analysis (PLS-DA) was performed to obtain the model’s most important and influential variables. The model’s quality was determined by the R2 value (variation percentage of the set explained by the Y-predicted components) and Q2 (variation percentage of the set predicted by the model according to cross-validation). Important variables in the PLS-DA model were detected using the VIP plot.

3. Results and Discussion

3.1. Characterization of the Microenvironments

In both solar radiation (R) and photosynthetic photon flux density (PPFD), the open field treatment (T1) had the highest values throughout the day; at 3 pm, the maximum values were reached (1032 W m−2 and 1844 µmol m−2 s−1, respectively) (Figure 1A,B), while the maximum values of R and PPFD in the mesh treatments were 764 W m−2 and 1304 µmol m−2 s−1 for T2 (80%), 635 W m−2 and 1118 µmol m−2 s−1 for T3 (75%), and 529 W m−2 and 854 µmol m−2 s−1 for T4 (50%). The percentages in each treatment indicate the proportion of incident solar radiation on the plants.
Furthermore, the maximum air temperature (AT) recorded at 3 pm (41.8 °C) in T1 was 16.7 °C higher than the optimum temperature (25 °C) reported for tomato cultivation [27]; it was at this time of day when the maximum heat point was reached in T1, with the meshes used in T2, T3, and T4 barely decreasing AT by 1.2, 2.6, and 1.5 °C, respectively (Figure 1C). According to Peet [28], daytime temperatures above 35 °C drastically reduce fruit production and seed formation; in this experiment, all treatments were above the optimum temperature for the crop. However, this is an inherent condition in tropical areas. The average night temperature for all treatments was 27.3 °C.
Relative humidity (RH) was maximal at the beginning of the day (above 90%) and minimal at 3 pm in all treatments (T1 = 36%, T2 = 35%, T3 = 41%, and T4 = 37%), and then it began to increase slightly towards dusk (Figure 1D).
According to the characterization of the microenvironments, despite having excellent PPFD conditions, the large amount of R that affects the site causes stressful situations in the functioning of the plants due to the excessive increase in AT and very low RH.

3.2. Morphological Variables and Biomass Distribution

According to the analysis of variance, all morphometric variables (height, number of leaves, and leaf area) were statistically affected by the shading treatments. Under the highest irradiances, the plants were shorter; in T1, the height was 86.5 cm and 74.3 cm in C40 and MM, respectively, while in T2, it was 93 cm (C40) and 90.6 cm (MM). The plants of T3 (135 and 158 cm in C40 and MM, respectively) and T4 (154.8 and 161.3 cm in C40 and MM, respectively) were the tallest (Table 1). A similar trend was observed in the leaf area, with C40 and MM presenting reduced leaf area in the treatments with more light. However, in the number of leaves, significant differences were only observed in T1-MM compared to T3 or T4. This result indicates that the higher the irradiance, the shorter the plants, the lower the leaf area, and the lower the biomass.
We also observed that the treatments with lower light intensity promoted plant growth, possibly in search of the resource [29]. By comparison, treatments with more light decreased leaf size, which is a typical response in plants growing in environments with high radiation and temperature, as they reduce their boundary layer to avoid water loss [30]. In this regard, Ayala-Tafoya et al. [29] observed that using mesh to reduce total radiation (30 and 50%) increased leaf size and, consequently, leaf area with photosynthetically more efficient tomato leaves. In some cases, leaves exposed to low light intensities may have a higher photosynthetic efficiency than leaves with higher exposure; this is because they make the most of the resource to be able to maintain themselves, while exposed leaves may present a photosynthetic acclimation that limits their maximum light saturation rate [31].
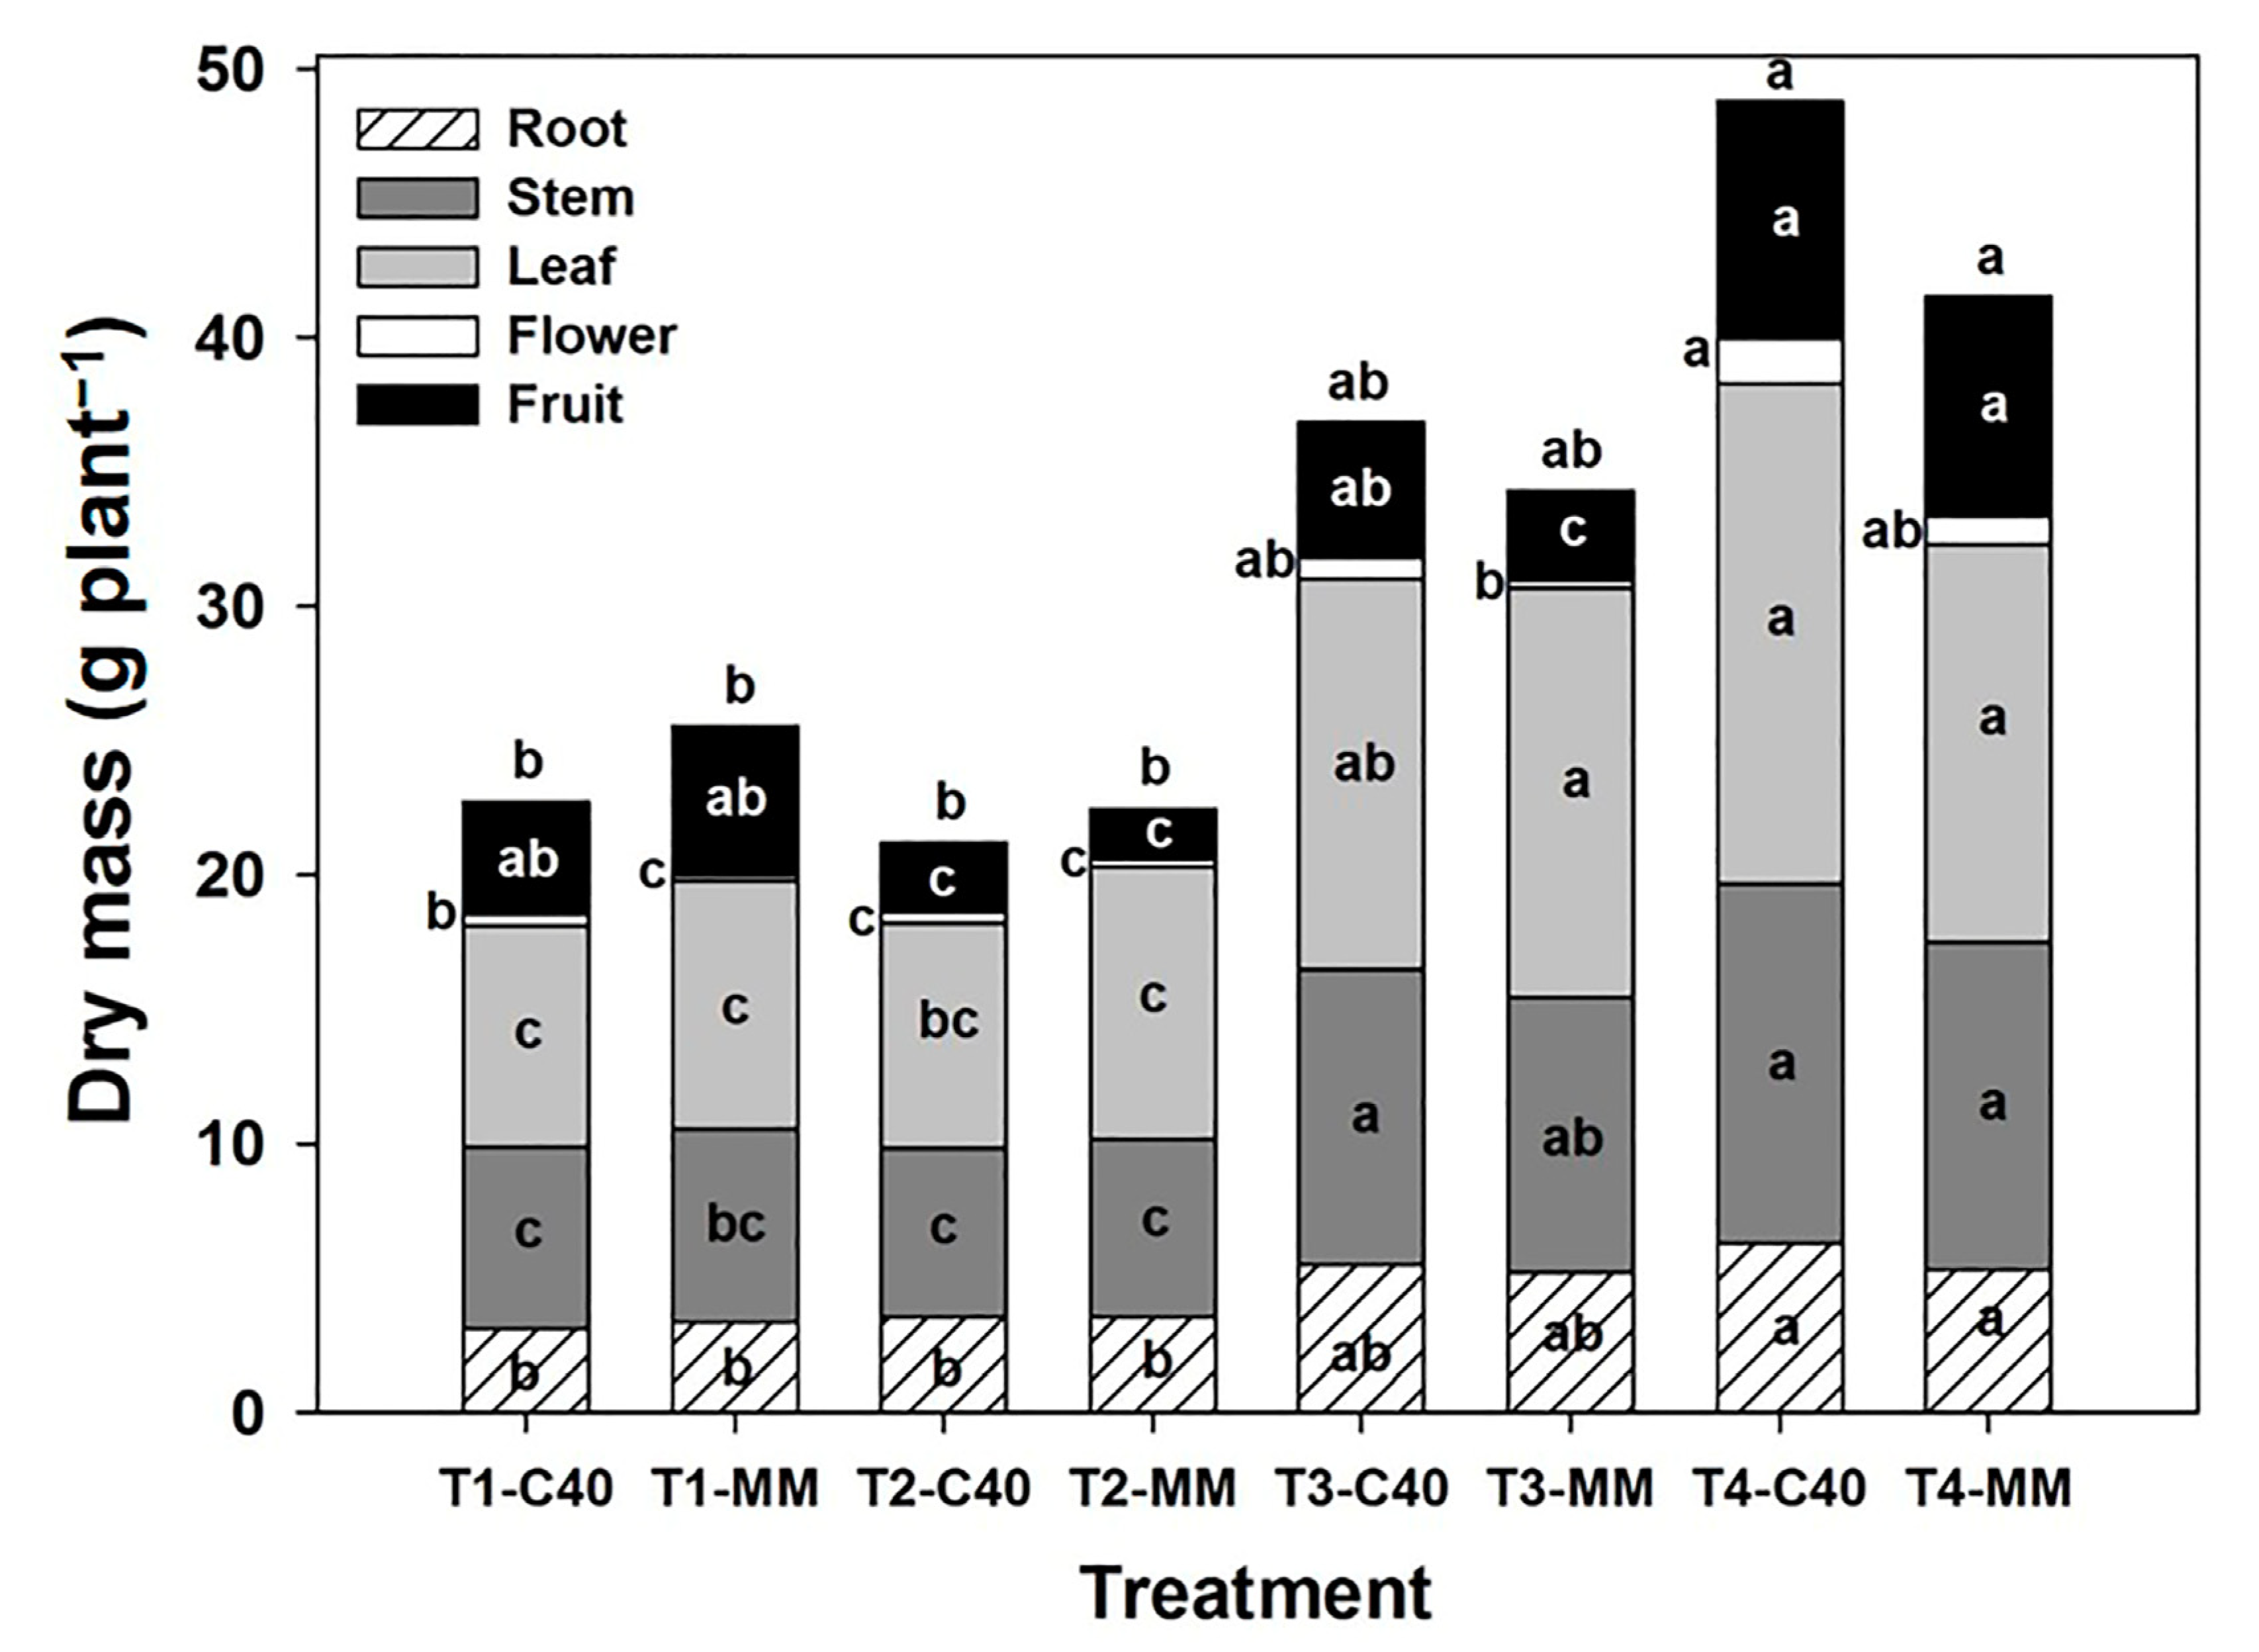
According to the analysis of variance, biomass accumulation was statistically different in all organs depending on the treatment. In the lower irradiance treatments (T3 and T4), the C40 and MM plants accumulated greater biomass in the roots (T3: 5.52 and 5.21 g plant−1, T4: 6.34 and 5.33 g plant−1, respectively), stems (T3: 10.96 and 10.23 g plant−1, T4: 13.33 and 12.16 g plant−1, respectively) and leaves (T3: 14.52 and 15.24 g plant−1, T4: 18.64 and 14.81 g plant−1, respectively) compared to the T1 and T2 plants (Figure 2). On the other hand, only flower biomass was found to be significantly different due to the effect of the variety, with C40 in T4 (1.63 g plant−1) exhibiting significantly increased flower biomass compared to the plants in T1 (0.42 and 0.21 g in C40 and MM, respectively) and T2 (0.39 and 0.28 g plant−1 in C40 and MM, respectively). As shown in Figure 2, the highest fruit dry mass accumulation was observed in T4 (C40, 8.85 g plant−1 and MM, 8.17 g plant−1). In this sense, Garruña-Hernández et al. [24] noted that in tropical climates the biomass distribution of some vegetables is an indicator of the effect generated by temperature and irradiance on the accumulation of photoassimilates in each plant organ. When heat stress is constant, it can induce morpho-anatomical, physiological, and biochemical changes [11]; it is likely that the MM variety, being of temperate origin, had lower biomass values than C40, which is of tropical origin. Some studies found that high irradiance and temperature affect the development of tomato plants, causing burning and abscission of leaves, branches, and stems, premature leaf senescence, attenuated root growth, floral abortions, and fruit drop. Several studies reported that the latter is due to these environmental conditions inducing flower malformation caused by deficient fertilization processes that damage reproductive structures, resulting in deficient fruit setting and reduced yields [7,12].

3.3. Leaf Photochemistry

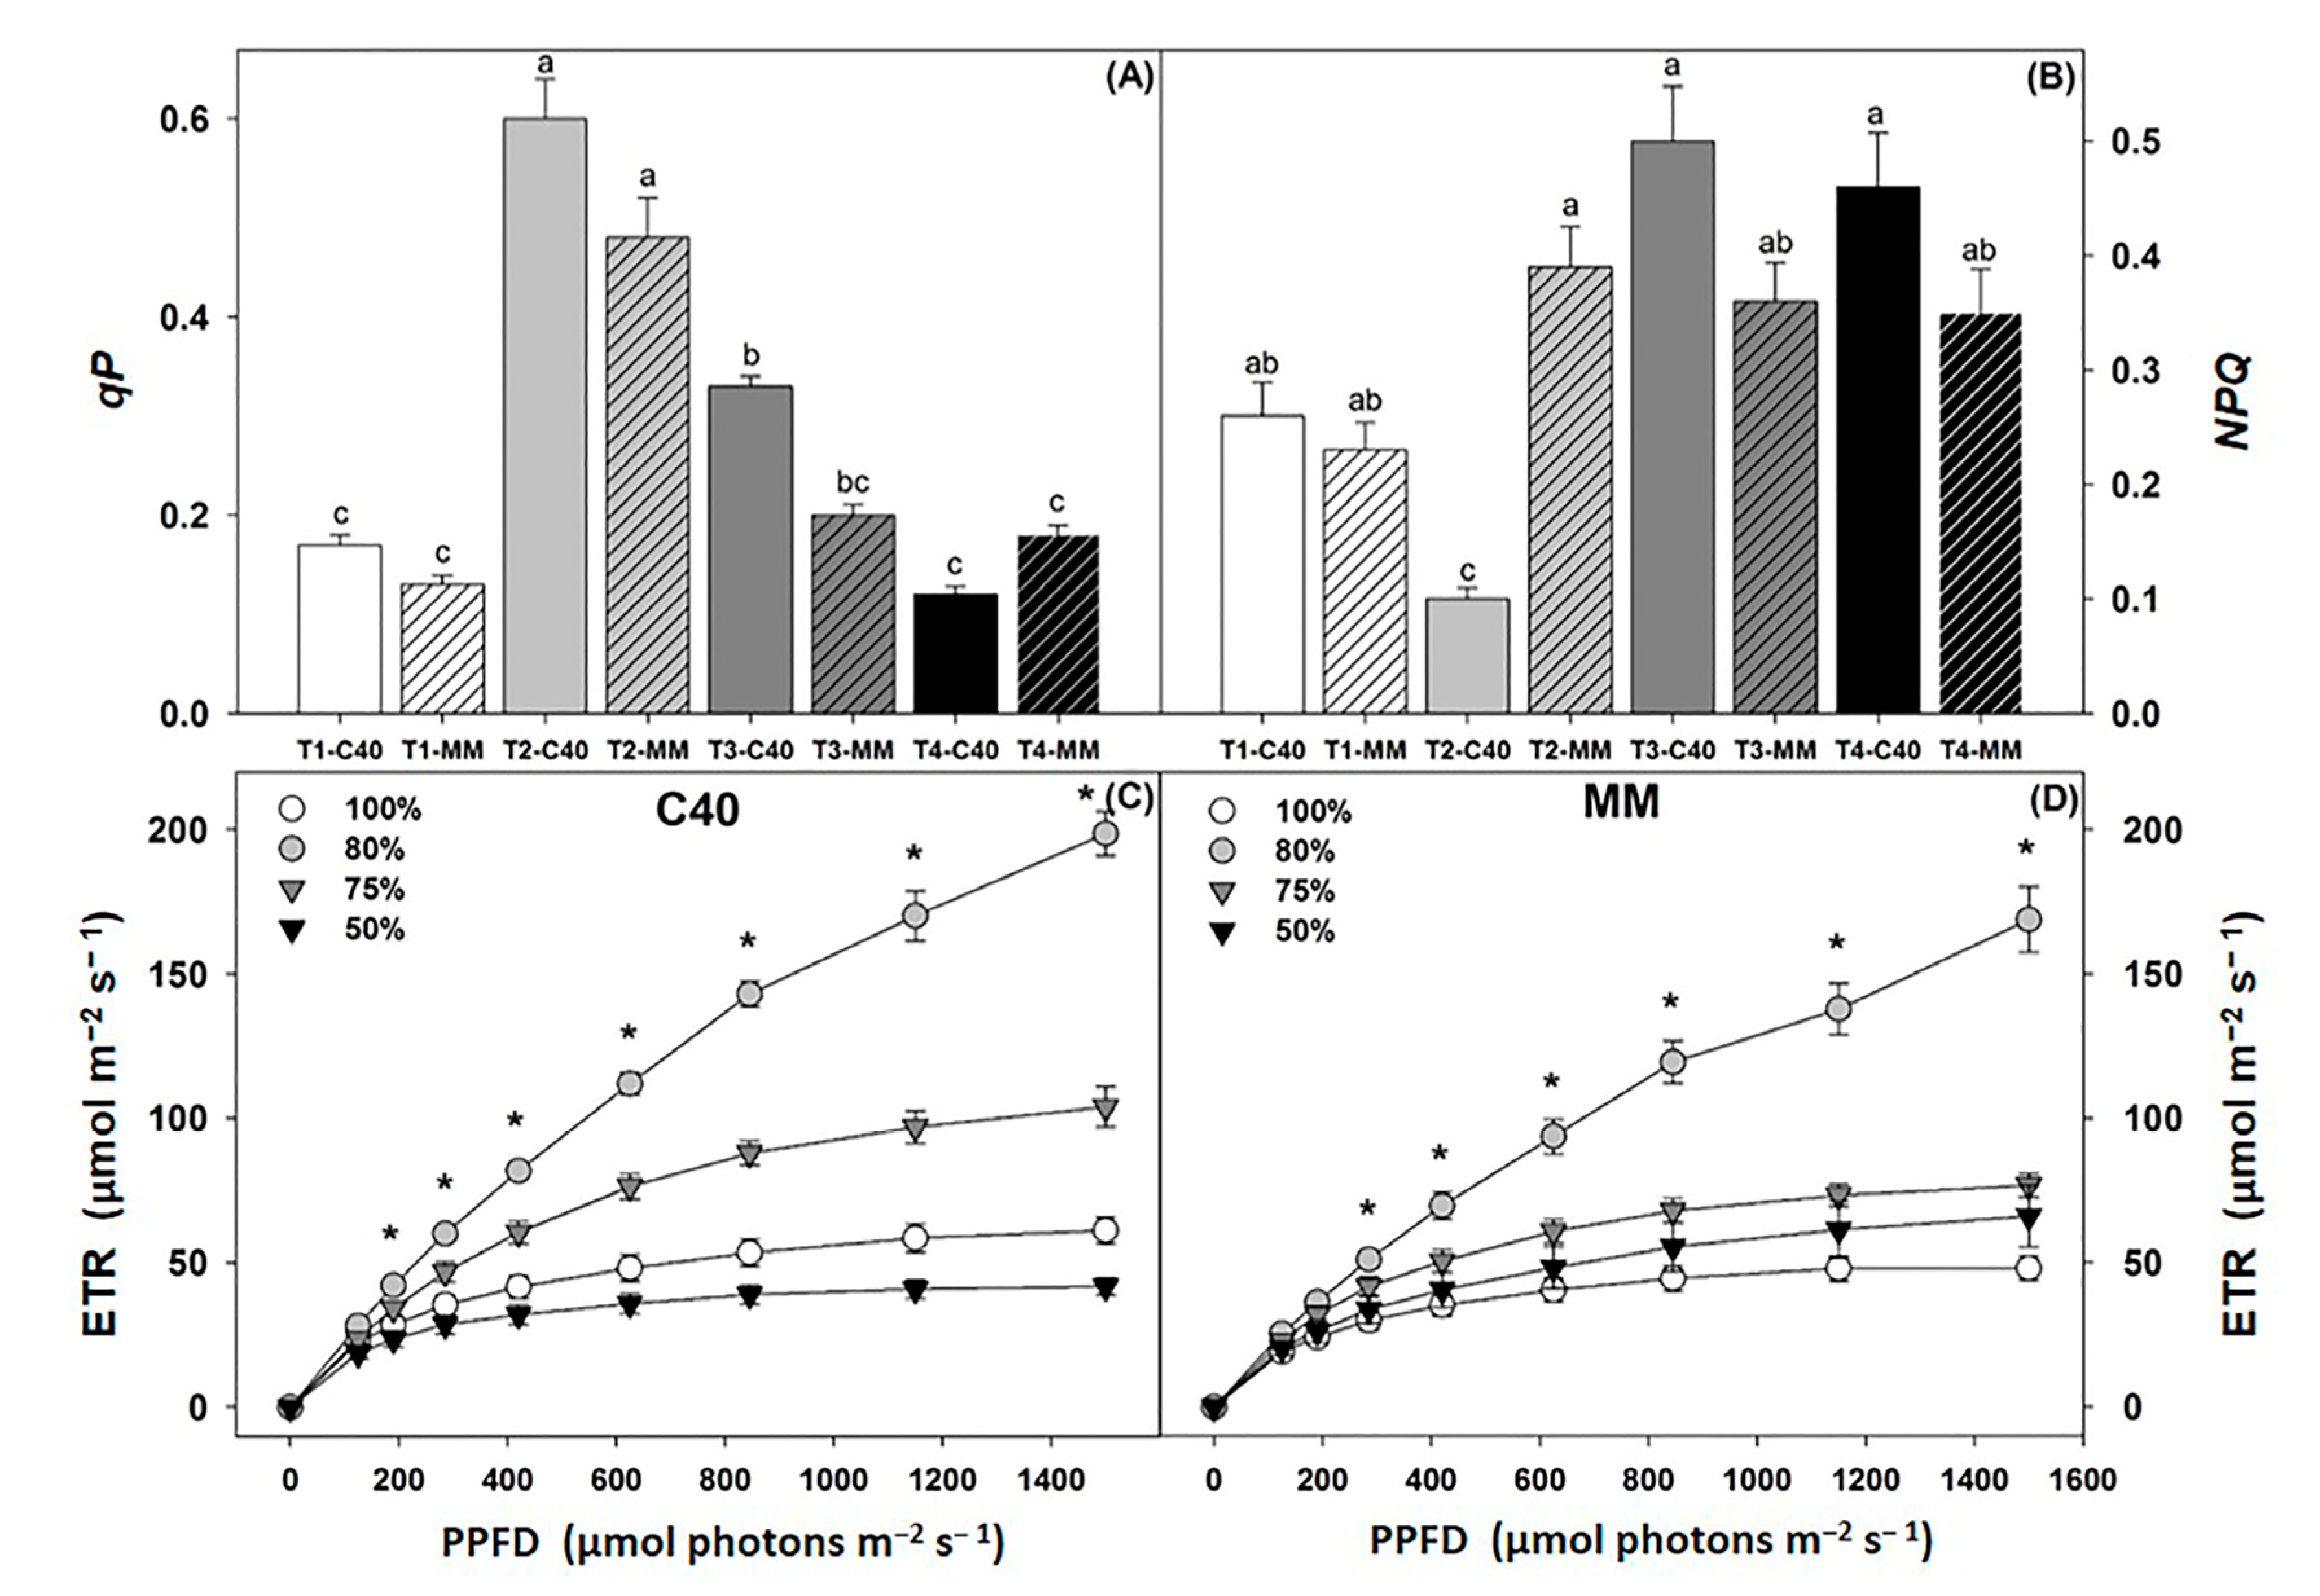
According to the analysis of variance, there were no statistical differences (p ≤ 0.05) in the maximum quantum yield of photosystem II (Fv/Fm = chlorophyll fluorescence) among treatments. However, there were significant differences in qP, such that it decreased in extreme environments (T1 and T4 with 100 and 50% irradiance, respectively). In contrast, the highest qP values were observed in T2 (C40 = 0.60 and MM = 0.48), indicating that there is not necessarily a linear trend between the amount of light reaching the plant and the amount of energy allocated to photochemical processes in tomato (Figure 3A). Furthermore, in the non-photochemical quenching coefficient (NPQ), the C40 variety in T2 (with PPFD of 1300 µmol m−2 s−1) had the lowest values (0.1) (Figure 3B). This observation was reflected in the electron transport rate, where the plants of the two varieties grown with 80% solar irradiance (T2) statistically outperformed the rest of the treatments, followed by the plants that received 75% irradiance (T3) (Figure 3C,D, respectively). The excess and lack of light (T1 = 100 and T4 = 50% solar irradiance) affected leaf photochemistry in this case. Alternatively, a moderate decrease in irradiance decreased the amount of energy going to non-photochemical processes and caused more energy to be channeled to photochemical processes, which favored the electron transport rate of photosystem II in tomato plants regardless of the variety. In this case, the amount of radiation received at the site is likely excessive, and the rate of D1 protein regeneration of tomato plants is not adequate for the site’s environmental conditions, to the extent of saturating the photosystems [32]. In places with high radiation levels, utilizing meshes could be an alternative to reduce the quantity of light or modify its quality. However, an increase in leaf photochemistry does not always result in greater carbon assimilation or increased biomass, as other factors could limit these processes [31].

3.4. Gas Exchange

At noon, all treatments reached the highest net CO2 assimilation rate (NA), which decreased as the sun set. However, the treatments with the lowest irradiance (with 75% and 50% solar radiation) produced the highest NA values throughout the day, reaching up to 23.6 and 23.9 µmol m−2 s−1 in C40 and 22.7 and 22.6 µmol m−2 s−1 in MM, respectively (Figure 4A,B). This result suggests that a higher incidence of PPFD will not necessarily be reflected in a higher carbon assimilation rate. In this sense, there is likely some biochemical limitation in the photosynthetic mechanism caused by excess light or high temperature [12]. There are species that, when faced with excess light energy, suffer damage to their photosystems and do not recover adequately [33]. The damage can increase when the growth temperature rises above the optimum for the crop [34], as was the case in this experiment. In this case, PPFD values between 800 and 1200 µmol m−2 s−1 were sufficient to reach the highest NA values without inflicting photodamage. The latter coincides with the results obtained in the light saturation curves (A/PPFD), where it was observed that, except for MM in T4 (50% irradiance), the treatments had photosynthetic acclimation above 1200 µmol m−2 s−1 of PPFD (Figure 4C,D). The response of MM in the 50% irradiance treatment is likely due to the ability of that genotype to increase carbon assimilation in response to light increases. However, in the CO2 saturation curves (A/Ci), photosynthetic acclimation was not observed in any treatment. Instead, the trend was similar to that observed in the diurnal courses, with the highest photosynthetic values detected in the treatments with the lowest irradiance (Figure 4E,F). Only in the MM genotype at 50% irradiance did we observe a clear difference from 200 µmol−1 mol−1 of CO2, where it obtained its compensation point, to 1500 µmol−1 mol−1 of atmospheric CO2.

3.5. Principal Component Analysis

In the principal component analysis (PCA) score plot of the leaf extracts (PC1 vs. PC2, 72.5% explained variance), the four solar irradiance treatments and the two tomato varieties were clustered in the central part of the plot, suggesting that all samples have a similar metabolic profile and that the differences among treatments consist primarily of variations in the abundance of the metabolites present (Figure 5 and Figure S1).
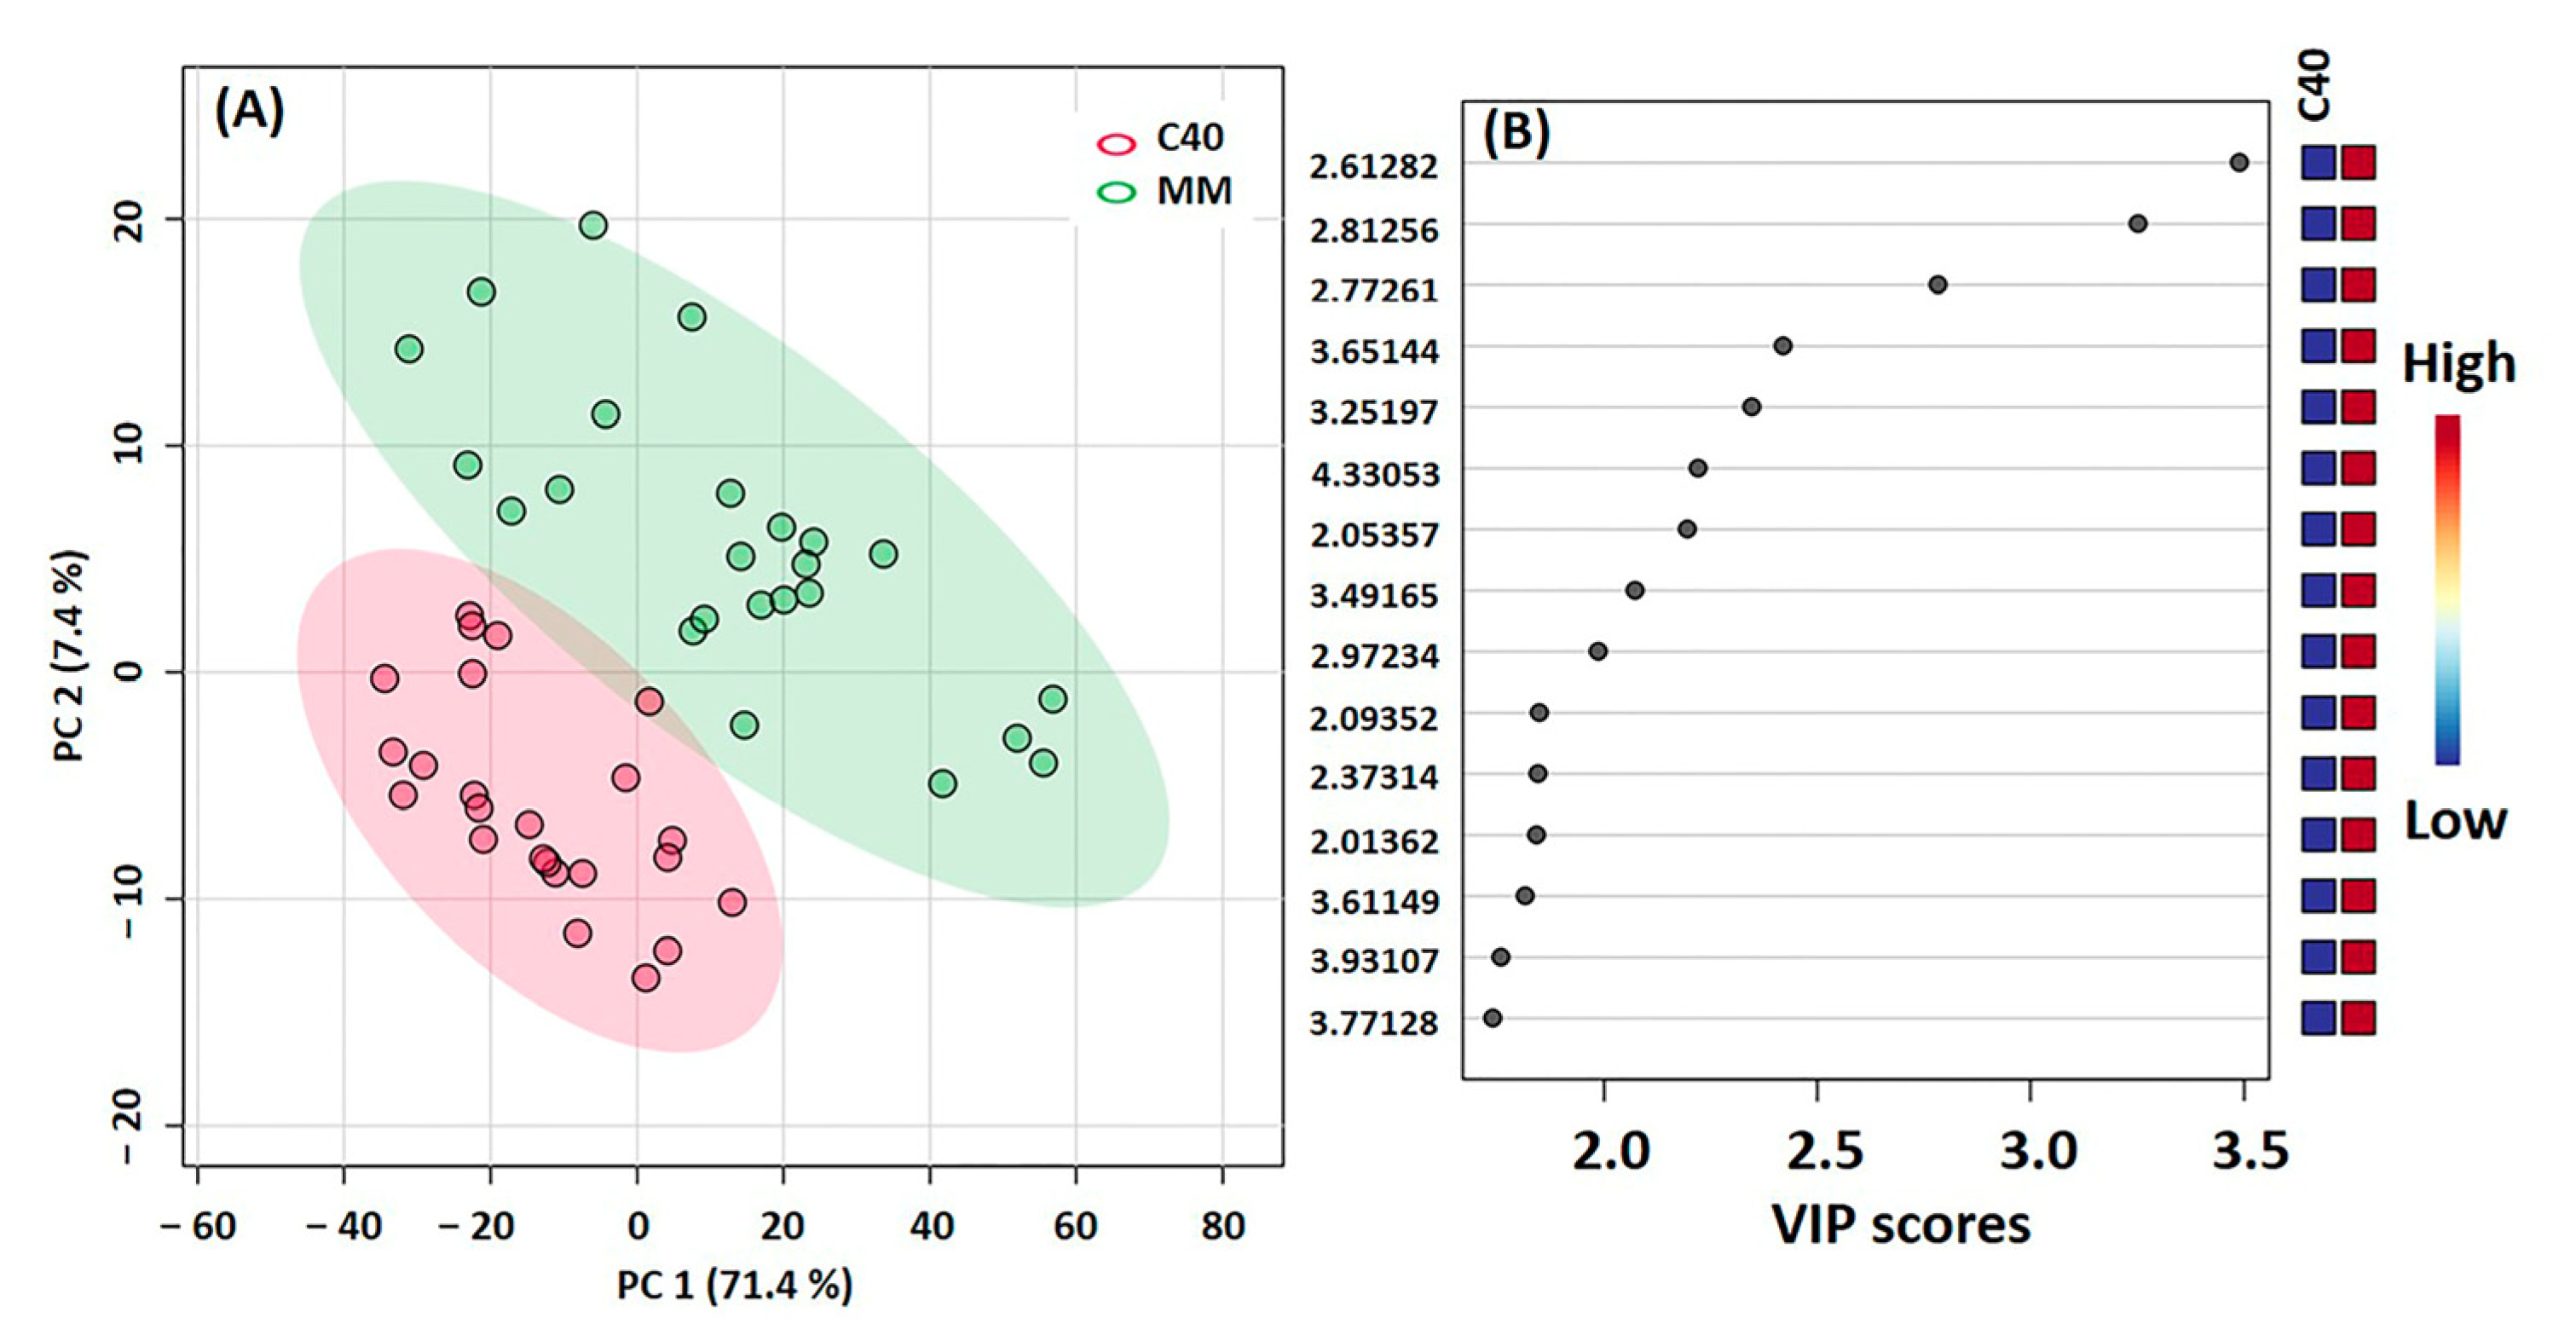
PLS-DA was used to analyze the differences between tomato varieties. Thus, a clear separation between the two varieties was observed (Figure 6A) in the VIP, and loading plots were analyzed to identify the signals responsible for this separation and the differences between the varieties. It was found that the signals with the most significant influence on the separation of the samples are those with chemical shifts in the range of δ 2–4. Amino acid and carbohydrate resonances commonly occur in this spectral region, so it can be inferred that these compounds mark a difference between the two varieties, particularly the signals at δ 3.25, 2.09, and 2.01.
Of the 15 VIPs with the most significant influence on principal component 1, different abundances were identified among the metabolites with the values of δ 3.25, 2.61, 2.09, and 2.01; these metabolites corresponded to proline (δ 4.12, 3.41, 3.32, 2.34, 2.09, 2.01), glucose (δ 3.25, 3.40, 3.46, 3.52, 3.728, 3.82, 3.89, 4.63, 5.22), and aspartate (δ 7.92, 4.41, 2.72, 2.51, 2.03) (Table S1) [35]; therefore, the commercial variety MM presented a higher abundance of these metabolites in its metabolic profile compared to the wild variety (C40), with amino acids being the predominant metabolites. The separation of the tomato varieties was due to a high concentration of amino acids, such as proline, glycine, and aspartate, and sugars such as glucose. In general, the main difference between the C40 and MM varieties was due to the abundance of metabolites, mainly amino acids.
The maximum and minimum solar radiation treatments (T1 = 100 and T4 = 50%) were analyzed to identify differences due to the environment. The PLS-DA-generated model produced an R2 of 0.61547 and 0.56906 and a predictive capacity (Q2) of 0.4592 and 0.43004 for C40 and MM, respectively (Figure 7A,B). These results indicate that there is a noticeable effect on the abundance of metabolites present in tomato leaves. Therefore, considering the 15 VIPs with the greatest influence on principal component 1, in the commercial tomato variety (MM), metabolites with chemical shifts of 3.25 (glucose) were identified, while in the wild variety (C40) only chemical shifts corresponding to amino acids (proline δ 1.09 and valine δ 1.01) were identified. The metabolites identified are part of the projection that best discriminates between the treatment conditions (100% and 50% solar irradiance) (Figure 7C,D). At higher light availability, an increase in the intensity of the signals was observed, while in less light, the abundance of metabolites was lower. In MM, the values with the most significant influence were amino acids such as glycine and γ-amino butyric acid (GABA), which correspond to a chemical shift of 3.57 and 1.89, respectively. On the other hand, in C40, other metabolites were identified, with a chemical shift of 1.09 and 1.01 corresponding to proline and valine, respectively (Table S1).
In general, the separation of metabolic profiles in tomato plants was observed when the incidence of solar radiation was reduced to 50%. Likewise, there was a greater abundance of metabolites in the commercial tomato variety (MM). In this sense, it is known that abiotic factors induce the production of secondary metabolites in plants [7], and if these factors cause abiotic stress, they can generate the accumulation of proline, GABA, and a variety of carbohydrates [36]. In this regard, Hüther et al. [37] note that an increase in metabolites in tomato plants may be related to light utilization by the photosynthetic electron transport chain. However, in this experiment, the highest ETR and qP were observed in T2 (80% irradiance). That is, even though at higher irradiance, there were more metabolites; the same trend was not observed in the utilization of the light by photosystem II since the plants in the treatment with the most irradiance (T1 = 100%) were the least efficient in using light energy, possibly generating a level of abiotic stress due to excess irradiance. In this regard, Baracaldo et al. [38] state that stress due to light intensity reduces biomass accumulation in tomato plants, with a detrimental effect on photosynthesis, which coincides with the results of this research where the plants in the treatments with the highest light intensity had the lowest photosynthetic rate and consequently the lowest values of total biomass. In this sense, Carrari et al. [39] indicate that light-related stress can decrease fruit size and modify sugar content.
The metabolic profile of MM had a higher abundance of α-glucose, which is generally associated with plant resistance against infections caused by biotic agents such as Meloidogyne incognita [26]. Amino acids play an essential role in plants, whether to overcome stress or disease. Previously, Chaves-Barrantes and Gutiérrez-Soto [40] applied abiotic stress by temperature and observed an increase in the accumulation of soluble sugars, sugar alcohols (mannitol, sorbitol, and glycerol), proline, glycine, betaine, and ternary sulfur compounds. Some authors [41,42,43] noted that the amount of proline in plants rises in response to abiotic stress (drought, high temperature, luminosity, ultraviolet radiation, salinity, and heavy metals in the soil). Regarding the abundance of proline in tomato plants, Schwacke et al. [44] observed an evident increase in response to abiotic stresses such as water stress. Furthermore, Hare et al. [45] observed that proline in plants could play vital roles in different tissues or conditions, while glycine protects the plant against pests [46]. Another important osmolyte is GABA, a non-protein amino acid synthesized from glutamic acid, through a reaction catalyzed by glutamate decarboxylase, for which studies by Wahid et al. [7] indicate that it confers heat tolerance to plants.
Furthermore, although tomato plants can grow in a wide range of climatic conditions, their vegetative and reproductive growth can be seriously affected in conditions of high temperature and irradiance [12].

4. Conclusions

The use of meshes modified the microenvironment. In the most critical hours of the day, solar radiation decreased by 26% to 49% and photosynthetic photon flux density by 29 to 54%, which caused the temperature to fall by 1.2 to 2.6 °C. The treatments with the least light availability (T3 and T4) had the plants with the most remarkable growth in height and leaf area and the most significant accumulation of total biomass. In the photochemical parameters, although in the maximum quantum yield of photosystem II (Fv/Fm), there were no statistical differences among treatments, and the plants grown at 80% irradiance (T2) allocated more light energy to the electron transport chain (ETR) and the photochemical quenching of photosystem II (qP). However, plants exposed to the least irradiance (T3 and T4) displayed the highest photosynthetic rates in the diurnal gas exchange and A/Ci response curves. On the other hand, changes in the abundance of leaf metabolites were observed in the tomato varieties (MM and C40), with the MM variety having a higher abundance of metabolites than the C40 variety. The abiotic irradiance factor directly influenced the leaf metabolome of the two tomato varieties by modifying the abundance of metabolites such as sugars and amino acids. The MM leaves contained more sugars and amino acids at higher irradiance, which reflected their metabolic change under abiotic stress conditions. This study confirmed the potential of using shading meshes to limit irradiance in tropical climates to maintain tomato leaf photosynthetic activity, plant growth, and biomass accumulation.

Supplementary Materials

The following supporting information can be downloaded at: https://www.mdpi.com/article/10.3390/horticulturae9060636/s1, Figure S1: Overlay of 1H-NMR spectra of Solanum lycopersicum leaf extracts from 1 h; Table S1: Metabolites identified from Solanum lycopersicum leaf extracts using 1H-NMR (D2O/MeOH [1:1], 600 MHz).

Author Contributions

Conceptualization, O.J.A.-G. and R.G.; methodology, V.A.D.-V., O.J.A.-G., R.G., G.I.H.-B. and E.H.-N.; validation, V.A.D.-V., O.J.A.-G., H.G. and R.G.; formal analysis, V.A.D.-V., O.J.A.-G., G.I.H.-B., E.H.-N. and R.G.; investigation, V.A.D.-V., O.J.A.-G. and R.G.; data curation, V.A.D.-V. and R.G.; writing—original draft preparation, V.A.D.-V., O.J.A.-G. and R.G.; writing—review and editing, V.A.D.-V., O.J.A.-G. and R.G.; visualization, V.A.D.-V., O.J.A.-G. and R.G.; supervision, V.A.D.-V., O.J.A.-G., H.G. and R.G.; project administration, V.A.D.-V. and R.G. All authors have read and agreed to the published version of the manuscript.

Funding

This research was funded by National Council of Science and Technology (CONACyT, Mexico), project CB 286756 for R.G. and CB 254321 for E.H.-N.

Data Availability Statement

The data presented in this study are available in article.

Acknowledgments

To the National Council of Science and Technology (CONACyT, Mexico) for the postgraduate scholarship granted to the first author V.A.D.-V.

Conflicts of Interest

The funders had no role in the design of the study; in the collection, analyses, or interpretation of data; in the writing of the manuscript; or in the decision to publish the results.

References

  1. FAOSTAT. Food and Agriculture Organization of the United Nations Statistics Division. Available online: http://www.fao.org/faostat/en/#data/ (accessed on 10 May 2023).
  2. Adams, S.R.; Cockshull, K.E.; Cave, C.R.J. Effect of temperature on the growth and development of tomato fruits. Ann. Bot. 2001, 88, 869–877. [Google Scholar] [CrossRef]
  3. Boote, J.K.; Rybak, M.R.; Scolberg, J.M.; Jones, J.W. Improving the cropgrow-tomato model for predicting growth yield response to temperature. HortScience 2012, 47, 1038–1049. [Google Scholar] [CrossRef]
  4. Xu, J.; Wolters-Arts, M.; Mariani, C.; Huber, H.; Rieu, I. Heat stress affects vegetative and reproductive performance and trait correlations in tomato (Solanum lycopersicum). Euphytica 2017, 213, 156. [Google Scholar] [CrossRef]
  5. Orozco, A.J.; Ayala, C.C.; Tatis, H.A. Efecto del cambio climático sobre la fisiología de las plantas cultivadas: Una revisión. Rev. UDCA Actual. Divulg. Científica 2012, 15, 63–76. [Google Scholar] [CrossRef]
  6. Kubien, D.; Von Caemmerer, S.; Furbank, R.; Sage, R. C4 photosynthesis at low temperature. A study using transgenic plants with reduced amounts of Rubisco. Plant Physiol. 2003, 132, 1577–1585. [Google Scholar] [CrossRef]
  7. Wahid, A.; Gelani, S.; Ashraf, M.; Foolad, M.R. Heat tolerance in plants: An overview. Environ. Exp. Bot. 2007, 61, 199–223. [Google Scholar] [CrossRef]
  8. Ruíz-Nieves, J.M.; Ayala-Garay, O.J.; Serra, V.; Dumont, D.; Vercambre, G.; Génard, M.; Gautier, H. The effects of diurnal temperature rise on tomato fruit quality. Can the management of the greenhouse climate mitigate such effects. Sci. Hortic. 2021, 278, 109836. [Google Scholar] [CrossRef]
  9. Kläring, H.P.; Krumbein, A. The effect of constraining the intensity of solar radiation on the photosynthesis, growth, yield and product quality of tomato. J. Agron. Crop. Sci. 2013, 199, 351–359. [Google Scholar] [CrossRef]
  10. Perin, L.; Nogueira Peil, R.M.; Trentin, R.; Anibele Streck, E.; Bergmann da Rosa, D.S.; Hohn, D.; Silveira Schaun, W. Solar radiation threshold and growth of mini tomato plants in mild autumn/winter condition. Sci. Hortic. 2018, 239, 156–162. [Google Scholar] [CrossRef]
  11. Karipcin, M.Z.; Dinç, S.; Kara, M.; Kahraman, S.D.; Alp, I.E.; Cicekci, H. High temperature-tolerant tomato lines: Bioactive compounds. J. Verbr. Leb. 2016, 11, 117–125. [Google Scholar] [CrossRef]
  12. Florido-Bacallao, M.; Alvarez-Gil, M. Aspectos relacionados con el estrés de calor en tomate (Solanum lycopersicum L.). Cultiv. Trop. 2015, 36, 77–95. [Google Scholar]
  13. Geilfus, C.M. Controlled environment horticulture. In Improving Quality of Vegetables and Medicinal Plants; Springer: Cham, Switzerland, 2019; pp. 1–233. [Google Scholar]
  14. Valera, D.; Molina, F.; Gil, J. Las mallas como técnica de control climático en invernaderos. Vida Rural 2001, 8, 50–52. [Google Scholar]
  15. Meza, S.L.; Egea, I.; Massaretto, I.L.; Morales, B.; Purgatto, E.; Egea-Fernández, J.M.; Bolarin, M.C.; Flores, F.B. Traditional tomato varieties improve fruit quality without affecting fruit yield under moderate salt stress. Front. Plant Sci. 2020, 11, 587754. [Google Scholar] [CrossRef]
  16. Kumar, D. Nuclear magnetic resonance (NMR) spectroscopy: Metabolic profiling of medicinal plants and their products. Crit. Rev. Anal. Chem. 2016, 46, 400–412. [Google Scholar] [CrossRef]
  17. Kim, H.K.; Choi, Y.H.; Verpoorte, R. NMR-based metabolomic analysis of plants. Nat. Protoc. 2010, 5, 536–549. [Google Scholar] [CrossRef] [PubMed]
  18. Verpoorte, R.; Choi, Y.; Kim, H. Metabolomics: What’s new? Flavour Fragr. J. 2010, 25, 128–131. [Google Scholar] [CrossRef]
  19. Ruíz-Nieves, J.M.; Magdaleno-Villar, J.J.; Sánchez-Alonso, M.G.; Delgado-Vargas, V.A.; Gautier, H.; Ayala-Garay, O.J. Parameters of physical and physiological quality in tomato seeds produced under high temperature condition during different periods of development. Agroproductividad 2021, 14, 45–50. [Google Scholar] [CrossRef]
  20. Delgado-Vargas, V.A.; Magdaleno-Villar, J.J.; Ayala-Garay, Ó.J.; Garfias-Sánchez, D. Calidad de semillas de tres variedades nativas y una comercial de tomate producidas bajo temperaturas altas. Rev. Chapingo Ser. Hortic. 2018, 24, 215–227. [Google Scholar] [CrossRef]
  21. Guzmán, A.; Corradini, F.; Martínez, P.; Allende, M.; Abarca, P.; Ferlmer, S. Manual de Cultivo Del Tomate al Aire Libre; Instituto de Investigaciones Agropecuarias (INIA): Santiago de Chile, Chile, 2017. [Google Scholar]
  22. Steiner, A.A. The universal nutrient solution. In Proceedings of the 6th International Congress on Soilless Culture, Lunteren, The Netherlands, 29 April 1984. [Google Scholar]
  23. Samaniego-Gámez, B.Y.; Garruña, R.; Tun-Suárez, J.M.; Kantun-Can, J.; Reyes-Ramírez, A.; Cervantes-Díaz, L. Bacillus spp. inoculation improves photosystem II efficiency and enhances photosynthesis in pepper plants. Chil. J. Agric. Res. 2016, 76, 409–416. [Google Scholar] [CrossRef]
  24. Garruña-Hernández, R.; Orellana, R.; Larque-Saavedra, A.; Canto, A. Understanding the physiological responses of a tropical crop (Capsicum chinense Jacq.) at high temperature. PLoS ONE 2014, 9, e111402. [Google Scholar] [CrossRef]
  25. Gall, G.; Colquhoun, I.J.; Davis, A.L.; Collins, G.J.; Verhoeyen, M.E. Metabolite profiling of tomato (Lycopersicon esculentum) using 1H NMR spectroscopy as a tool to detect potential unintended effects following a genetic modification. J. Agric. Food Chem. 2003, 51, 2447–2456. [Google Scholar] [CrossRef] [PubMed]
  26. Afifah, E.N.; Murti, R.H.; Nuringtyas, T.R. Metabolomics approach for the analysis of resistance of four tomato genotypes (Solanum lycopersicum L.) to root-knot nematodes (Meloidogyne incognita). Open Life Sci. 2019, 14, 141–149. [Google Scholar] [CrossRef] [PubMed]
  27. Lorenzo, P.; Sánchez-Guerrero, M.C.; Medrano, E.; García, M.L.; Caparrós, I.; Giménez, M. External greenhouse mobile shading: Effect on microclimate, water use efficiency and yield of a tomato crop grown under different salinity levels of the nutrient solution. Acta Hortic. 2003, 609, 181–186. [Google Scholar] [CrossRef]
  28. Peet, M.M. Physiological disorders in tomato fruit development. Acta Hortic. 2009, 821, 151–160. [Google Scholar] [CrossRef]
  29. Ayala-Tafoya, F.; Zatarain-López, D.M.; Valenzuela-López, M.; Partida-Ruvalcaba, L.; Velázquez-Alcaraz, T.D.J.; Díaz-Valdés, T.; Osuna-Sánchez, J.A. Crecimiento y rendimiento de tomate en respuesta a radiación solar transmitida por mallas sombra. Terra Latinoam. 2011, 29, 403–410. [Google Scholar]
  30. Hang, T.; Lu, N.; Takagaki, M.; Mao, H. Leaf area model based on thermal effectiveness and photosynthetically active radiation in lettuce grown in mini-plant factories under different light cycles. Sci. Hortic. 2019, 252, 113–120. [Google Scholar] [CrossRef]
  31. Arenas-Corraliza, M.G.; Rolo, V.; López-Díaz, M.L.; Moreno, G. Wheat and barley can increase grain yield in shade through acclimation of physiological and morphological traits in Mediterranean conditions. Sci. Rep. 2019, 9, 9547. [Google Scholar] [CrossRef]
  32. Li, L.; Aro, E.M.; Millar, H. Mechanisms of photodamage and protein turnover in photoinhibition. Trends Plant Sci. 2018, 23, 667–676. [Google Scholar] [CrossRef]
  33. Trojak, M.; Skowron, E. Light Quality-Dependent Regulation of Non-Photochemical Quenching in Tomato Plants. Biology 2021, 10, 721. [Google Scholar] [CrossRef] [PubMed]
  34. Yepes, A.; Buckeridge, M.S. Respuestas de las plantas ante los factores ambientales del cambio climático global: Revisión. Colomb. For. 2011, 14, 213–232. [Google Scholar] [CrossRef]
  35. Wishart, D.S.; Knox, C.; Guo, A.C.; Eisner, R.; Young, N.; Gautam, B.; Hau, D.D.; Psychogios, N.; Dong, E.; Bouatra, S.; et al. HMDB: A knowledgebase for the human metabolome. Nucleic Acids Res. 2009, 37, D603–D610. [Google Scholar] [CrossRef]
  36. Serrano, R. Salt tolerance in plants and microorganisms: Toxicity targets and defense responses. Int. Rev. Cytol. 1996, 165, 1–52. [Google Scholar] [CrossRef] [PubMed]
  37. Hüther, C.M.; Martinazzo, E.G.; Rombaldi, C.V.; Bacarin, M.A. Effects of flooding stress in ‘Micro-Tom’ tomato plants transformed with different levels of mitochondrial sHSP23.6. Braz. J. Biol. 2016, 77, 43–51. [Google Scholar] [CrossRef]
  38. Baracaldo, A.; Carvajal, R.; Romero, A.P.; Prieto, A.M.; García, F.J.; Fischer, G.; Miranda, D. El anegamiento afecta el crecimiento y producción de biomasa en tomate chonto (Solanum lycopersicum L.), cultivado bajo sombrío. Rev. Colomb. De Cienc. Hortícolas 2014, 8, 92–102. [Google Scholar] [CrossRef]
  39. Carrari, F.; Asis, R.; Fernie, A.R. The metabolic shifts underlying tomato fruit development. Plant Biotechnol. 2007, 24, 45–55. [Google Scholar] [CrossRef]
  40. Chaves-Barrantes, N.F.; Gutiérrez-Soto, M.V. Respuestas al estrés por calor en los cultivos. I. Aspectos moleculares, bioquímicos y fisiológicos. Agron. Mesoam. 2017, 28, 237–253. [Google Scholar] [CrossRef]
  41. Kavi-Kishor, P.; Sangam, S.; Amrutha, R.N.; Laxmi, P.S.; Naidu, K.R.; Rao, K.S.; Reddy, K.J.; Theriappan, P.; Sreenivasulu, N. Regulation of proline biosynthesis, degradation, uptake and transport in higher plants: Its implications in plant growth and abiotic stress tolerance. Curr. Sci. 2005, 88, 424–438. [Google Scholar]
  42. Verbruggen, N.; Hermans, C. Proline accumulation in plants: A review. Amino Acids 2008, 35, 753–759. [Google Scholar] [CrossRef] [PubMed]
  43. Szabados, L.; Savouré, A. Proline: A multifunctional amino acid. Trends Plant Sci. 2010, 15, 89–97. [Google Scholar] [CrossRef] [PubMed]
  44. Schwacke, R.; Grallath, S.; Breitkreuz, K.E.; Stransky, E.; Stransky, H.; Frommer, W.B.; Rentsch, D. LeProT1, a transporter for proline, glycine betaine, and γ-amino butyric acid in tomato pollen. Plant Cell 1999, 11, 377–391. [Google Scholar] [CrossRef]
  45. Hare, P.D.; Cress, W.A.; Van Staden, J. Dissecting the roles of osmolyte accumulation during stress. Plant Cell Environ. 1998, 21, 535–553. [Google Scholar] [CrossRef]
  46. Rodríguez, A.; Campo-Costa, A.; Batista-Ricardo, E.; Morales-Miranda, A.; Camejo-Gálvez, A.I. Influencia del Biobras 16 y Fitomas-E contra el tizón temprano y el geminivirus (TYLCV) en cultivo de tomate (Solanum licopersicum). ICIDCA. Sobre Los Deriv. De La Caña De Azúcar 2017, 51, 3–7. [Google Scholar]
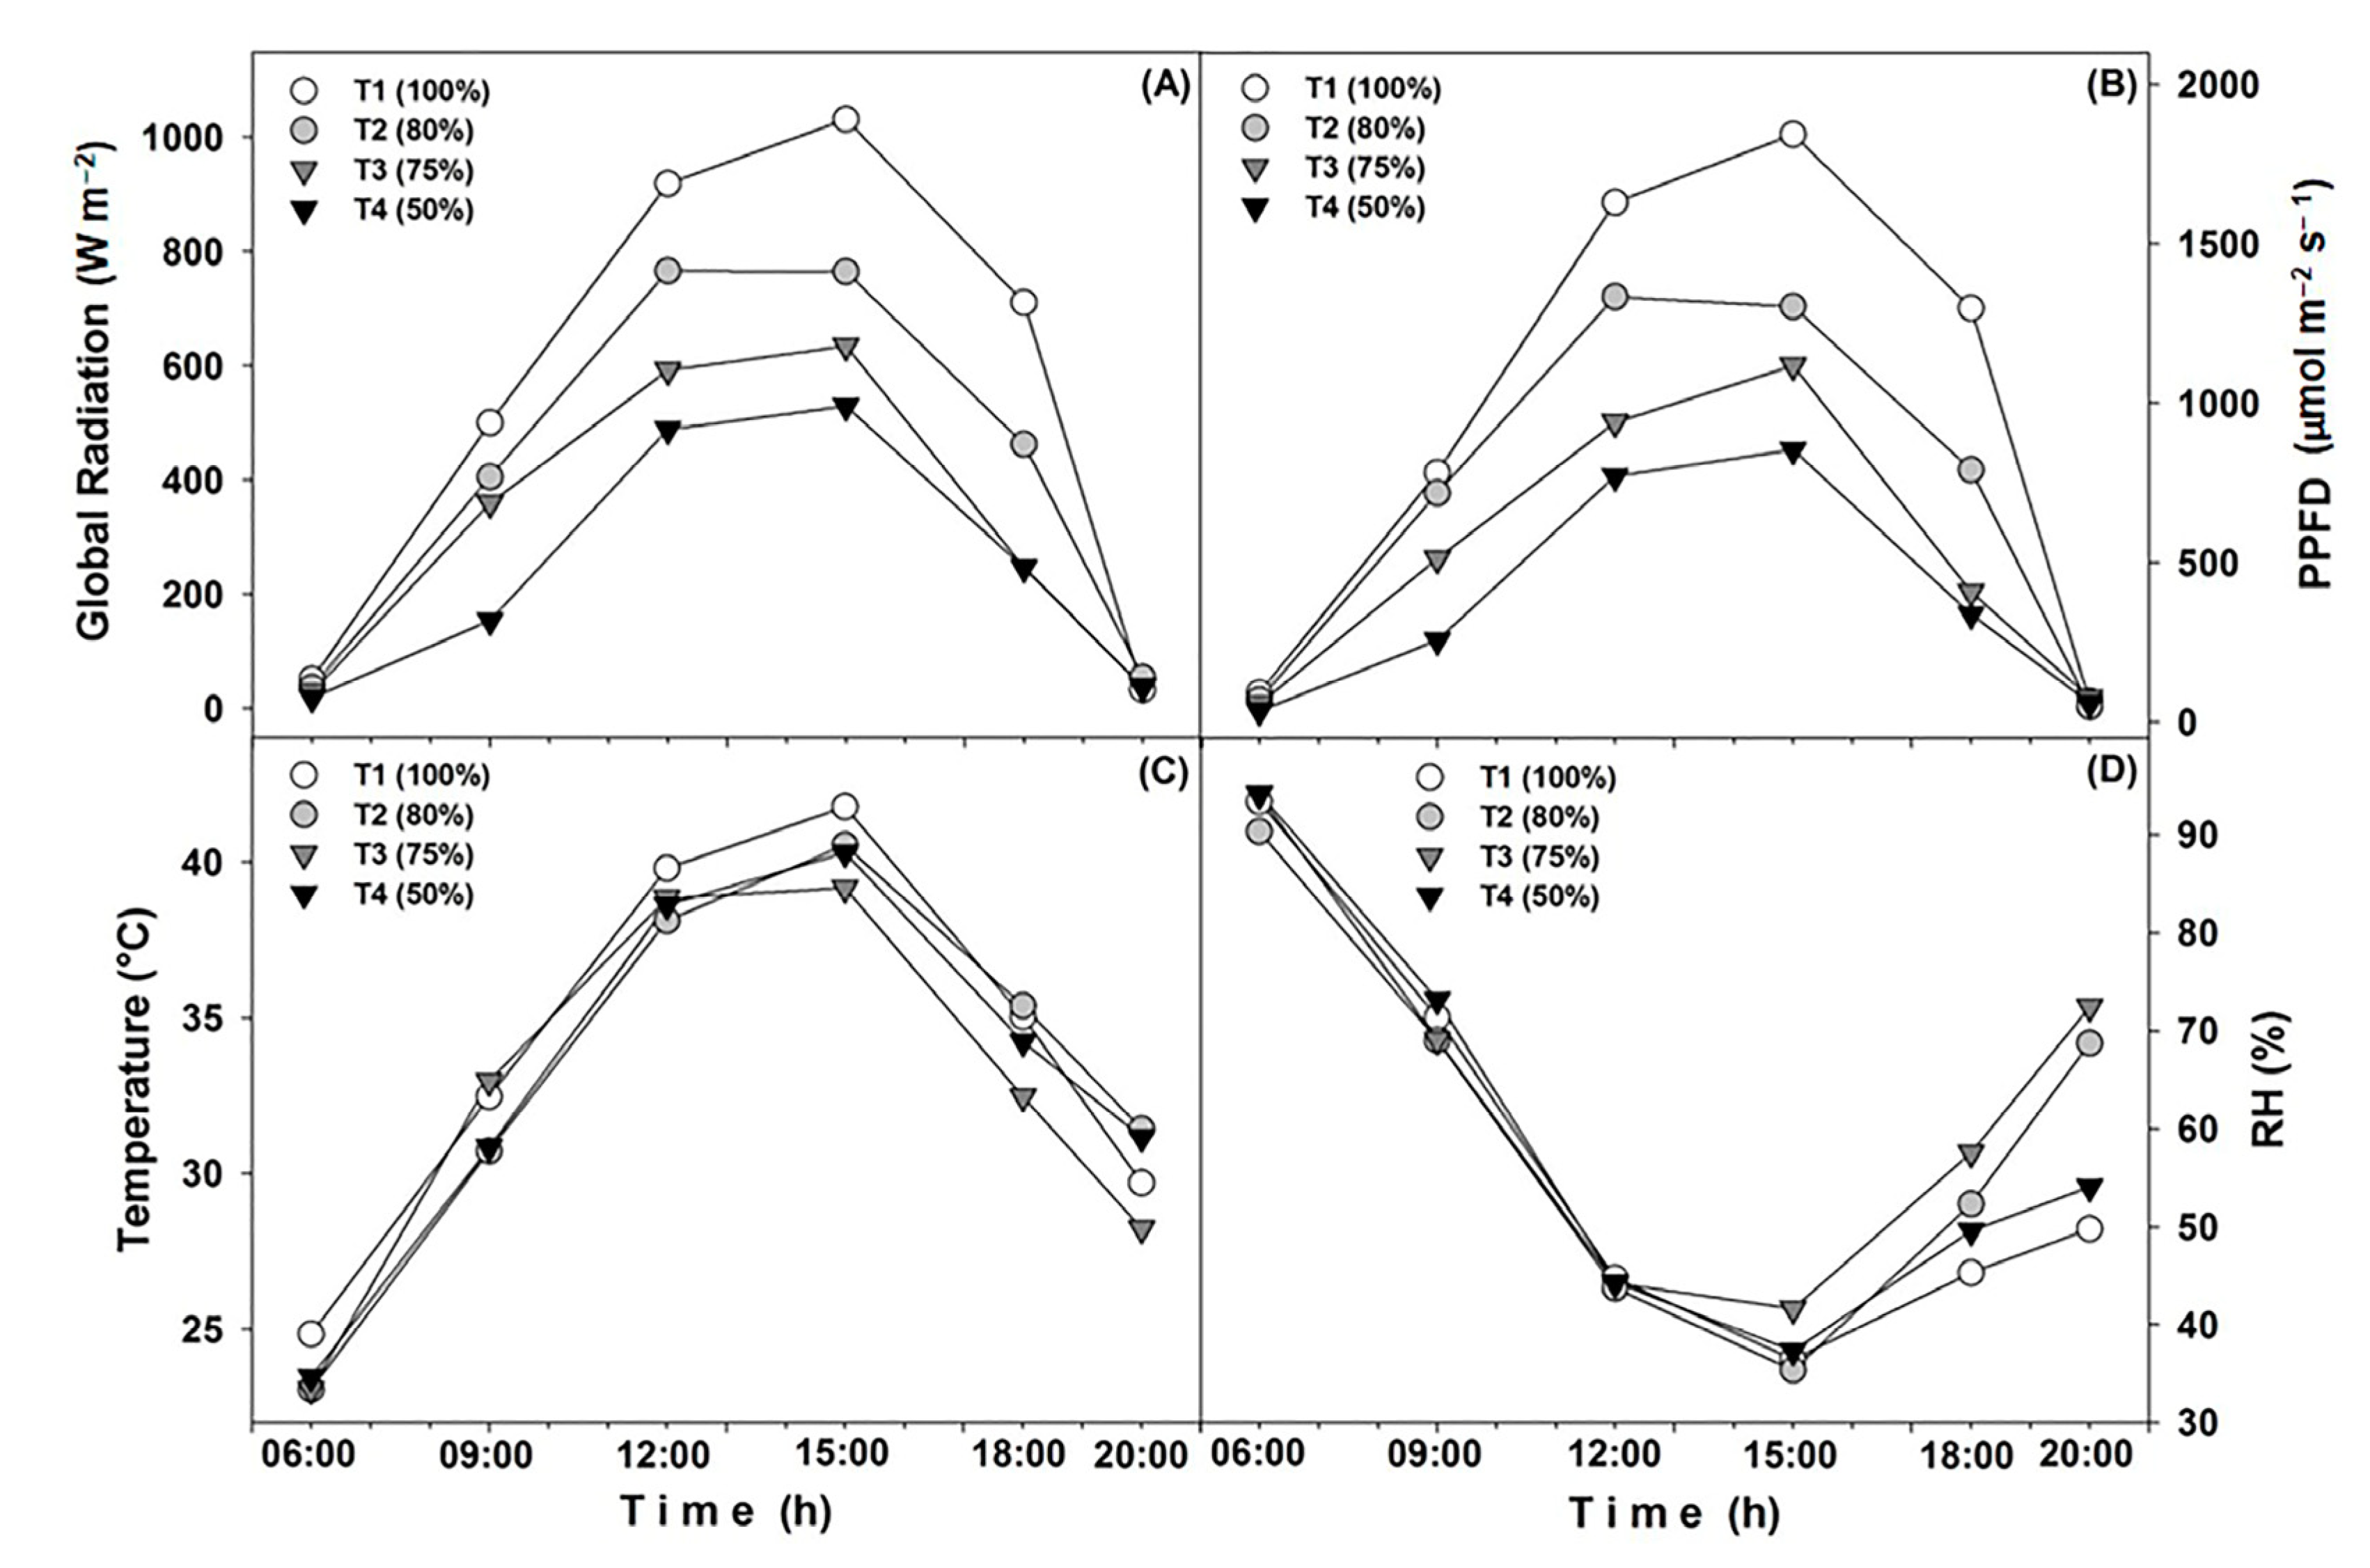
Figure 1. (A) Solar radiation (R), (B) photosynthetic photon flux density (PPFD), (C) air temperature (AT), and (D) relative humidity (RH) of four environments generated by meshes that allowed light to pass through at 80% (T2), 75% (T3), and 50% (T4), and a control (100% = T1). Measurements were made on a clear sunny day 120 das.
Horticulturae 09 00636 g001
Figure 2. Biomass per organ of the C40 and MM tomato varieties grown at four different solar irradiance levels (T1: 100%, T2: 80%, T3: 75%, and T4: 50%). Data are means; n = 9. Different letters in the same organ indicate significant statistical differences (Tukey, p ≤ 0.05).
Horticulturae 09 00636 g002
Figure 3. (A) Photochemical quenching coefficient (qP), (B) non-photochemical quenching coefficient (NPQ) and electron transport rate of PSII of tomato varieties C40, (C), and MM (D), grown at four different solar radiation levels (100%, 80%, 75%, and 50%). Data are means ± standard error; n = 9. Different letters in the same column and * between PPDF levels indicate significant statistical differences (Tukey, p ≤ 0.05).
Horticulturae 09 00636 g003
Figure 4. Photosynthesis throughout the day, A/PPFD, and A/Ci response curves of tomato varieties C40 (A, C, and E, respectively) and MM (B, D, and F, respectively), grown at four different solar irradiance levels (100%, 80%, 75%, and 50%). Data are means ± standard error; n = 9. * = significant statistical differences (ANOVA, p ≤ 0.05).
Horticulturae 09 00636 g004
Figure 5. PCA score plot (PC1 vs. PC2) of leaf metabolic profiles of two tomato varieties (C40 and MM) grown at four different solar irradiance levels (T1 = 100%, T2 = 80%, T3 = 75%, and T4 = 50%).
Horticulturae 09 00636 g005
Figure 6. (A) Partial least squares discriminant analysis (PLS-DA, PC1 vs. PC2) and (B) main VIPs with the most significant influence on PC1 variation of two tomato varieties (C40 and MM).
Horticulturae 09 00636 g006
Figure 7. (A) Partial least squares discriminant analysis (PLS-DA, PC1 vs. PC2) and (B) main VIPs with the most significant influence on PC1 variation of treatments with minimum (50%) and maximum (100%) solar irradiance on tomato varieties C40 ((A) and (C), respectively) and MM ((B) and (D), respectively).
Horticulturae 09 00636 g007
Table 1. Plant height, number of leaves, and plant leaf area of two tomato varieties (C40 and MM) grown at four different solar irradiance levels (T1: 100%, T2: 80%, T3: 75%, and T4: 50%). Measurements were made 130 das.
TreatmentsVarietyPlant Height (cm)Number of LeavesLeaf Area (cm2)
T1C4086.5 ± 1.66 b13.2 ± 1.65 ab882.8 ± 97.75 cd
MM74.3 ± 3.26 b6.5 ± 0.87 b358.1 ± 29.75 d
T2C4093.0 ± 2.64 b12.7 ± 1.31 ab716.5 ± 127.97 cd
MM90.6 ± 2.59 b14.3 ± 1.49 a879.6 ± 43.90 cd
T3C40135.0 ± 3.94 a19.8 ± 0.75 a2075.4 ± 202.61 ab
MM158.0 ± 7.40 a18.0 ± 1.58 a1459.3 ± 61.18 bc
T4C40154.8 ± 1.80 a19.8 ± 0.75 a3100.8 ± 264.90 a
MM161.3 ± 8.96 a14 ± 2.48 a1481.7 ± 209.40 bc
LSD27.157.091051.4
Data are means ± standard error; n = 9. Different letters in the same column indicate significant statistical differences (Tukey, p ≤ 0.05). LSD = least significant difference.
Disclaimer/Publisher’s Note: The statements, opinions and data contained in all publications are solely those of the individual author(s) and contributor(s) and not of MDPI and/or the editor(s). MDPI and/or the editor(s) disclaim responsibility for any injury to people or property resulting from any ideas, methods, instructions or products referred to in the content.