Abstract
The seed yield in pea (Pisum sativum L.) depends on numerous environmental and genotypic factors. The ongoing climate changes draw one’s attention to genetics and variation of underexplored reproductive traits. This study focuses on ovule number (ON) and flower size expressed as a length of flag petal (FL), in terms of their heritability, variability, and correlation with 1000 seed mass (TSM), seed number per pod, and seed/ovule ratio. A set of pea accessions was planted over several years in field conditions. Some of these accessions were also grown in a glasshouse. The chosen values were scored on living plants or while harvesting seeds. Nonparametric statistical methods were applied. Heritability of ON and FL was studied in five hybrid F1/F2 combinations. We found a relatively low (ca. 0.5) broad sense heritability of both ON and FL. Among other traits, TSM and ON reproduced best over the years. FL exhibited no reproducible correlations with other traits and cannot be used as a predictor of productivity. Water deficit and heat stress reduce seed yield in pea due to both seed abortion and development of fewer ovules. The differential and heritable ability to retain ON may become a basis for breeding pea cultivars adapted to changing climate.
1. Introduction
The garden pea (Pisum sativum L., Leguminosae) is one of the most ancient legume crops in temperate latitudes [1]. Moreover, it was the first model object in genetics. That is why the correlation between and genetic control of different traits, especially agriculturally valuable ones, has been under thorough examination for decades. Even in several recent years, numerous works reported correlations between different morphological features and seed yield [2,3,4,5,6,7,8,9,10]. Only relatively strong (r > 0.5) and statistically significant correlations are discussed below. The seed yield in pea (i.e., mass of seeds produced by a single plant or a plot) was found predictably correlated with primary components of productivity, such as number of seeds [5,9] and pods [4,5,6] per plant or, to a surprisingly lesser extent, number of seeds per pod [3,6,9,10]. Data on the impact of 1000 seed mass on a yield are contradictory. While Shurkhaeva et al. [9] reported a negative correlation between seed yield and 1000 seed mass, some other authors [6,10] found these two traits to be positively correlated.
It is important to understand how seed yield is affected by the components of potential productivity. Among these, the ovule number (ON) is possibly the most significant, as seeds are directly derived from ovules, and ON can correlate with the number of seeds per pod (SN) [11]. There are not many works reporting how ON is inherited in pea and other legumes. Marx and Mishanec [12] stated that ON is controlled by approximately three loci with an additive effect in pea. A similar conclusion was drawn in a set of later papers [13,14,15]. A relatively low heritability (0.38) was reported for ON in pea [13]. Four loci with additive genetic effects were suggested to control ON in Medicago L. [16]. A partial dominance of low ON over high was recorded in pea [13]. This agrees with fact that F1 hybrids of interspecific and intergeneric crosses between Cajanus cajan (L.) Millsp. and Atylosia spp. had a lower average ON than the expected midparent value [17]. A simpler, probably monogenic, control of ON was reported in Phaseolus vulgaris L. [18].
Additionally, ON is partly dependent on pod length and shape, so genes controlling pod shape also affect ON in pea [2,7,12,19]. However, this association is not as tight as might be expected [19]. Some other morphological mutations may have a minor pleiotropic effect on ON (e.g., [20]). The works on model plant species such as Arabidopsis thaliana (L.) Heynh. (Brassicaceae) identified numerous genes involved in determination of ON [21], so in legumes the existing state of knowledge is in its initial state.
Observations on wild relatives of the pea, members of the tribe Fabeae, indicate that larger flowers tend to produce more ovules, i.e., there is a positive, although not very strong, correlation between flower size and ON [22]. This suggests that flower size may serve as a predictor of ON and overall productivity.
The present work aims to study whether ON correlates with more conventional traits of productivity in pea, viz. seed number per pod and 1000 seed mass. We also examined if flower size may serve as a predictor of a higher seed yield. Heritability and reproducibility of both ON and flower size were investigated.
2. Materials and Methods
2.1. Plant Material and Growing Conditions
The following accessions served as material for this study: Adagumskii, Alfa, Anvend, Chika, Fragment, Hurst Green Shaft, Izumrud, Kaira, Kelvedon Wonder, Kreiser, Lu Zhun, Pervenets, Pin Wan, Rannii Gribovskii 11, Senator, Sovershenstvo 65-3, Viking, Viola, Yantar (vegetable cultivars), Batrak, Filby, Frisson, Multik, Nemchinovskii 766, Orel, Orlan, Roi des Gourmands, Spartak (dry pea cultivars), Malinovka (fodder cultivar), A-agrimut 987/6, Az-23, B-agrimut type, B-agrimut 761/7, Novaya forma 42, Ras-tip, SGE, WL131, WL1132, and 5-listochkovaya Acacia (marker lines). More detailed characteristics of accessions are available in [23]. Seeds of all accessions are stored in the germplasm collection of the Dept. of Genetics, Lomonosov Moscow State University.
To study inheritance of quantitative features, we analyzed five F1 and F2 progenies from crosses between different accessions. Two of these hybrid combinations were sown in different conditions, viz., two field seasons and glasshouse. All cultivars, lines and hybrids were planted on the experimental plot of Skadovskii Zvenigorod biological station (Western Moscow District, Russia; N55.702134, E36.727971) in 2015–2017 and 2020–2022. Seeds were sown in the middle of May in a row with a space of ca. 5 cm between them. Rows were separated with gaps of 1 m. As far as plants were elongating, horizontal ropes were strung out to provide a support. Weeds were hoed manually in the course of the plants’ growth. No fertilizers were applied. Pea plants with ripe pods were harvested in first ten days of August. Climatic conditions of growing periods are represented in Figure 1 and Table 1. Climatic data were obtained from the automated weather station located on the territory of Skadovskii biological station. In the case of incomplete observations, these were supplemented by records from the weather station in Novo-Ierusalim (N55.907419, E36.824343, ca. 23 km from the biological station) available on rp5.ru (accessed on 10 January 2023).
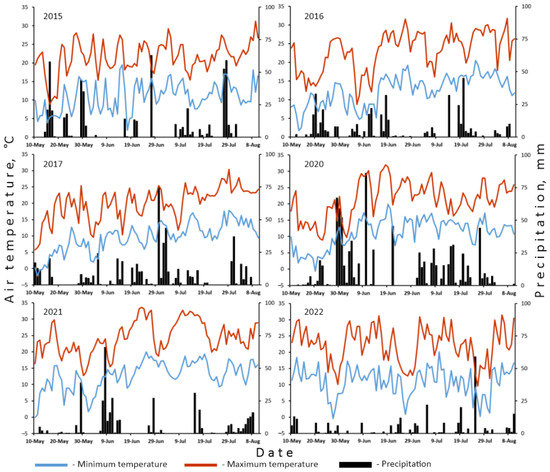
Figure 1.
Daily air temperature (minimum and maximum) and precipitation during field seasons when plants were grown.

Table 1.
Average air temperature (T, °C) and sum of precipitation (P, mm) in different periods of plant growth.
For comparison, selected accessions were planted in a glasshouse under long day conditions with artificial light (lamps DNa3, 46,000 lm; Reflux, Saransk, Russia). Ten pre-soaked seeds of each accession were sown in plastic pots of 24 cm × 24 cm × 20.5 cm filled with a mixture (1:1) of loamy soil and turf ground (Nevatorf, Saint Petersburg, Russia). Plants were watered manually every several days in the course of superficial drying of soil in pots. The temperature regime was not controlled nor recorded but in some periods it exceeded 30 °C.
2.2. Scored Parameters
Length of the flag petal (FL) served as a measure of flower size. Freshly collected or fixed in ethanol (70%) petals were spread under a glass and photographed with a 25 Mpx digital camera (Samsung, Seoul, Republic of Korea). All measurements were carried out in images using the program ImageJ 1.51 k (National Institutes of Health, Bethesda, MD, USA). To minimize imprecision, the length of each flag petal was measured three times. With rare exceptions, a minimum of 20 petals randomly collected from ten or more plants was measured.
The number of ovules was counted either in ovaries of freshly collected flowers or in the course of harvesting mature seeds. Seeds to ovules (S/O) ratio was calculated as an average number of seeds divided by an average number of ovules. For most accessions, 20 pods/ovules were analyzed for SN and ON, although in several cases (especially in glasshouse conditions) sample size was lower (not fewer than five).
Seeds were weighed with an electronic scales Pioneer PA64 (Ohaus, NJ, USA). To obtain the commonly used value of 1000 seed mass (TSM), we usually weighed fewer seeds and then recalculated, as relatively small seed samples were available in most cases.
Not all features were recorded in all seasons for all accessions. For some years, only fragmentary data are available (Table S1).
In F2 Filby × WL1132 and Filby × WL131 (2022), two pods or ovaries were sampled from each hybrid plant to count ovules. In other F2 populations/trials, ovules and petals were sampled randomly from all flowering/fruiting plants.
2.3. Statistical Analysis
All statistical procedures were carried out with usage of Statistica 12 (Statsoft, Tulsa, OK, USA) and Microsoft Excel (Microsoft, Redmond, WA, USA). As a relatively small number of cultivars was used in the comparison, nonparametric methods were applied.
To analyze possible genetic components of studied traits, we applied the method described by Sobolev [24]. Broad sense heritability was calculated according to the following formula:
where s2g stands for genotypic variance, s2p denotes phenotypic variance, s is a standard deviation. The two components of variance are connected as follows:
where s2e stands for error variance resulting from spontaneous (non-heritable) fluctuations, ontogenetic variation, and imprecision of measurements. To assess H2 in the second filial progeny, Formula (2) can be transformed as below:
where s2p(P1), s2p(P2), s2p(F1), and s2p(F2) are phenotypic variances of first parent, second parent, and hybrids of the first and second progenies, respectively. The Formula (3) is applied if s2p(P1) > s2p(F1) < s2p(P2), otherwise it is transformed in the following way:
which was the prevailing case for our data. The Formula (4) was used to calculate s2g(F2) and H2 for flower size (FL) and ON.
H2 = s2g/s2p,
s2p = s2g + s2e,
s2p(F2) = s2g(F2) + [s2p(P1) + s2p(P2) + s2p(F1)]/3,
s2p(F2) = s2g(F2) + [s2p(P1) + s2p(P2)]/2,
3. Results
The available values of ON, SN, S/O ratio, FL, and TSM of all trials for all accessions are available in Table 2 and Table S1. These were used to evaluate heritability and correlations.
Table 2.
Values and derived parameters for hybrid progenies and corresponding parental accessions.
3.1. Heritability of Ovule Number and Flower Size
The calculated values of H2 are presented in Table 2. They are relatively low: average H2 for both ON and FL comprises 0.46, i.e., approximately 50% or less of observed phenotypic variation can be attributed to genotypic components. Surprisingly enough, in some hybrid combinations, the values of H2 for ON have a relatively high reproducibility, e.g., in three trials of Filby × WL131 (Table 2). Average ON of F1 hybrids was usually lower than or close to the midparent value (Table 2).
For flower size expressed in terms of flag length, values of H2 exhibited a weaker reproducibility (Table 2). Average FLs were either higher or lower than the calculated midparent value even in different replicates of the same hybrid combination, e.g., Ras-tip × Az-23 (Table 2).
In F2 populations Filby × WL1132 and Filby × WL131, ONs were compared between hybrid plants having different phenotypes, viz., normal (LE) vs. dwarf (le) stem, normal (AF) vs. afila (af) leaf, broad (ST) vs. narrow (st) stipules, green (GP) vs. yellow (gp) pods, and pigmented (A) vs. white (a) petals (see [25] for designation of genes). No reliable differences in ON were found between samples of hybrids having distinct phenotypes (Table S2).
Only three of nine accessions exhibited no reliable differences in ON between 2015 and 2021 (field) seasons, viz., Malinovka, SGE, and Viking (Table S1). Malinovka and SGE are accessions with pigmented flowers. One more purple-flowered accession, WL131, possessed no significant differences in ON between both 2021 trials (Table S1) and 2022 (not shown).
3.2. Within-Plant Variation of Ovule Number
To examine the degree of variation in ON within a single plant, we counted ovules in pods/ovaries on the main and lateral shoots separately in eight individual hybrid plants of F2 Filby × WL1132. Flowers of the main shoot produced 7.73 ± 0.49 ovules (average ± s, n = 51), while fewer ovules, 6.84 ± 0.75 (n = 76), developed in flowers on lateral branches. Differences between these two groups are significant (Mann–Whitney test, p < 0.01).
3.3. Correlation between Studied Parameters and Their Reproducibility
As seen from Table 3, even correlations between the same parameters in two different trials (field and glasshouse) were weak. Climatic data for 2021 (Table 1, Figure 1) show that this season was quite dry, so both field and glasshouse conditions may be evaluated as stressful. As a result, although relatively small sets of cultivars were compared, reproducibility of studied parameters was found weak. The strongest correlation was found for ONs recorded in two trials (Spearman’s ρ = 0.523). Stronger correlations between S/O ratio and ON and S/O ratio and SN (Table 3) seem trivial, as the S/O ratio is connected with ON and SN both ontogenetically and mathematically. To our surprise, SN and ON are correlated very weakly and unreliably (Table 3).
Table 3.
Correlation (Spearman’s ρ) between studied parameters in 2021 in field trial (lower left part of the matrix), glasshouse trial (upper right part of the matrix), and between two trials (diagonal). Numbers of compared accessions are given in brackets.
In 2015, ON correlated positively and significantly with SN (ρ = 0.636; Table S3), while in other seasons these two parameters exhibited no reliable correlation. FL was measured only for two trials of 2021, and only in the field observations this parameter correlated reliably with TSM (Table 3). Notably, average FL and ON were significantly lower in the glasshouse than in field trials, although not for all accessions (Table S1).
Only fragmentary data are available for other seasons, but they may be informative for estimates of reproducibility of studied parameters (Table S4). TSM is reproduced (i.e., correlated) relatively precisely between different years of observation with Spearman’s ρ nearing 0.600 or higher. For comparison, SNs correlated significantly only between data of 2015 and 2016, while S/O ratios appeared variable between seasons (Table S4).
4. Discussion
4.1. Ovule Number Is a Relatively Variable Trait Weakly Correlated with Seed Number
The whole set of correlations is only partly reproducible between years and trials (Table 3 and Table S4) which agrees with the observations of Uhlarik et al. [10]. This may be also because the collection of accessions under study was not fully identical between years (Table S1). Similarly to the findings of Uhlarik et al. [10], TSM has the highest reproducibility between years.
In agreement with previous observations [12,13,14,15], our data provide evidence for a moderate heritability of ON, with approximately 50% of variation conditioned by genotype (Table 2). There is possibly no major locus which might affect ON significantly but numerous loci with a minor impact. At least some of well-known loci, such as A, AF, GP, LE, and ST, seem not to be influencing ON. This is of a special significance, as white flowers (a), dwarf stem (le) and ‘afila’ leaf type (af) are characteristic for many contemporary pea cultivars. On the other hand, two purple-flowered accessions, Malinovka and SGE, retained their ON best between years (Table S1). The exact role of different loci in heritable stability (not absolute value) of ON is yet to be investigated involving a much larger set of accessions.
On the way from ovules to seeds, the success of seed maturation is dependent on the position of the ovule in the pod [11] and environmental factors. Although pea is almost exclusively self-pollinated, the effectiveness of both pollination and seed maturation is affected by temperature. As found by Jiang et al. [11], heat stress drastically reduces SN which should be taken into account considering the ongoing climate changes. Comparing S/O ratios for the same cultivars grown in relatively humid 2015, very dry 2021 and the stressful conditions of the glasshouse, one may find the S/O ratio decreasing in this series (Table S1).
Previously, differences of SN between control and heat-treated pea plants were reported as insignificant by Jiang et al. [11] who concluded that increased temperature negatively affects yield via acceleration of flowering and reduction of both pod number and seed size. However, our data evidence that not only SN but also ON is reduced under stress (most probably heat and water deficit, Table S1) in most cultivars (differences in ON between 2015 and 2021 are evident, Table S1), while accessions Malinovka, SGE, and Viking produce similar ONs in different conditions. Some cultivars (Fragment, Pervenets) exhibited slightly, although significantly, higher ONs in a glasshouse. It might be intriguing to study whether some genotypes are more resistant (in terms of ON) against various stresses compared with others. Differential response of SN and S/O ratio to heat stress was earlier described in different genotypes of pea [11].
A relatively low heritability together with a significant influence of environmental factors make a higher ON an unreliable goal in breeding. It is complemented with the fact that ON is a poor predictor of SN, one of the key components of yield. Indeed, these two traits are often weakly correlated (Table 3). This contradicts the results of Jiang et al. [11] but supports those of Semenova et al. [8] who reported a very low relation between maximum seed number per pod and both overall plant productivity and yield per plot. Our observations indicate that maximum SN is equal to the ON and achievable only in a small fraction of pods (S/O = 1.00). Those authors who studied the impact of average (not maximum) SN on productivity found them correlating significantly [6,9].
There is an ontogenetic component of variation of ON, as flowers on lateral branches usually produce fewer ovules than flowers on the main stem. There is possibly some difference between earlier and later flowers, although this phenomenon needs a deeper examination. Typically, a garden pea does not produce lateral branches actively but some of its crop relatives (Lathyrus sativus, Vicia sativa) develop a highly ramified seasonal shoot so this ontogenetic variation may matter in their case. Most pea cultivars are harvested with only several of the earliest pods on the main shoot fully mature. Kondykov et al. [26] reported that more than 90% of plant yield is brought by two first fruiting nodes, partly due to larger seeds. As data of Jiang et al. [11] indicate, the ovules in the oldest (basal-most) pod are more likely to develop into seeds successfully than the ovules in subsequent (distal) pods. Otherwise stated, S/O ratio has certain ontogenetic (or position-dependent) variation.
Taken together, these facts suggest that a higher ON may be beneficial for higher yield in optimal growing conditions when the potential productivity is realized to the maximum possible extent.
4.2. A Larger Flower Is Not Correlated with Higher Productivity
One of our initial hypotheses was that larger flowers produce more ovules, the phenomenon characteristic for the pea’s wild relatives [22]. However, flower size expressed in terms of FL appears very unstable even for the same accession grown in different conditions (Table S1) and has no reliable correlations with any of studied traits except for TSM (field 2021, Table 3) which needs to be additionally examined in subsequent trials.
A relatively low and poorly reproducible heritability of FL (Table 2) also accords with its plasticity under different growing conditions. Although existing in wild-growing species as a result of their evolution, the relation between flower size and ON is disrupted under domestication. To our knowledge, flower size never was a matter of artificial selection in pea, so both large- and small-flowered cultivars exist having a relatively narrow range of ON variation. Numerous works on model plant species dissected a complex genetic and physiological regulation of flower size (reviewed in [27]) suggesting polygenic control of this trait.
5. Conclusions
Under stress (water deficit and heat), pea plants produce fewer seeds than in more favorable conditions. This phenomenon was previously attributed to a higher rate of abortion of seeds and immature ovules resulting in a lower seed/ovule ratio [11]. Our results indicate that stress also leads to initiation of fewer ovules, i.e., lower potential productivity. Ovule development is less responsive to environmental conditions in some genotypes compared with others. While the heritability of ON itself is not high (ca. 0.5), the differential and most probably heritable ability to retain ON under stress may become a basis for breeding pea cultivars better adapted to a warmer and drier climate. However, ON becomes a reliable determinant of SN only under best growing conditions.
The flower size in pea is also strongly dependent on environment and its heritability is therefore relatively low. In the course of evolution, floral size became more or less associated with ON [22] but this correlation seems not to exist in cultivated peas. The results reported here suggest that flower size cannot be used as a predictor of productivity.
However, the natural habit of the pea’s wild relatives, such as the annual representatives of Lathyrus and Vicia inhabiting xeric conditions, may provide a clue to the appearance of future pea cultivars. Possibly forms with single-flowered inflorescences, few ovules, and, of utmost importance, short life cycle may be beneficial in the changed climate.
Supplementary Materials
The following supporting information can be downloaded at: https://www.mdpi.com/article/10.3390/horticulturae9030371/s1, Table S1: Values of studied parameters of examined accessions over different years and growing conditions; Table S2: Ovule number in plants of F2 hybrids with different genotypes; Table S3: Correlations between selected parameters over different years; Table S4: Correlations between the same parameters over different years.
Author Contributions
Conceptualization, A.S.; methodology, A.S.; formal analysis, A.S.; investigation, A.S., O.A. and G.K.; resources, A.S., O.A. and G.K.; writing—original draft preparation, A.S.; writing—review & editing, A.S. All authors have read and agreed to the published version of the manuscript.
Funding
This research received no external funding.
Institutional Review Board Statement
Not applicable.
Informed Consent Statement
Not applicable.
Data Availability Statement
Not applicable.
Acknowledgments
The authors express their sincere gratitude to all students who participated in the summer field practice on Skadovskii Zvenigorod biological station during summer seasons of 2015–2017, 2021, and 2022. The authors thank colleagues who provided seeds of different pea accessions, viz., Gennady Debelyi, Irina Kotlyar, Dimitrii Pershin, Ekaterina Pronina, Elena Semenova, Margarita Vishnyakova, Anatoly Zelenov, and Andrey Zelenov. Many thanks to Pavel Pashkevich for help in obtaining some references. Climatic data from the biological station were kindly provided by Aleksandr Shilov to whom the authors express their sincere gratitude.
Conflicts of Interest
The authors declare no conflict of interest.
References
- Ljuština, M.; Mikić, A. A brief review on the early distribution of pea (Pisum sativum L.) in Europe. Ratar. I Povrt. 2010, 47, 457–460. [Google Scholar]
- Asha, A.B.; Devaraju; Srinivasa, V.; Hanumantappa, M.; Aghora, T.S.; Ganapathi, M.; Chithra, K. Correlation and path analysis in garden pea (Pisum sativum L.). J. Pharmacogn. Phytochem. 2020, 9, 1728–1731. [Google Scholar]
- Fikreselassie, M. Variability, heritability, and association of some morpho-agronomic traits in field pea (Pisum sativum L.) genotypes. Pak. J. Biol. Sci. 2012, 15, 358–366. [Google Scholar] [CrossRef] [PubMed]
- Kalapchieva, S.; Kosev, V.; Vasileva, V. Correlation dependences of quantitative traits in garden pea. Analele Univ. Din Oradea Fasc. Biol. 2021, 28, 85–90. [Google Scholar]
- Kosev, V.; Vasileva, V. Comparative biological characteristics of pea (Pisum sativum) varieties. Indian J. Agric. Sci. 2021, 91, 1280–1284. [Google Scholar] [CrossRef]
- Kumar, S.; Ali, B.; Ahmed, W.; Islam, R.; Rahman, M.M.; Chakma, M.; Miah, M.S. Assessment of the genetic variability for various agronomic traits of pea (Pisum sativum L.) genotypes. Plant Arch. 2022, 22, 87–94. [Google Scholar] [CrossRef]
- Seboka, H.; Fikreselassie, M. Multivariate analysis of some Ethiopian field pea (Pisum sativum L.) genotypes. Int. J. Genet. Mol. Biol. 2013, 5, 78–87. [Google Scholar]
- Semenova, E.V.; Boyko, A.P.; Novikova, L.Y.; Vishnyakova, M.A. Phenotypic traits differentiating the genetic resources of pea (Pisum sativum L.) by the type of use. Vavilov J. Genet. Breed. 2022, 26, 599–608. [Google Scholar] [CrossRef] [PubMed]
- Shurkhaeva, K.D.; Fadeeva, A.N.; Khusnutdinova, A.T.; Abrosimova, T.N. Formation and variability of the elements of productivity of pea varieties and their relationship with yield. Zernobobovye I Krupyanye Kul’tury 2022, 4, 32–39. [Google Scholar]
- Uhlarik, A.; Ćeran, M.; Živanov, D.; Grumeza, R.; Skøt, L.; Sizer-Coverdale, E.; Lloyd, D. Phenotypic and genotypic characterization and correlation analysis of pea (Pisum sativum L.) diversity panel. Plants 2022, 11, 1321. [Google Scholar] [CrossRef]
- Jiang, Y.; Lindsay, D.L.; Davis, A.R.; Wang, Z.; MacLean, D.E.; Warkentin, T.D.; Bueckert, R.A. Impact of heat stress on pod-based yield components in field pea (Pisum sativum L.). J. Agron. Crop. Sci. 2020, 206, 76–89. [Google Scholar] [CrossRef]
- Marx, G.A.; Mishanec, W. Further studies on the inheritance of ovule number in Pisum. Crop Sci. 1967, 7, 236–239. [Google Scholar] [CrossRef]
- Krarup, A.H.; Davis, D.W. Genetic control of ovule number in peas (Pisum sativum L.). Crop Sci. 1970, 10, 517–518. [Google Scholar] [CrossRef]
- Snoad, B.; Arthur, A.E. Genetical studies of quantitative characters in peas. 1. A seven-parent diallel cross of cultivars. Euphytica 1973, 22, 327–337. [Google Scholar] [CrossRef]
- Snoad, B.; Arthur, A.E. Genetical studies of quantitative characters in peas. 2. A six-parent diallel cross of cultivars and primitive forms. Euphytica 1973, 22, 327–337. [Google Scholar] [CrossRef]
- Barnes, D.K.; Cleveland, R.W. Inheritance of ovule number in diploid alfalfa. Crop Sci. 1963, 3, 499–504. [Google Scholar] [CrossRef]
- Pundir, R.P.S.; Singh, R.B. Inheritance pattern for pod length and ovule number of wide crosses among Cajanus and Atylosia species. Euphytica 1986, 35, 649–652. [Google Scholar] [CrossRef]
- Al-Mukhtar, F.A.; Coyne, D.P. Inheritance and association of flower, ovule, seed, pod, and maturity characters in dry edible beans (Phaseolus vulgaris L.). J. Amer. Soc. Hort. Sci. 1981, 106, 713–719. [Google Scholar] [CrossRef]
- Ellis, T.H.N.; Hofer, J.M.I.; Vikeli, E.; Ambrose, M.J.; Higuera-Poveda, P.; Wingen, L.U.; Chayut, N. Diversity of pod shape in Pisum. Diversity 2021, 13, 203. [Google Scholar] [CrossRef]
- Tattersal, A.D.; Turner, L.; Knox, M.R.; Ambrose, M.J.; Ellis, T.H.N.; Hofer, J.M.I. The mutant crispa reveals multiple roles for PHANTASTICA in pea compound leaf development. Plant Cell 2005, 17, 1046–1060. [Google Scholar] [CrossRef]
- Qadir, M.; Wang, X.; Shah, S.R.U.; Zhou, X.-R.; Shi, J.; Wang, H. Molecular network for regulation of ovule number in plants. Int. J. Mol. Sci. 2021, 22, 12965. [Google Scholar] [CrossRef]
- Sinjushin, A.A. The duration of the life cycle is associated with C-value and affects reproductive features in the Fabeae, the tribe with largest genomes in Fabaceae. Flora 2021, 285, 151954. [Google Scholar] [CrossRef]
- Sinjushin, A.A.; Ash, O.A.; Khartina, G.A. Germplasm collection of a garden pea (Pisum sativum L.) and its application in researches. Proc. Appl. Bot. Genet. Breed. 2016, 177, 47–60. [Google Scholar] [CrossRef]
- Sobolev, N.A. Hybridologic analysis according to polygenic traits. Tsitologiia I Genet. 1976, 10, 424–436. [Google Scholar] [PubMed]
- PGene. Pisum Gene List. Available online: http://data.jic.ac.uk/25/ (accessed on 18 January 2023).
- Kondykov, I.V.; Zotikov, V.I.; Zelenov, A.N.; Kondykova, N.N.; Uvarov, V.N. Biology and Breeding of Determinate Pea Forms; Kartush: Orel, Russia, 2006; pp. 44–49. [Google Scholar]
- Krizek, B.A.; Anderson, J.T. Control of flower size. J. Exp. Bot. 2013, 64, 1427–1437. [Google Scholar] [CrossRef] [PubMed]
Disclaimer/Publisher’s Note: The statements, opinions and data contained in all publications are solely those of the individual author(s) and contributor(s) and not of MDPI and/or the editor(s). MDPI and/or the editor(s) disclaim responsibility for any injury to people or property resulting from any ideas, methods, instructions or products referred to in the content. |
© 2023 by the authors. Licensee MDPI, Basel, Switzerland. This article is an open access article distributed under the terms and conditions of the Creative Commons Attribution (CC BY) license (https://creativecommons.org/licenses/by/4.0/).