Article

Selection and Validation of miRNA Reference Genes by Quantitative Real-Time PCR Analysis in Paeonia suffruticosa

1
College of Agriculture/Tree Peony, Henan University of Science and Technology, Luoyang 471023, China
2
Henan Province Key Laboratory of Efficient Cultivation and Comprehensive Utlilization of Tree Peony, Luoyang 471023, China
3
College of Horticulture and Plant Protection, Henan University of Science and Technology, Luoyang 471023, China
*
Authors to whom correspondence should be addressed.
Horticulturae 2023, 9(2), 148; https://doi.org/10.3390/horticulturae9020148
Submission received: 1 December 2022 / Revised: 28 December 2022 / Accepted: 20 January 2023 / Published: 22 January 2023

Abstract

:
The miRNA, a kind of endogenous non-coding small RNA, plays an essential role in regulation of gene expression in plants. Quantitative real-time PCR (qRT-PCR) assay is one of the most common methods used for quantification of miRNA expression, and levels of expression are normalized by comparing with reference genes. The present study was intended to identify the appropriate reference genes for normalizing the level of miRNA expression in various developmental stages and tissues such as the bud development process, flower development stages, and different tissues of tree peony of different flowering times. Five algorithms (Delta Ct, geNorm, NormFinder, BestKeeper, and RefFinder) were used for stability analysis. The results showed that mtr-MIR160b-p3 and gma-miR394a-5p were the most stable miRNAs expressed during the bud development process of early-flowering tree peony ‘Feng dan’; PC-5p-19095 was the most stable during the bud development process of late-flowering tree peony ‘Lian he’, followed by gma-miR394a-5p and mtr-MIR160b-p3; the mtr-miR159a was the most stable miRNA expressed in the flower development stages of different tree peony varieties. The PC-3p-871 was the most stable miRNA expressed in different tissues of early-flowering tree peony ‘Feng dan’, followed by PC-5p-4, and PC-5p-4 was the most stable in late-flowering tree peony ‘Lian he’, followed by the mtr-miR168b. The findings of this study provide a reference for studying the changes in miRNA expression, and further exploring the regulatory mechanism of miRNA in tree peony.

1. Introduction

Tree peony (Paeonia suffruticosa Andrews.), belonging to section Moutan, genus Paeonia, and family Paeoniaceae, is a woody plant with colorful and beautiful flowers [1]. The natural flowering period of tree peony is middle and late April of each year. The middle-flowering tree peony is dominant at various places, and early- and late-flowering tree peonies are relatively rare [2]. The development of the tree peony industry has been restrained by the short and concentrated flowering period of this plant species, which seriously affects its ornamental as well as economic value [3]. Thus, exploring the molecular mechanism of the flowering time of tree peony and the potential use of genetic engineering to solve the problem of flowering period have become an emerging research topic for the sustainable development of the peony industry [4,5].
The microRNAs (miRNAs) are endogenous non-coding RNAs of about 20~24 nt in length with regulatory functions in eukaryotes [6,7]. With the increasing discovery of plant miRNAs, functions of miRNAs in plant growth and development, seed formation, lipid metabolism, and stress response have been gradually explored [8,9,10]. Previous studies have found that miRNAs can play essential roles in the flowering mechanism by regulating the expression of flowering genes [11]. For example, miR172 regulates flowering by downregulating the target gene AP2 in Sinningia speciosa [12], Oryza sativa L. [13], and Ipomoea nil [14]; the phenomenon of early flowering was observed in Malus pumila Mill [15] and Jatropha curcas L. [16] plants by overexpressing miR172. The miR156 mediates the endogenous flowering pathway by targeting SPL transcription factors, which can delay flowering in Arabidopsis [17], Zea mays L. [18], and Solanum lycopersicum L. [19], and can promote early flowering in Nicotiana tabacum L. [20,21], Arabidopsis [22], and Oryza sativa L. [6] when overexpressed. In addition, miR159 [23], miR319 [24], miR393 [25], miR169 [26], and miR394 [27] have been documented to be related to the flowering time. The exploration of miRNAs during flowering is crucial for the regulation and development of tree peony flowers.
Currently, several methods including northern hybridization, microarray technology, high-throughput sequencing technology, and quantitative real-time PCR (qRT-PCR) are used to analyze the expression of miRNA [28]. The qRT-PCR is widely used due to its advantages of high sensitivity, low cost, strong reproducibility, and accurate results [29]. Selecting an appropriate reference gene for data normalization is essential for qRT-PCR [30,31]. The expression stability of the same reference gene is often highly different due to differences in species, developmental stages, environmental stress, and other factors, and there is no absolutely stable reference gene [32]. Furthermore, statistical algorithms, such as Delta Ct, geNorm, NormFinder, and BestKeeper, have been developed for the evaluation of potential reference gene(s). In previous studies, various reference genes have been used to calculate the expression of miRNA in plant species; the U6 small nuclear RNA (U6 snRNA) is the most commonly used [33]. However, the expression of U6 is not very stable in many cases [34]. Thus far, there have been reports on the selection of reference genes for miRNA in grapevine [32], rice [35], and barley [36] under stress, seed development in Brassica napus [37], and citrus somatic embryogenic and adult tissues [29]. Nevertheless, there is no relevant report on miRNA reference gene evaluation in tree peony until now.
The current study was designed to select the most suitable reference genes for tree peony miRNA qRT-PCR assays. The expression stability of seventeen miRNAs selected from our small RNA sequencing data [38] was analyzed using materials collected from the bud development process, flower development stages, and different tissues at the Blooming stage. Data were analyzed by statistical algorithms Delta Ct, geNorm, BestKeeper, NormFinder, and RefFinder. Furthermore, for verifying the validity of the selected reference genes, relative expression levels of cpa-MIR319-p3_1ss20GT and mtr-miR166g-5p in response to bud development, flowering, and different tissues were analyzed. This is the first report on reference genes selection of miRNA expression analysis during bud and flower development, which will contribute to the future research on miRNA expression of tree peony during flowering.

2. Methods

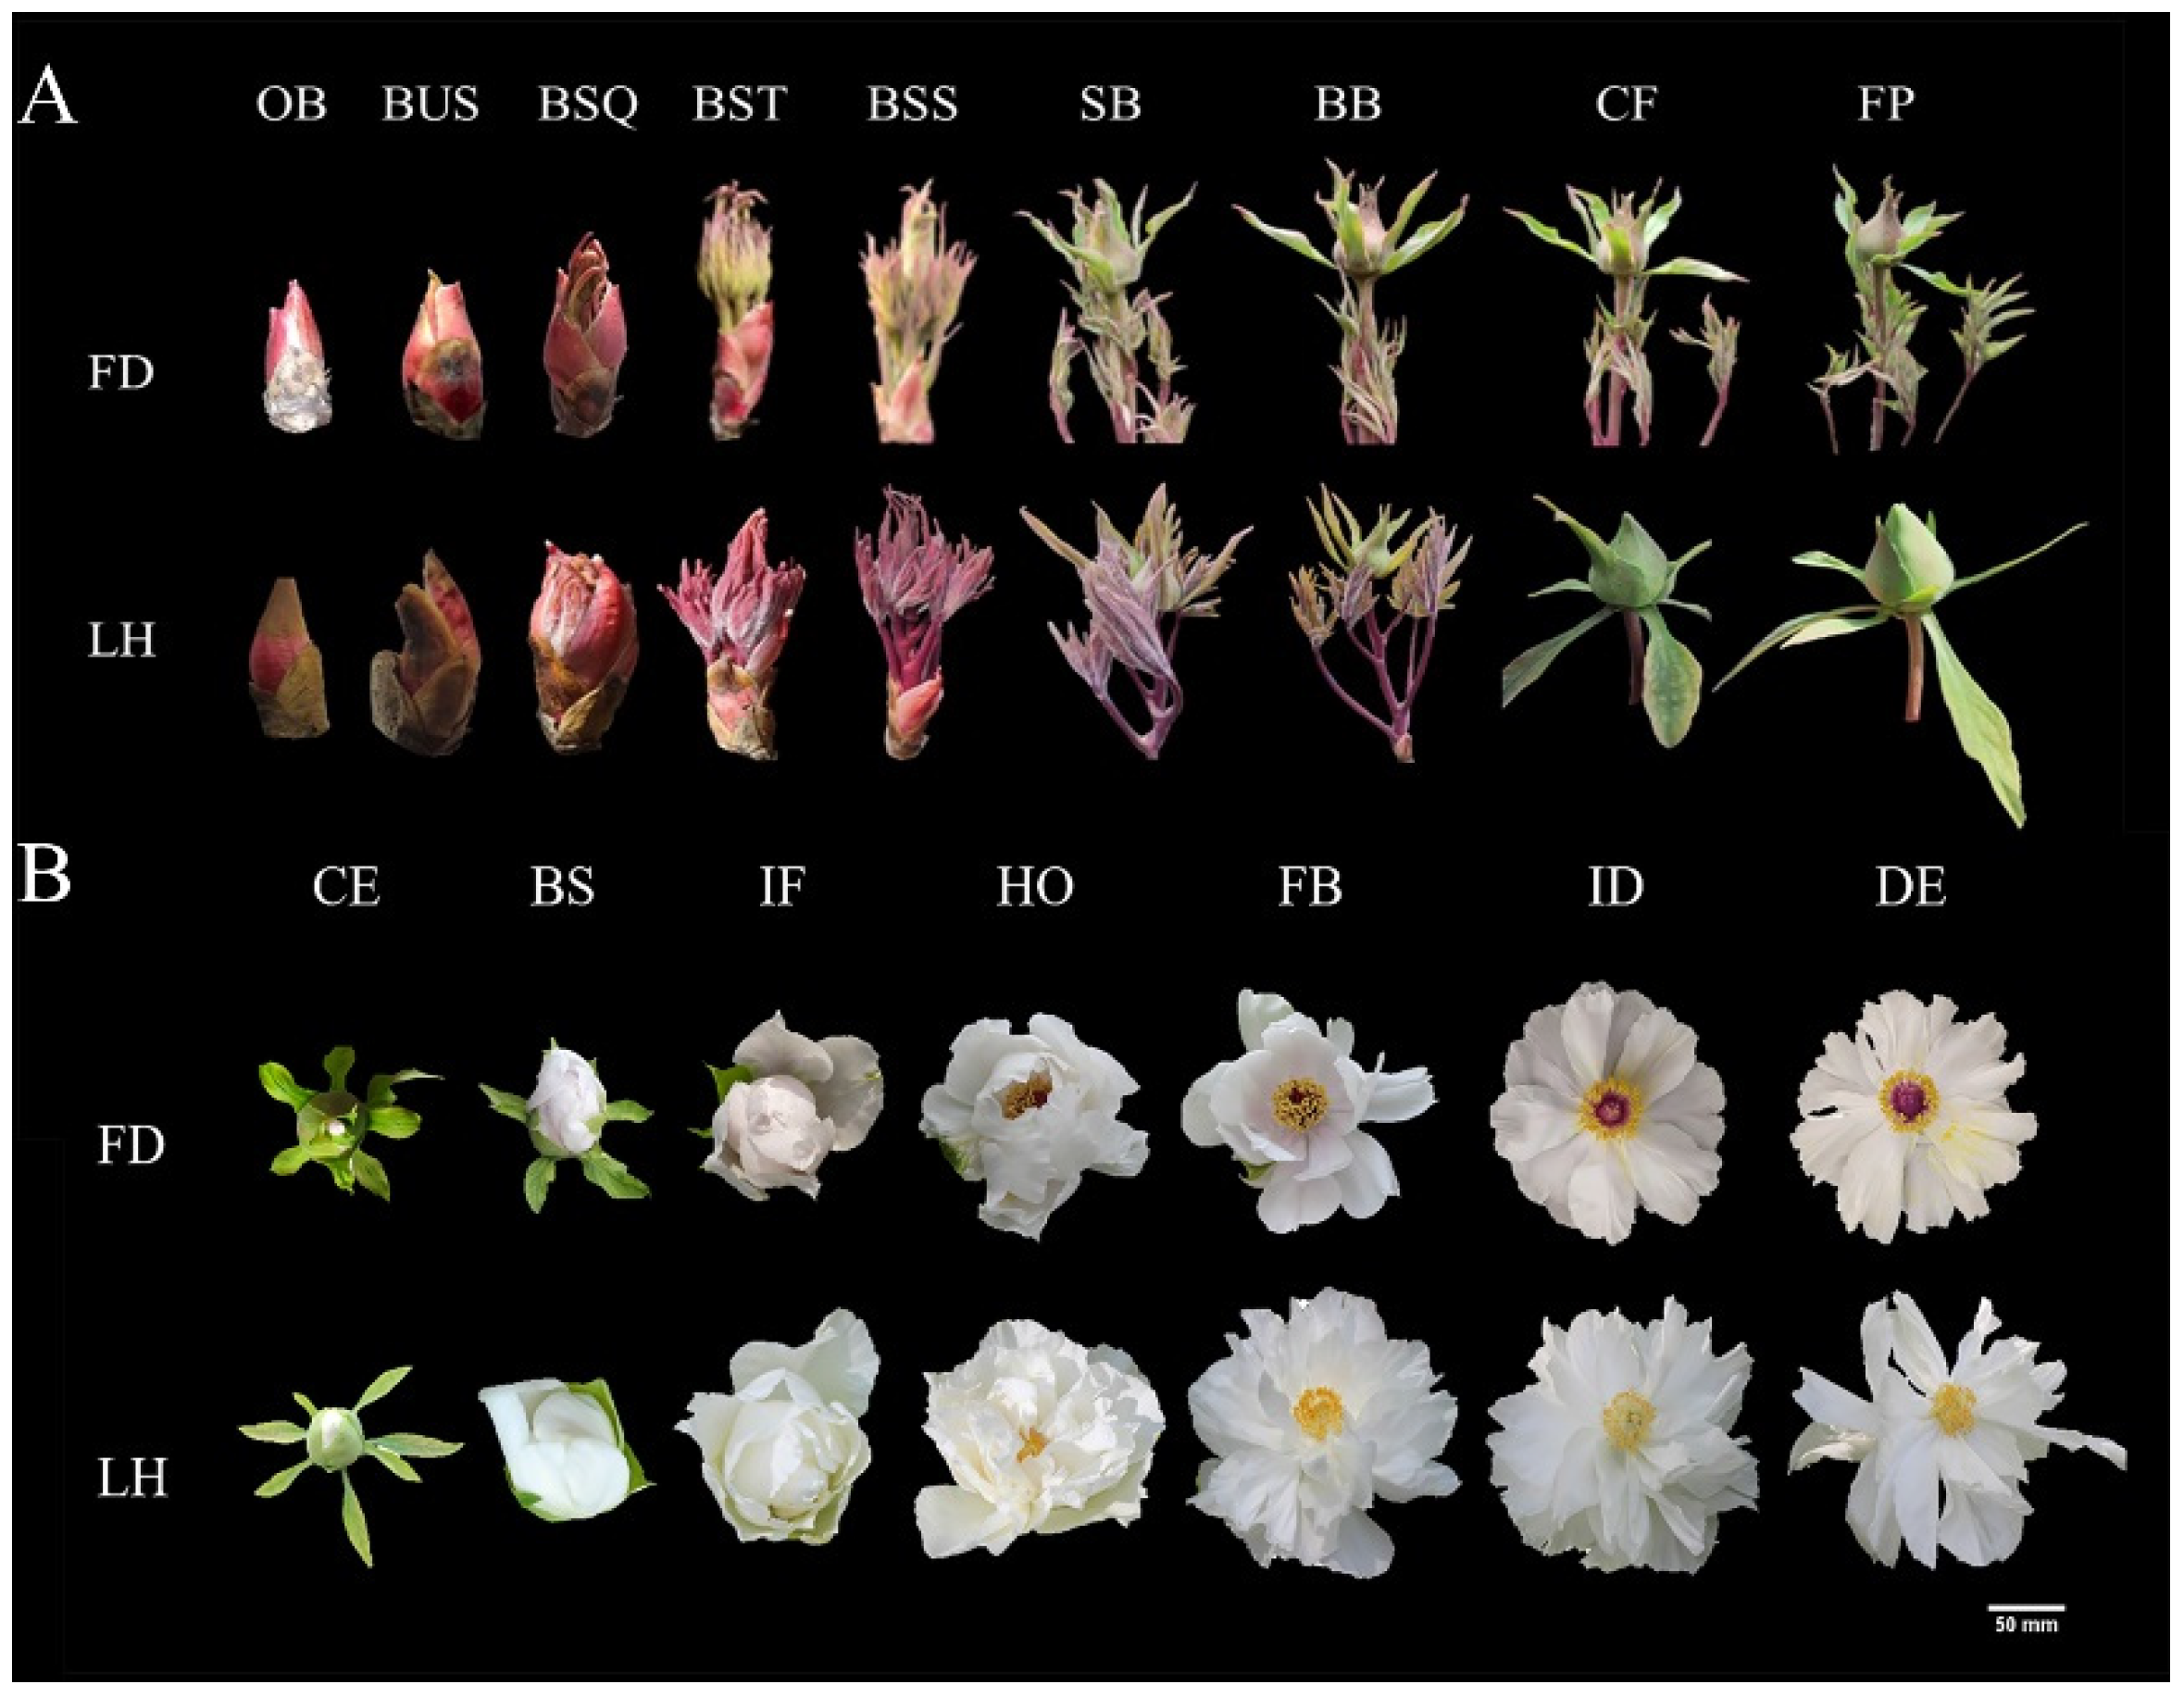
2.1. Plant Materials

Early-flowering Paeonia ostii ‘Feng dan’ and late-flowering Paeonia suffruticosa ‘Lian he’ from Sui and Tang Dynasties City Ruins Botanical Garden, Luoyang, Henan Province, China (112°45′36″ E, 112°45′36″ N) were used as experimental material to evaluate the expression stability of the reference genes (Figure 1). During the bud development process of tree peony, nine samples, including Overwintering bud (OB), Budding stage (BUS), Bud-squaring stage (BSQ), Bud-sticking stage (BST), Bud-standing stage (BSS), Small-bell stage (SB), Big-bell stage (BB), Circular peach stage (CP), and Flat peach stage (FP), were collected. During the flower development stages of tree peony, seven samples, including Color-exposure stage (CE), Blooming stage (BS), Initial flowering stage (IF), Half opening stage (HO), Full blooming stage (FB), Initial decay stage (ID), and Decay stage (DE), were collected. Different tissues in the Full blooming stage, including the stem, leaves, sepals, bracts, stamens, pistils, and stigmas, were collected. All samples were snap-frozen in liquid nitrogen and were stored at −80 °C until total miRNA extraction.

2.2. Total miRNA Isolation and cDNA Synthesis

Total miRNA was extracted using the miRcute Plant miRNA Isolation Kit (TIANGEN). The miRNA quality and purity were checked by 3% agarose gel electrophoresis, using the DL2000 DNA Marker (TaKaRa) as a size indicator. miRNA concentrations and ratios of absorbance at 260 nm to those at 280 nm (260/280) were determined using a NanoDrop 1000 spectrophotometer (Implen, Germany). Total miRNA was reverse-transcribed into cDNA according to the step-wise instruction of the miRcute Plus miRNA First-Strand cDNA Kit (AG, Hunan, China).

2.3. Selection of Candidate Reference miRNAs and Primer Design

In this study, U6 (snRNA) and miRNAs were selected as candidate reference genes for miRNA expression normalization. Based on small RNA sequencing data of our laboratory at BS, IF, FB, and DE stages of Paeonia ostii ‘Feng dan’, Mutant of Paeonia ostii ‘Feng dan’, and Paeonia suffruticosa ‘Lian he’ (CNGBdb, Accession number CNP0002984), 9 known miRNAs (gma-miR394a-5p, mtr-miR171e-3p, mtr-MIR160b-p3, mtr-miR168b, mtr-miR159a, mtr-miR166a, rco-miR167a, mtr-miR159a_L-1, and mtr-miR159a_1ss9GT) and 8 novel miRNAs (PC-3p-1770, PC-5p-74547, PC-5p-4, PC-3p-25825, PC-3p-871, PC-3p-70893, PC-5p-55716, and PC-5p-19095) with constant expression levels were chosen for candidate reference miRNAs.
Forward primers of miRNAs were designed using poly(A) extension by Primer Premier 5 and the Oligo 7 analyzer tool according to their mature sequences (Table 1), and were synthesized at Sangon Biotech (Shanghai) Co., Ltd. The reverse primers of miRNA were provided by the miRcute Plus miRNA First-Strand cDNA Kit (AG, Hunan, China). U6 is often used as a reference gene because of its high expression as a requirement of primer sequences [39].

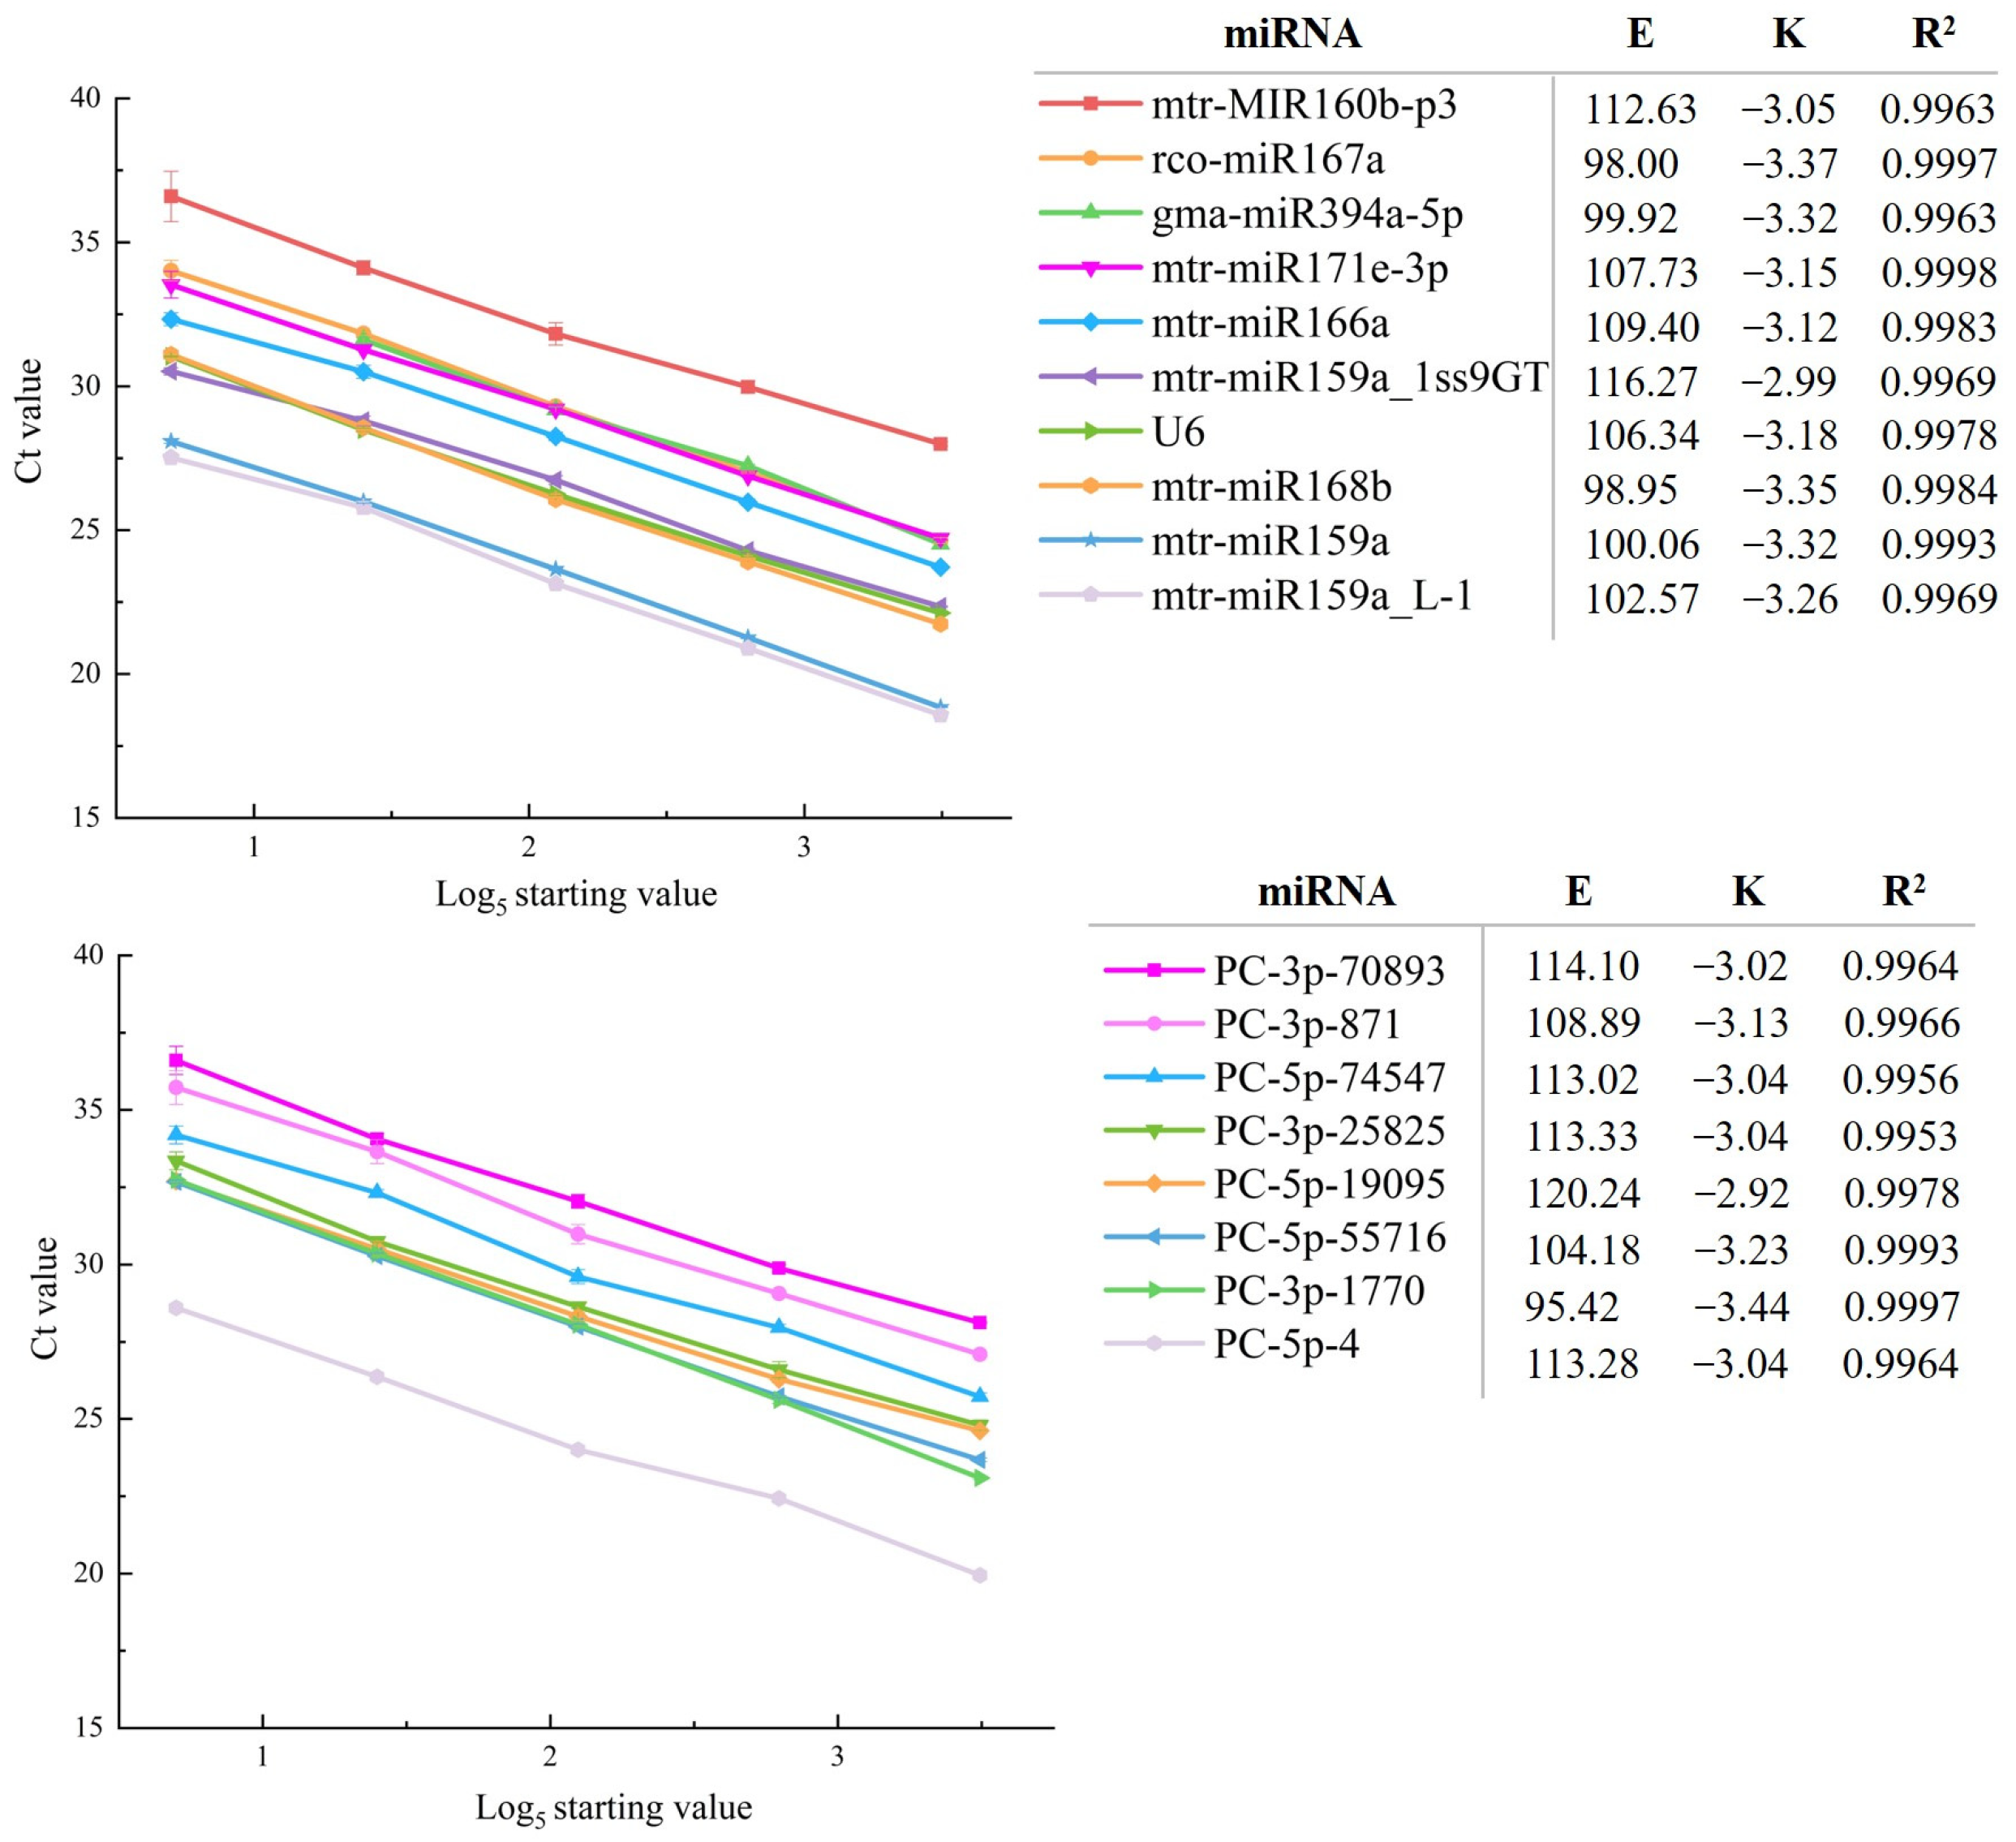
2.4. Drawing of Standard Curve and Verification of Primer Amplification Efficiency

A serial of 5-fold dilutions of cDNA (51× (10-fold dilution of reverse transcript), 52×, 53×, 54×, and 55×) from buds, petal, and tissues of Paeonia ostii ‘Feng dan’ and Paeonia suffruticosa ‘Lian he’ pooled samples were used to create standard curves. The Ct value measured by qRT-PCR was used as an ordinate, and the logarithmic value of the cDNA initial template was used as the abscissa to draw the standard curve. Amplification efficiency was calculated according to the formula of E = [10(−1/slope) − 1] × 100.

2.5. qRT-PCR of Candidate Reference miRNAs

All cDNA samples were diluted 10-fold with RNase-free water before amplification. qRT-PCR was performed on a BIORAD CFX96 machine (USA). The total reaction volume of 20 µL contained 2 µL of 10× diluted template, 0.4 µL of each primer (10 µM), 7.2 µL of RNase-free water, and 10 µL of 2× SYBR Green Pro Taq HS Premix (AG, Hunan, China). The amplification program was as follows: denaturation at 95 °C for 30 s, followed by 40 cycles of 95 °C for 5 s and 60 °C for 30 s. Three technical replicates were used.

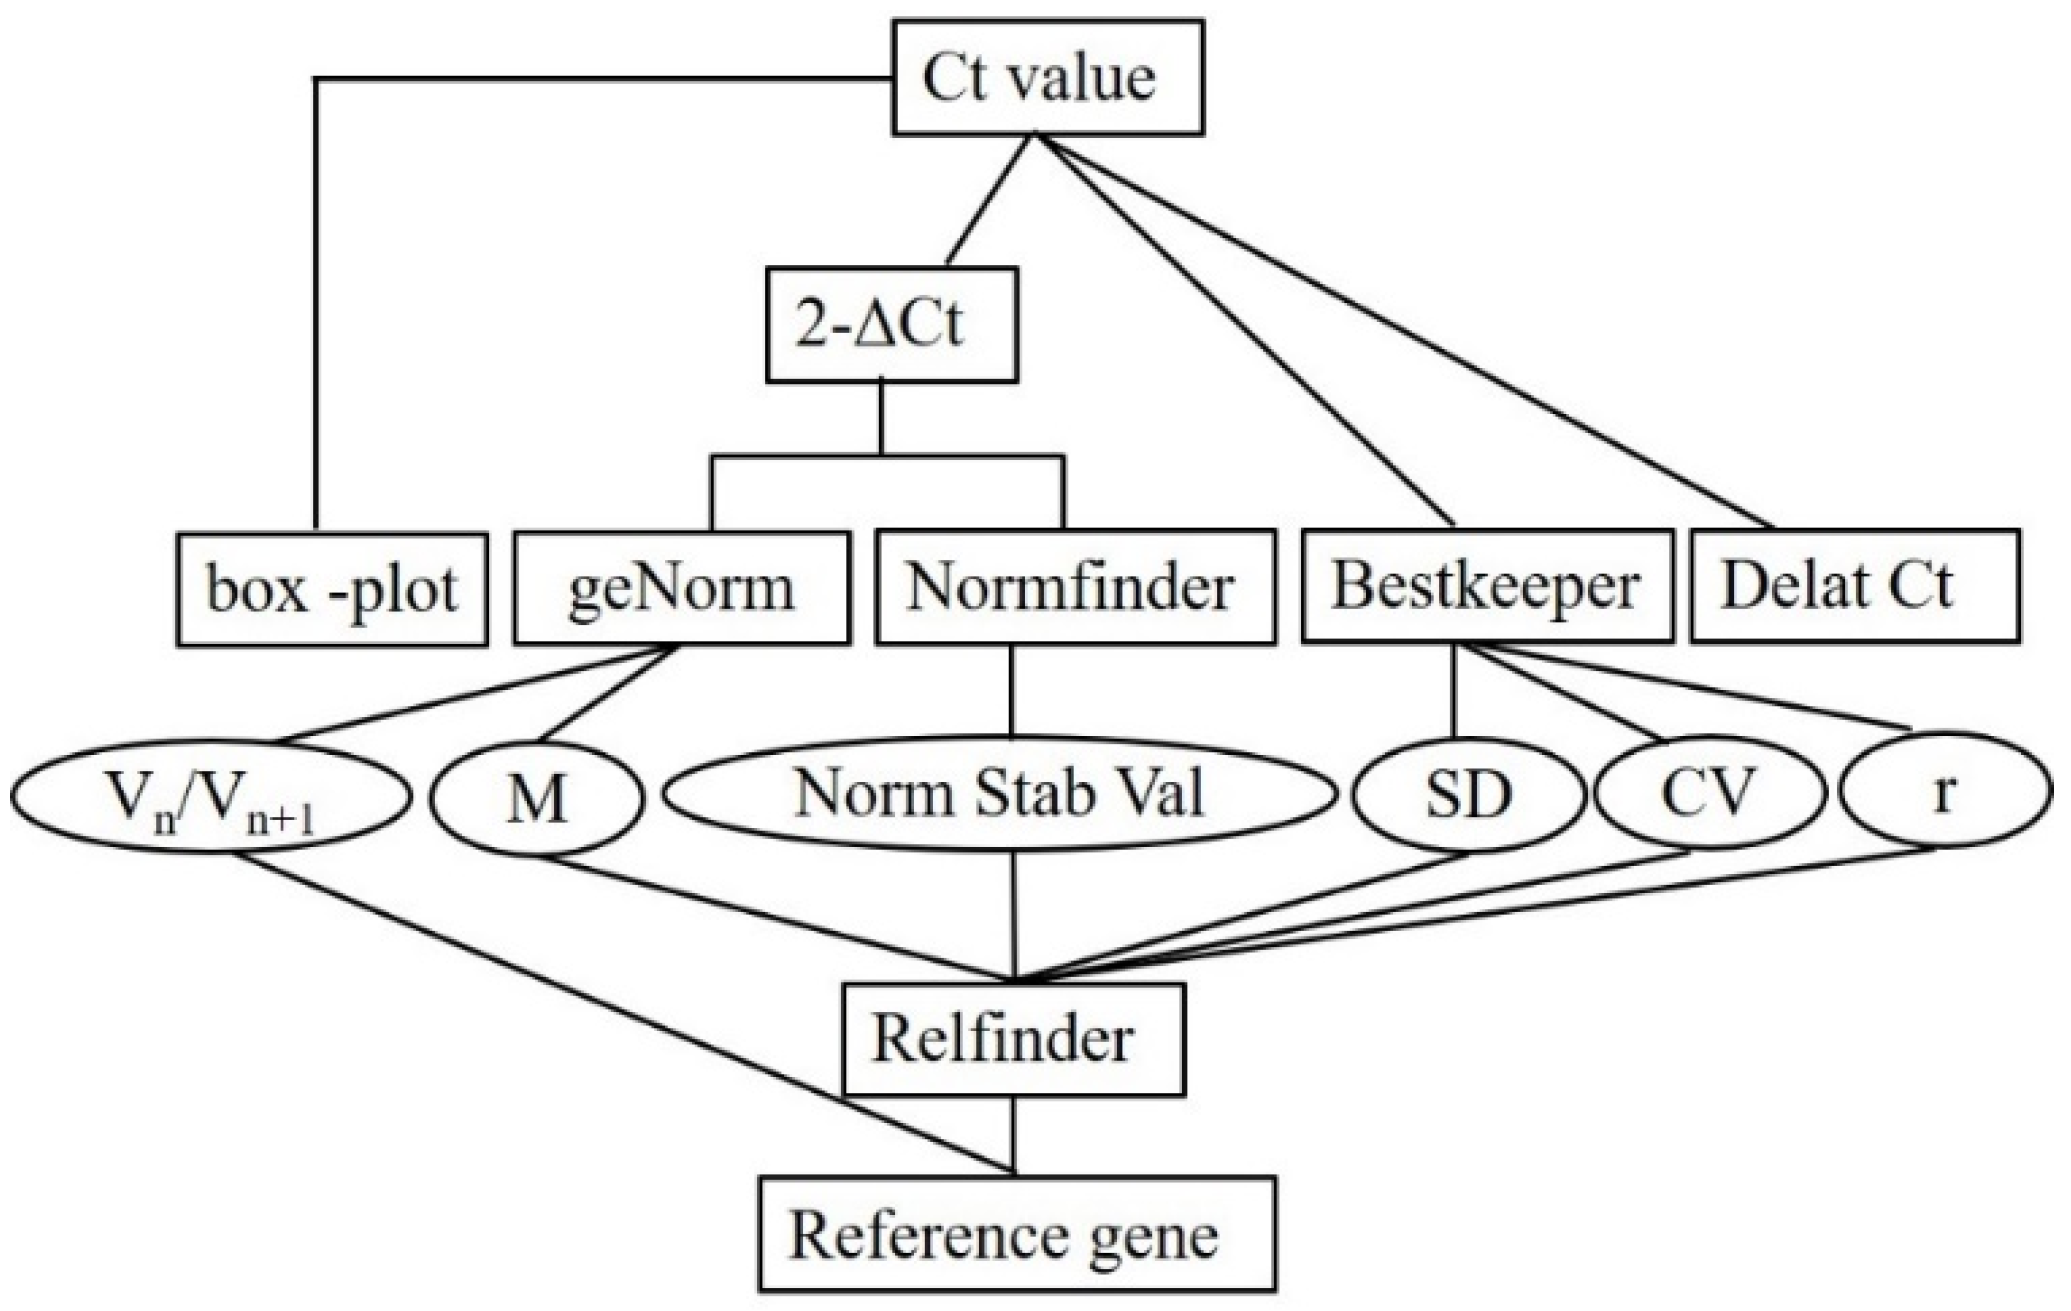
2.6. Assessment of Expression Stability of Candidate Reference miRNAs

Four software default parameters, Delta Ct [40], geNorm [41], NormFinder [42], and BestKeeper [43], were used to analyze the stability of candidate reference miRNAs. The M value representing the stability of each reference miRNA was calculated by geNorm. The paired variation value (Vn/Vn+1) of candidate miRNAs was calculated using geNorm to determine the optimal number of reference genes for accurate normalization. We proposed 0.15 as a threshold value, which suggested that adding one more gene into the combination of reference genes is not required. The gene with the lowest Normfinder stability value is the most appropriate reference gene. The geometric mean of the original Ct values obtained by real-time fluorescence quantification was directly input into the Bestkeeper program to calculate the equivalence of correlation coefficient (r), standard deviation (SD), and coefficient of variation (CV). Finally, RefFinder (http://blooge.cn/RefFinder/ (accessed on 9 November 2022)) was used to conduct a comprehensive online evaluation of the obtained results of the above software. The analysis mode is shown in Figure 2.

2.7. Validation of Reference miRNAs

RT-qPCR technology was used to detect expression patterns of cpa-MIR319-p3_1ss20GT and mtr-miR166g-5p (CNGBdb, Accession number CNP0002984) to verify the authenticity of the selected reference miRNAs. Studies have shown that miR319 and miR166 are important regulatory factors in the plant flower development process [4,44]. Therefore, they were selected to verify the stability of selected reference miRNAs. The method of primer design was the same as that of candidate reference miRNAs, and the primers used are presented in Table 1. The relative expression of miRNAs was calculated using the 2−∆∆Ct method.

2.8. Date Analyses

The Ct values for each reaction were obtained using Bio-Rad CFX Manager 2.0 software (Bio-Rad real-time quantitative PCR instrument CFX96, Hercules, State of California, USA). The arithmetic means and 2-∆∆Ct values were calculated using Microsoft Excel 2019. Expression stability was evaluated using the software programs: Delta Ct, geNorm, NormFinder, BestKeeper, and RefFinder. Significant differences (one-way ANOVA) within groups were analyzed by SPSS 22.0. Graphs were made by Origin 2018.

3. Results

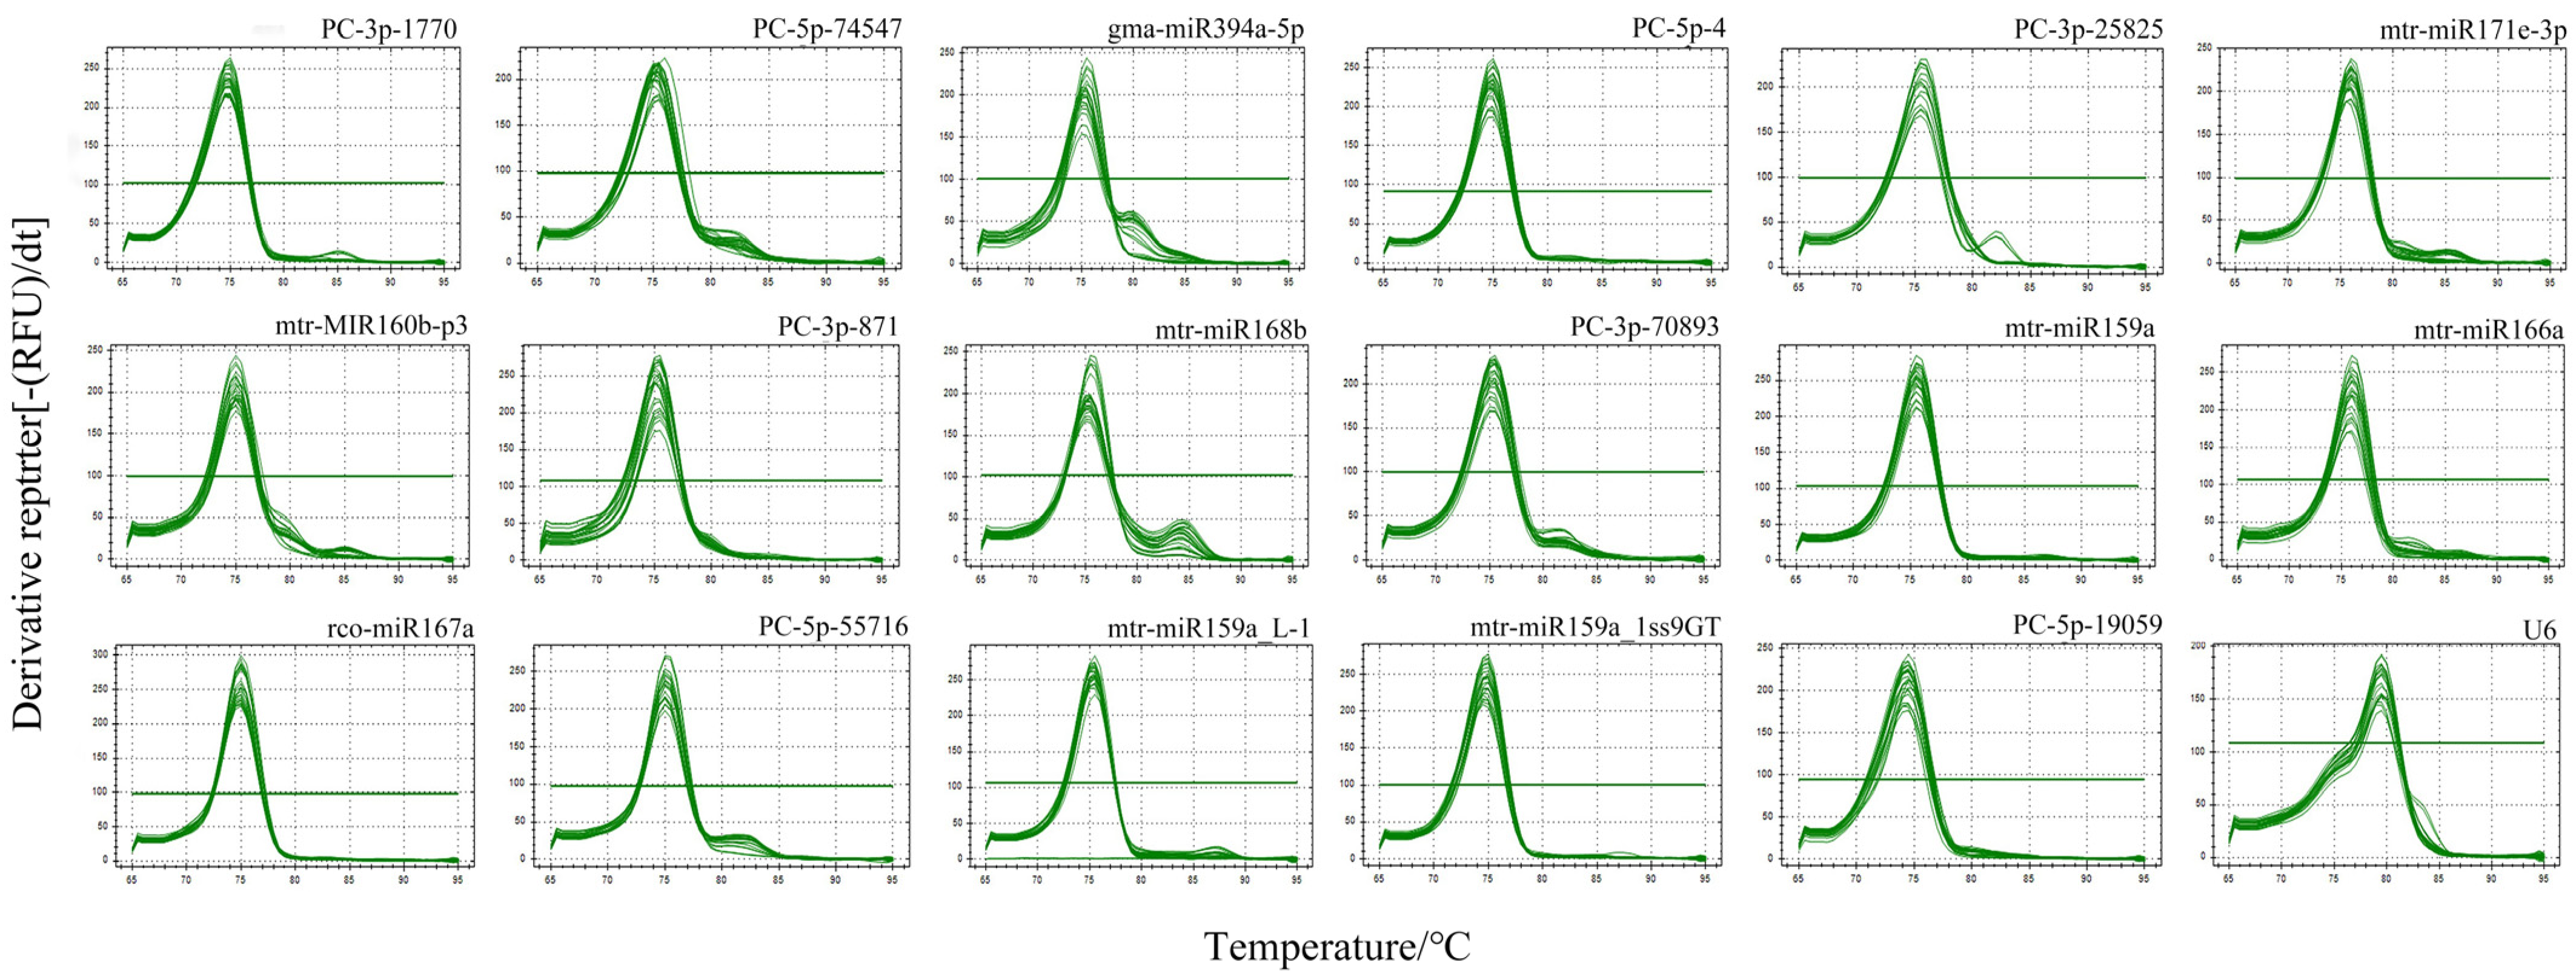
3.1. Evaluation of Primer Specificity and Test of Amplification Efficiency

All candidate reference miRNAs were analyzed by qRT-PCR. The result showed that a single peak appeared in the dissolution curve of 18 candidate reference miRNAs, without the primer dimer (Figure 3). It indicated that the specificity of primers was good and they could be used in the qRT-PCR experiment.
The standard curve was drawn with the Ct value measured by qRT-PCR as an ordinate and logarithm of the cDNA starting template as abscissa. As shown in Figure 4, E values of 18 candidate reference miRNAs ranged from 95.424% to 120.24%, and R2 values of each miRNA exceeded 0.995. These results indicated that primers of all candidate reference miRNAs are effective and specific in the qRT-PCR system.
Amplification efficiency curves of nine known miRNAs and U6 (A) and eight novel miRNAs (B) are shown in Figure 4. The corresponding efficiency value (E), slope (K), and coefficient of determination of the fitted curve (R2) are shown per candidate reference miRNA.

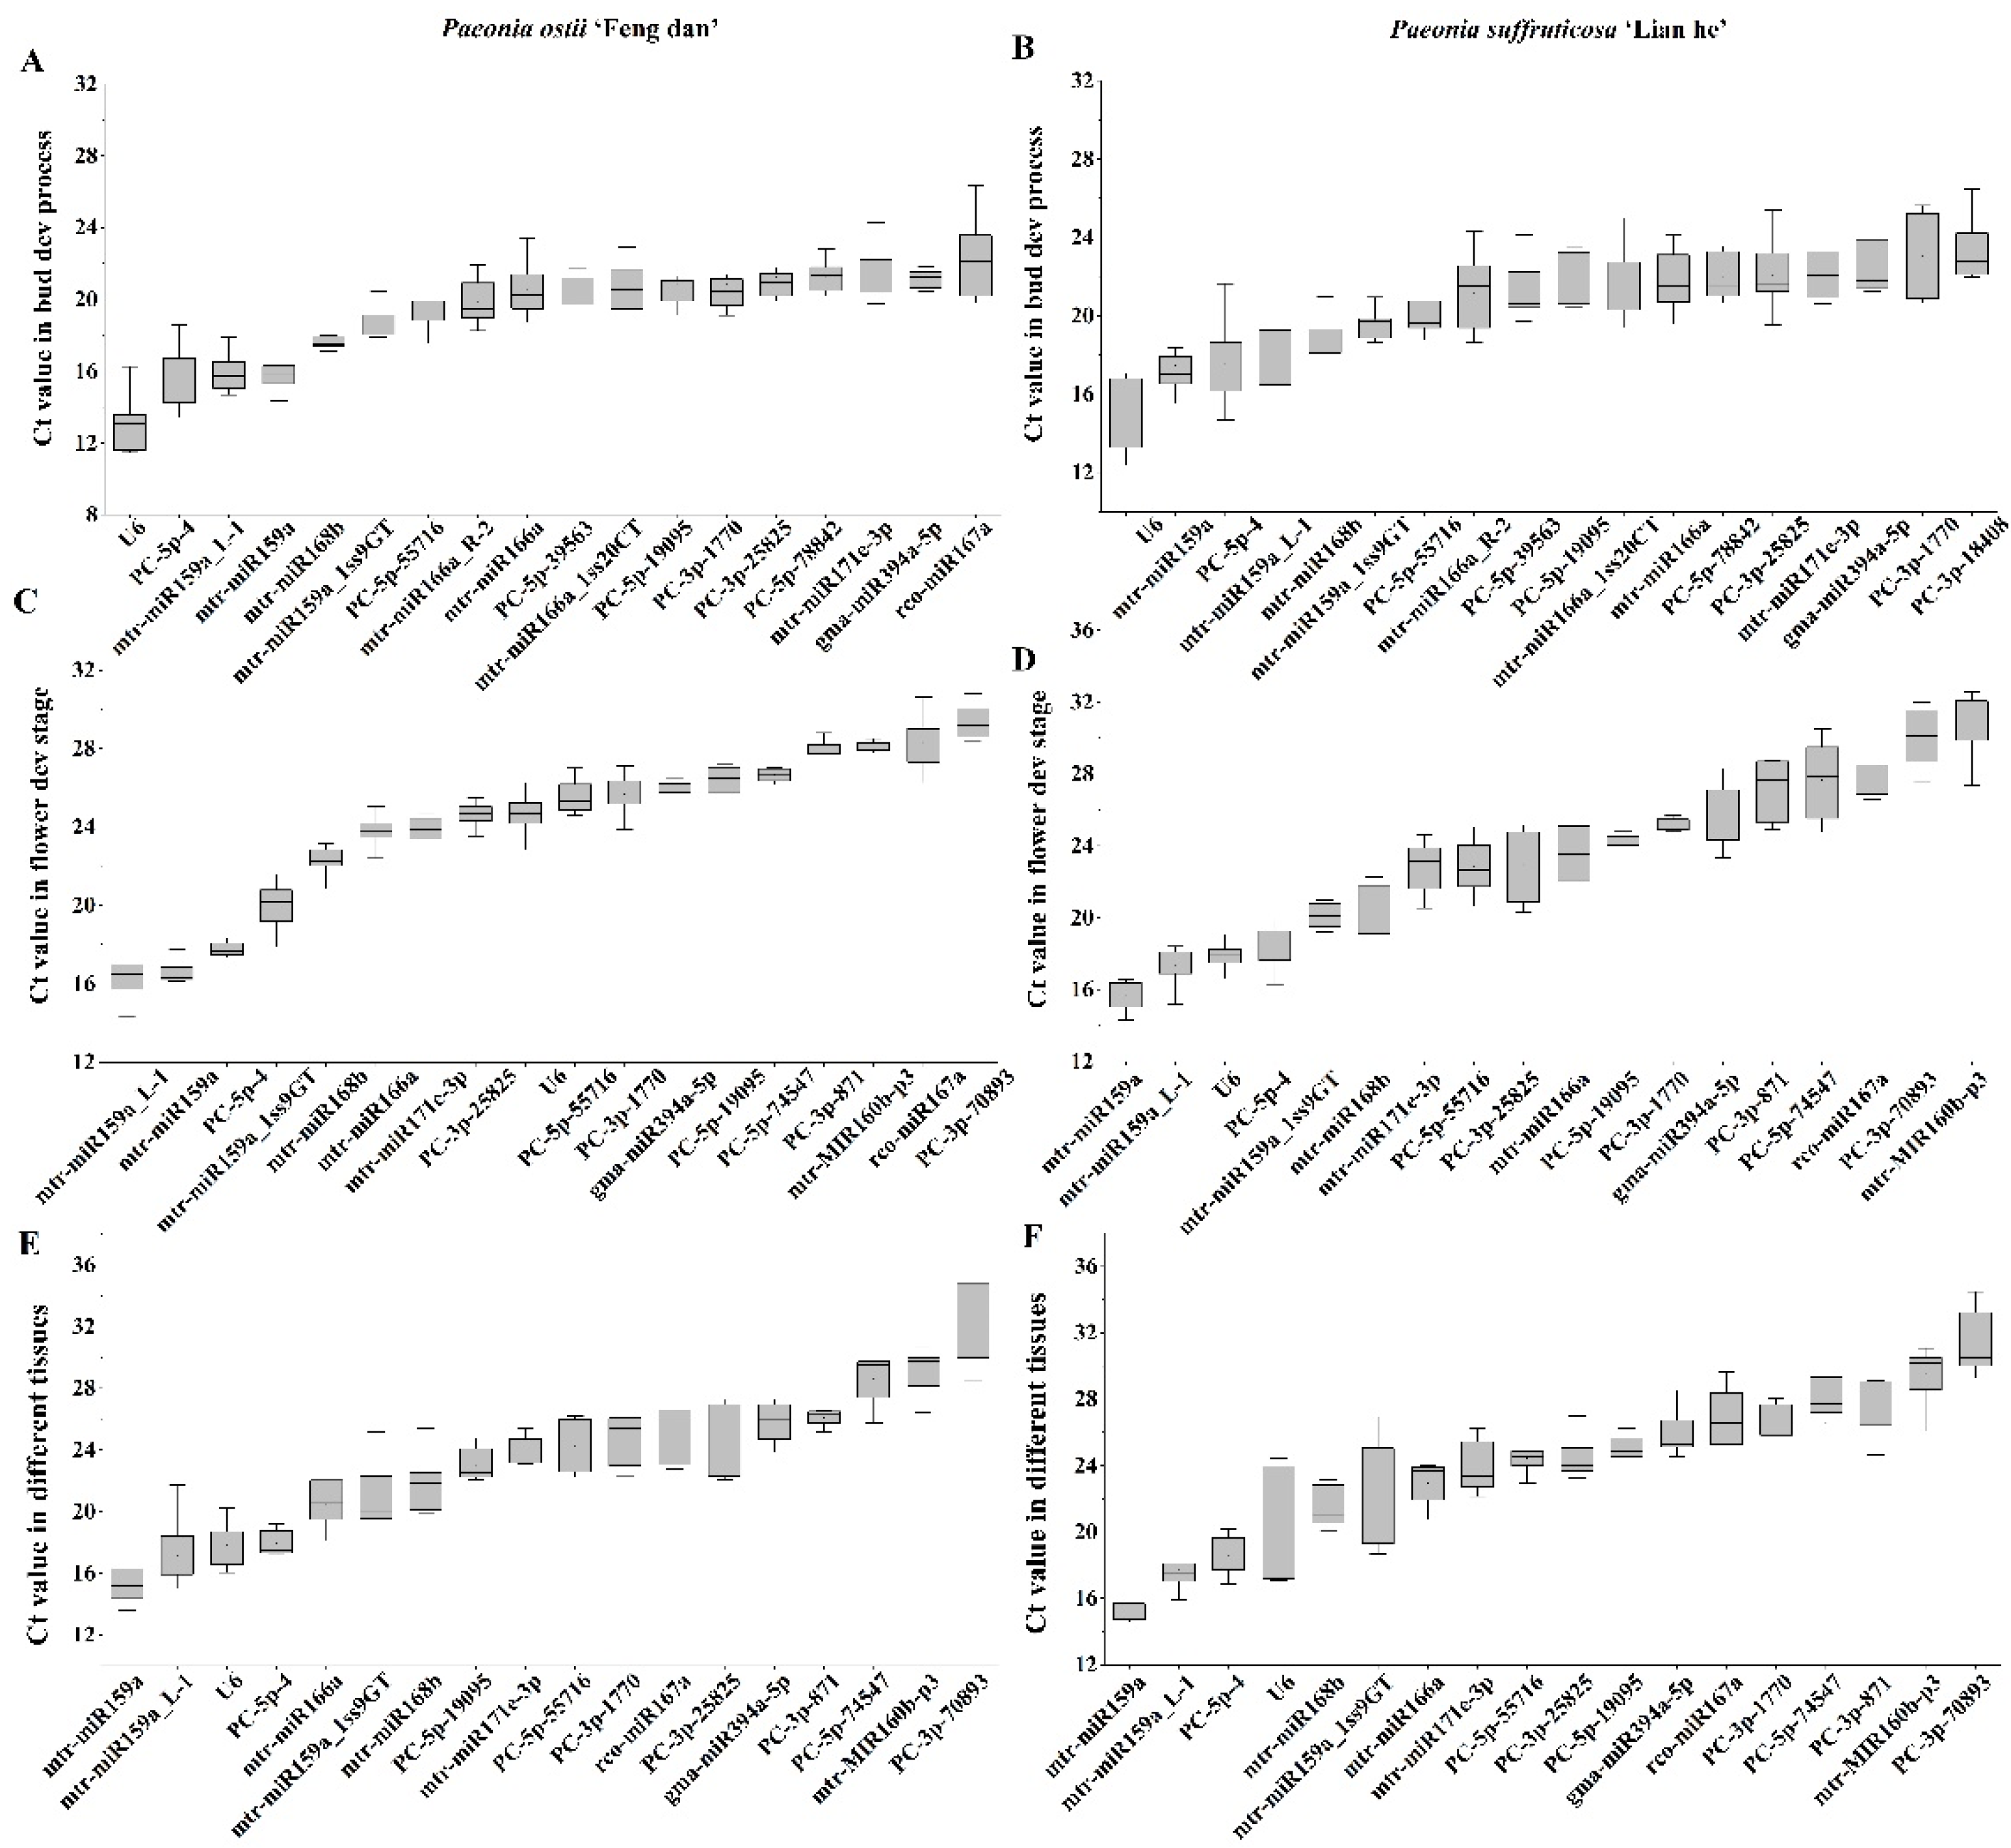
3.2. Expression Levels of Candidate Reference miRNAs

The expression level of 18 candidate reference miRNAs measured by qRT-PCR is shown in Figure 5. During the bud development process of ‘Feng dan’, the average Ct value was 11.48 (U6)~29.23 (PC-3p-70893) (Figure 5A), and Ct values of U6, PC-5p-4, mtr-miR159a, and mtr-miR159a_L-1 were low, indicating that their transcription levels were high. The average range of Ct values of candidate reference miRNAs was 12.37 (U6)~29.36 (PC-3p-70893) in the bud development process of ‘Lian he’ (Figure 5B). During flower development of ‘Feng dan’, the average of Ct values ranged from 14.30 (mtr-miR159a) to 30.83 (PC-3p-70893_626) (Figure 5C), and Ct values of PC-5p-4, mtr-miR159a, and mtr-miR159a_L-1 were low (high transcription level). Average Ct values of candidate reference miRNAs ranged from 14.30 (mtr-miR159a) to 32.59 (mtr-MIR160b-p3) (Figure 5D) in flower development of ‘Lian he’, and Ct values of U6, mtr-miR159a, and mtr-miR159a_L-1 were low (high transcription level), while Ct values of mtr-MIR160b-p3 and PC-3p-70893 were high (low transcription level) and there was little difference between the two transcriptional levels. mtr-miR159a showed the maximum Ct value in different tissues of two tree peony varieties, and PC-3p-70893 showed the minimum Ct value (Figure 5E,F).

3.3. Stability Analysis of Candidate Reference miRNAs

Delta Ct, geNorm, NormFinder, BestKeeper, and Refinder were used to analyze the stability of candidate reference miRNAs in the bud development process, flower development stages, and different tissues of tree peony at different flowering times.

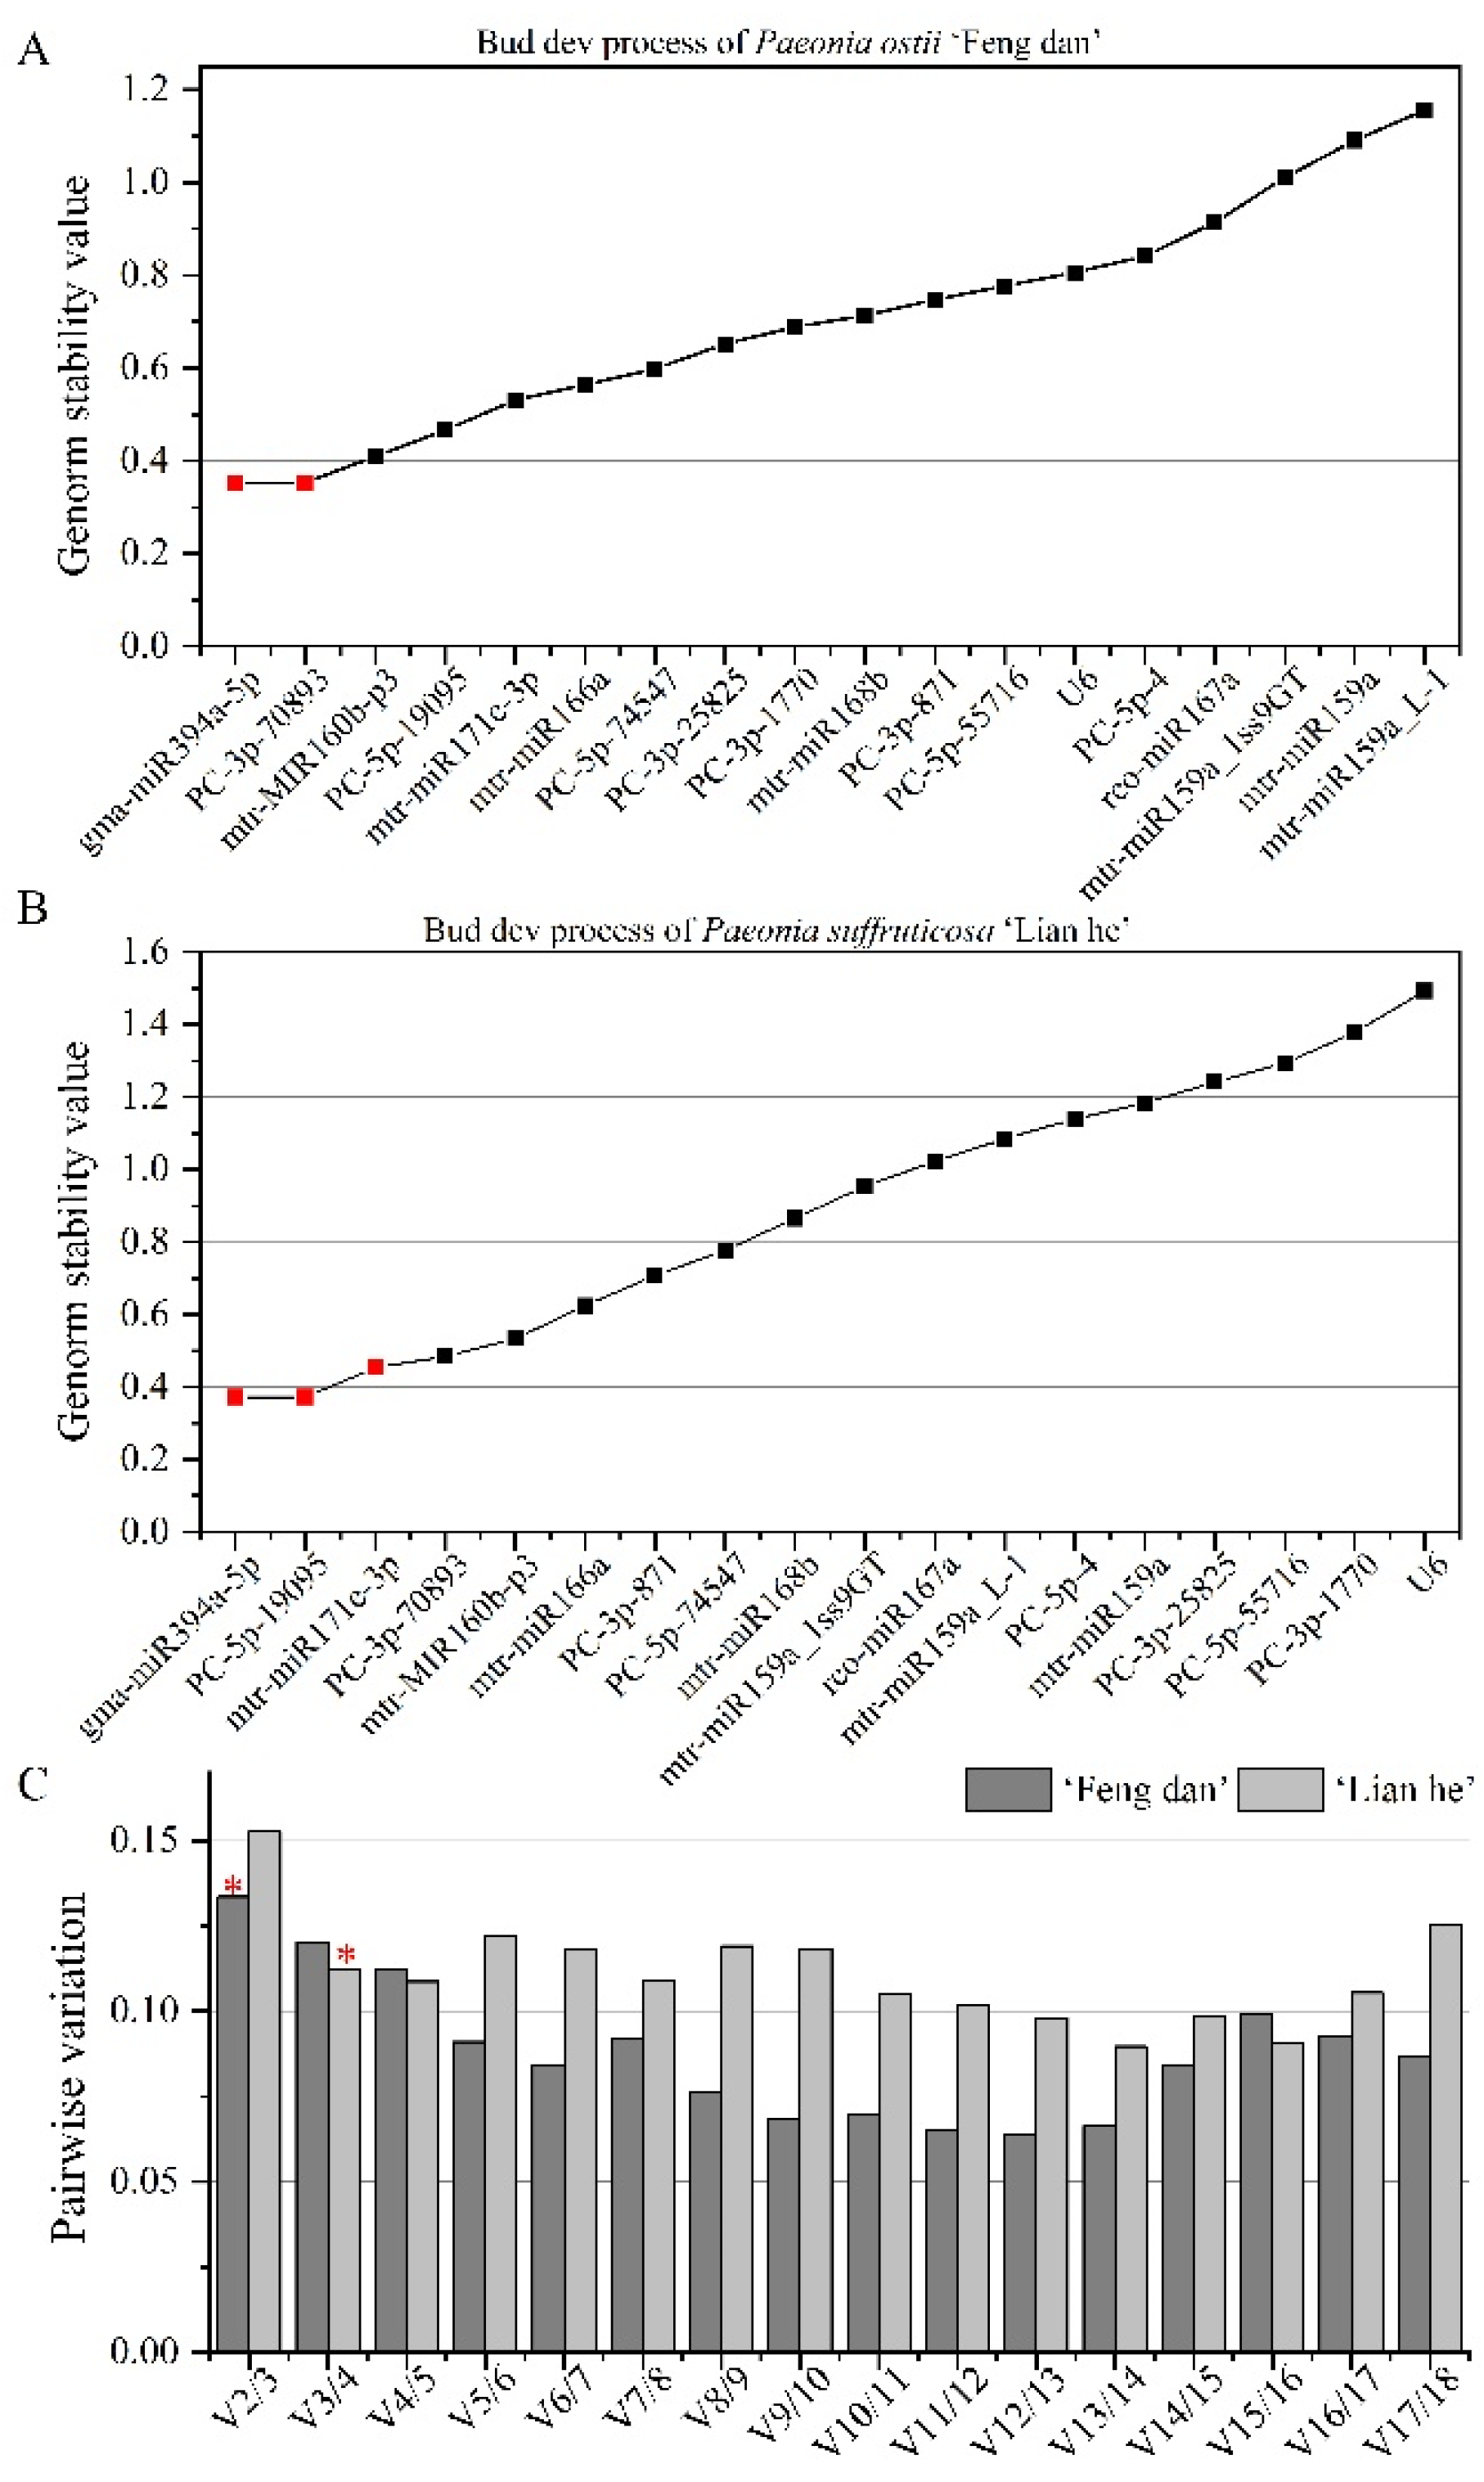
3.3.1. Stability Analysis of Candidate Reference miRNAs during the Bud Development Process

The results showed that M values of gma-miR394a-5p and PC-3p-70893 were the lowest in the bud development process of ‘Feng dan’, both of which were 0.35, indicating that they were the most stable miRNA expressed during the bud development process of ‘Feng dan’. M values of mtr-miR159a_1ss9GT, mtr-miR159a, and mtr-miR159a_L-1 were greater than 1, which were the most unstable (Figure 6A). The value of V2/V3 was 0.13 < 0.15, indicating that the normalization factor should preferably include two best reference genes (Figure 6C). Using the same analysis method, we revealed that the expression of gma-miR394a-5p, PC-5p-19095, and mtr-miR171e-3p (M values are 0.37, 0.37, and 0.45, respectively) was the most stable during the bud development process of ‘Lian he’ (Figure 6B), and the most appropriate number of reference miRNA was 3 (Figure 6C).
Results of NormFinder analysis showed that the most stably expressed miRNA was mtr-miR171e-3p (Figure S1A) in bud development samples of ‘Feng dan’. The expression of mtr-miR166a was the most stable in ‘Lian he’ samples (Figure S1B).
According to calculation results from the Bestkeeper program (Table S1), the optimal internal parameter was PC-3p-871 during the bud development process of ‘Feng dan’, and the SD value and CV value were 0.66 and 2.75, respectively. In addition, mtr-miR168b also had good stability. mtr-miR159a_1ss9GT (SD was 0.83; CV was 4.20) was confirmed to have the most stable expression during the bud development process of ‘Lian he’ (Table S2).
Because the ranking results of different programs are slightly different, RefFinder was used to completely reorder the selected miRNA, and the stability ranking of candidate reference miRNAs during bud development is shown in Table 2. In the bud development process of ‘Feng dan’ and ‘Lian he’, the stability order was as follows: mtr-MIR160b-p3, gma-miR394a-5p, PC-3p-70893, mtr-miR171e-3p, PC-5p-19095, PC-3p-871, mtr-miR166a, mtr-miR168b, PC-5p-74547, PC-3p-1770, PC-3p-25825, U6, PC-5p-4, PC-5p-55716, mtr-miR159a_1ss9GT, mtr-miR159a, rco-miR167a, mtr-miR159a_L-1 and PC-5p-19095, gma-miR394a-5p, mtr-MIR160b-p3, mtr-miR166a, mtr-miR168b, mtr-miR171e-3p, PC-3p-70893, PC-3p-871, mtr-miR159a_1ss9GT, rco-miR167a, mtr-miR159a, mtr-miR159a_L-1, PC-5p-74547, PC-5p-4, PC-5p-55716, PC-3p-25825, PC-3p-1770, and U6.

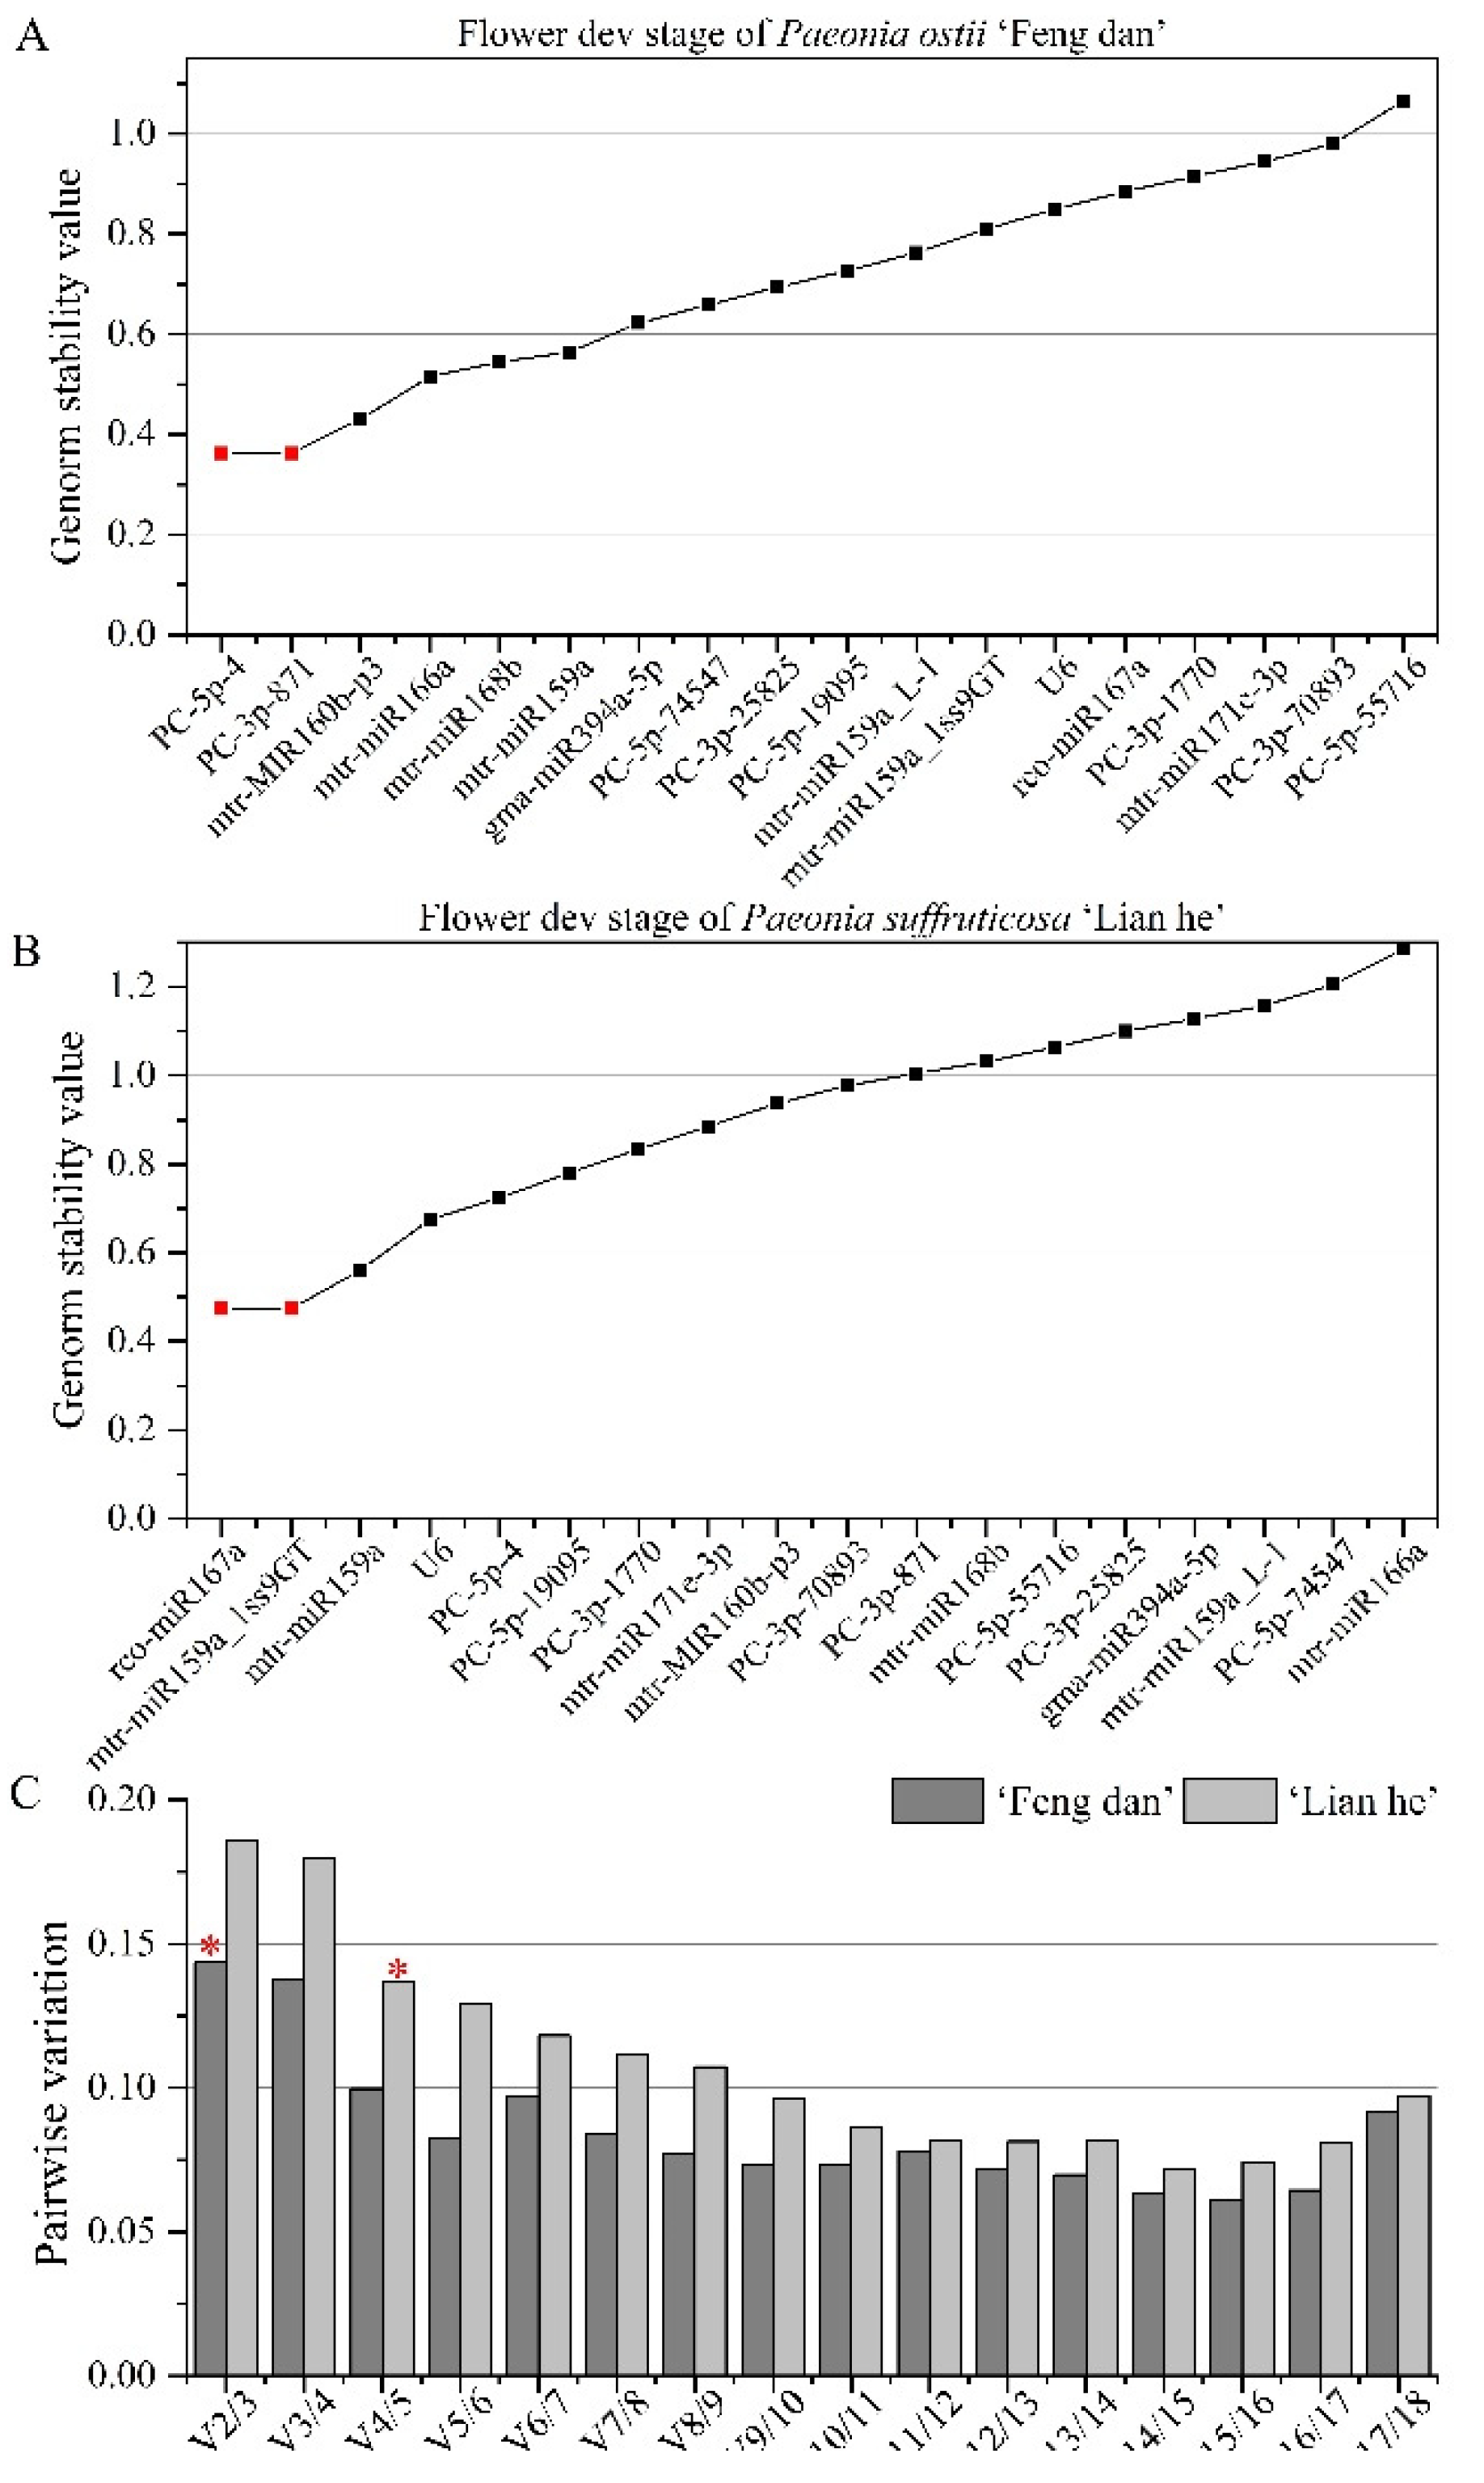
3.3.2. Stability Analysis of Candidate Reference miRNAs at Different Flower Developmental Stages

According to the parameters of geNorm, M values representing the expression stability of PC-5p-4 and PC-3p-871 were less than 0.5 in different flower development stages of ‘Feng dan’, showing high expression stability (Figure 7A). The paired variation value of V2/3 was 0.14, so two suitable reference miRNAs were determined after applying the Vn/Vn+1 selection threshold lower than 0.15 (Figure 7C). During different flower development stages of ‘Lian he’, rco-miR167a and mtr-miR159a_1ss9GT showed the highest expression stability (M = 0.47), and the most unstable expression miRNA was mtr-miR166a, showing the highest M value (1.28) (Figure 7B).
The NormFinder algorithm was used to determine the expression stability of reference miRNA using stable values. The stability value of candidate reference miRNAs ranged from 0.273 to 1.16 during the flower development stages of ‘Feng dan’. PC-5p-19095 was the most stable reference gene; PC-5p-55716 was the most unstable miRNA (Figure S2A). mtr-miR159a had the lowest NF value and was the most stable reference miRNA in ‘Lian he’; mtr-miR166a was the most unstable gene (Figure S2B).
Bestkeeper analysis results showed that the SD value and CV value of gma-miR394a-5p were the smallest in flower development stages of ‘Feng dan’, indicating that its expression was the most stable, while SD values of mtr-miR159a_1ss9GT, rco-miR167a, and PC-5p-55716 were greater than 1, indicating that its expression was unstable (Table S3). In the late-flowering variety tree peony ‘Lian he’, the best reference miRNA was PC-5p-19095 (SD value was 0.53; CV value was 2.19) (Table S4).
RefFinder analysis was used combined with the results of different analysis software to comprehensively reorder selected miRNAs (Table 2). For samples of flower development stages of ‘Feng dan’, the ranking of candidate reference miRNAs from the most stable to the most unstable was as follows: mtr-miR159a, gma-miR394a-5p, PC-5p-19095, mtr-MIR160b-p3, PC-5p-4, mtr-miR168b, PC-3p-871, mtr-miR166a, PC-3p-25825, PC-5p-74547, mtr-miR159a_L-1, mtr-miR159a_1ss9GT, U6, PC-3p-1770, mtr-miR171e-3p, rco-miR167a, PC-3p-70893, and PC-5p-55716. mtr-miR159a ranked first in samples of flower development stages of ‘Lian he’, followed by rco-miR167a, mtr-miR159a_1ss9GT, mtr-miR171e-3p, PC-5p-4, PC-5p-19095, U6, PC-3p-871, PC-3p-70893, PC-3p-1770, mtr-MIR160b-p3, mtr-miR168b, gma-miR394a-5p, mtr-miR159a_L-1, PC-5p-55716, PC-3p-25825, mtr-miR166a, and PC-5p-74547. These results indicate that mtr-miR159a is the most suitable reference miRNA for the flower development stages of two tree peony.

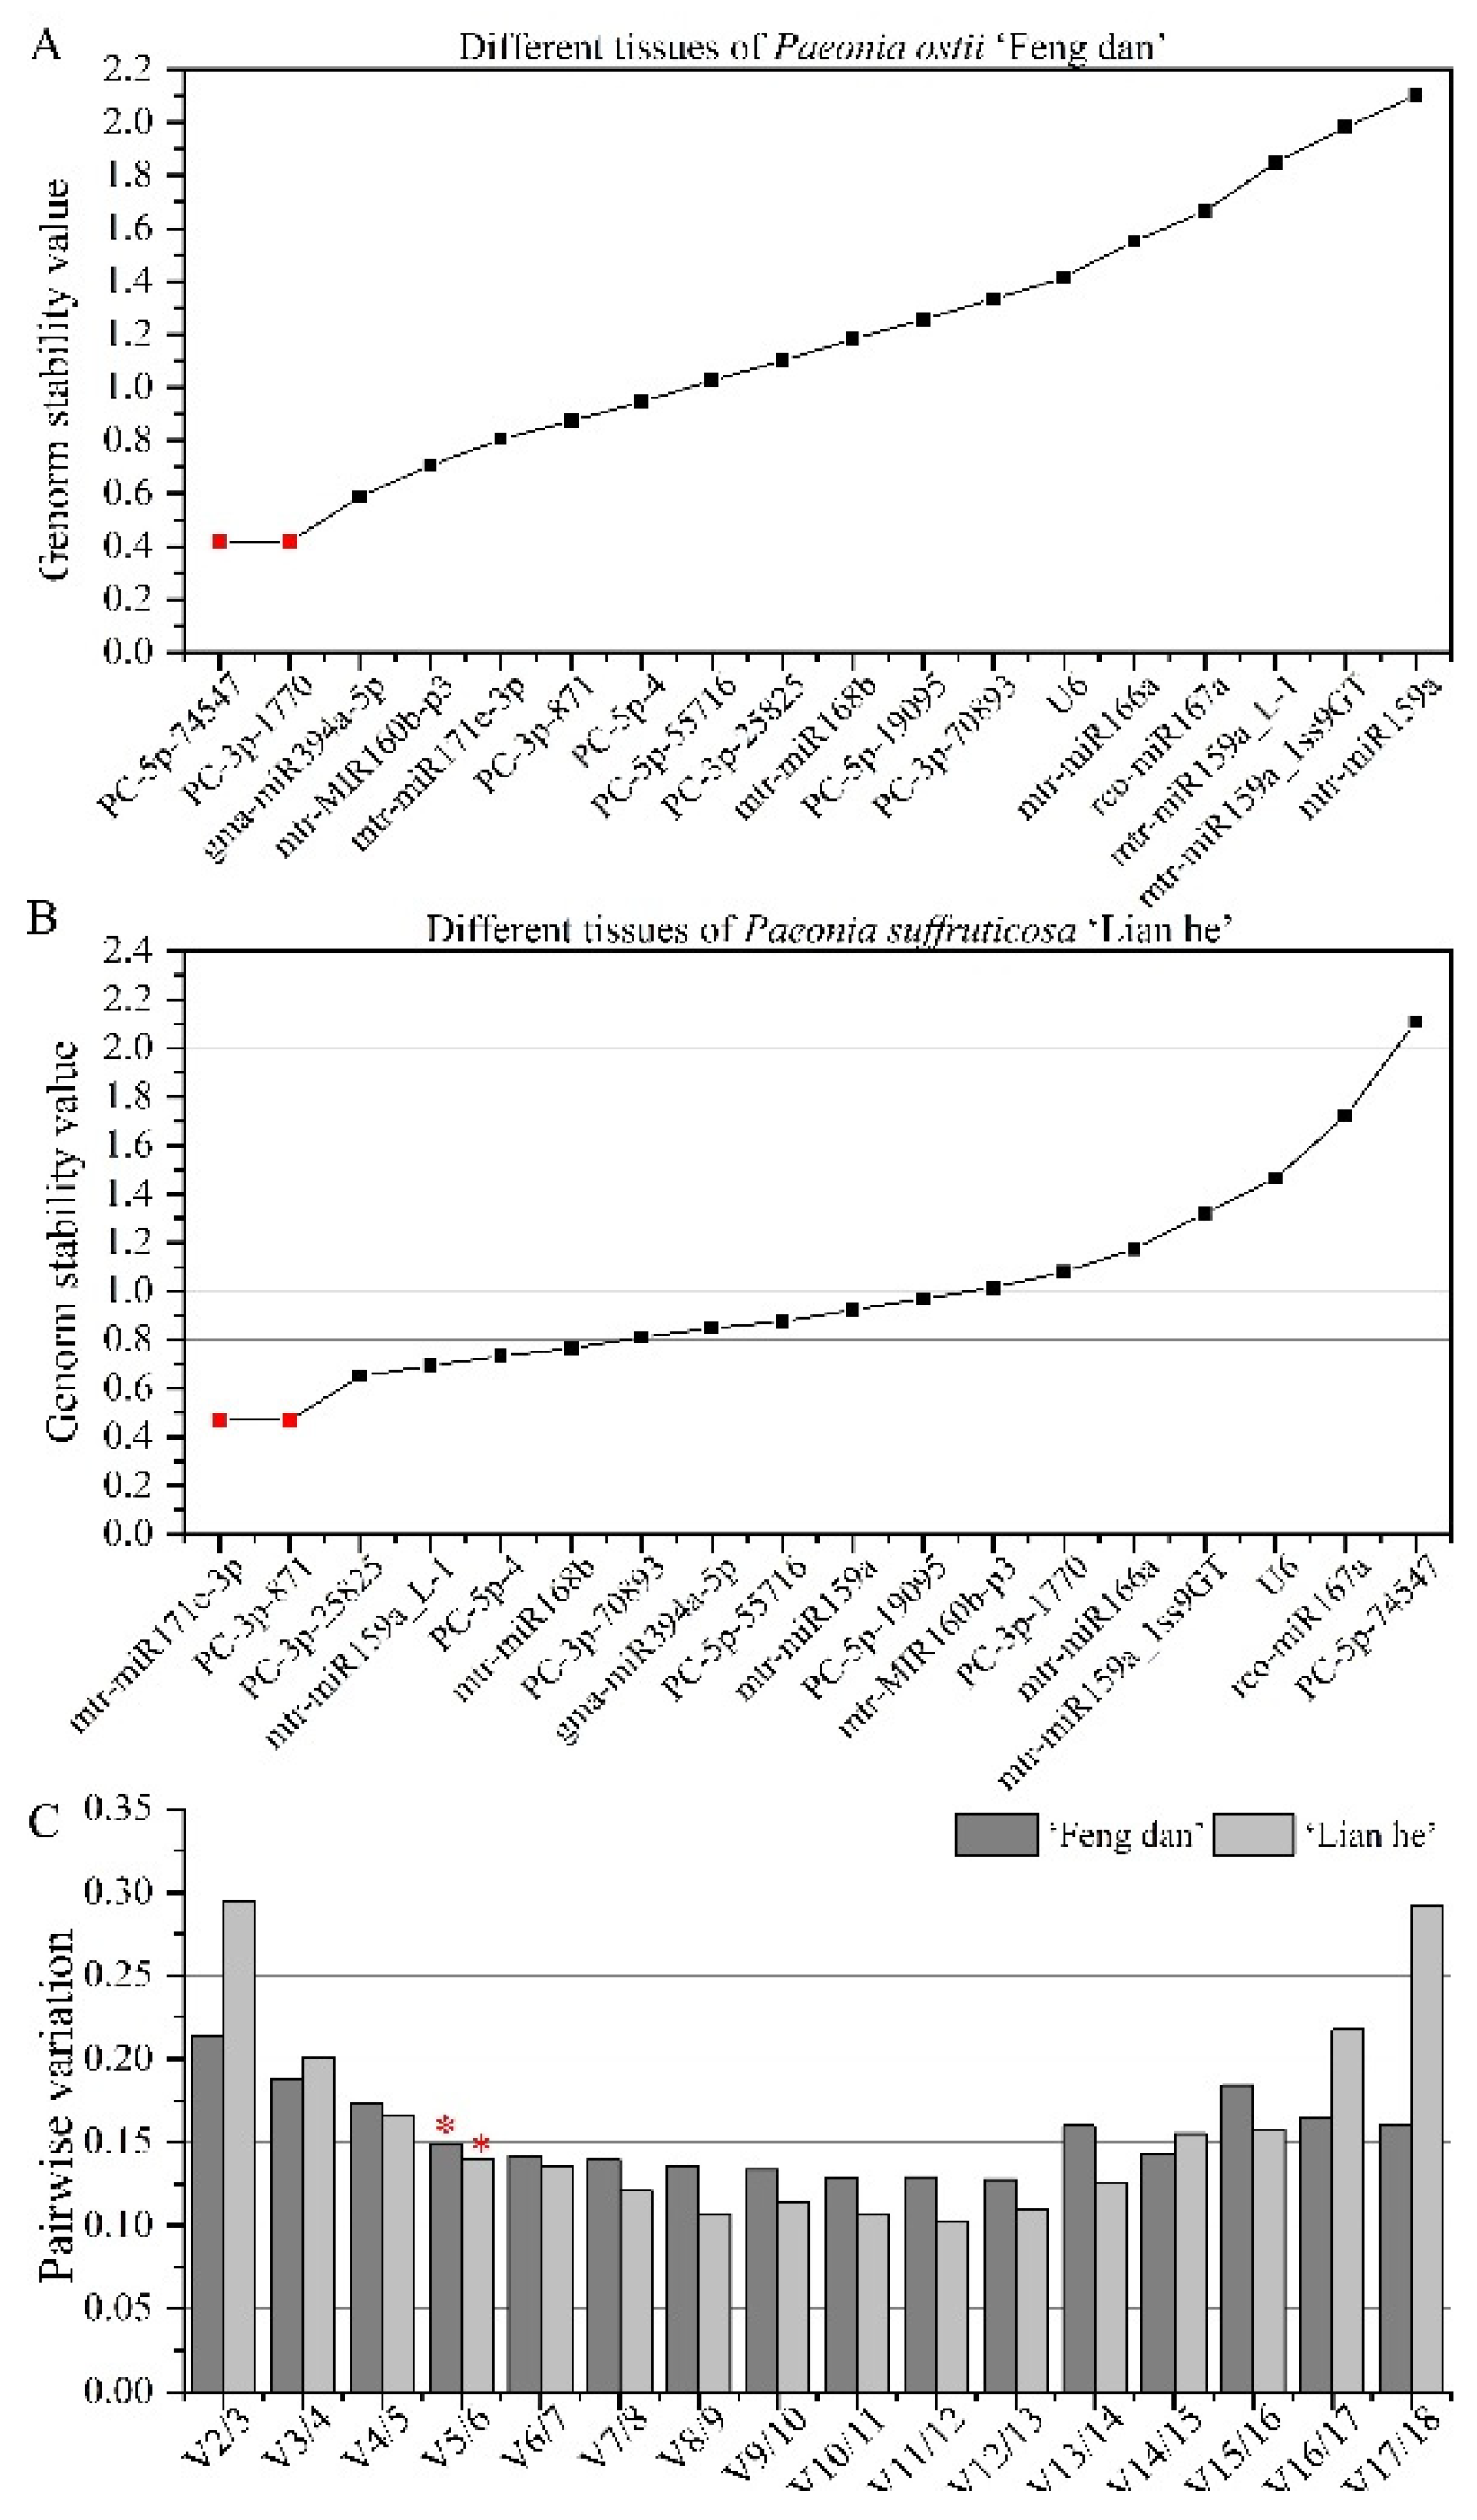
3.3.3. Stability Analysis of Candidate Reference miRNAs at Different Tissues

According to ranking results of geNorm, PC-5p-74547 and PC-3p-1770 were the most stable reference miRNAs for different tissue samples of ‘Feng dan’ based on its low M value (Figure 8A), and mtr-miR171e-3p and PC-3p-871 were considered as the most stable reference miRNAs for different tissue samples of ‘Lian he’ (Figure 8B). The optimal number of reference miRNA was determined using the Vn/Vn+1 value calculated by geNorm. As shown in Figure 8C, the V5/V6 value was less than 0.15 in both species. The combination of PC-5p-74547 and PC-3p-1770 was enough to normalize the expression of miRNA in different tissue samples of ‘Feng dan’; in different tissue samples of ‘Lian he’, mtr-miR171e-3p and PC-3p-871 were enough for normalization.
NormFinder analysis results showed that the most stable miRNA in the ‘Feng dan’ samples was PC-5p-4 (Figure S3A). The expression of PC-5p-4 was the most stable in ‘Lian he’ samples (Figure S3B).
The standard deviation (SD) of the Ct value calculated by BestKeeper reflects the expression stability of candidate miRNAs, and the miRNA with the lowest SD value is the most stable. In different tissue samples of ‘Feng dan’, PC-3p-871 had the lowest SD value (0.37) and was considered the most stable miRNA, while PC-3p-70893 was the most unstable miRNA (Table S5). PC-5p-19095 and PC-5p-74547 were listed as top and bottom miRNAs, respectively, for different tissues of ‘Lian he’ (Table S6).
The stability of candidate reference miRNAs was ranked in different tissues of the Full blooming stage by RefFinder analysis, and the results are shown in Table 2. From the most stable to the most unstable was as follows: PC-3p-871, PC-5p-4, mtr-miR171e-3p, gma-miR394a-5p, PC-3p-1770, PC-5p-74547, mtr-MIR160b-p3, PC-5p-19095, PC-5p-55716, U6, mtr-miR168b, mtr-miR166a, PC-3p-25825, PC-3p-70893, rco-miR167a, mtr-miR159a_L-1, mtr-miR159a_1ss9GT, and mtr-miR159a for ‘Feng dan’ tissues. PC-5p-4 was the top miRNA in ‘Lian he’, followed by mtr-miR168b, PC-5p-55716, PC-3p-871, mtr-miR159a, PC-3p-25825, mtr-miR171e-3p, mtr-miR159a_L-1, PC-5p-19095, gma-miR394a-5p, PC-3p-70893, mtr-MIR160b-p3, mtr-miR166a, PC-3p-1770, mtr-miR159a_1ss9GT, U6, rco-miR167a, and PC-5p-74547.

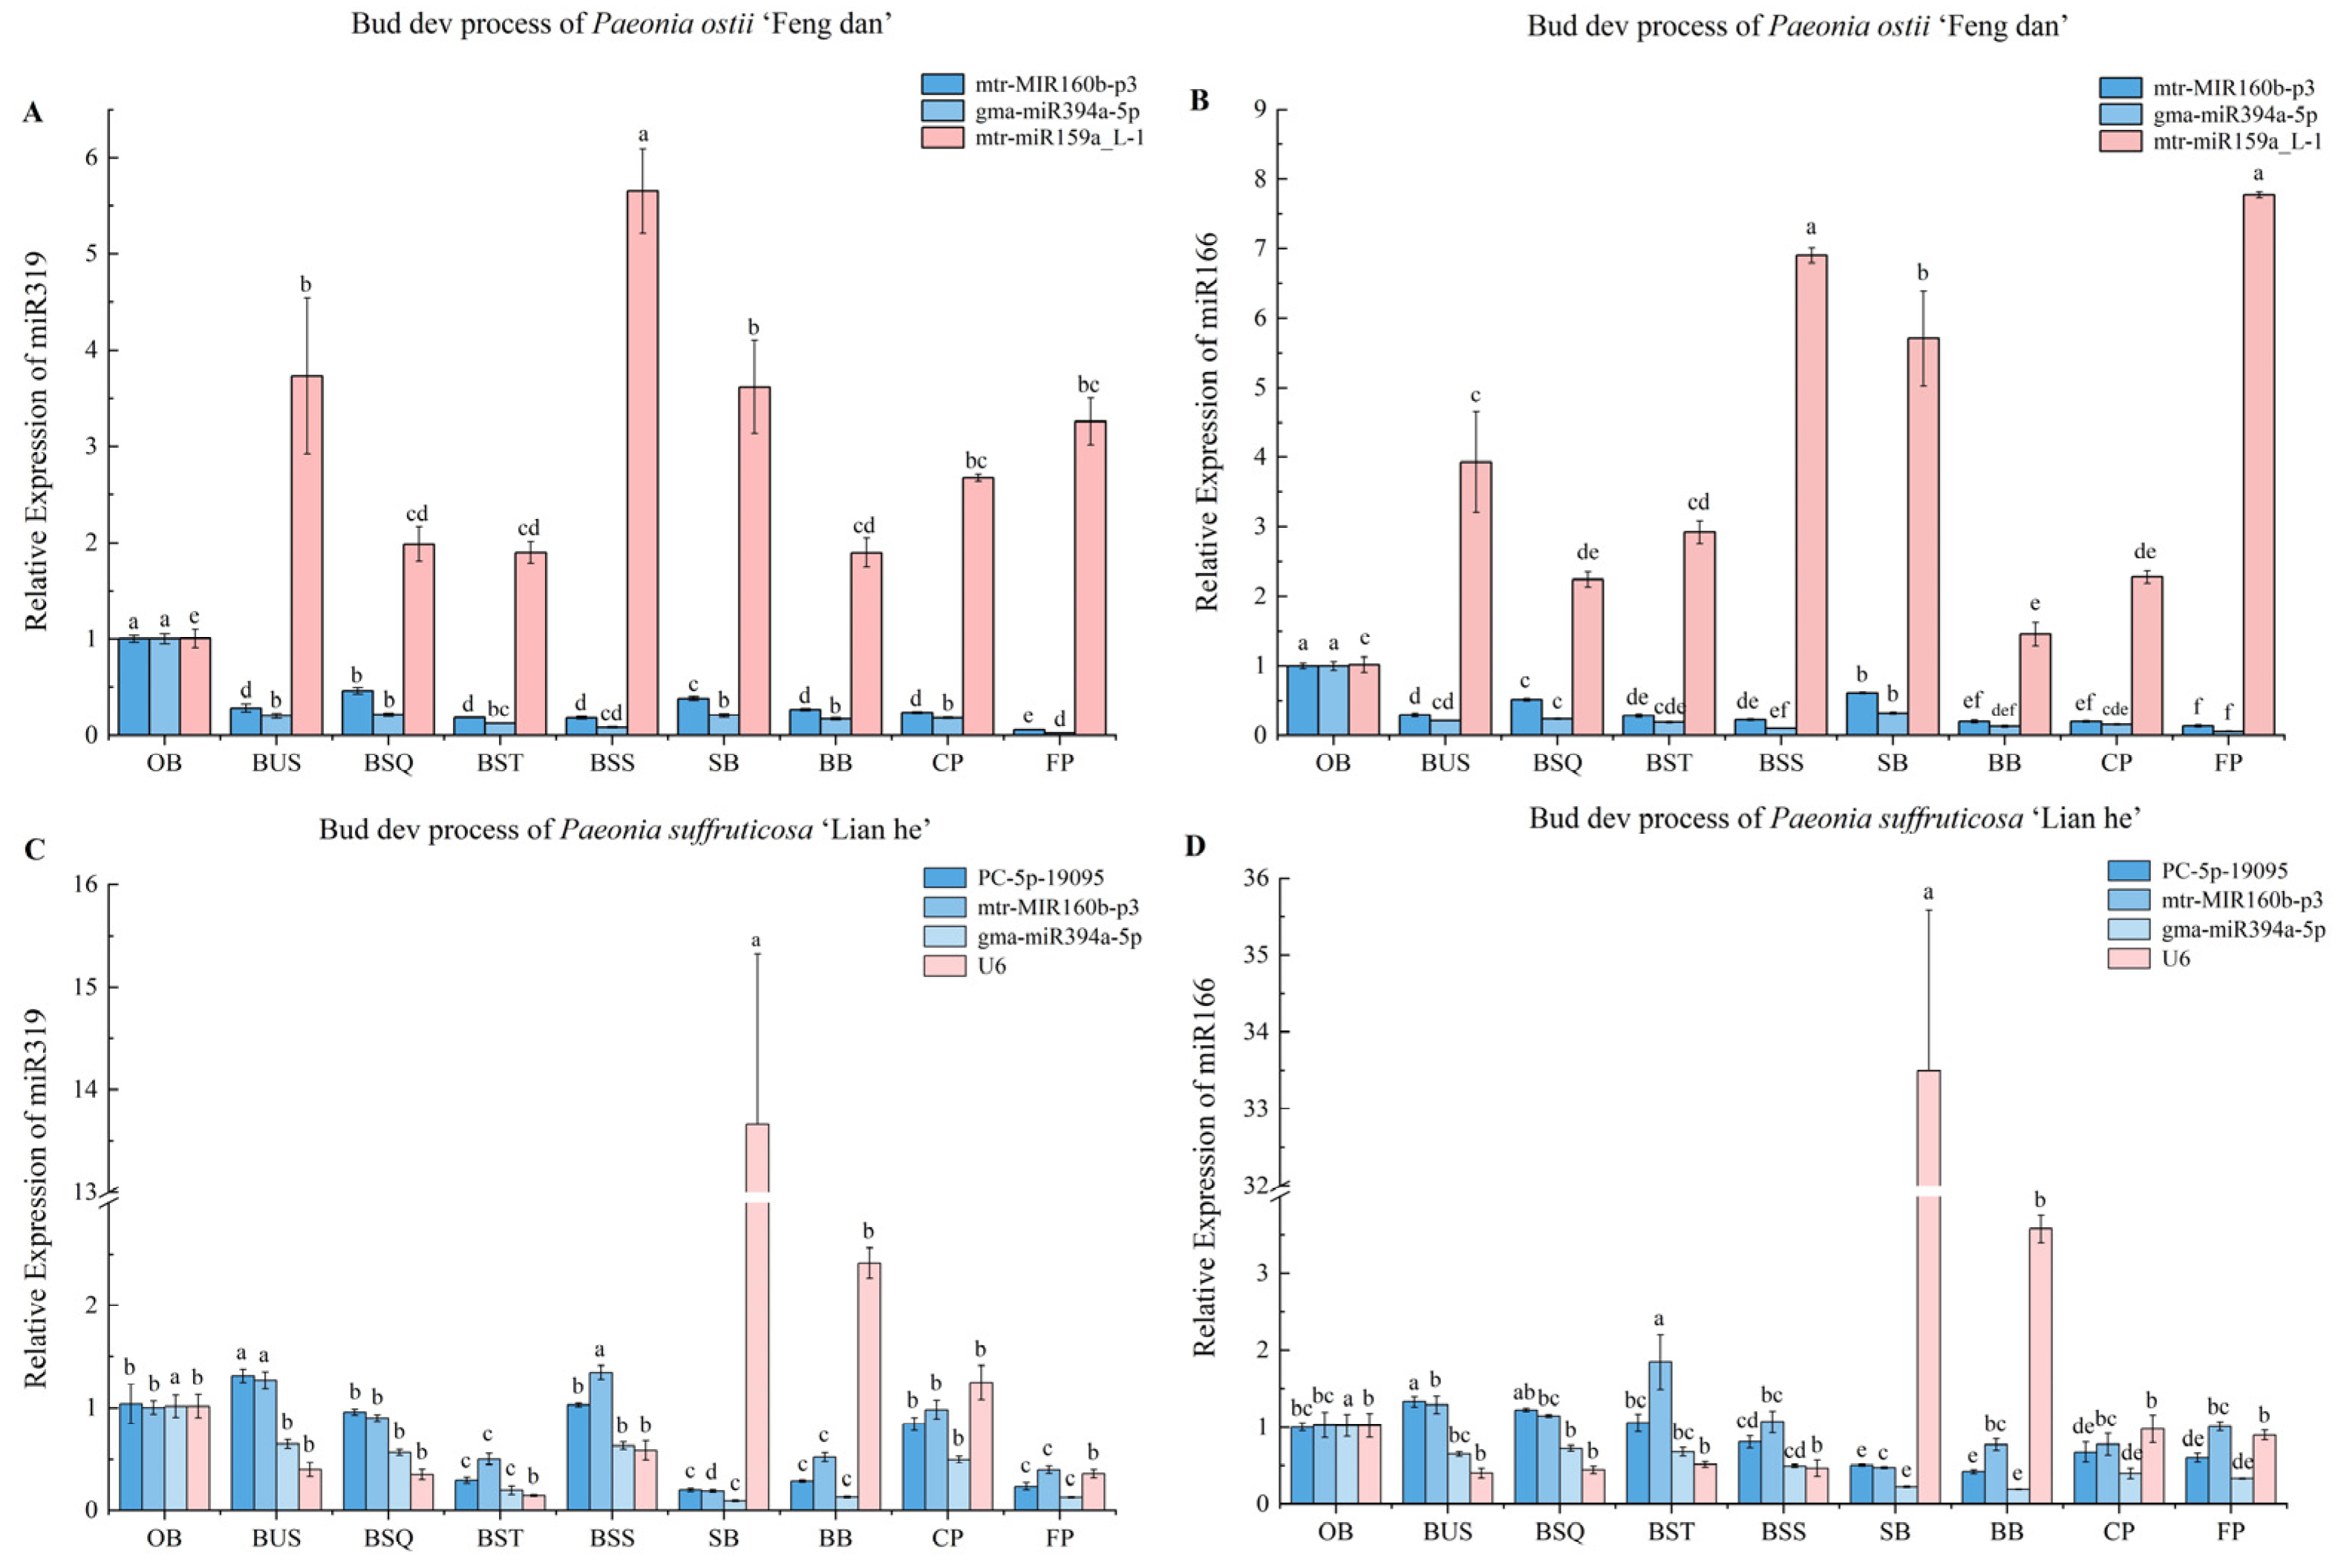
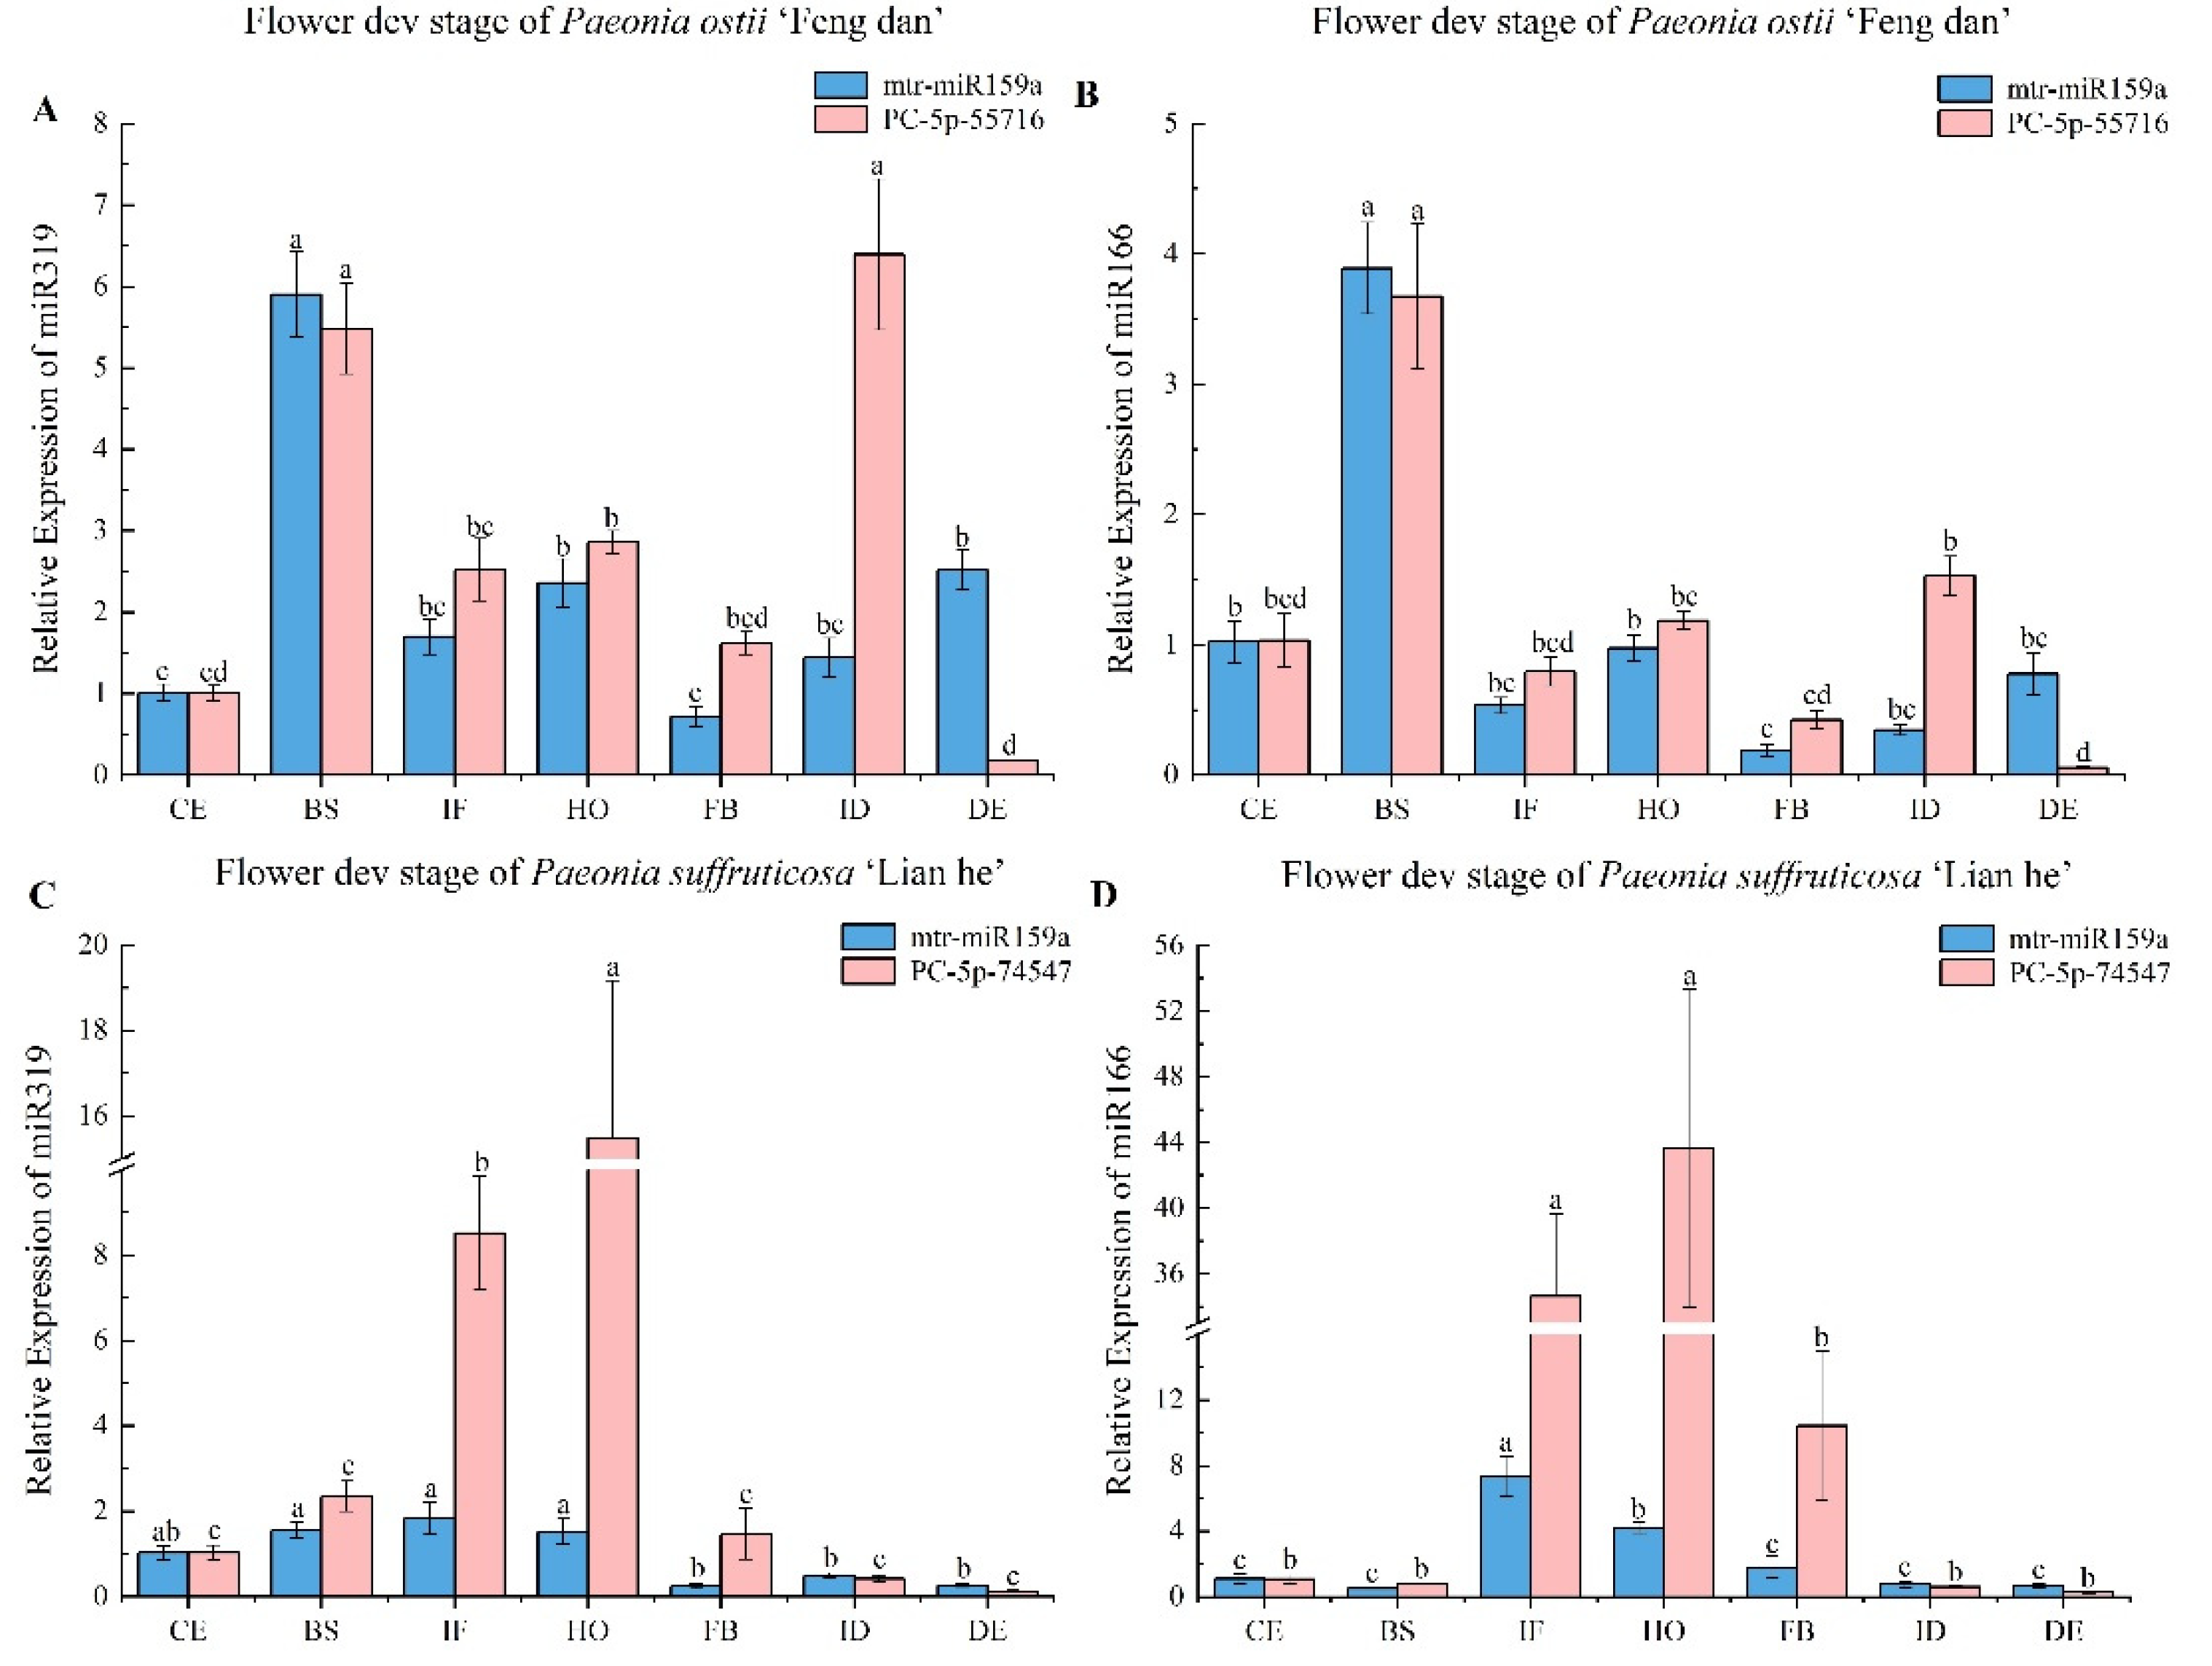
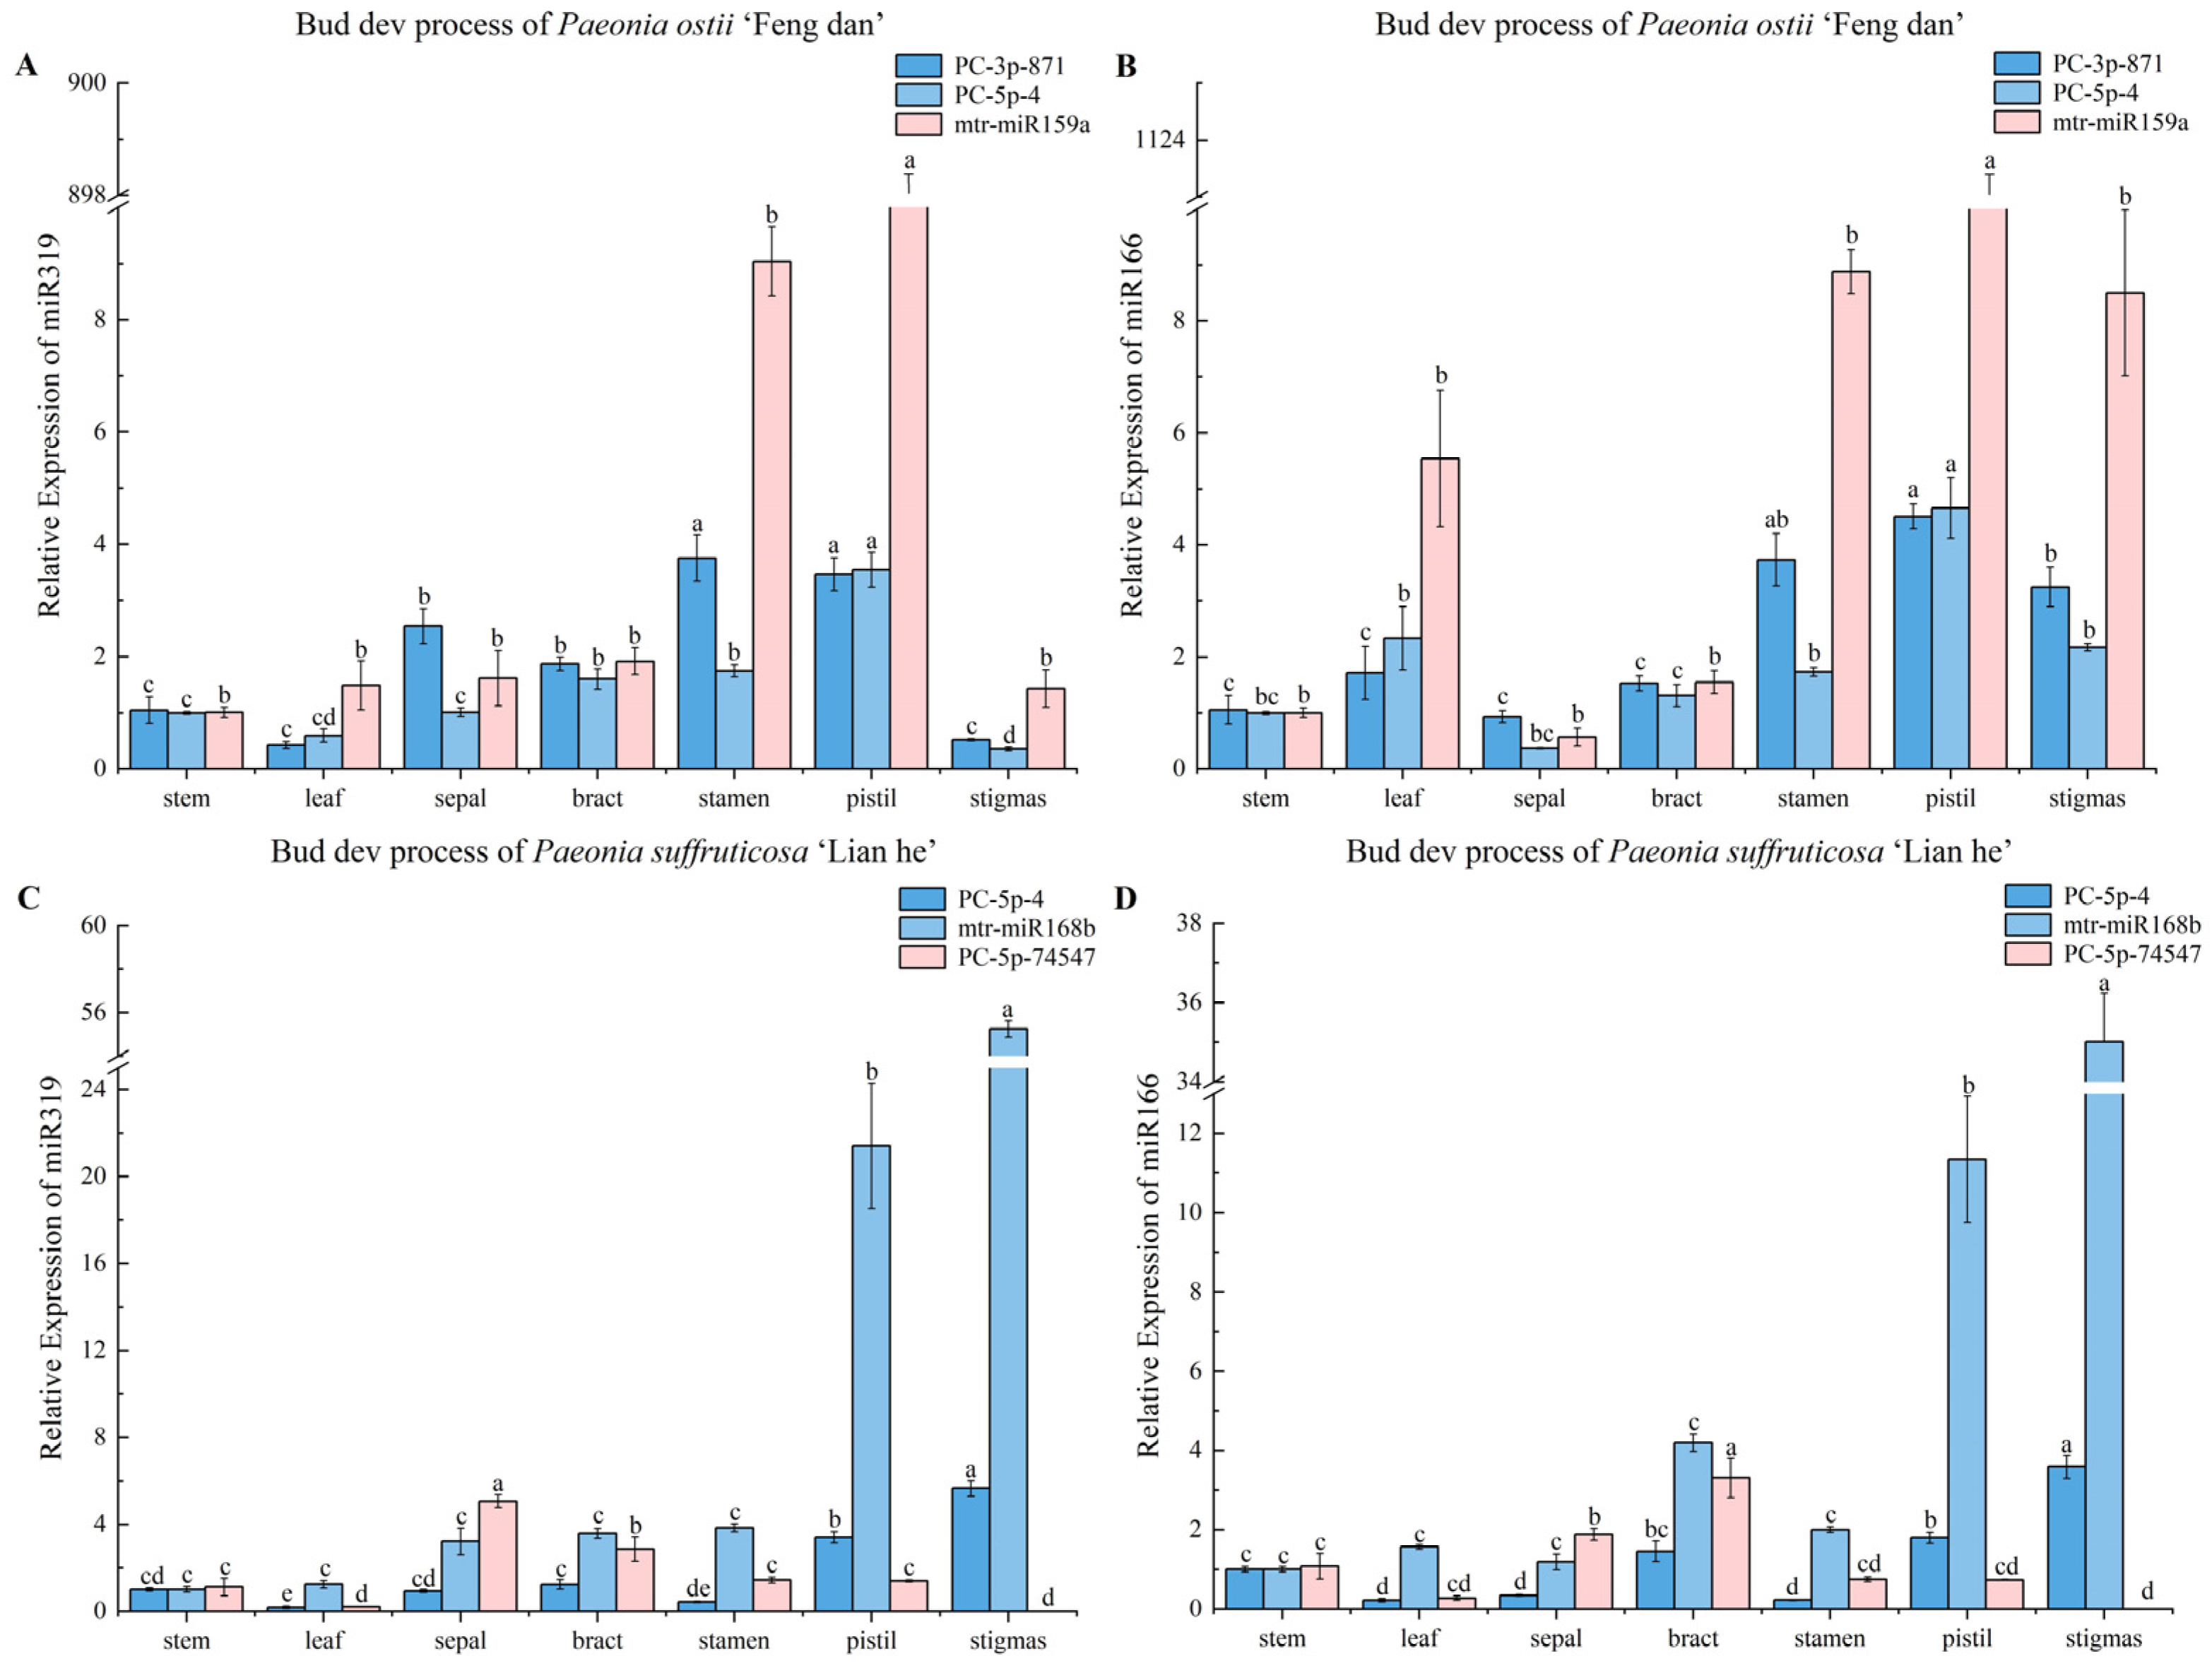
3.4. Validation of Reference miRNAs

In order to verify the reliability of reference miRNAs screened in this study, we evaluated the expression of Paeonia suffruticosa-specific cpa-MIR319-p3_1ss20GT and mtr-miR166g-5p. In the bud development group, mtr-MIR160b-p3 (optimal miRNA) and gma-miR394a-5p (next optimal miRNA) were used as reference miRNAs to analyze the expression pattern of miR319 in ‘Feng dan’; the results were basically the same. The expression of miR319 was highest in the Overwintering bud, followed by the Bud-squaring stage and Small-bell stage, and the lowest was in the Flat coach stage. When the most unstable miRNA (mtr-miR159a_L-1) was used as a reference to analyze, miR319 had the highest expression in the Bud-standing stage, followed by the Budding stage, and the results were not reliable (Figure 9A). Similarly, the same result was found when analyzing miR166: analysis of stable reference miRNAs (mtr-MIR160b-p3 and gma-miR394a-5p) showed that miR166 was highly expressed in Overwintering bud and poorly expressed in the Flat peach stage. Analysis of unstable miRNA (mtr-miR159a_L-1) showed that the highest expression of miR166 appeared in the Flat peach stage and Bud standing stage, followed by the Small-bell stage (Figure 9B). In the samples of bud development in ‘Lian he’, the best reference miRNA PC-5p-19095 and the second best gma-miR394a-5p and mtr-MIR160b-p3 were used to analyze the expression pattern of miR319 in ‘Feng dan’. The results were basically the same. Expression of miR319 was higher in the Budding stage, Bud-standing stage, and Overwintering bud, and the lowest in the Small-bell stage. However, the highest expression of miR319 was found in the Small-bell stage when the most unstable reference U6 was used for analysis, and the results are not reliable (Figure 9C). Analysis of stable reference miRNAs (PC-5p-19095, gma-miR394a-5p, and mtr-MIR160b-p3) showed that miR166 was highly expressed in the first four stages of the bud development process, and expression was lowest in the Small-bell stage; Unstable reference (U6) showed that the highest expression amount of miR166 was discovered in the Small-bell stage, while the expression in other bud development samples was low (Figure 9D).
In the flower development stages group of tree peony, miR319 was found to have the highest expression in the Blooming stage in ‘Feng dan’, which was significantly higher than those of other stages, and the lowest expression in the Color-exposure stage and Full Blooming stage, which was significantly lower than those of the other stages. However, analysis results of stable miRNA and unstable miRNA were quite different. When PC-5p-55716 (unstable miRNA) was used as an internal reference, the expression level of miR319 was highest in the Initial decay stage, followed by the Blooming stage, which was significantly lower than those of the other stages (Figure 10A). Expression of miR166 was highest in the Blooming stage and lowest in the Full blooming stage during flower development of ‘Feng dan’. With PC-5p-55716 (unstable miRNA) as an internal reference, miR166 had the highest expression in the Blooming stage, but the lowest expression in the Decay stage (Figure 10B). When mtr-miR159a (stable miRNA) was used as a reference, expression of miR319 at seven different stages of ‘Lian he’ flower development first increased and then decreased, reaching the highest value at the Initial flowering stage (Figure 10C). Analysis of the miR166 expression mode found that its expression level was highest in the Initial flowering stage, followed by the Half opening stage, and there was no significant difference in other periods (Figure 10D). However, results of PC-5p-74547 standardization treatment showed that miR319 and miR166 were expressed at the highest level in the Half opening stage of ‘Lian he’, followed by the Initial flowering stage, and significantly higher than those of the other five stages (Figure 10C,D).
In order to further test the reliability of reference miRNAs selected from the tissue groups, PC-3p-871 and PC-5p-4 with good stability were used as an internal reference to analyze expression patterns of miR319 and miR166 in different tissues of ‘Feng dan’ tree peony. Results showed that the relative expression amount of miR319 in different tissues of ‘Feng dan’ was similar by normalization through different references, which was higher in stamen and pistil, and lowest in stigmas (Figure 11A); miR166 had the highest expression in pistil, followed by stamen and stigmas, and the lowest expression in sepal (Figure 11B). Taking the most unstable mtr-miR159a as an internal reference, its expression trend was consistent with the normalization trend of the stable internal reference. However, expression levels of miR319 and miR166 were both extremely high in the pistil, hundreds of times higher than in others, so the results were not reliable (Figure 11A,B). PC-5p-4 and mtr-miR168b of the most stable reference miRNAs and the most unstable PC-5p-74547 were selected to analyze the expression pattern of miR319 and miR166 in ‘Lian he’ tissues to verify the stability of selected reference miRNAs. With two kinds of stable miRNAs as references, the relative expression of miR319 and miR166 in different tissues changed similarly, with the highest expression and significant difference in stigmas, followed by pistil, which was also significantly higher than other tissues (Figure 11C,D). When PC-5p-74547 (unstable) was used as a reference, the highest expression of miR319 was in the sepal of ‘Lian he’, followed by the bract, and the lowest expression was found in leaves and stigmas (Figure 11C). Expression of miR166 was highest in the bract of ‘Lian he’, followed by sepal, significantly higher than those in other tissues (Figure 11D), and its trend was inconsistent with results of stable reference miRNAs analysis.

4. Discussion

The qRT-PCR is usually used to determine gene expression levels and verify transcriptome data, which is considered as the gold standard [45]. The use of appropriate reference genes is the most common method for data standardization of qRT-PCR, which can alleviate problems caused by differences in experimental materials [46]. In this experiment, the best internal reference gene of miRNA was screened to provide an appropriate internal reference for the miRNA study of bud development, flower development, and different tissues of early and late-flowering tree peony.
With the gradual deepening of miRNA research, the potential use of miRNA as a reference has grabbed more attention of researchers. Research has demonstrated that reference miRNAs obtained from plant species are more stable than currently used genes under specific conditions [30]. Lyu et al. found that poly(A)-tailed miR162-3p and miR472 were the best reference gene combination for miRNA RT-qPCR normalization in citrus canker research [39]. A set of microRNAs such as miR390-5p and miR7694-3p were found to be the most stable reference gene combination in rice after infection with root-knot nematode Meloidogyne graminicola or after priming with beta-amino butyric acid [35]. U6-1, EIF4A, and PP2A-2 were the three most appropriate reference genes for qRT-PCR normalization of miRNAs and mRNAs during the regeneration process of poplar [30]. Under abiotic stress in lettuce, MIR169, MIR171/170, and MIR172 were stably expressed [31]. In addition, it was also confirmed that the internal reference applicability of miRNA expression was different in different plant species under different conditions, including poplar under pathogen stress [33], grapevine under abiotic stress [32], seed development in Brassica napus [37], and citrus somatic embryogenic and adult tissues [29]. Thus, stable miRNAs as internal reference genes for expression analysis do not absolutely exist and the stability of miRNA expression varies with species, and is also affected by experimental methods and conditions.
In this experiment, mtr-MIR160b-p3 and gma-miR394a-5p were found to be stable miRNAs expressed during the bud development process of ‘Feng dan’ (early-flowering tree peony); PC-5p-19095 is the most stable miRNA expressed during the bud development process of ‘Lian he’ (late-flowering tree peony), followed by gma-miR394a-5p and mtr-MIR160b-p3. In general, mtr-MIR160b-p3 and gma-miR394a-5p both have high stability during the development process of tree peony buds, whether it is the early-flowering variety or late-flowering variety. These two miRNAs belonged to the conservative miRNA family and play important physiological roles in plant. The target gene of miR160b is a member of the ARF family, which is involved in regulating auxin signal transduction and plays an important role in promoting fruit expansion [47], enhancing resistance to salt stress [48], and improving drought resistance [49]. The target gene of miR394a is the F-box gene, which functions in positive modulation of abiotic stress tolerance, such as drought [50], salt [51], and cold [52].
mtr-miR159a is the most stably expressed miRNA in the flower development stages of two tree peonies. During somatic embryogenesis of Lilium pumilum DC. Fisch, lpu-miR159a was also found to be the optimal reference gene; while the best reference gene was lda-miR162, followed by lda-miR159a in Lilium davidii var. unicolor [28]. miR159 is strongly conserved and highly abundant throughout the plant, which plays important roles by targeting GAMYB and GAMYB-like genes in controlling male reproductive development, seed development, vegetative tissues, flowering-time and growth, fruit and reproductive development, and plant stress tolerance [53]. PC-3p-871 can be used as the most suitable reference miRNA in different tissues of early-flowering tree peony, followed by PC-5p-4; PC-5p-4 can be used as the most suitable internal reference miRNA in different tissues of late-flowering tree peony, followed by mtr-miR168b. miR168 is also a suitable reference gene for the expression analysis of barley [36]. miR168b targets the AGO1 gene to play a role in plants, and these interactions determine growth rate, phase change, leaf surface area, fruit initiation and expansion, and other development processes in tomato [54]. The present experiment also found that the results of NormFinder were consistent with those of geNorm analysis in most cases, which is consistent with the findings of Zhang et al. [33].
U6 is the most commonly used internal reference in miRNA expression analysis [55]. U6 was used as an endogenous reference for expression normalization of miRNAs in previous studies of miRNA in tree peony, such as the identification and exploration of miRNAs that regulate the flower color of tree peony [56], response to copper stress [57], identification of microRNAs in fatty acid biosynthesis in tree peony seeds [58], and microRNAs in chilling-induced dormancy release [59]. However, results of the current study showed that expression of U6 in tree peony was unstable, which ranked 12th in the bud development process of ‘Feng dan’, ranked 13th in flower development stages, and ranked 10th in different tissues in the Full blooming stage. U6 had the worst stability during the bud development process of ‘Lian he’, which ranked 7th in flower development stages and 3rd from bottom in different tissues in the Full blooming stage. This is consistent with the results in barley [36] and in Lilium [28].
In general, due to the time and space changes, miRNA expression level is not constant. It is necessary to screen reference genes of stable expression suitable from a variety of reference genes according to the actual research cell and tissue types and experimental requirements. At the same time, we can also choose the research method of multiple reference genes, set two or more reference genes, and correct the target gene after taking the mean value; more reliable results can be obtained. The results of this experiment verified the necessity of determining the best reference gene before starting the gene expression research of specific species, rather than blindly selecting the commonly used reference gene. It is worth noting that the best reference genes between species in family Paeoniaceae are different. This means that different species or varieties in same family need specific reference genes to normalize miRNA expression, which has been confirmed in chrysanthemum and lily [28,60]. This is the first report focusing on the reference genes validation for miRNA expression normalization in tree peony. However, this study still has some shortcomings, lacking a comparison with the housekeeping gene previously researched, which will be considered in future work. Looking forward, it is interesting to integrate quantitative genetics with the field of “big data” analysis [61]. Combining evolutionary adaptation prediction with ecological genomics innovation will help capture genetic adaptation to the environment based on plant germplasm resources [62]. For example, using eGWAS for expression mapping to better understand the binding and trans regulation of miRNAs and genome prediction of expression profiles is worth further attempts and exploration.

5. Conclusions

In conclusion, the current study revealed that optimal reference genes are different for different samples. mtr-MIR160b-p3 and gma-miR394a-5p are stable miRNAs expressed during the bud development process of early-flowering tree peony ‘Feng dan’; PC-5p-19095 is the most stable miRNA expressed during the bud development process of late-flowering tree peony ‘Lian he’, followed by gma-miR394a-5p and mtr-MIR160b-p3. mtr-miR159a is the most stable miRNA expressed in the flower development stages of two different flowering-time tree peony. PC-3p-871 can be used as the most suitable reference miRNA in different tissues of early-flowering tree peony ‘Feng dan’, followed by PC-5p-4. PC-5p-4 can be used as the most suitable reference miRNA in different tissues of late-flowering tree peony ‘Lian he’, followed by mtr-miR168b. These findings provide an important reference for relevant researchers to carry out qRT-PCR work in tree peony with different flowering time.

Supplementary Materials

The following supporting information can be downloaded at: https://www.mdpi.com/article/10.3390/horticulturae9020148/s1, Figure S1: Expression stability analysis of candidate reference miRNAs in the bud development process calculated by NormFinder; Figure S2: Expression stability analysis of candidate reference miRNAs in flower development stages calculated by NormFinder; Figure S3: Expression stability analysis of candidate reference miRNAs in different tissues calculated by NormFinder; Table S1: Description of candidate reference miRNAs in the bud development process of ‘Feng Dan’ based on BestKeeper; Table S2: Description of candidate reference miRNAs in the bud development process of ‘Lian He’ based on BestKeeper; Table S3: Description of candidate reference miRNAs in flower development stages of ‘Feng Dan’ based on BestKeeper; Table S4: Description of candidate reference miRNAs in flower development stages of ‘Lian He’ based on BestKeeper; Table S5: Description of candidate reference miRNAs in different tissues of ‘Feng Dan’ based on BestKeeper; Table S6: Description of candidate reference miRNAs in flower development stages of ‘Lian He’ based on BestKeeper.

Author Contributions

C.Z.: material preparation, data collection, data analysis, draft writing. C.S.: material preparation, data collection, data analysis. L.C.: data collection, data analysis. H.M.: material preparation, data collection. Y.Z.: data collection. D.G.: draft revision. L.G.: conceptualization and draft review. X.H.: conceptualization, reviewing, funding acquisition. All authors have read and agreed to the published version of the manuscript.

Funding

This work was supported by the National Natural Science Foundation of China (grant number U1804233); National High Technology Research and Development Program of China (grant number 2020YFD1000503); the Central Plains Scholars Fund of Henan Province (grant number 212101510003).

Informed Consent Statement

Not applicable.

Data Availability Statement

The datasets generated during and/or analyzed during the current study are listed in the text and its additional files.

Acknowledgments

We thank Golam Jalal Ahammed for its linguistic assistance during the preparation of this manuscript and Muhammad Shaaban for their linguistic assistance during the revision of this manuscript.

Conflicts of Interest

We declare that we have no known competing financial interests or personal relationships that could have appeared to influence the work reported in this paper.

References

  1. Zhang, L.; Guo, D.L.; Guo, L.L.; Guo, Q.; Wang, H.F.; Hou, X.G. Construction of a high-density genetic map and QTLs mapping with GBS from the interspecific F1 population of P. ostii ‘Fengdan Bai’ and P. suffruticosa ‘Xin Riyuejin’. Sci. Hortic. 2019, 246, 190–200. [Google Scholar] [CrossRef]
  2. Liu, Z.Y.; Shi, Y.T.; Xue, Y.Q.; Wang, X.P.; Huang, Z.; Xue, J.Q.; Zhang, X.X. Non-structural carbohydrates coordinate tree peony flowering both as energy substrates and as sugar signaling triggers, with the bracts playing an essential role. Plant Physiol. Biochem. 2021, 159, 80–88. [Google Scholar] [CrossRef] [PubMed]
  3. Hou, X.G.; Guo, Q.; Wei, W.Q.; Guo, L.L.; Guo, D.L.; Zhang, L. Screening of genes related to early and late flowering in tree peony based on bulked segregant RNA sequencing and verification by quantitative real-time PCR. Molecules 2018, 23, 689. [Google Scholar] [CrossRef] [PubMed] [Green Version]
  4. Zhang, C.J.; Shen, J.J.; Wang, C.; Wang, Z.Y.; Guo, L.L.; Hou, X.G. Characterization of PsmiR319 during flower development in early-and late-flowering tree peonies cultivars. Plant Signal. Behav. 2022, 17, 2120303. [Google Scholar] [CrossRef]
  5. Zhang, L.; Song, C.W.; Guo, D.L.; Guo, L.L.; Hou, X.G.; Wang, H.F. Identification of differentially expressed miRNAs and their target genes in response to brassinolide treatment on flowering of tree peony (Paeonia ostii). Plant Signal. Behav. 2022, 17, 2056364. [Google Scholar] [CrossRef]
  6. Wang, J.; Long, Y.; Zhang, J.W.; Xue, M.D.; Huang, G.G.; Huang, K.; Yuan, Q.H.; Pei, X.W. Combined analysis and miRNA expression profiles of the flowering related genes in common wild rice (oryza rufipogon Griff.). Genes Genom. 2018, 40, 835–845. [Google Scholar] [CrossRef] [Green Version]
  7. Zhao, C.Z.; Li, T.T.; Zhao, Y.H.; Zhang, B.H.; Li, A.Q.; Zhao, S.Z.; Hou, L.; Xia, H.; Fan, S.J.; Qiu, J.J.; et al. Integrated small RNA and mRNA expression profiles reveal miRNAs and their target genes in response to Aspergillus flavus growth in peanut seeds. BMC Plant Biol. 2020, 20, 215. [Google Scholar] [CrossRef]
  8. Willmann, M.R.; Poethig, R.S. Conservation and evolution of miRNA regulatory programs in plant development. Curr. Opin. Plant Biol. 2007, 10, 503–511. [Google Scholar] [CrossRef] [Green Version]
  9. Curaba, J.; Spriggs, A.; Taylor, J.; Li, Z.Y.; Helliwell, C. miRNA regulation in the early development of barley seed. BMC Plant Biol. 2012, 12, 1–16. [Google Scholar] [CrossRef] [Green Version]
  10. Choudhary, A.; Kumar, A.; Kaur, H.; Kaur, N. MiRNA: The taskmaster of plant world. Biologia 2021, 76, 1551–1567. [Google Scholar] [CrossRef]
  11. Spanudakis, E.; Jackson, S. The role of microRNAs in the control of flowering time. J. Exp. Bot. 2014, 65, 365–380. [Google Scholar] [CrossRef]
  12. Li, X.Y.; Guo, F.; Ma, S.Y.; Zhu, M.Y.; Pan, W.H.; Bian, H.W. Regulation of flowering time via miR172-mediated APETALA2-like expression in ornamental gloxinia (Sinningia speciosa). J. Zhejiang Univ. -Sci. B 2019, 20, 322–331. [Google Scholar] [CrossRef]
  13. Lee, Y.S.; Lee, D.Y.; Cho, L.H.; An, G. Rice miR172 induces flowering by suppressing OsIDS1 and SNB, two AP2 genes that negatively regulate expression of Ehd1 and florigens. Rice 2014, 7, 1–13. [Google Scholar] [CrossRef] [Green Version]
  14. Glazińska, P.; Zienkiewicz, A.; Wojciechowski, W.; Kopcewicz, J. The putative miR172 target gene InAPETALA2-like is involved in the photoperiodic flower induction of Ipomoea nil. J. Plant Physiol. 2009, 166, 1801–1813. [Google Scholar] [CrossRef]
  15. Zhao, Q.; Sun, C.; Liu, D.D.; Hao, Y.J.; You, C.X. Ectopic expression of the apple Md-miR172e gene alters flowering time and floral organ identity in Arabidopsis. Plant Cell Tissue Organ Cult. 2015, 123, 535–546. [Google Scholar] [CrossRef]
  16. Tang, M.Y.; Bai, X.; Niu, L.J.; Chai, X.; Chen, M.S.; Xu, Z.F. miR172 regulates both vegetative and reproductive development in the perennial woody plant Jatropha curcas. Plant Cell Physiol. 2018, 59, 2549–2563. [Google Scholar] [CrossRef]
  17. Yu, Z.X.; Wang, L.J.; Zhao, B.; Shan, C.M.; Zhang, Y.H.; Chen, D.F.; Chen, X.Y. Progressive regulation of sesquiterpene biosynthesis in Arabidopsis and Patchouli (Pogostemon cablin) by the miR156-targeted SPL transcription factors. Mol. Plant 2015, 8, 98–110. [Google Scholar] [CrossRef] [Green Version]
  18. Chuck, G.; Cigan, A.M.; Saeteurn, K.; Hake, S. The heterochronic maize mutant Corngrass1 results from overexpression of a tandem microRNA. Nat. Genet. 2007, 39, 544–549. [Google Scholar] [CrossRef]
  19. Zhang, X.H.; Zou, Z.; Zhang, J.H.; Zhang, Y.Y.; Han, Q.Q.; Hu, T.X.; Xu, X.G.; Liu, H.; Ye, Z.B. Over-expression of sly-miR156a in tomato results in multiple vegetative and reproductive trait alterations and partial phenocopy of the sft mutant. FEBS Lett. 2011, 585, 435–439. [Google Scholar] [CrossRef] [Green Version]
  20. Zhang, T.Q.; Wang, J.W.; Zhou, C.M. The role of miR156 in developmental transitions in Nicotiana tabacum. Sci. China Life Sci. 2015, 58, 253–260. [Google Scholar] [CrossRef] [Green Version]
  21. Feng, S.J.; Xu, Y.M.; Guo, C.K.; Zheng, J.R.; Zhou, B.Y.; Zhang, Y.T.; Ding, Y.; Zhang, L.; Zhu, Z.J.; Wang, H.S.; et al. Modulation of miR156 to identify traits associated with vegetative phase change in tobacco (Nicotiana tabacum). J. Exp. Bot. 2016, 67, 1493–1504. [Google Scholar] [CrossRef] [PubMed] [Green Version]
  22. Wang, J.W.; Czech, B.; Weigel, D. miR156-regulated SPL transcription factors define an endogenous flowering pathway in Arabidopsis thaliana. Cell 2009, 138, 738–749. [Google Scholar] [CrossRef] [PubMed] [Green Version]
  23. Li, X.Y.; Bian, H.W.; Song, D.F.; Ma, S.Y.; Han, N.N.; Wang, J.H.; Zhu, M.Y. Flowering time control in ornamental gloxinia (Sinningia speciosa) by manipulation of miR159 expression. Ann. Bot. 2013, 111, 791–799. [Google Scholar] [CrossRef] [PubMed] [Green Version]
  24. Zhu, L.; Li, S.S.; Ma, Q.Y.; Wen, J.; Yan, K.Y.; Li, Q.Z. The acer palmatum TCP transcription factor ApTCP2 controls leaf morphogenesis, accelerates senescence, and affects flowering via miR319 in Arabidopsis thaliana. J. Plant Growth Regul. 2022, 41, 244–256. [Google Scholar] [CrossRef]
  25. Han, J.G.; Zhang, T.R.; Li, J.; Hu, Y.H. Identification of miRNA responsive to early flowering in tree peony (Paeonia ostii) by high-throughput sequencing. J. Hortic. Sci. Biotechnol. 2021, 96, 297–310. [Google Scholar] [CrossRef]
  26. Xu, M.Y.; Zhang, L.; Li, W.W.; Hu, X.L.; Wang, M.B.; Fan, Y.L.; Zhang, C.Y.; Wang, L. Stress-induced early flowering is mediated by miR169 in Arabidopsis thaliana. J. Exp. Bot. 2014, 65, 89–101. [Google Scholar] [CrossRef] [Green Version]
  27. Bernardi, Y.; Ponso, M.A.; Belén, F.; Vegetti, A.C.; Dotto, M.C. MicroRNA miR394 regulates flowering time in Arabidopsis thaliana. Plant Cell Rep. 2022, 41, 1375–1388. [Google Scholar] [CrossRef]
  28. Zhang, J.; Gai, M.Z.; Xue, B.Y.; Jia, N.N.; Wang, C.X.; Wang, J.X.; Sun, H.M. The use of miRNAs as reference genes for miRNA expression normalization during Lilium somatic embryogenesis by real-time reverse transcription PCR analysis. Plant Cell Tissue Organ Cult. 2017, 129, 105–118. [Google Scholar] [CrossRef]
  29. Kou, S.J.; Wu, X.M.; Liu, Z.; Liu, Y.L.; Xu, Q.; Guo, W.W. Selection and validation of suitable reference genes for miRNA expression normalization by quantitative RT-PCR in citrus somatic embryogenic and adult tissues. Plant Cell Rep. 2012, 31, 2151–2163. [Google Scholar] [CrossRef]
  30. Tang, F.; Chu, L.W.; Shu, W.B.; He, X.J.; Wang, L.J.; Lu, M.J. Selection and validation of reference genes for quantitative expression analysis of miRNAs and mRNAs in Poplar. Plant Methods 2019, 15, 1–15. [Google Scholar] [CrossRef]
  31. Borowski, J.M.; Galli, V.; da Silva Messias, R.; Perin, E.C.; Buss, J.H.; dos Anjos e Silva, S.D.; Rombaldi, C.V. Selection of candidate reference genes for real-time PCR studies in lettuce under abiotic stresses. Planta 2014, 239, 1187–1200. [Google Scholar] [CrossRef]
  32. Luo, M.; Gao, Z.; Li, H.; Li, Q.; Zhang, C.X.; Xu, W.P.; Song, S.R.; Ma, C.; Wang, S.P. Selection of reference genes for miRNA qRT-PCR under abiotic stress in grapevine. Sci. Rep. 2018, 8, 4444. [Google Scholar] [CrossRef]
  33. Zhang, L.C.; Yang, X.Q.; Yin, Y.Y.; Wang, J.X.; Wang, Y.W. Identification and validation of miRNA reference genes in poplar under pathogen stress. Mol. Biol. Rep. 2021, 48, 3357–3366. [Google Scholar] [CrossRef]
  34. Peltier, H.J.; Latham, G.J. Normalization of microRNA expression levels in quantitative RT-PCR assays: Identification of suitable reference RNA targets in normal and cancerous human solid tissues. Rna 2008, 14, 844–852. [Google Scholar] [CrossRef] [Green Version]
  35. Verstraeten, B.; De Smet, L.; Kyndt, T.; De Meyer, T. Selection of miRNA reference genes for plant defence studies in rice (Oryza sativa). Planta 2019, 250, 2101–2110. [Google Scholar] [CrossRef] [Green Version]
  36. Ferdous, J.; Li, Y.; Reid, N.; Langridge, P.; Shi, B.J.J.; Tricker, P.J. Identification of reference genes for quantitative expression analysis of microRNAs and mRNAs in barley under various stress conditions. PLoS ONE 2015, 10, e0118503. [Google Scholar] [CrossRef] [Green Version]
  37. Machado, R.D.; Christoff, A.P.; Loss-Morais, G.; Margis-Pinheiro, M.; Margis, R.; Körbes, A.P. Comprehensive selection of reference genes for quantitative gene expression analysis during seed development in Brassica napus. Plant Cell Rep. 2015, 34, 1139–1149. [Google Scholar] [CrossRef]
  38. Guo, L.L.; Li, Y.Y.; Zhang, C.J.; Wang, Z.Y.; Carlson, J.E.; Yin, W.L.; Zhang, X.X.; Hou, X.G. Integrated analysis of miRNAome, transcriptome, and degradome reveals miRNA-target modules governing floral florescence, development and senescence across early-and late-flowering phenotypes in Paeonia suffruticosa. Front. Plant Sci. 2022, 13, 1082415. [Google Scholar] [CrossRef]
  39. Lyu, S.H.; Yu, Y.; Xu, S.R.; Cai, W.W.; Chen, G.X.; Chen, J.J.; Pan, D.M.; She, W.Q. Identification of appropriate reference genes for normalizing mirna expression in citrus infected by Xanthomonas citri subsp. citri. Genes 2019, 11, 17. [Google Scholar] [CrossRef] [Green Version]
  40. Silver, N.; Best, S.; Jiang, J.; Thein, S.L. Selection of housekeeping genes for gene expression studies in human reticulocytes using real-time PCR. BMC Mol. Biol. 2006, 7, 1–9. [Google Scholar] [CrossRef] [Green Version]
  41. Vandesompele, J.; De Preter, K.; Pattyn, F.; Poppe, B.; Van Roy, N.; De Paepe, A.; Speleman, F. Accurate normalization of real-time quantitative RT-PCR data by geometric averaging of multiple internal control genes. Genome Biol. 2002, 3, 1–12. [Google Scholar] [CrossRef] [PubMed] [Green Version]
  42. Andersen, C.L.; Jensen, J.L.; Ørntoft, T.F. Normalization of real-time quantitative reverse transcription-PCR data: A model-based variance estimation approach to identify genes suited for normalization, applied to bladder and colon cancer data sets. Cancer Res. 2004, 64, 5245–5250. [Google Scholar] [CrossRef] [PubMed] [Green Version]
  43. Pfaffl, M.W.; Tichopad, A.; Prgomet, C.; Neuvians, T.P. Determination of stable housekeeping genes, differentially regulated target genes and sample integrity: BestKeeper–Excel-based tool using pair-wise correlations. Biotechnol. Lett. 2004, 26, 509–515. [Google Scholar] [CrossRef] [PubMed]
  44. Li, N.; Yang, T.X.; Guo, Z.Y.; Wang, Q.S.; Chai, M.; Wu, M.B.; Li, X.Q.; Li, W.Y.; Li, G.X.; Tang, J.H.; et al. Maize microRNA166 inactivation confers plant development and abiotic stress resistance. Int. J. Mol. Sci. 2020, 21, 9506. [Google Scholar] [CrossRef] [PubMed]
  45. Xue, W.J.; Wang, L.S.; Li, X.Q.; Tang, M.W.; Li, J.Y.; Ding, B.; Kawabata, S.; Li, Y.H.; Zhang, Y. Evaluation of reference genes for quantitative PCR in Eustoma grandiflorum under different experimental conditions. Horticulturae 2022, 8, 164. [Google Scholar] [CrossRef]
  46. Li, F.; Sun, J.H.; Men, J.L.; Li, H.L.; Wang, G.; Wang, S.J.; Wang, J.B. Selection and validation of reference genes for RT-qPCR analysis in the pericarp of Litchi chinensis. Biol. Plant. 2022, 66, 103–111. [Google Scholar] [CrossRef]
  47. Li, Y.Y.; Luo, W.R.; Sun, Y.D.; Chang, H.C.; Ma, K.; Zhao, Z.X.; Lu, L. Identification and expression analysis of miR160 and their target genes in cucumber. Biochem. Genet. 2022, 60, 127–152. [Google Scholar] [CrossRef]
  48. Zhang, X.P.; Shen, J.; Xu, Q.J.; Dong, J.; Song, L.R.; Wang, W.; Shen, F.F. Long noncoding RNA lncRNA354 functions as a competing endogenous RNA of miR160b to regulate ARF genes in response to salt stress in upland cotton. Plant Cell Environ. 2021, 44, 3302–3321. [Google Scholar] [CrossRef]
  49. Shen, X.X.; He, J.Q.; Ping, Y.K.; Guo, J.X.; Hou, N.; Cao, F.G.; Li, X.W.; Geng, D.L.; Wang, S.C.; Chen, P.X.; et al. The positive feedback regulatory loop of miR160-Auxin Response Factor 17-HYPONASTIC LEAVES 1 mediates drought tolerance in apple trees. Plant Physiol. 2022, 188, 1686–1708. [Google Scholar] [CrossRef]
  50. Ni, Z.Y.; Hu, Z.; Jiang, Q.Y.; Zhang, H. Overexpression of gma-MIR394a confers tolerance to drought in transgenic Arabidopsis thaliana. Biochem. Biophys. Res. Commun. 2012, 427, 330–335. [Google Scholar] [CrossRef]
  51. Song, J.B.; Gao, S.; Sun, D.; Li, H.; Shu, X.X.; Yang, Z.M. miR394 and LCR are involved in Arabidopsis salt and drought stress responses in an abscisic acid-dependent manner. BMC Plant Biol. 2013, 13, 1–16. [Google Scholar] [CrossRef] [Green Version]
  52. Song, J.B.; Gao, S.; Wang, Y.; Li, B.W.; Zhang, Y.L.; Yang, Z.M. miR394 and its target gene LCR are involved in cold stress response in Arabidopsis. Plant Gene 2016, 5, 56–64. [Google Scholar] [CrossRef] [Green Version]
  53. Millar, A.A.; Lohe, A.; Wong, G. Biology and function of miR159 in plants. Plants 2019, 8, 255. [Google Scholar] [CrossRef] [Green Version]
  54. Xian, Z.Q.; Huang, W.; Yang, Y.W.; Tang, N.; Zhang, C.; Ren, M.Z.; Li, Z.G. miR168 influences phase transition, leaf epinasty, and fruit development via SlAGO1s in tomato. J. Exp. Bot. 2014, 65, 6655–6666. [Google Scholar] [CrossRef] [Green Version]
  55. Zanca, A.S.; Vicentini, R.; Ortiz-Morea, F.A.; Del Bem, L.E.; da Silva, M.J.; Vincentz, M.; Nogueira, F.T. Identification and expression analysis of microRNAs and targets in the biofuel crop sugarcane. BMC Plant Biol. 2010, 10, 1–13. [Google Scholar] [CrossRef] [Green Version]
  56. Luo, X.N.; Luo, S.; Fu, Y.Q.; Kong, C.; Wang, K.; Sun, D.Y.; Li, M.C.; Yan, Z.G.; Shi, Q.Q.; Zhang, Y.L. Genome-wide identification and comparative profiling of micrornas reveal flavonoid biosynthesis in two contrasting flower color cultivars of tree peony. Front. Plant Sci. 2021, 12, 797799. [Google Scholar] [CrossRef]
  57. Jin, Q.J.; Xue, Z.Y.; Dong, C.L.; Wang, Y.J.; Chu, L.L.; Xu, Y.C. Identification and characterization of microRNAs from tree peony (Paeonia ostii) and their response to copper stress. PLoS ONE 2015, 10, e0117584. [Google Scholar] [CrossRef] [Green Version]
  58. Yin, D.D.; Li, S.S.; Shu, Q.Y.; Gu, Z.Y.; Wu, Q.; Feng, C.Y.; Xu, W.Z.; Wang, L.S. Identification of microRNAs and long non-coding RNAs involved in fatty acid biosynthesis in tree peony seeds. Gene 2018, 666, 72–82. [Google Scholar] [CrossRef]
  59. Zhang, Y.X.; Wang, Y.Y.; Gao, X.K.; Liu, C.Y.; Gai, S.P. Identification and characterization of microRNAs in tree peony during chilling induced dormancy release by high-throughput sequencing. Sci. Rep. 2018, 8, 4537. [Google Scholar] [CrossRef] [Green Version]
  60. Qi, S.; Yang, L.W.; Wen, X.H.; Hong, Y.; Song, X.B.; Zhang, M.M.; Dai, S.L. Reference gene selection for RT-qPCR analysis of flower development in Chrysanthemum morifolium and Chrysanthemum lavandulifolium. Front. Plant Sci. 2016, 7, 287. [Google Scholar] [CrossRef] [Green Version]
  61. Cortés, A.J.; López-Hernández, F. Harnessing crop wild diversity for climate change adaptation. Genes 2021, 12, 783. [Google Scholar] [CrossRef] [PubMed]
  62. Cortés, A.J.; López-Hernández, F.; Blair, M.W. Genome–environment associations, an innovative tool for studying heritable evolutionary adaptation in orphan crops and wild relatives. Front. Genet. 2022, 13, 910386. [Google Scholar] [CrossRef] [PubMed]
Figure 1. Typical features of two tree peony varieties during bud development process (A) and flower development stages (B). FD: Paeonia ostii ‘Feng dan’; LH: Paeonia suffruticosa ‘Lian he’; OB: Overwintering bud; BUS: Budding stage; BSQ: Bud-squaring stage; BST: Bud-sticking stage; BSS: Bud-standing stage; SB: Small-bell stage; BB: Big-bell stage; CP: Circular peach stage; FP: Flat peach stage; CE: Color-exposure stage; BS: Blooming stage; IF: Initial flowering stage; HO: Half opening stage; FB: Full blooming stage; ID: Initial decay stage; DE: Decay stage.
Horticulturae 09 00148 g001
Figure 2. Data analysis flow chart.
Horticulturae 09 00148 g002
Figure 3. Dissolution curve of primers by qRT-PCR.
Horticulturae 09 00148 g003
Figure 4. Amplification efficiency curves.
Horticulturae 09 00148 g004
Figure 5. Cycle threshold (Ct) variation of candidate reference miRNAs. The box–whisker plot represents the Ct changes in buds, flower development stages, tissues of Paeonia ostii ‘Feng dan’ (A,C,E), and Paeonia suffruticosa ‘Lian he’ (B,D,F).
Horticulturae 09 00148 g005
Figure 6. Expression stability analysis and pairwise variation (Vn/Vn+1) analysis of candidate reference miRNAs in bud development process calculated by geNorm. Expression stability results are shown in (A) (Paeonia ostii ‘Feng dan’) and (B) (Paeonia suffruticosa ‘Lian he’) of Figure 6. The most stable miRNA is shown on the left and the least stable miRNA is shown on the right. The red ‘■’ represents suitable miRNAs. The results of pairwise variation analysis are shown in (C). The red ‘*’ represents a suitable quantity.
Horticulturae 09 00148 g006
Figure 7. Expression stability analysis and pairwise variation (Vn/Vn+1) analysis of candidate reference miRNAs in flower development stage calculated by geNorm. Expression stability results are shown in (A) (Paeonia ostii ‘Feng dan’) and (B) (Paeonia suffruticosa ‘Lian he’) of Figure 7. The most stable miRNA is shown on the left and the least stable miRNA is shown on the right. The red ‘■’ represents suitable miRNAs. The results of pairwise variation analysis are shown in (C). The red ‘*’ represents suitable quantity.
Horticulturae 09 00148 g007
Figure 8. Expression stability analysis and pairwise variation (Vn/Vn+1) analysis of candidate reference miRNAs in different tissues calculated by geNorm. Expression stability results are shown in (A) (Paeonia ostii ‘Feng dan’) and (B) (Paeonia suffruticosa ‘Lian he’) of Figure 8. The most stable miRNA is shown on the left and the least stable miRNA is shown on the right. The red ‘■’ represents suitable miRNAs. The results of pairwise variation analysis are shown in (C). The red ‘*’ represents a suitable quantity.
Horticulturae 09 00148 g008
Figure 9. Performance evaluation of miR319 (A,C) and miR166 (B,D) expression standardization during the bud development process using reference miRNAs. OB: Overwintering bud; BUS: Budding stage; BSQ: Bud-squaring stage; BST: Bud-sticking stage; BSS: Bud-standing stage; SB: Small-bell stage; BB: Big-bell stage; CP: Circular peach stage; FP: Flat peach stage. The legend represents the internal reference used in calculating the relative expression amount. Different lowercase letters represent significant differences (p < 0.05). Error bars are standard error of mean (SEM).
Horticulturae 09 00148 g009
Figure 10. Performance evaluation of miR319 (A,C) and miR166 (B,D) expression standardization in flower development stage using reference miRNAs. CE: Color-exposure stage; BS: Blooming stage; IF: Initial flowering stage; HO: Half opening stage; FB: Full blooming stage; ID: Initial decay stage; DE: Decay stage. The legend represents the internal reference used in calculating relative expression amount. Different lowercase letters represent significant differences (p < 0.05). Error bars are standard error of mean (SEM).
Horticulturae 09 00148 g010
Figure 11. Performance evaluation of miR319 (A,C) and miR166 (B,D) expression standardization during different tissues using reference miRNAs. The legend represents the internal reference used in calculating the relative expression amount. Different lowercase letters represent significant differences (p < 0.05). Error bars are standard error of mean (SEM).
Horticulturae 09 00148 g011
Table 1. Sequences and forward primer sequences of candidate reference miRNAs for qRT-PCR.
miRNA NamemiRNA Mature SequenceForward Primer (5′-3′)
PC-3p-1770AGGTACTCCGTTCTCTCTCGTTGCAGGTAGTCCGTTCTCTCTCG
PC-5p-74547AAAGTCGGATCGCCAGCAACATCAGTCGGCTCGCCAGCAACAT
gma-miR394a-5pTTGGCATTCTGTCCACCTCCCCGCTTGGCATTCTGTCCACCTCC
PC-5p-4TTAATCAAGGGAATAGGGGCGCAGCTTAATCAAGGGAATAGGGGCG
PC-3p-25825CGATTCTTCCACCCGGTCGGAGCCATTCTTCCACCCGGTCG
mtr-miR171e-3pTGATTGAGCCGCGCCAGTATCCCGTGATTGAGCCGCGCCAGTAT
mtr-MIR160b-p3TATGAGGAGCCAAGCATATTGGGCCGTATGAGGAGCCAAGCATATT
PC-3p-871TTCCCTGTTCTGGAGATCTATGCGGCGTTCCCTGTTCTGGAGATCTAT
mtr-miR168bTCGCTTGGTGCAGGTCGGGAATCGCTTGGTGCAGGTCGGGAA
PC-3p-70893TTCAACCCAACTTCGTCTCTTGCGGCGTTCAACCCAACTTCGTCTCTT
mtr-miR159aTTTGGATTGAAGGGAGCTCTACCGCCGTTTGGATTGAAGGGAGC
mtr-miR166aTCGGACCAGGCTTCATTCCCCCCGTCGGACCAGGCTTCATTCCC
rco-miR167aTGAAGCTGCCAGCATGATCTATCCGAACGCCAGCATGATCTA
PC-5p-55716CTATAGTCATCATCTGCCACAGGCCGCCCTATAGTCATCATCTGCCACA
mtr-miR159a_L-1TTGGATTGAAGGGAGCTCAACGCCGTTGGATTGAAGGGAGC
mtr-miR159a_1ss9GTTTTGGATTTAAGGGAGCTCTATGGTCGTGTTTGGATTTAAGGGAGC
PC-5p-19095AAAAGTCGGATCGCCAGCAACATCCGCAAAAGTCGGATCGCCAGCAACATC
cpa-MIR319-p3_1ss20GTCTGCCATCTCATGCATAAGTGTCCTGCTGCCATCTCATGCAT
mtr-miR166g-5pGGAATGTTGTCTGGCTCGAGGCGGTGGGAATGTTGTCTGGCT
Table 2. Ranking of the candidate reference miRNAs calculated by RefFinder.
RankingBud of ‘Feng dan’Bud of ‘Lian he’Flower of ‘Feng dan’Flower of ‘Lian he’Tissue of ‘Feng dan’Tissue of ‘Lian he’
1mtr-MIR160b-p3PC-5p-19095mtr-miR159amtr-miR159aPC-3p-871PC-5p-4
2gma-miR394a-5pgma-miR394a-5pgma-miR394a-5prco-miR167aPC-5p-4mtr-miR168b
3PC-3p-70893mtr-MIR160b-p3PC-5p-19095mtr-miR159a_1ss9GTmtr-miR171e-3pPC-5p-55716
4mtr-miR171e-3pmtr-miR166amtr-MIR160b-p3mtr-miR171e-3pgma-miR394a-5pPC-3p-871
5PC-5p-19095mtr-miR168bPC-5p-4PC-5p-4PC-3p-1770mtr-miR159a
6PC-3p-871mtr-miR171e-3pmtr-miR168bPC-5p-19095PC-5p-74547PC-3p-25825
7mtr-miR166aPC-3p-70893PC-3p-871U6mtr-MIR160b-p3mtr-miR171e-3p
8mtr-miR168bPC-3p-871mtr-miR166aPC-3p-871PC-5p-19095mtr-miR159a_L-1
9PC-5p-74547mtr-miR159a_1ss9GTPC-3p-25825PC-3p-70893PC-5p-55716PC-5p-19095
10PC-3p-1770rco-miR167aPC-5p-74547PC-3p-1770U6gma-miR394a-5p
11PC-3p-25825mtr-miR159amtr-miR159a_L-1mtr-MIR160b-p3mtr-miR168bPC-3p-70893
12U6mtr-miR159a_L-1mtr-miR159a_1ss9GTmtr-miR168bmtr-miR166amtr-MIR160b-p3
13PC-5p-4PC-5p-74547U6gma-miR394a-5pPC-3p-25825mtr-miR166a
14PC-5p-55716PC-5p-4PC-3p-1770mtr-miR159a_L-1PC-3p-70893PC-3p-1770
15mtr-miR159a_1ss9GTPC-5p-55716mtr-miR171e-3pPC-5p-55716rco-miR167amtr-miR159a_1ss9GT
16mtr-miR159aPC-3p-25825rco-miR167aPC-3p-25825mtr-miR159a_L-1U6
17rco-miR167aPC-3p-1770PC-3p-70893mtr-miR166amtr-miR159a_1ss9GTrco-miR167a
18mtr-miR159a_L-1U6PC-5p-55716PC-5p-74547mtr-miR159aPC-5p-74547
Disclaimer/Publisher’s Note: The statements, opinions and data contained in all publications are solely those of the individual author(s) and contributor(s) and not of MDPI and/or the editor(s). MDPI and/or the editor(s) disclaim responsibility for any injury to people or property resulting from any ideas, methods, instructions or products referred to in the content.

