Abstract
Radish is a root vegetable crop, and many F1 cultivars have been developed by exploiting heterosis. Considerable time and resources are required to test the performance and combining ability of F1 cultivars and parental lines; therefore, economical methods to identify them are needed before field tests. This study was conducted to determine the minimum number of markers needed to identify cultivars and elite lines. PCR-based markers were applied to radish cultivars and elite lines and selected based on chromosomal location, polymorphic information content, and allele frequency. The power of selected marker sets to detect genetically similar cultivars or elite lines was confirmed using cultivars with high genetic similarity and elite lines with the same parents. Eleven markers successfully identified not only all 105 radish cultivars tested but also cultivars with high genetic similarity reported in previous studies. Fourteen markers, including the nine among 11 markers for cultivar identification, also successfully distinguished all 115 elite lines tested, including ones with the same parents and separated at F2–F6 generations. The markers developed for the identification of radish cultivars and elite lines require only 11 and 14 markers, respectively, and simple PCR and gel electrophoresis instruments. This method is very simple and can be easily applied to other crops.
1. Introduction
The radish (Raphanus sativus L., 2n = 18) plant is a biennial herbaceous vegetable crop in the Brassicaceae family and believed to be domesticated in the Eastern Mediterranean and Western Asia [1]. Radish is grown throughout the world, and many cultivars have been developed for better adaptability in different climates and growing seasons [2] as well as for the purpose of use. For example, there are many cultivars in Korea adapted to different growing seasons and regions [3], and developed for early harvesting (Yeolmu), dried leaves (Siraegi) and long roots for pickling (Danmuji) [4].
Cultivar identification is one of the important aspects of plant variety protection (PVP) systems. One hundred sixty-eight and 1839 radish cultivars are under PVP and registered in Korea, respectively [5]. The large number of cultivars made it challenging to identify cultivars solely based on their morphological characteristics. In addition, many parental lines have been used for developing cultivars, whose performance and combining ability have to be tested in the field, requiring considerable time and resources. Therefore, efficient and economic methods are necessary to identify cultivars and eliminate genetically similar or identical lines before morphological observation in the field.
Molecular markers to identify cultivars and elite lines should be inexpensive and easy to use, with high reproducibility [6]. Especially, the cost for genotyping can be the most important consideration for small seed companies and independent breeders. In radish, various marker systems were developed such as amplified fragment length polymorphism (AFLP) [6,7,8], random amplified polymorphic DNA (RAPD) [9,10], inter-simple sequence repeat (ISSR) [10], and simple sequence repeats (SSR) [11,12,13]. However, AFLP requires a time-consuming process [14], RAPD suffers from low reproducibility between laboratories [15,16], and ISSR reveals relatively low polymorphism [17]. SNPs and SSRs can be the methods of choice, but they require expensive equipment for genotyping. Besides, recently developed SSR systems could not distinguish cultivars perfectly [11] and often required a large number of markers [12,13].
For developing economic and efficient methods to identify cultivars and elite lines, it is necessary to develop the minimum number of markers, requiring no expensive genotyping methods. PCR-based markers with conventional gel electrophoresis may be the economic method of choice for small companies or independent breeders due to its simple process and no requirement of expensive equipment. In addition, most marker systems for radish cultivar identification were not developed using the information on genomic locations of markers, with few exceptions [13,18]. It is necessary to develop markers that (1) are evenly distributed in the genome using the genomic information to accurately identify radish cultivars and elite lines, and (2) require the minimum number of markers and no expensive equipment for efficient genotyping.
Here, we report an economic and efficient marker system to identify radish cultivars and elite lines with the minimum number of markers and simple processes. The marker sets require only 11 and 14 primer pairs (nine pairs in common) for identifying cultivars and elite lines, respectively, and no expensive equipment for genotyping, making them appropriate for small seed companies and independent breeders who have limited facilities for genotyping.
2. Materials and Methods
2.1. Pre-Selection of Molecular Markers Showing Polymorphism among Radish Cultivars
2.1.1. Plant Materials and DNA Preparation
Twelve radish cultivars, comprised of three spring, summer, autumn, and winter cultivars, respectively, were used for initial polymorphism detection: ‘Sincheongilpum’,‘Sambakja’ (Farm Hannong, Seoul, Republic of Korea), and ‘Cheongilchun’ (Asia Seed, Seoul, Republic of Korea) for spring, ‘Kwandongyeorum’ (Farm Hannong, Seoul, Republic of Korea), ‘Mansahyeongtong’ (Nongwoo Bio, Suwon, Republic of Korea), and ‘Manchudaepung’ (Kwonnong Seed, Cheongju, Republic of Korea) for summer, ‘Cheongun’ (Farm Hannong, Seoul, Republic of Korea), ‘Seohogold’ (Nongwoo Bio, Suwon, Republic of Korea), and ‘Chamjoeun’ (Syngenta Korea, Seoul, Republic of Korea) for autumn, and ‘Cheongjeonggowon’, ‘Nongwoo Osari’ (Nongwoo Bio, Suwon, Republic of Korea), and ‘Gyeouldaechan’ (Farm Hannong, Seoul, Republic of Korea) for winter cultivars. To extract DNA, the seeds were sown in plug cell trays in a greenhouse, and after three weeks, leaves about 4 cm in length were used for DNA extraction by the modified CTAB DNA extraction method [19]. DNA quantity and quality were determined using a UV spectrometer (DS-11, DeNOVIX, Wilmington, DE, USA).
2.1.2. Amplification of Genome-Anchored Markers
The 36 markers from Kang et al. [18] were applied to 12 radish cultivars. PCR was performed with a 20 μL reaction volume containing 20 ng of genomic DNA, 0.5 μM of forward and reverse primers, and 5.0 μL of AccuPower® Taq PCR PreMix (K–2601, Bioneer, Daejeon, Republic of Korea). PCR conditions were an initial denaturation at 95 °C for 5 min, 35 cycles at 95 °C, 53–56 °C, and 72 °C for 30 s, and a final extension at 72 °C for 5 min. The amplicons were separated on 1.5% agarose gels in 0.5× TBE buffer and visualized using Loading Star (Dyne Bio, Seong-Nam, Republic of Korea).
2.1.3. Cluster Analysis
Markers showing polymorphisms among cultivars were subjected to cluster and principal coordinate analyses (PCoA) to evaluate the genetic relationships among 12 radish cultivars. A binary matrix from coding 1 or 0 for the presence or absence of amplicons, respectively, was used to generate a distance matrix using Jaccard’s similarity coefficient [20]. The dendrogram was generated by the unweighted pair-group method using the arithmetic average (UPGMA) protocol from the software package NTSYS-pc version 2.21p [21]. PCoA using DCENTER and EIGEN procedures in NTSYS-pc was applied to visualize the genetic similarity among the radish cultivars [21].
2.2. The Development of a Minimum Number of Markers for Identifying Cultivars and Elite Lines
2.2.1. Plant Material, DNA Preparation and Genotyping
A total of 105 radish cultivars (Table S1) and 115 elite lines (Table S2) were used for selecting the minimum number of markers to identify cultivars and elite lines, respectively. The methods for genotyping and cluster analysis were previously described in Section 2.1.2 and Section 2.1.3, respectively.
2.2.2. Phenotype Observation of Elite Lines
The phenotypic variations of elite lines were investigated according to the definition of the radish test guideline prescribed by the Korea Seed & Variety Service (http://www.seed.go.kr (accessed on 1 May 2020) in the experimental plot of Farm Hannong Breeding Research Institute, Anseong, Korea (37°04′75″ N, 127°19′95″ E) for two years. Root shapes were investigated and classified based on 12 categories: narrow triangular, medium triangular, ovate, acicular, oblong, narrow elliptic, medium elliptic, circular, medium oblate, narrow oblate, obovate, and bell shaped.
2.2.3. Selection of the Minimum Number of Markers
First, 21 markers (Table S3) showing polymorphism among 12 cultivars were applied to 105 cultivars and 115 elite lines. Second, the informativeness of markers was calculated by the polymorphic information content (PIC) using the following equation:
where n is the sum of the number of different alleles at a locus and Pi is the frequency of the ith allele [22]. Third, nine markers showing the highest PIC values or having the highest number of alleles (in the case of chromosome 1) in each chromosome were initially chosen, and an UPGMA dendrogram was generated separately using 105 cultivars and 115 elite lines with two kimchi cabbage cultivars as outgroups. Fourth, the remaining markers with the highest PIC values were added one by one until all 105 cultivars and 115 elite lines were distinguished in the UPGMA dendrogram. If the markers had PIC values less than zero but high allele frequencies, they were included. The population structure of the cultivars was investigated using the STRUCTURE program (Pritchard Lab, Stanford University, Stanford, CA, USA), and the best K value was calculated using STRUCTURE HARVESTER [23].
2.2.4. Testing the Identification Capability of Markers for Cultivars and Elite Lines
For testing the identification capability of the cultivar identification markers, they were applied to radish cultivar pairs having high genetic similarity in previous studies [6,11,13]. The names of cultivars, genetic similarity, and references are presented in Table S4). For testing the identification capability of the markers for elite lines, genetic relationships were investigated among elite lines that had the same parental lines and diverged after the F2 (S2), F4, F5, and F6 generations (Table S5). In addition, their root morphologies were also compared in the field.
3. Results
3.1. Pre-Selection of Markers Showing Polymorphism among Radish Cultivars
Of the 36 markers developed by Kang et al. [18], 21 markers showed polymorphism among 12 radish cultivars, which were distributed in all nine chromosomes and consisted of 12 InDel, 6 IBPs, and 3 SSRs (Table S3). They produced a total of 42 amplicons, ranging from one to four per marker (two amplicons per marker, on average) (Table S3). Cluster analysis of 12 cultivars using the 21 markers clearly identified the autumn cultivars as a separate cluster (cluster I) from the other cultivars (Figure 1a). In cluster II, three spring cultivars were clearly distinguished from other summer and winter cultivars, and the latter two cultivar types were not separated from each other (Figure 1a). The PCoA plot showed a similar result to cluster analysis, showing two separate groups of autumn and spring cultivars and a group with both summer and winter cultivars, which was located between the autumn and spring cultivar groups (Figure 1b). The three axes accounted for 87.65% (eigen values) of the genetic similarities observed (Figure 1b).
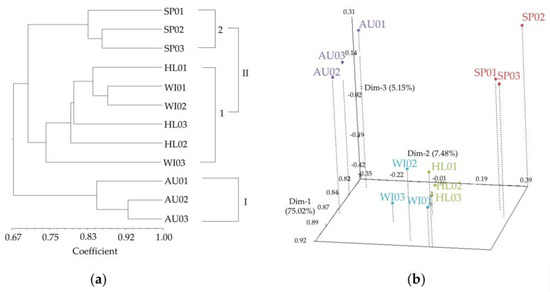
Figure 1.
A UPGMA dendrogram (a) and principal coordinate analysis plot (b) based on 12 radish cultivars using 21 molecular markers. Red, green, purple, and blue dots represent spring, summer (highland), autumn and winter cultivars, respectively. SP01: Sincheongilpum; SP02: Sambakja; SP03: Cheongilchun; HL01: Kwandongyeorum, HL02: Manchudaepung; HL03: Mansahyeongtong; AU01: Cheongun; AU02: Seohogold; AU03: Chamjoeun; WI01: Cheongjeonggowon; WI02: Nongwoo Osari; WI03: Gyeouldaechan.
3.2. The Development of the Minimum Number of Markers for Cultivar Identification
Eleven markers were selected for radish cultivar identification (Table 1), and the polymorphisms of their amplicons were detected visually by agarose gel electrophoresis (Supplementary Figure S1). All markers produced two amplicons, except for RSIBP 15, which produced three amplicons, and at least one marker was located on a chromosome (Table 1). Allele frequencies of the markers were relatively higher; at least one allele per locus had more than 0.648 allele frequency, except for RsInD79 (Table 1). PIC values for markers ranged from 0.05 to 0.75, and two markers showed PIC values less than zero (Table 1).

Table 1.
Information on 11 markers used for cultivar identification using 105 cultivars in radish.
All 105 radish cultivars were clearly distinguished by the 11 markers (Figure 2). The genetic similarity between the genetically closest cultivars was about 0.914. The two outgroups were clearly separated, and radish cultivars were divided into many clusters and sub-clusters (Figure 2). However, there were only two groups (K = 2) based on population structure, showing a significantly different pattern compared to the UPGMA dendrogram (Figure 2).
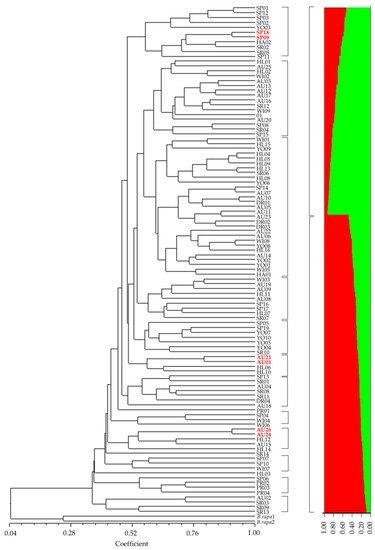
Figure 2.
A dendrogram constructed with UPGMA clustering method (left) and population structure (right) of 105 radish cultivars using 11 molecular markers. Numbers correspond to the list of cultivars in Table S1.
Various pairs of radish cultivars with high genetic similarity in previous research (Table S4) were tested with 11 markers to confirm their cultivar identification capability. All pairs of genetically similar cultivars were successfully distinguished by at least one marker (Figure 2 and Figure 3). For example, ‘Pyungganggimjang’ vs. ‘Chongjinju’ and ‘Baekja’ vs. ‘Ocbong’ were distinguished by RsIBP13 (Figure 3a,b). ‘Baekja’ vs. ‘Chongil’ were identified by RsSSR100 (Figure 3c), and ‘Togwanggold’ (AU26) vs. ‘Supertogwang’ (AU24) were identified by RsInD25 (Figure 2 and Figure 3d). ‘YR Sinchyongjanggun’ (SP18) vs. ‘Junmuhumu’ (SP09) and ‘Cheongun’ (AU01) vs. ‘Seoho’ (AU21) were distinguished by RsInD22 (Figure 2 and Figure 3e) and RsSSR100 (Figure 2 and Figure 3f), respectively.
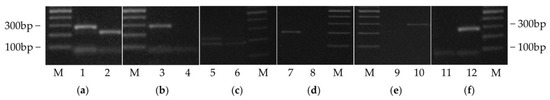
Figure 3.
Examples of molecular markers that can successfully discriminate genetically similar cultivars reported in previous studies (Choe et al., 2002; Bae et al., 2015; Lee and Park, 2017). (a,b) RsIBP13; (c) RsSSR100; (d) RsInD25; (e) RsInD22; (f) RsSSR100; 1: Pyungganggimjang; 2: Chongjinju; 3: Baekja; 4: Ocbong; 5: Baekja; 6: Chongil; 7: Togwanggold; 8: Supertogwang; 9: YR Sinchyongjanggun; 10: Junmuhumu; 11: Cheongun; 12: Seoho. M: 100 bp ladder.
3.3. The Development of the Minimum Number of Markers for Cultivar Identification
Fourteen markers were selected for identifying elite lines (Table 2), and the amplicons can also be detected by simple PCR followed by agarose gel electrophoresis (Figure S2). All markers produced two amplicons with the exception of RsIBP15; allele frequencies and PIC values ranged from 0.104 to 0.861 and from 0.00 to 0.89, respectively (Table 2). Three markers were located on chromosome nine, two on chromosomes 2, 7, and 8, and a marker on the rest of the chromosomes (Table 2). The 14 markers included nine markers among the 11 markers for cultivar identification, except for RsIBP13 and RsSSR100.
Table 2.
Information on 14 molecular markers for elite line identification using 115 radish elite lines with diverse genetic background.
The markers can identify all 115 elite lines tested (Figure 4), which have diverse genetic backgrounds (Table S2). They also clearly identified genetically similar elite lines that diverged from the same parental lines after the F2 (S2), F4, and F5–6 generations (Table S5 and Figure 4 in blue, green, and red letters, respectively). Elite lines diverged after the F2 (S2) and F4 generations, which tended to show a more distant genetic relationship compared to those after the F5–6 generations (Figure 4). The elite lines were clearly divided into six sub-clusters, which corresponded to six groups (K = 6) from the population structure (Figure 4). The proportions of elite lines in six matching groups ranged from 46.7% to 83.3% between the UPGMA dendrogram and population structure (Figure 4). Five root shapes among 12 categories were observed in the field investigation, such as acicular, oblong, narrow elliptic, medium elliptic, and obovate (Figure 4 and Figure 5).
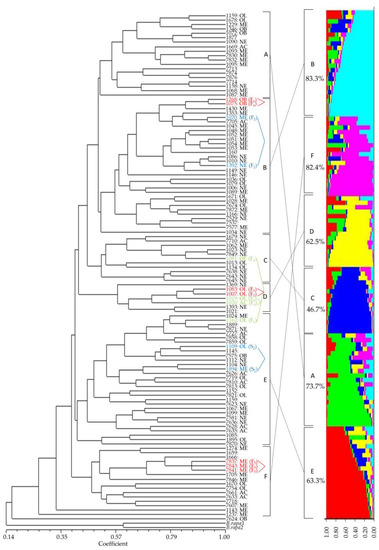
Figure 4.
A dendrogram constructed with UPGMA clustering method (left) and population structure (right) among 115 radish elite lines using 14 molecular markers. AC: acicular, NE: narrow elliptic, ME: medium elliptic, OB: obovate, and OL: oblong. Elite lines without root shape information were not provided by Farm Hannong.
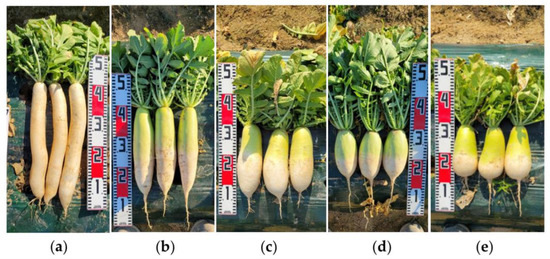
Figure 5.
Examples of the root shapes of elite lines. (a) acicular; (b) oblong; (c) narrow elliptic; (d) medium elliptic; (e) obovate. The rulers on the left or right in the figures were 50 cm long.
4. Discussion
To date, many marker systems have been used for the identification of germplasm, cultivars, and breeding lines in radish, but none of these marker systems have been developed considering their efficiency and economic aspect for genotyping. The 36 markers from Kang et al. [18], which were selected from a high-density genetic map [24] and evenly distributed in all radish chromosomes, successfully classified worldwide radish accessions. In addition, their polymorphism can be easily detected by simple PCR and gel electrophoresis [18]. Therefore, the markers could be a good foundation for developing an economic and efficient marker system for the identification of radish cultivars and breeding lines. We provided in this study how to select markers for radish cultivar and elite line identification, which is very simple and can be easily applied to other crops.
The 21 markers (Table S3) selected based on polymorphism among 12 cultivars can be used to infer genetic relationships among radish cultivars and breeding lines. Cluster analysis using 21 markers clearly separated autumn cultivars from other cultivars (Figure 1), the former of which do not require late-bolting characteristics. Spring cultivars were separated from summer and winter cultivars; the latter two were not clearly separated from each other (Figure 1). These are consistent with the development history of Korean radish cultivars. Autumn and spring cultivars had different origins, and summer cultivars were derived from spring cultivars [25]. Later, some of the summer cultivars were used for winter cultivation, and summer and winter cultivars still often share parental lines [25].
Eleven markers were selected and successfully identified all 105 cultivars tested (Figure 2). Besides, they also successfully distinguished nearly identical cultivars (Figure 3), as reported by studies using AFLP [6] and SSR [11,13]. Interestingly, ‘Togwanggold’ and ‘Supertogwang’, which were not distinguished in a previous study using 27 SSRs [11], were successfully identified in this study (Figure 3d). This confirms the capability of the 11 markers for cultivar identification in radish.
Fourteen markers also successfully identified 115 radish elite lines (Figure 4) that have diverse genetic backgrounds (Table S2). The identification capability of the markers for radish elite lines was also successfully tested with elite lines having the same parental lines but diverging at F2 through F6 generations (Table 2 and Figure 4) and their root morphology (Figure 4 and Figure 5). These results suggest the possible application of these markers to identify and eliminate genetically similar breeding lines before sowing their seeds for field investigation. These markers also have the possibility of being used for inferring genetic relationships among breeding lines since two different clustering methods showed similar results (Figure 4).
The markers for identifying cultivars and elite lines require only 11 and 14 markers, respectively, and, therefore, it is possible to significantly reduce the time and cost for genotyping compared to recently adopted SSR markers for radish cultivar identification, which require 27 [11], 50 [12], and 60 SSRs [13]. In addition, these markers can be used in QTL studies such as root shapes [26] and cracking [27], seed production [28], and glucosinolates [29,30] since they are genome-anchored markers. The suggested method in this study requires simple PCR and gel electrophoresis to detect polymorphism and does not need expensive equipment for genotyping. Therefore, genotyping is simple and reliable, which is more efficient than AFLP [6,8,10,31] and RAPD [9,10] systems, which suffer from a time-consuming process [14] and low reproducibility [15,16], respectively.
5. Conclusions
The markers developed in this study can be efficiently and economically applied for identifying radish cultivars and breeding lines, since only 11 and 14 markers, respectively, as well as simple PCR and gel electrophoresis are required for genotyping. Therefore, these markers can be used not only in large seed companies but also in small seed companies and laboratories, with relatively shorter time frames and lower costs. The method to develop the markers is so simple that it can be applied to other crops. In addition, the 21 markers selected based on polymorphism among cultivars can be used for genetic relationship and diversity studies for radish cultivars and breeding lines.
Supplementary Materials
The following supporting information can be downloaded at: https://www.mdpi.com/article/10.3390/horticulturae9020140/s1, Figure S1: Examples of polymorphism from genotyping 24 radish cultivars using RsIBP15 (a); RsIBP13 (b); RsSSR104 (c); RsIBnD79 (d) and RsSSR108 (e) markers; Figure S2: Examples of polymorphism from genotyping 24 radish elite lines using RsInD38 (a); RsInD37 (b); RsSSR108 (c) and BrEST03 (d) markers; Table S1: The list of radish cultivars used in this study; Table S2: The list of radish elite lines used in this study; Table S3: Information on 21 molecular markers showing polymorphism among 12 radish cultivars; Table S4: The pairs of genetically similar radish cultivars identified in previous studies; Table S5: The pairs of genetically similar radish cultivars identified in previous studies.
Author Contributions
Project administration, W.C. and J.L.; investigation and formal analysis, H.H.; methodology and writing—original draft, W.C. and H.H.; writing—review and editing. All authors. All authors have read and agreed to the published version of the manuscript.
Funding
This study was funded by a grant (Project No: PJ01504301 “Development of customized breeding lines through the establishment of radish and kimchi cabbage germplasm evaluation system and core collections”) from National Institute of Horticultural and Herbal Science, Rural Development Administration.
Institutional Review Board Statement
Not applicable.
Informed Consent Statement
Not applicable.
Data Availability Statement
The datasets presented in this study are available upon request to the corresponding author.
Acknowledgments
We would like to thank Farm Hannong Breeding Research Institute for providing leaf samples and field data of their valuable elite lines.
Conflicts of Interest
The authors declare no conflict of interest.
References
- Bonnema, G.; Del Carpio, D.P.; Zhao, J. Diversity analysis and molecular taxonomy of Brassica vegetable crops. In Genetics, Genomics and Breeding of Vegetable Brassicas; Sadowski, J., Kole, C., Eds.; Science Publishers: New York, NY, USA, 2011; pp. 81–124. [Google Scholar]
- Singh, B.K. Radish (Raphanus sativus L.): Breeding for Higher Yield, Better Quality and Wider Adaptability. In Advances in Plant Breeding Strategies: Vegetable Crops; Springer: Berlin/Heidelberg, Germany, 2021; Volume 8, pp. 275–304. [Google Scholar]
- Lee, J.; Kang, N.; Kim, B.; Kim, B.; Kim, S.; Kim, I.; Kim, J.; Kim, C.; Kim, H.; No, J. Horticulture Science; Hyangmoonsa: Seoul, Republic of Korea, 2013; p. 213. (In Korean) [Google Scholar]
- Cho, Y.; Yoo, G.; Sung, J.; Chun, B.; Nam, S.; Kim, H.; Rhee, W. Competitive technique and management in radish and Chinese cabbage. Farmer’s Newsp. 1995, 30, 184–192. (In Korean) [Google Scholar]
- Korea Seed and Variety Service. Status of Cultivar Protection Applications and Registrations. 2022. Available online: http://www.seed.go.kr (accessed on 15 July 2022).
- Choe, Y.; Park, D.; Shin, H.; Kwon, Y.; Yoon, W.; Moon, J. Studies for similarity evaluation of radish and Chinese cabbage cultivars. Hortic. Sci. Technol. 2002, 20, 160–167. (In Korean) [Google Scholar]
- Huh, M.; Ohnishi, O. Genetic diversity and genetic relationships of East Asian natural populations of wild radish revealed by AFLP. Breed. Sci. 2002, 52, 79–88. [Google Scholar] [CrossRef]
- Kwon, Y.; Prak, D.; Song, I.; Yi, S.; Yoon, W.; Moon, J. AFLP analysis for cultivar discrimination in radish and chinese cabbage. Kor. J. Breed. Sci. 2003, 35, 319–328. (In Korean) [Google Scholar]
- Choi, W.; Lee, S.; Yoo, S.; Lee, S.; Kang, S.; Ko, H. Genetic relationship by RAPD analysis of korean wild radish and local cultivars in radish. Hortic. Sci. Technol. 2008, 26, 427–431. (In Korean) [Google Scholar]
- Liu, L.W.; Zhao, L.P.; Gong, Y.Q.; Wang, M.X.; Chen, L.M.; Yang, J.L.; Wang, Y.; Yu, F.M.; Wang, L.Z. DNA fingerprinting and genetic diversity analysis of late–bolting radish cultivars with RAPD, ISSR and SRAP markers. Sci. Hortic. 2008, 116, 240–247. [Google Scholar] [CrossRef]
- Bae, K.; Sim, S.; Hong, J.; Choi, K.; Kim, D.; Kwon, Y. Development of genomic SSR markers and genetic diversity analysis in cultivated radish (Raphanus sativus L.). Hortic. Environ. Biotechnol. 2015, 56, 216–224. [Google Scholar] [CrossRef]
- Wang, Q.; Zhang, L.; Zheng, P. Genetic diversity and evolutionary relationship analyses within and among Raphanus species using EST-SSR markers. Mol. Plant Breed. 2015, 35, 62–73. [Google Scholar] [CrossRef]
- Lee, O.; Park, H. Assessment of genetic diversity in cultivated radishes (Raphanus sativus) by agronomic traits and SSR markers. Sci. Hortic. 2017, 223, 19–30. [Google Scholar] [CrossRef]
- Vos, P.; Hogers, R.; Bleeker, M.; Raijans, M.; Lee, T.; Hornes, M.; Frijters, A.; Pot, J.; Peleman, J.; Kuiper, M.; et al. AFLP: A new technique for DNA fingerprinting. Nucleic Acids Res. 1995, 23, 4407–4414. [Google Scholar] [CrossRef]
- Jones, C.; Edwards, K.; Castaglione, S.; Winfield, M.; Sala, F.; Van, D.C.; Bredemeijer, G.; Vosman, B.; Matthes, M.; Daly, A.; et al. Reproducibility testing of RAPD, AFLP and SSR markers in plants by a network of European laboratories. Mol. Plant Breed. 1997, 3, 381–390. [Google Scholar] [CrossRef]
- Perez, T.; Albornoz, J.; Dominguez, A. An evaluation of RAPD fragment reproducibility and nature. Mol. Ecol. 1998, 7, 1347–1357. [Google Scholar] [CrossRef] [PubMed]
- Nguyen, H.T.; Wu, X. Molecular marker systems for genetic mapping. In The Handbook of Plant Genome Mapping; Meksem, K., Kahl, G., Eds.; Wiley–Blackwell: Weinheim, Germany, 2005; pp. 23–50. [Google Scholar]
- Kang, E.; Ha, S.; Ko, H.; Yu, H.; Chae, W. Reproductive traits and molecular evidence related to the global distribution of cultivated radish (Raphanus sativus L.). Plant Syst. Evol. 2016, 302, 1367–1380. [Google Scholar] [CrossRef]
- Doyle, J.J.; Doyle, J.L. Isolation of plant DNA from fresh tissue. Focus 1990, 12, 13–15. [Google Scholar]
- Jaccard, P. Nouvelles recherches sur la distribution florale. Bull. Soc. Vaud. Sci. Nat. 1908, 44, 223–270. [Google Scholar]
- Rohlf, F.J. NTSYS–pc: Numerical Taxonomy and Multivariate Analysis System; Version 2.1; Applied Biostatistics Inc.: New York, NY, USA, 2000. [Google Scholar]
- Anderson, J.A.; Churchill, G.A.; Autrique, H.E.; Tanksley, S.D.; Sorrells, M.E. Optimizingparental selection for genetic linkage maps. Genome 1993, 36, 181–186. [Google Scholar] [CrossRef]
- Earl, D.A.; von Holt, B.M. STRUCTURE HARVESTER: A website and program for visualizing STRUCTURE output and implementing the Evanno method. Conserv. Genet. Resour. 2012, 4, 359–361. [Google Scholar] [CrossRef]
- Mun, J.; Chung, H.; Chung, W.; Oh, M.; Jeong, Y.; Kim, N.; Ahn, B.; Park, B.; Park, S.; Lim, B.; et al. Construction of a reference genetic map of Raphanus sativus based on genotyping by whole–genome resequencing. Theor. Appl. Genet. 2015, 128, 259–272. [Google Scholar] [CrossRef]
- Park, H.; Kown, O.; Kim, H.; Na, J.; Park, Y.; Park, J.; Park, C.; Song, K.; Yang, D.; Om, Y.; et al. The Recent History of Vegetable Seed Industry in Korea; Seoul National University Press: Seoul, Republic of Korea, 2008; pp. 213–249. (In Korean) [Google Scholar]
- Wei, Q.; Wang, J.; Wang, W.; Hu, H.; Yan, Y.; Bao, C.; Hu, T. Identification of QTLs controlling radish root shape using multiple populations. Horticulturae 2022, 8, 931. [Google Scholar] [CrossRef]
- Yu, X.; Choi, S.; Chhapekar, S.S.; Lu, L.; Ma, Y.; Lee, J.; Hong, S.; Kim, Y.; Oh, S.; Lim, Y. Genetic and physiological analyses of root cracking in radish (Raphanus sativus L.). Theor. Appl. Genet. 2019, 132, 3425–3437. [Google Scholar] [CrossRef]
- Kim, J.; Park, S.; Lee, J.; Han, K.; Jang, Y.; Chae, W. A preliminary study for identifying quantitative trait loci associated with seed production in radish using genotyping-by-sequencing. Horticulturae 2022, 8, 268. [Google Scholar] [CrossRef]
- Zou, Z.; Ishida, M.; Li, F.; Kakizaki, T.; Suzuki, S.; Kitashiba, H.; Nishio, T. QTL analysis using SNP markers developed by next-generation sequencing for identification of candidate genes controlling 4-Methylthio-3-Butenyl glucosinolate contents in roots of radish, Raphanus sativus L. PLoS ONE 2013, 8, e53541. [Google Scholar] [CrossRef] [PubMed]
- Jeon, B.; Oh, M.; Kim, H.; Kim, E.; Chae, W. Glucosinolate variation among organs, growth stages and seasons suggests its dominant accumulation in sexual over asexual-reproductive organs in white radish. Sci. Hortic. 2022, 291, 110617. [Google Scholar] [CrossRef]
- Kong, Q.; Li, X.; Xiang, C.; Wang, H.; Song, J.; Zhi, H. Genetic Diversity of Radish (Raphanus sativus L.) Germplasm Resources Revealed by AFLP and RAPD Markers. Plant Mol. Biol. 2011, 29, 217–223. [Google Scholar] [CrossRef]
Disclaimer/Publisher’s Note: The statements, opinions and data contained in all publications are solely those of the individual author(s) and contributor(s) and not of MDPI and/or the editor(s). MDPI and/or the editor(s) disclaim responsibility for any injury to people or property resulting from any ideas, methods, instructions or products referred to in the content. |
© 2023 by the authors. Licensee MDPI, Basel, Switzerland. This article is an open access article distributed under the terms and conditions of the Creative Commons Attribution (CC BY) license (https://creativecommons.org/licenses/by/4.0/).