Article

Leaf Area Prediction of Pennywort Plants Grown in a Plant Factory Using Image Processing and an Artificial Neural Network

1
Department of Agricultural Machinery Engineering, Graduate School, Chungnam National University, Daejeon 34134, Republic of Korea
2
Department of Smart Agricultural Systems, Graduate School, Chungnam National University, Daejeon 34134, Republic of Korea
3
Agricultural Technical Institute, Division of Horticultural Technologies, Ohio State University, Wooster, OH 44691, USA
4
Department of Agricultural and Industrial Engineering, Hajee Mohammad Danesh Science and Technology University, Dinajpur 5200, Bangladesh
5
Department of Crop Science, Graduate School, Chungnam National University, Daejeon 34134, Republic of Korea
6
Department of Horticultural Science, Graduate School, Chungnam National University, Daejeon 34134, Republic of Korea
7
College of Veterinary Medicine, Chungnam National University, Daejeon 34134, Republic of Korea
*
Author to whom correspondence should be addressed.
These authors contributed equally to this work.
Horticulturae 2023, 9(12), 1346; https://doi.org/10.3390/horticulturae9121346
Submission received: 21 November 2023 / Revised: 8 December 2023 / Accepted: 15 December 2023 / Published: 17 December 2023

Abstract

:
The leaf is a primary part of a plant, and examining the leaf area is crucial in understanding growth and plant physiology. Accurately estimating leaf area is key to this understanding. This study proposed a methodology for the non-destructive estimation of leaf area in pennywort plants using image processing and an artificial neural network (ANN) model. The image processing method involved a series of steps, including grayscale conversion, histogram equalization, binary masking, and region filling, achieving an accuracy of around 96.6%. The ANN model, trained with 70% of a dataset, exhibited high correlations of 97.1% in training and 96.6% in testing phases, with leaf length and width significantly impacting the model output. A comparative analysis revealed the superior performance of the ANN model over the image processing method, demonstrating higher R2 values (>0.99) and lower errors. Furthermore, it showed the impact of diverse LED light combinations and nutrient levels (electrical conductivity, EC) on pennywort plant growth, indicating that the R70:B30 LED light ratio with nutrient level 2 (2.0 dS·m−1) fostered the most favorable growth for pennywort plants. The non-destructive nature, simplicity, and speed of the ANN model in estimating leaf area based on easily obtainable measurements of length and width render it an accessible and accurate tool for plant growth assessment in controlled environments. This approach offers opportunities for future studies, tracking changes in leaf areas under varied growth conditions without harming the plant, thus enhancing precision in research.

1. Introduction

Pennywort (Centella asiatica L.) is an herbaceous, perennial plant that belongs to the family Apiaceae. It is used as a cooking vegetable and in drinks, but mostly as a medicinal herb owing to its health benefits, which include secondary metabolites, antioxidants, anti-bacterial, anti-fungal, and anti-inflammatory properties, wound healing, and memory-improving properties [1]. It is generally recognized as a “Brain Food” in most countries as it stimulates nerves and brain cells significantly [2]. Pennywort is one of the most important herbs for healing wounds, treating varicose skin disorders (i.e., leprosy, lupus, different ulcers, eczema, and psoriasis), diarrhea, fever, amenorrhea, and diseases of the female genitourinary tract [3,4,5,6]. Its potential as a natural antioxidant and its ability to defend against age-related alterations in the brain’s antioxidant defense system has increased dramatically in recent years [7]. It is also one of the important medicinal plants in international pharmaceutical trade markets.
The demand and trading value of pennywort plants mainly depend on the quality of their leaves, which, in turn, is closely tied to the conditions in which they are cultivated. This includes factors such as the cultivation method, ambient environmental variables, light conditions, water supply and nutrient levels, and the aggregate of cultivation facilities (i.e., greenhouse or plant factories). Although pennywort plants can be grown in open fields easily, the growth rate (quantity) and nutrient level (quality) cannot be confirmed, because these two parameters are directly affected by the climatic conditions [8]. In recent years, controlled environment agriculture (CEA) facilities, such as greenhouses and plant factories, have significantly enhanced crop quality and quantity. The CEA creates fully controlled environments for plant growth, providing everything the plants need, including water, temperature, humidity, light, and CO2 with low labor-intensiveness, and year-round crop production regardless of geographical location and weather conditions [9,10,11,12]. Soilless cultivation practices (i.e., aeroponics, deep-flow, NFT) with a proper nutrient supply system can enhance the crop growth and nutritional profile significantly compared to soil-based cultivation [13,14,15]. Moreover, recycling-type hydroponic techniques and the ion-specific sensor-based nutrient management of the hydroponic solution save a notable amount of water nutrients, lower the cultivation costs, and minimize environmental hazards due to excessive discharged nutrient solutions [16,17,18,19]. The overall target of the CEA facilities (i.e., plant factories) is to provide optimal growing conditions for crops for maximum growth and quality.
Plant growth analysis and growth prediction are required to determine the factor/s affecting the appropriate growth rate and expected yield. These approaches help farmers to decide what, when, and how to grow, and help with the timely management of crop growing. Growth prediction is also an important task for regional- and national-level decision-makers for target fixing and decision-making for food security [20,21,22,23]. There are several techniques to predict the growth rate and yield of crops. Usually, farmers predict the growth rate and yield based on the visual appearance of plants. In this case, the leaf area (LA) plays a vital role. Farmers collect leaf samples and measure the LA using a ruler, scanner, or LA meter, which are direct but destructive, laborious, erroneous, and time-consuming processes [24]. On the other hand, image-based LA detection is an indirect, rapid, cost-effective, and non-destructive method [25]. Image-based methods offer quantitative data, enhancing objectivity and accuracy compared to visual scoring, reducing the risk of human error and subjectivity [26]. Additionally, these methods can be scaled up to accommodate larger datasets and more complex analyses [27]. In this process, RGB images of the targeted plant are captured, and the leaf region is segmented using contour extraction techniques [28,29] or threshold-based segmentation [30], or color ratios of pixels to distinguish leaves and background, facilitating leaf pixel count comparison [26]. Recently, image analysis has been performed using artificial intelligence (AI) techniques, such as artificial neural networks [31], machine learning [32,33], and deep learning techniques [34,35].
Plant growth significantly depends on light conditions and nutrient availability, especially when grown in a plant factory [36]. Light influences plant growth, and with variations in intensity and quality impact the development [37,38]. Low light increases height and specific leaf area but decreases leaf number, thickness, and yield as well and high light intensity can lead to inefficient energy use in photosynthetic apparatus, particularly photosystem II [38]. Blue light promotes the development of vegetative leaves as well as the contents of antioxidant compounds and the total glucosinolates accumulation, while red light wavelengths encourage budding and flowering. Alongside blue light, red light wavebands are considered one of the most important for photosynthesis and biomass growth [39,40,41]. A plant-specific balanced combination of red and blue light for optimal results is always essential. Moreover, nutrient uptake is generally influenced by light conditions. Nutrient availability is also crucial for plant growth, and deficiencies can diminish both growth and yield. Analyzing plant growth under controlled conditions and considering factors like fertilizer and water supply is vital for early intervention [42]. In addition, the direct estimation of plant growth rate using leaf area and predicting the yield is a destructive and ineffective method, which also hampers the continuous growth and monitoring of the targeted plant. Image-based growth analysis can be an alternative for the accurate determination and prediction of plant growth. To date, very few studies have been conducted where image-based LA estimation and prediction techniques are applied for pennywort plants, especially when grown in a plant factory under different light and nutrient conditions. The objective of this study was to predict the pennywort plant’s leaf area using the image processing technique and artificial neural network (ANN) model which was grown in a plant factory under different LED and EC conditions.

2. Materials and Methods

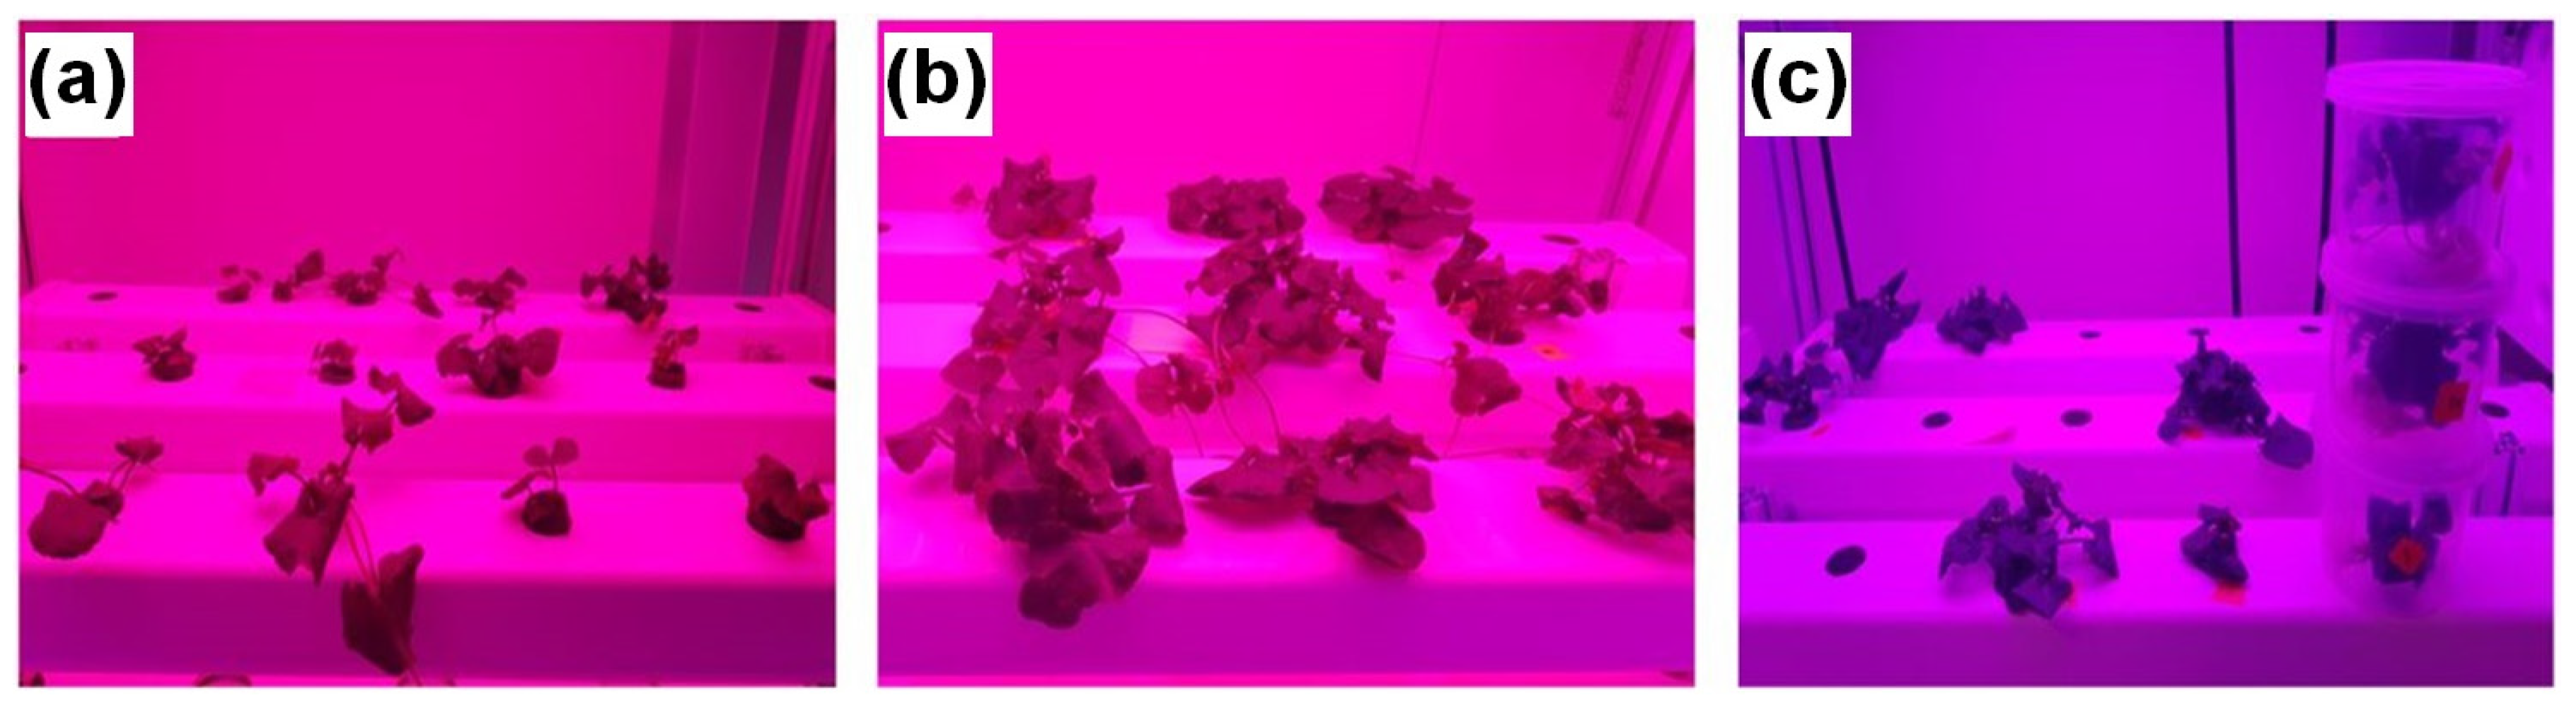
2.1. Plant Factory Preparation and Operation

A plant factory is an enclosed crop-growing system that is used to cultivate high-value crops and medicinal plants throughout the year by maintaining the optimum ambient environmental parameters artificially. Figure 1a shows the layout of the plant factory used in this study. There were four shelves, and each shelf contained three layers of cultivation beds, as shown in Figure 1b. A total of three shelves were prepared for this study. One shelf was fabricated using fluorescent lights and a deep flow technique (DFT)-type hydroponic system (Figure 1c). Another two shelves were fabricated using LED lights and a nutrient film technique (NFT)-type hydroponic system. Three different combinations of red and blue LEDs (i.e., Red90:Blue10, Red70:Blue30, and Red50:Blue50) and EC (i.e., 1.0, 2.0, and 3.0 dS·m−1) were implemented as treatments during this study, while other environmental variables (i.e., temperature, relative humidity, and CO2), light conditions (i.e., photoperiod, light intensity) and the pH of the nutrient solution were kept constant. The overall cultivation condition is summarized in Table 1. These targeted LED combinations and EC levels were selected based on the findings in [43,44,45,46] and [47,48,49,50,51], respectively. A wireless sensor network (XBee-Pro, Digi, Hopkins, MN, USA) was used to monitor the ambient environmental parameters and control the relevant actuators, as detailed by [52]. The nutrient solution tanks were kept at the bottom of the shelves. Each plant bed had three NFT pipes and a total of 18 planting positions. The target nutrient solution was supplied for 30 min with 15 min of intervals for the DFT system and 15 min with 15 min of intervals for the NFT system. Commercial nutrient solutions A and B (MB cell, Kisan Bio Co., Ltd., Seocho-gu, Seoul, Republic of Korea) were used, and the target nutrient level was monitored and managed manually once a day using EC and pH sensors.

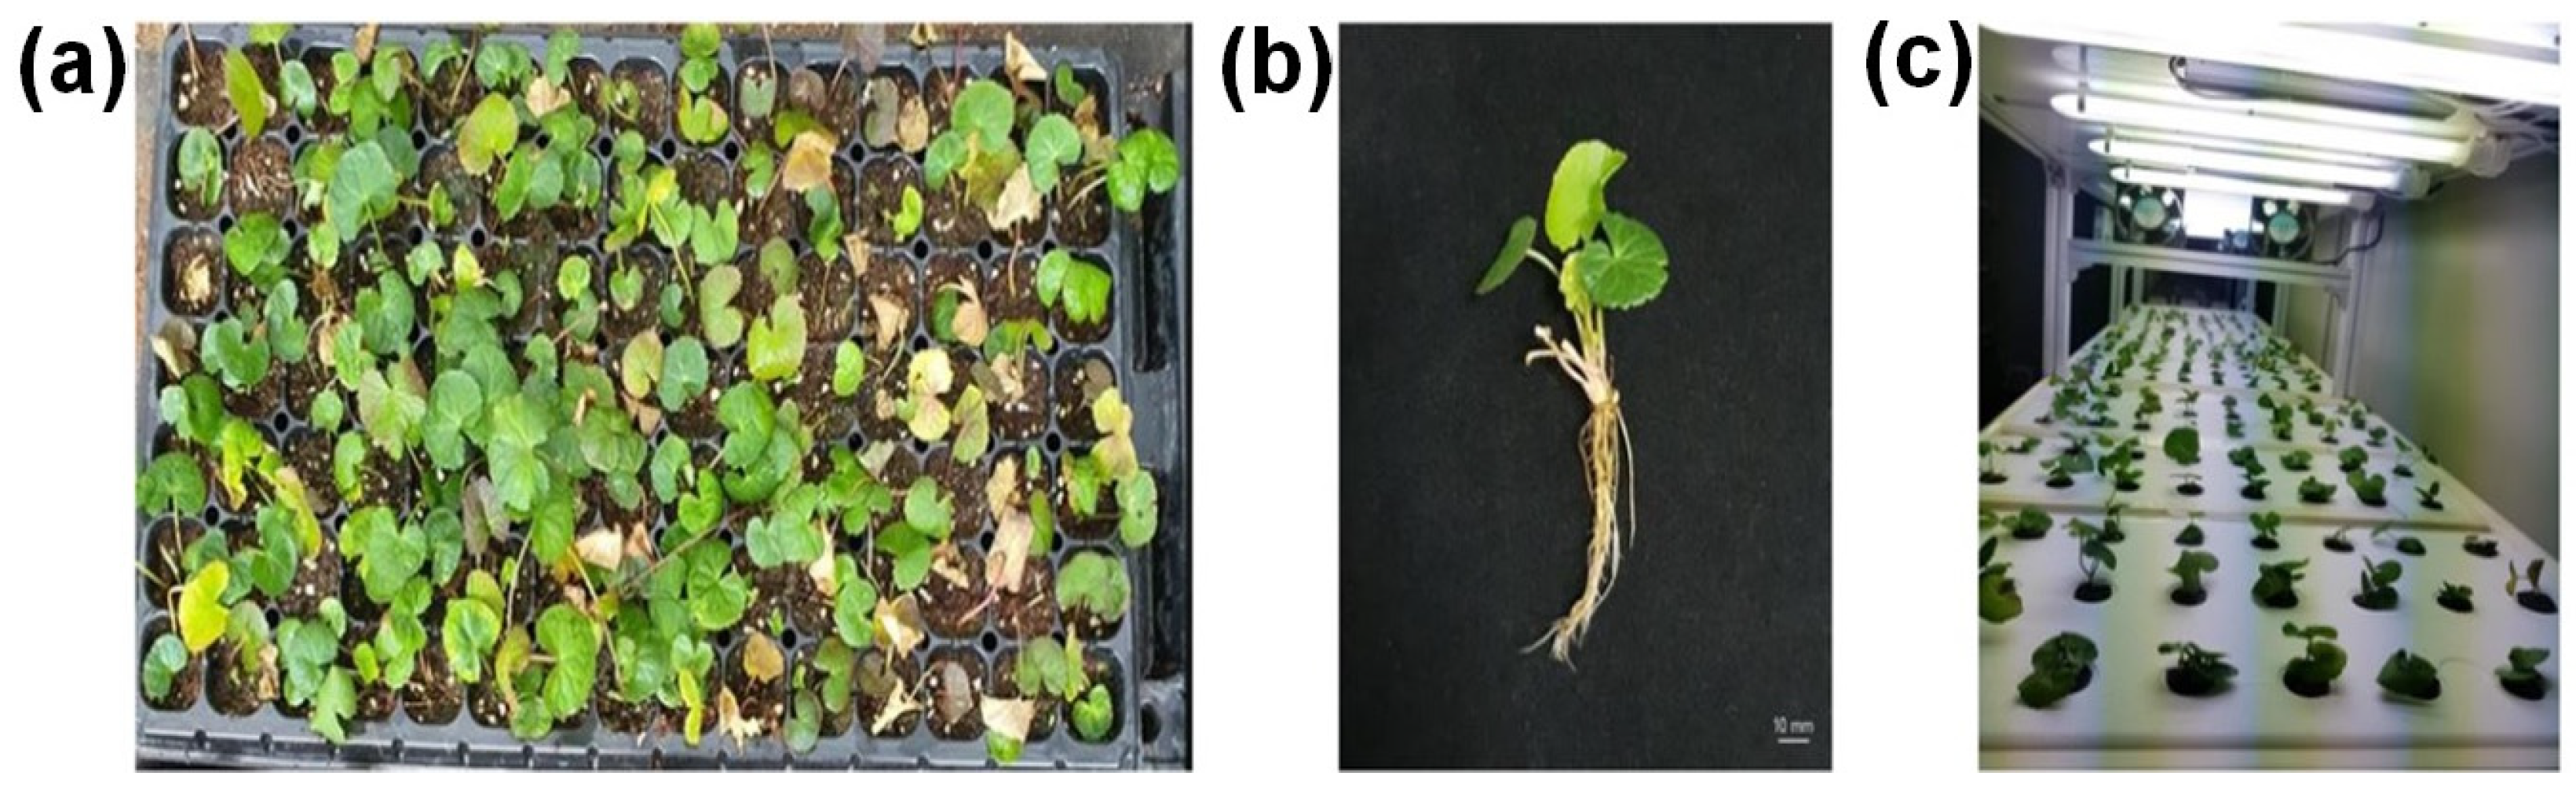
2.2. Pennywort Seedling Preparation and Transplantation

The pennywort seedlings (variety: Asiatic pennywort) were germinated using tissue culture following the protocol [53,54] and then grown in a greenhouse for one month in the perlite soil mixture pots. After that, the seedlings were separated from the cultivation pots, cleaned, and moved to the DFT system under fluorescent lights to adapt to the hydroponic system and ambient environment of the plant factory as Shown in Figure 2. After two weeks of adaption, healthy and sustained seedlings were transplanted into the NFT system under the light and EC treatments.

2.3. Experimental Design and Sample Collection

Three different red–blue LED combinations (R90:B10, R70:B30, and R50:B50) and three levels of EC (1, 2, and 3 dS m−1), and a total of nine treatments, were carried out in this study. After one week of transplantation, pennywort plant sampling was started and continued until the fourth week of the growth period of plants, as shown in Figure 3.
The study involved the comprehensive collection of physical data from a total of 162 plants, which encompassed measurements related to leaf length, width, and leaf area. The fresh weight of each plant was also collected to check the growth status of the plant. Three pennywort plants from each bed were randomly selected and collected, resulting in a total of 27 plants (3 samples from each treatment × 9 treatments) being sampled each week. Measurements of leaf length, width, number of runners, dead leaves, fresh leaves, aerial plant height, root length, fresh weight, and dry weight were conducted using a ruler and digital balance. Simultaneously, phytochemical analysis was performed. To minimize the degradation of quality during transportation, each pennywort sample collected from the NFT system was stored in an individual plastic container, as illustrated in Figure 3c. Following the collection of physical data from each plant, the samples were frozen and dried for functional component analysis. To ensure the robustness and inclusivity of the dataset, leaves were chosen at random, encompassing a wide range of sizes and shapes. The essential parameters of interest in this data collection were leaf length (L) and leaf width (W). Leaf length can be defined as the longest extension from the leaf apex to the base, and leaf width corresponds to the longest extension of any two points on the blade edge perpendicular to the leaf length axis, which is the axes connecting the leaf apex and base. These parameters were measured meticulously using a measuring scale. Typically, leaf area (LA) can be simply calculated by multiplying the product of leaf length (L) and width (W) by a constant [55]. As the pennywort leaves are circular shaped, the leaf area was computed based on the equation, A = πr2. The modified LA calculating equation used in this study is shown in Equation (1). Subsequently, the measured leaf area was computed using Equation (1):
Leaf   area   LA = 3.14 × Leaf   length   L 2 × Leaf   width   W 2

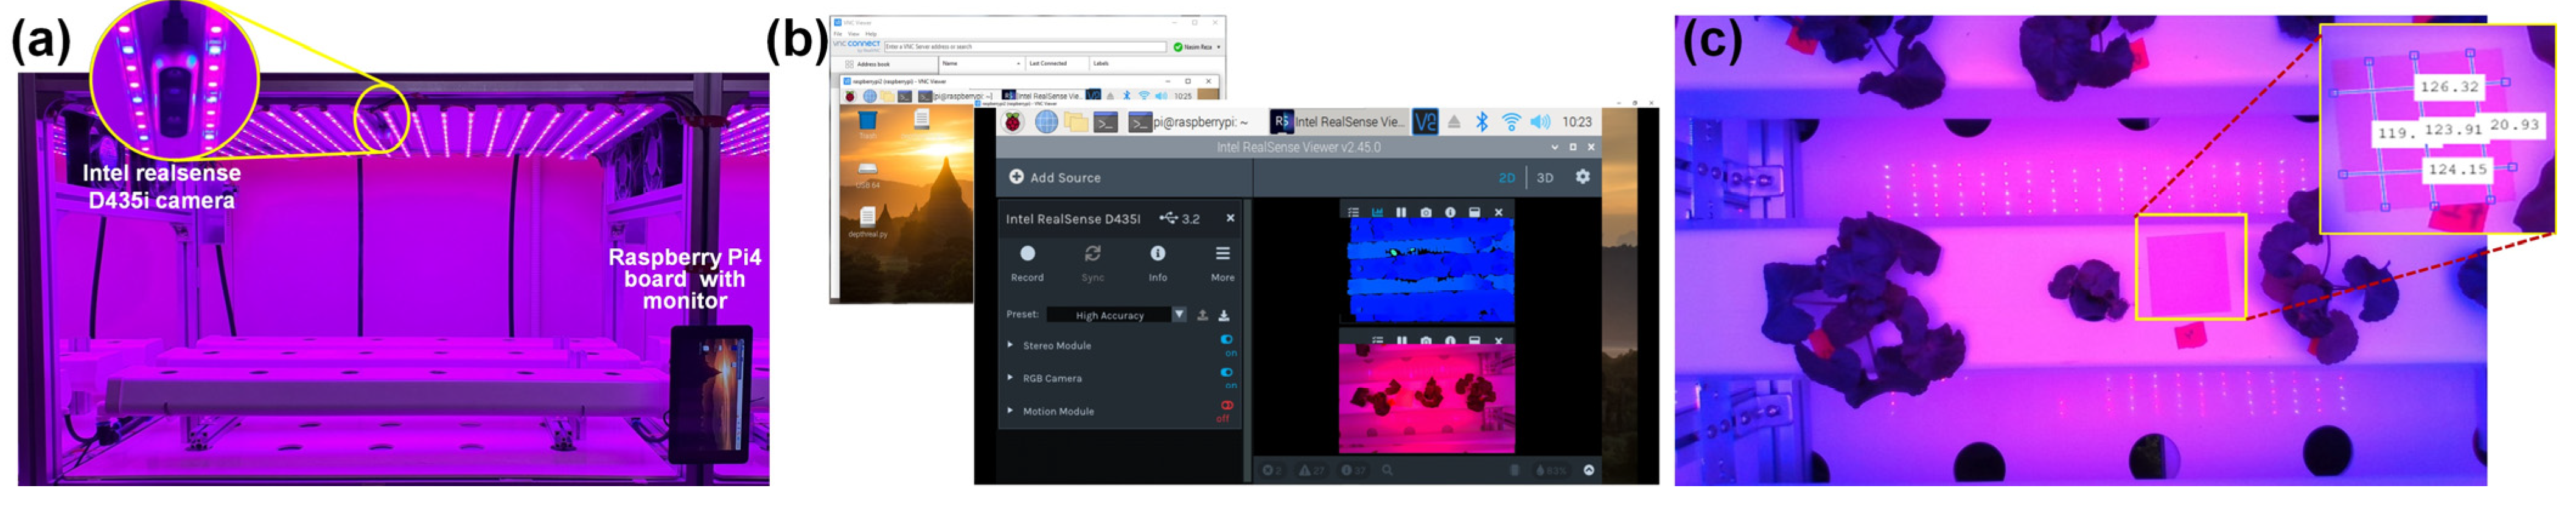
2.4. Leaf Image Acquisition

A plant monitoring and acquisition procedure was established utilizing an Intel RealSense D435i camera (Intel Corporation, Santa Clara, CA, USA), as shown in Figure 4a. This procedure was designed to capture high-resolution images of plant leaves within a controlled environment. The hardware setup involved connecting the Intel RealSense D435i camera to a Raspberry Pi 4B board, with the visual output displayed on a Raspberry Pi monitor. This configuration facilitated remote monitoring and image acquisition, allowing users to access the system remotely. To enable remote access and ensure seamless operation with the Raspberry Pi’s graphical user interface (GUI), the system incorporated the use of a VNC (virtual network computing) viewer. The VNC viewer allowed users to interact with the Raspberry Pi’s interface, making it possible to monitor and acquire plant images remotely, as shown in Figure 4b. The specifications of the camera and microcontroller are shown in Table 2.
Within the controlled environment of the plant factory, the plants were carefully cultivated. Image acquisition was executed with precision by positioning the Intel RealSense camera directly above the plant bed, capturing plant images from a top-down perspective, with the camera angle perpendicular to the plant surface. To maintain accuracy and scale in the images, a square white paper sheet measuring 5.1 cm by 5.1 cm was included in the frame during image acquisition. This white paper sheet served as a reference object, aiding in size and scale calibration, as depicted in Figure 4c. Plant images were systematically captured every day, ensuring the continuous monitoring of plant growth and health. The Intel RealSense SDK, a software development kit specifically designed for RealSense cameras, was employed to control and manage the camera for image capture. The resulting plant images were of high quality, with dimensions measuring 1280 × 780 pixels. Over three weeks, a total of 2916 plant images were collected, and all the image data were stored in PNG format on a microSD memory card that was connected to the Raspberry Pi board. This method of data storage allowed for efficient data management and easy retrieval for further analysis and research in the plant factory environment.

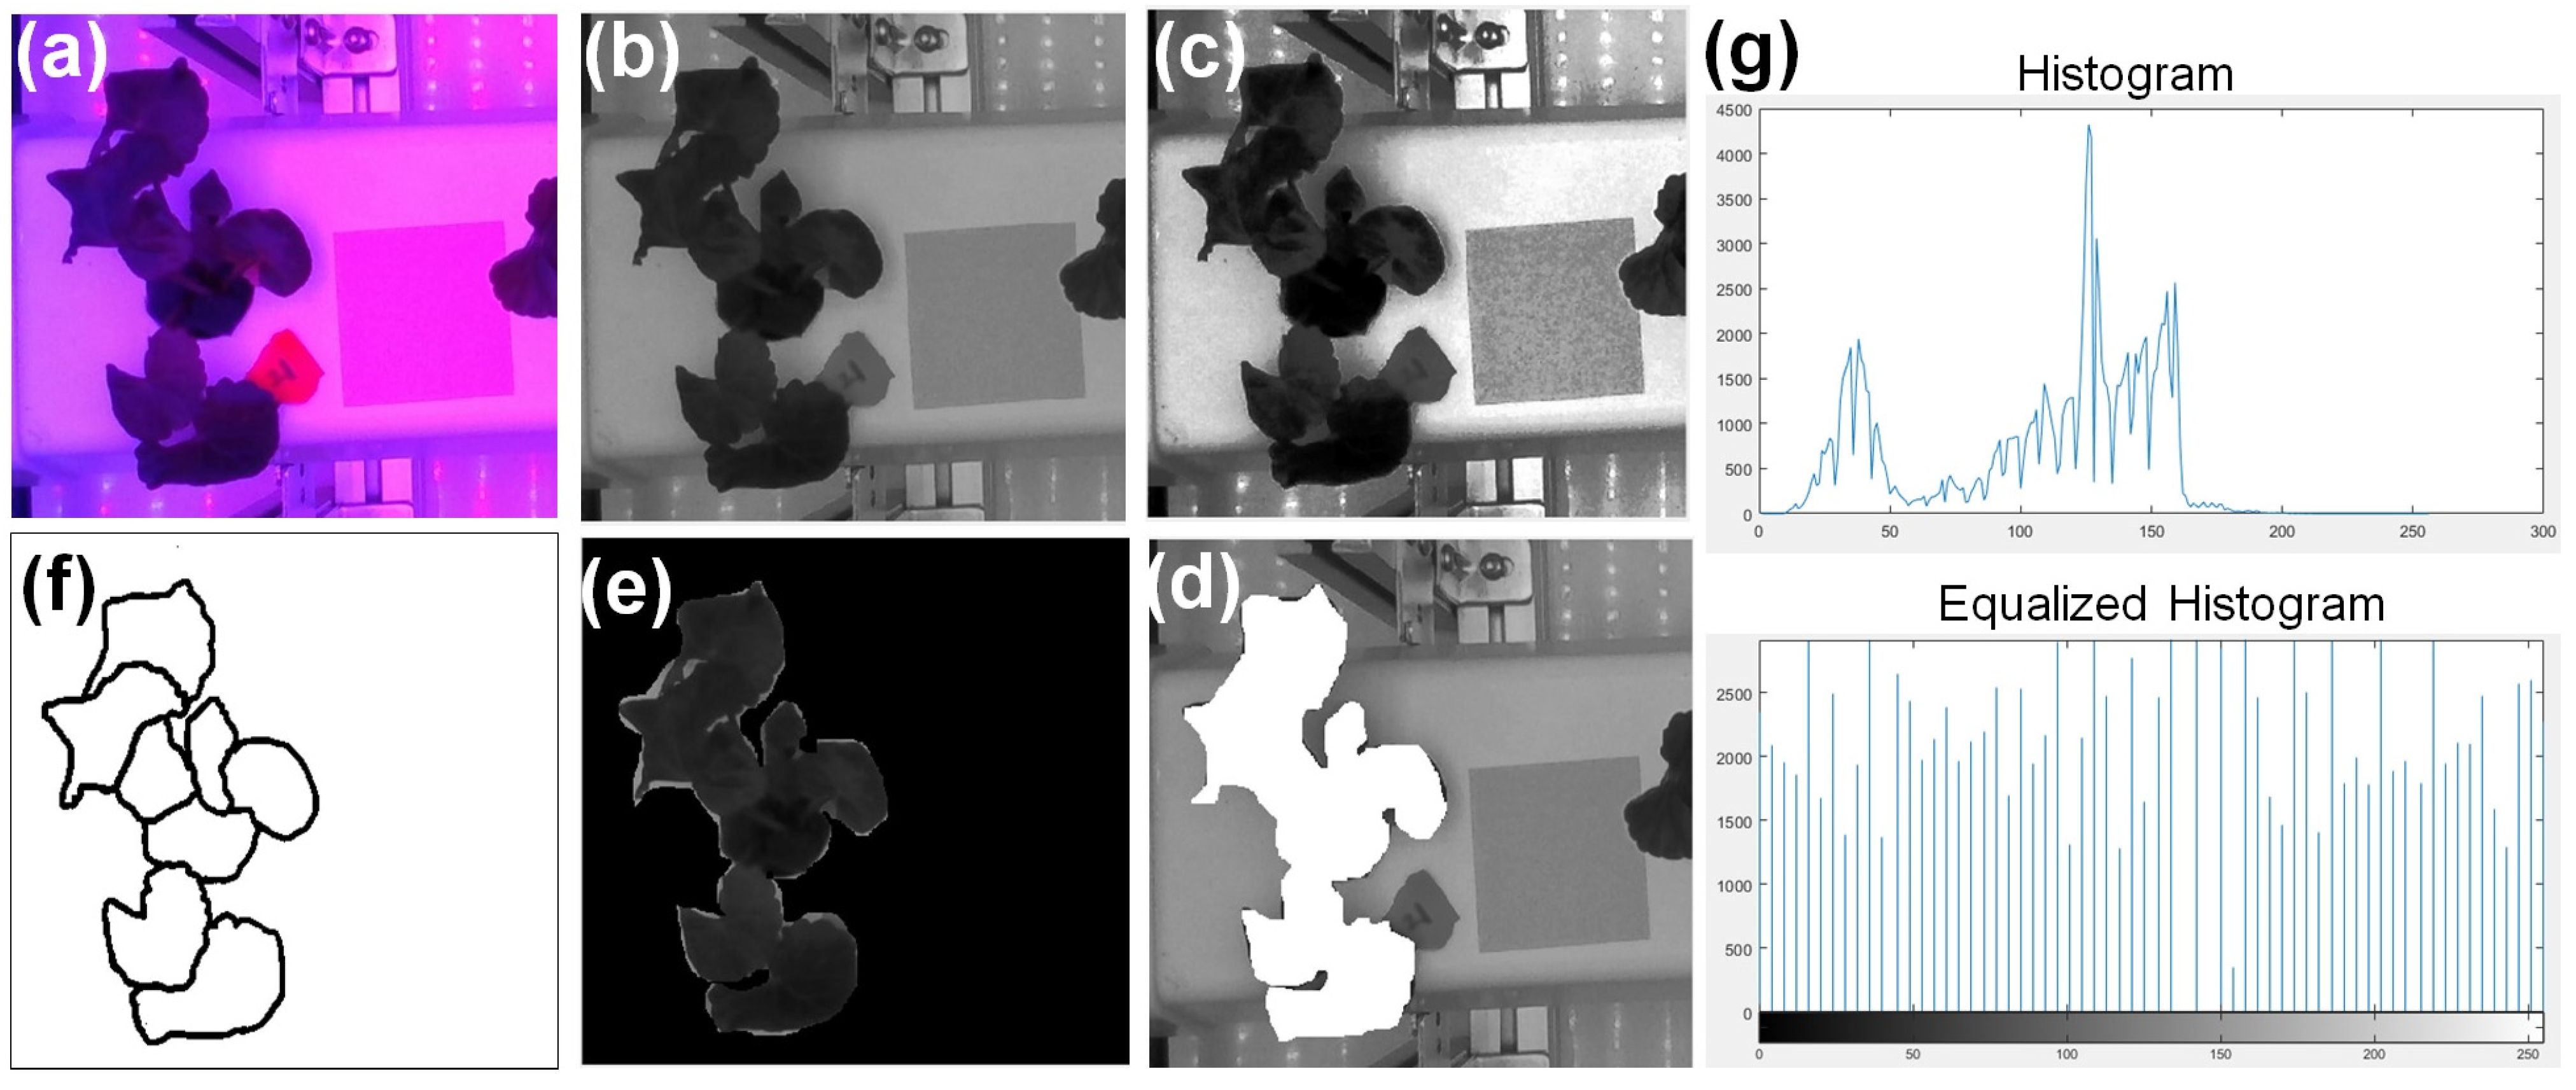
2.5. Leaf Area (LA) Estimation from Images
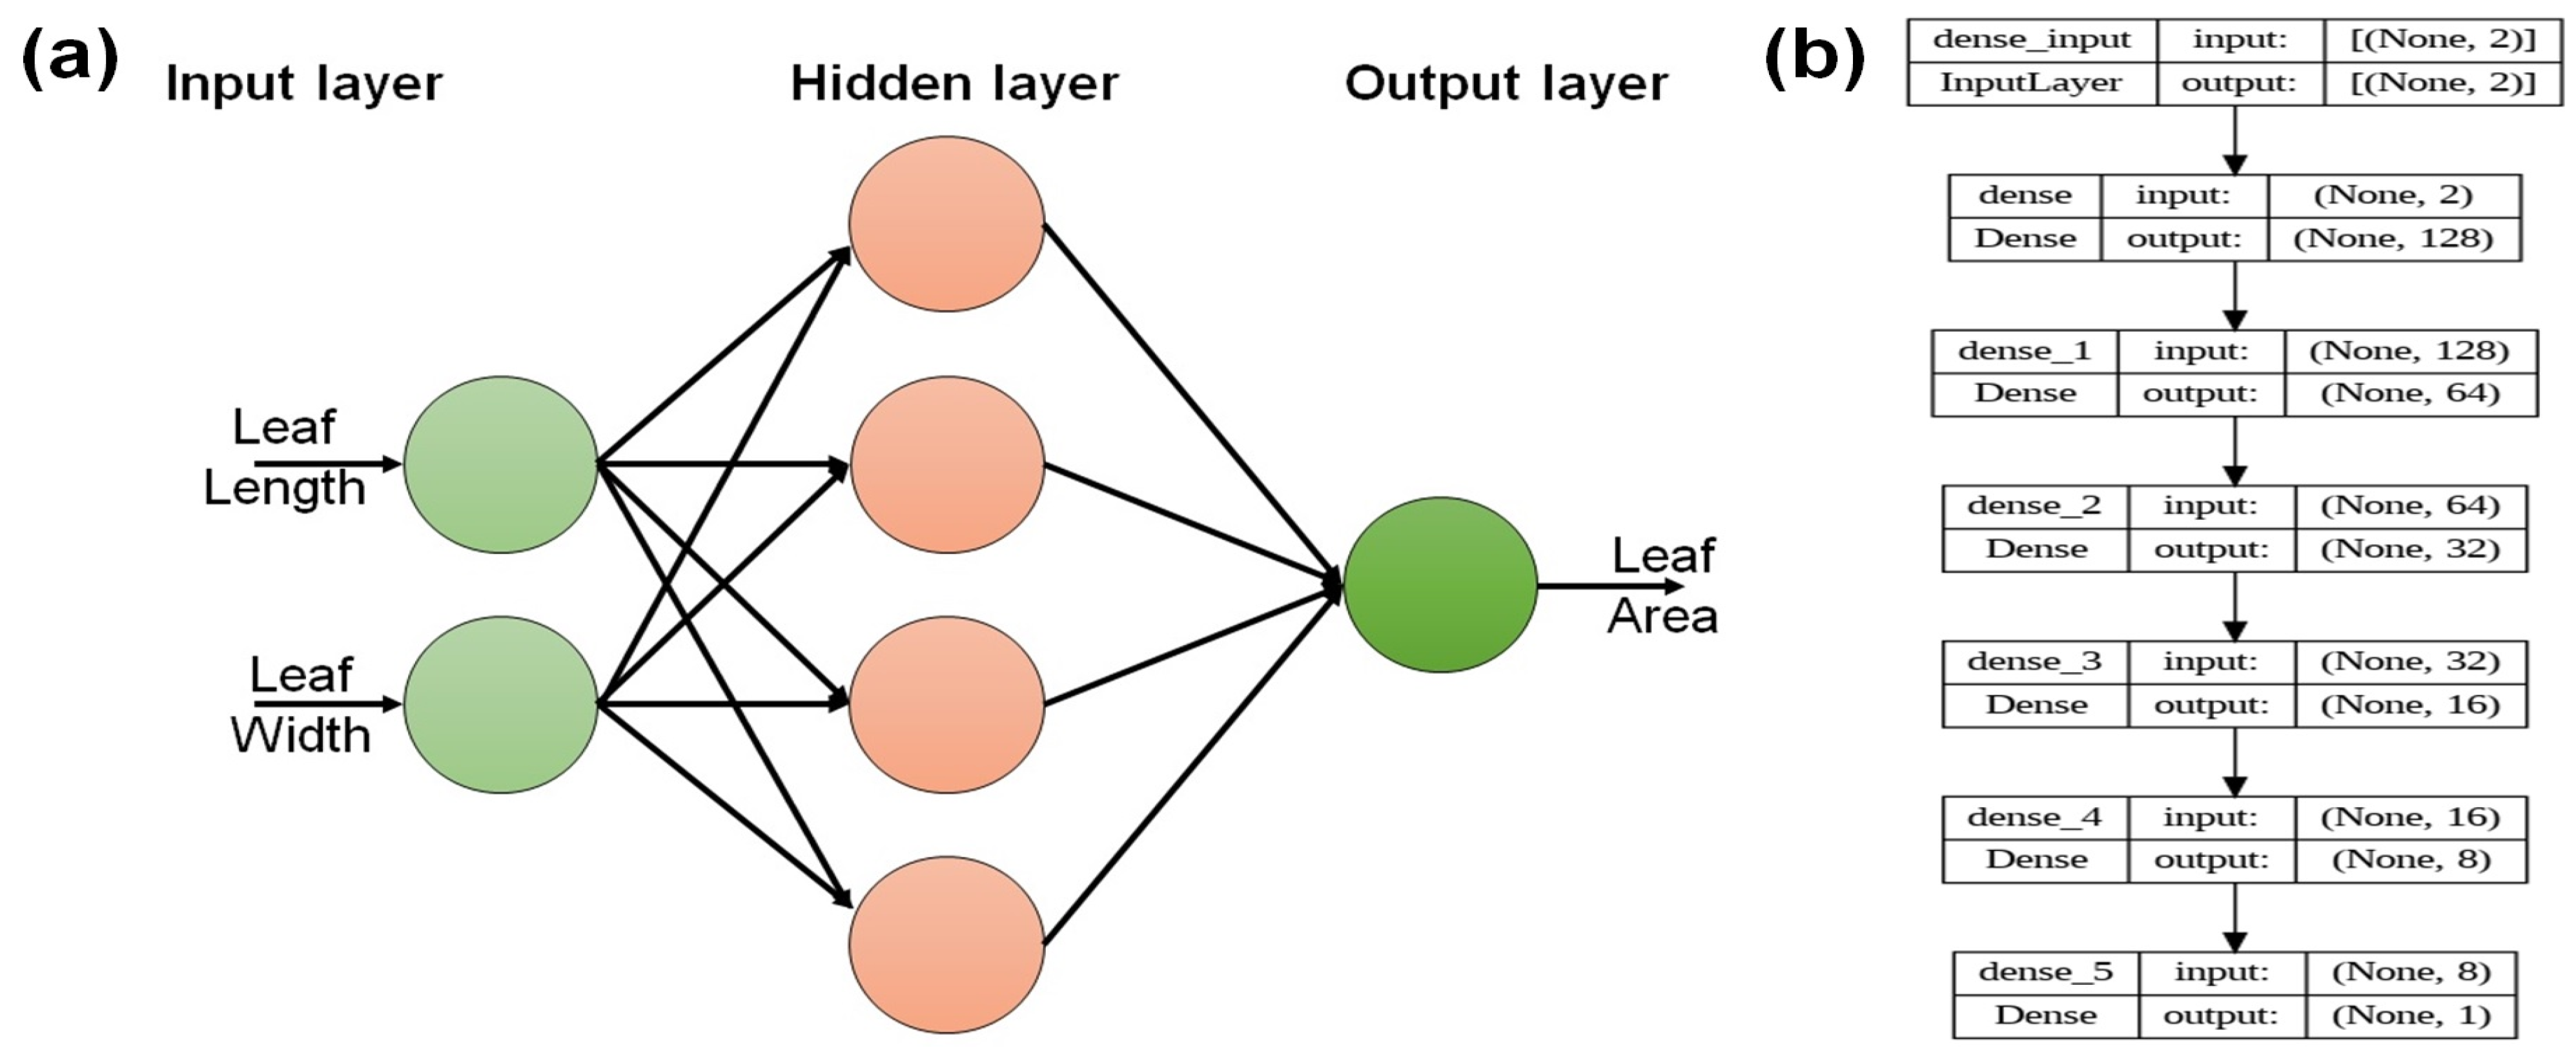
Figure 5 shows the flowchart of the steps involved in the leaf area (LA) measurement using an image processing method. The steps followed were from the article by [24]. First, the RGB plant leaf images were acquired from the camera. To minimize the noise, these images were color-transformed from RGB images to grayscale images. The conversion of the grayscale image was achieved by eliminating the hue and saturation while keeping the image luminance. This conversion turns RGB values into gray values through the formation of a weighted total of the components R, G, and B, as in Equation (2) [56,57]:
Ggray = 0.3R + 0.59G + 0.11
Then, histogram equalization was applied to the images to boost the contrast of the region of interest (ROI) by changing the intensity distribution of the histogram. A binary masking was then applied from a grayscale image by classifying each pixel as belonging to the region of interest from the background. The binary mask can be expressed as Equation (3) [58]:
I max x , y = 1   0   if   f w λ gray x , y > T if   f w λ gray x , y T
where T is the threshold value and x and y are the value point coordinates. All the gray levels greater than T are labeled as white considering a value of 1, and those less than or equal to T are black considering a value of 0. Then, the masked images were segmented, and the leaf regions were filled using a region-filling technique. The number of pixels in a leaf area was calculated, and, finally, the leaf area was calculated based on the pixel size, calculated from the reference object area. MATLAB R2020B (The MathWorks, Inc., Natick, MA, USA) was used to program the image processing system.
The pixel number statistic was used to compute the area of the leaf. Let AL and AS indicate the leaf area and the area of the reference object, respectively. Let PL represent the pixel number of the leaf in the image. PS represents the pixel number within the object in the image. Thus, Equation (4) for calculating the image estimated area of each leaf is as follows [13]:
A L = P L P S × A S
where AL is the leaf area in the image, AS is the reference object area, PS is the counted number of pixels for the reference object, and PL is the counted number of pixels obtained from the leaf area.

2.6. ANN Model

Artificial neural networks (ANNs) serve as data processing tools that mimic the learning process of biological neural networks [59]. They draw inspiration from the human nervous system, which efficiently performs various perceptual and recognition tasks through parallel interconnected nodes [60,61]. Multilayer feed-forward neural networks, often called multi-layer perceptrons (MLPs), consist of multiple layers of artificial nodes. These networks facilitate the one-way flow of information from inputs to outputs and include regular input signals, an output layer, and hidden layers with varying numbers of nodes positioned between the input and output layers. The MLP architecture used in this study is shown in Figure 5. The input layer receives control parameters, while the neurons in the hidden and output layers process weighted signals from their respective previous layers, ultimately producing an output using an activation function. Training often employs the stochastic gradient descent algorithm, with gradient computation facilitated by the backpropagation technique. The settings for the proposed algorithm are shown in Table 3. In our study, two inputs were entered at the same time on the ANN because the problem requires the network to handle multiple inputs simultaneously. This is a common practice in neural networks to process multiple inputs together, as it allows the network to learn and process complex relationships between the inputs more effectively.
For the training, testing, and validation of the proposed method, the leaf length, width, and area data were prepared from the actual measurement, which was explained in Section 2.3. Similarly, data from the image processing method were also used in this process. Three main model scenarios were explored in this study:
1.
The model was trained with both L and W to predict LA from the actual measured data.
2.
The model was trained with both L and W to predict LA from the image-extracted data.
3.
The model was trained with both L and W to predict LA from both actual and image-extracted data.
To assess the reliability of the method described in this study, measurements of the actual leaf areas were performed, each of which was independently measured three times by three different individuals. Then, the root-mean-square error (RMSE) and mean absolute error (MAE) were calculated for the leaf area based on the manual measurements and the values obtained through the proposed method, as defined in Equations (5) and (6). Subsequently, the average of the manual measurements was used as a benchmark to compare the accuracy of the proposed method, following the formula provided in Equation (7). To identify any disparities between the calculated and measured values, a scatter plot was generated depicting the calculated values against the measured values, with a reference line at y = x. For this study, the data analysis was carried out using Microsoft Excel 2013 (Microsoft Inc., Redmond, WA, USA).
the   RMSE = i = 1 n x i y i n 1
MAE = i = 1 n x i y i n
Accuracy = 1 x i y i n × 100

3. Results and Discussion

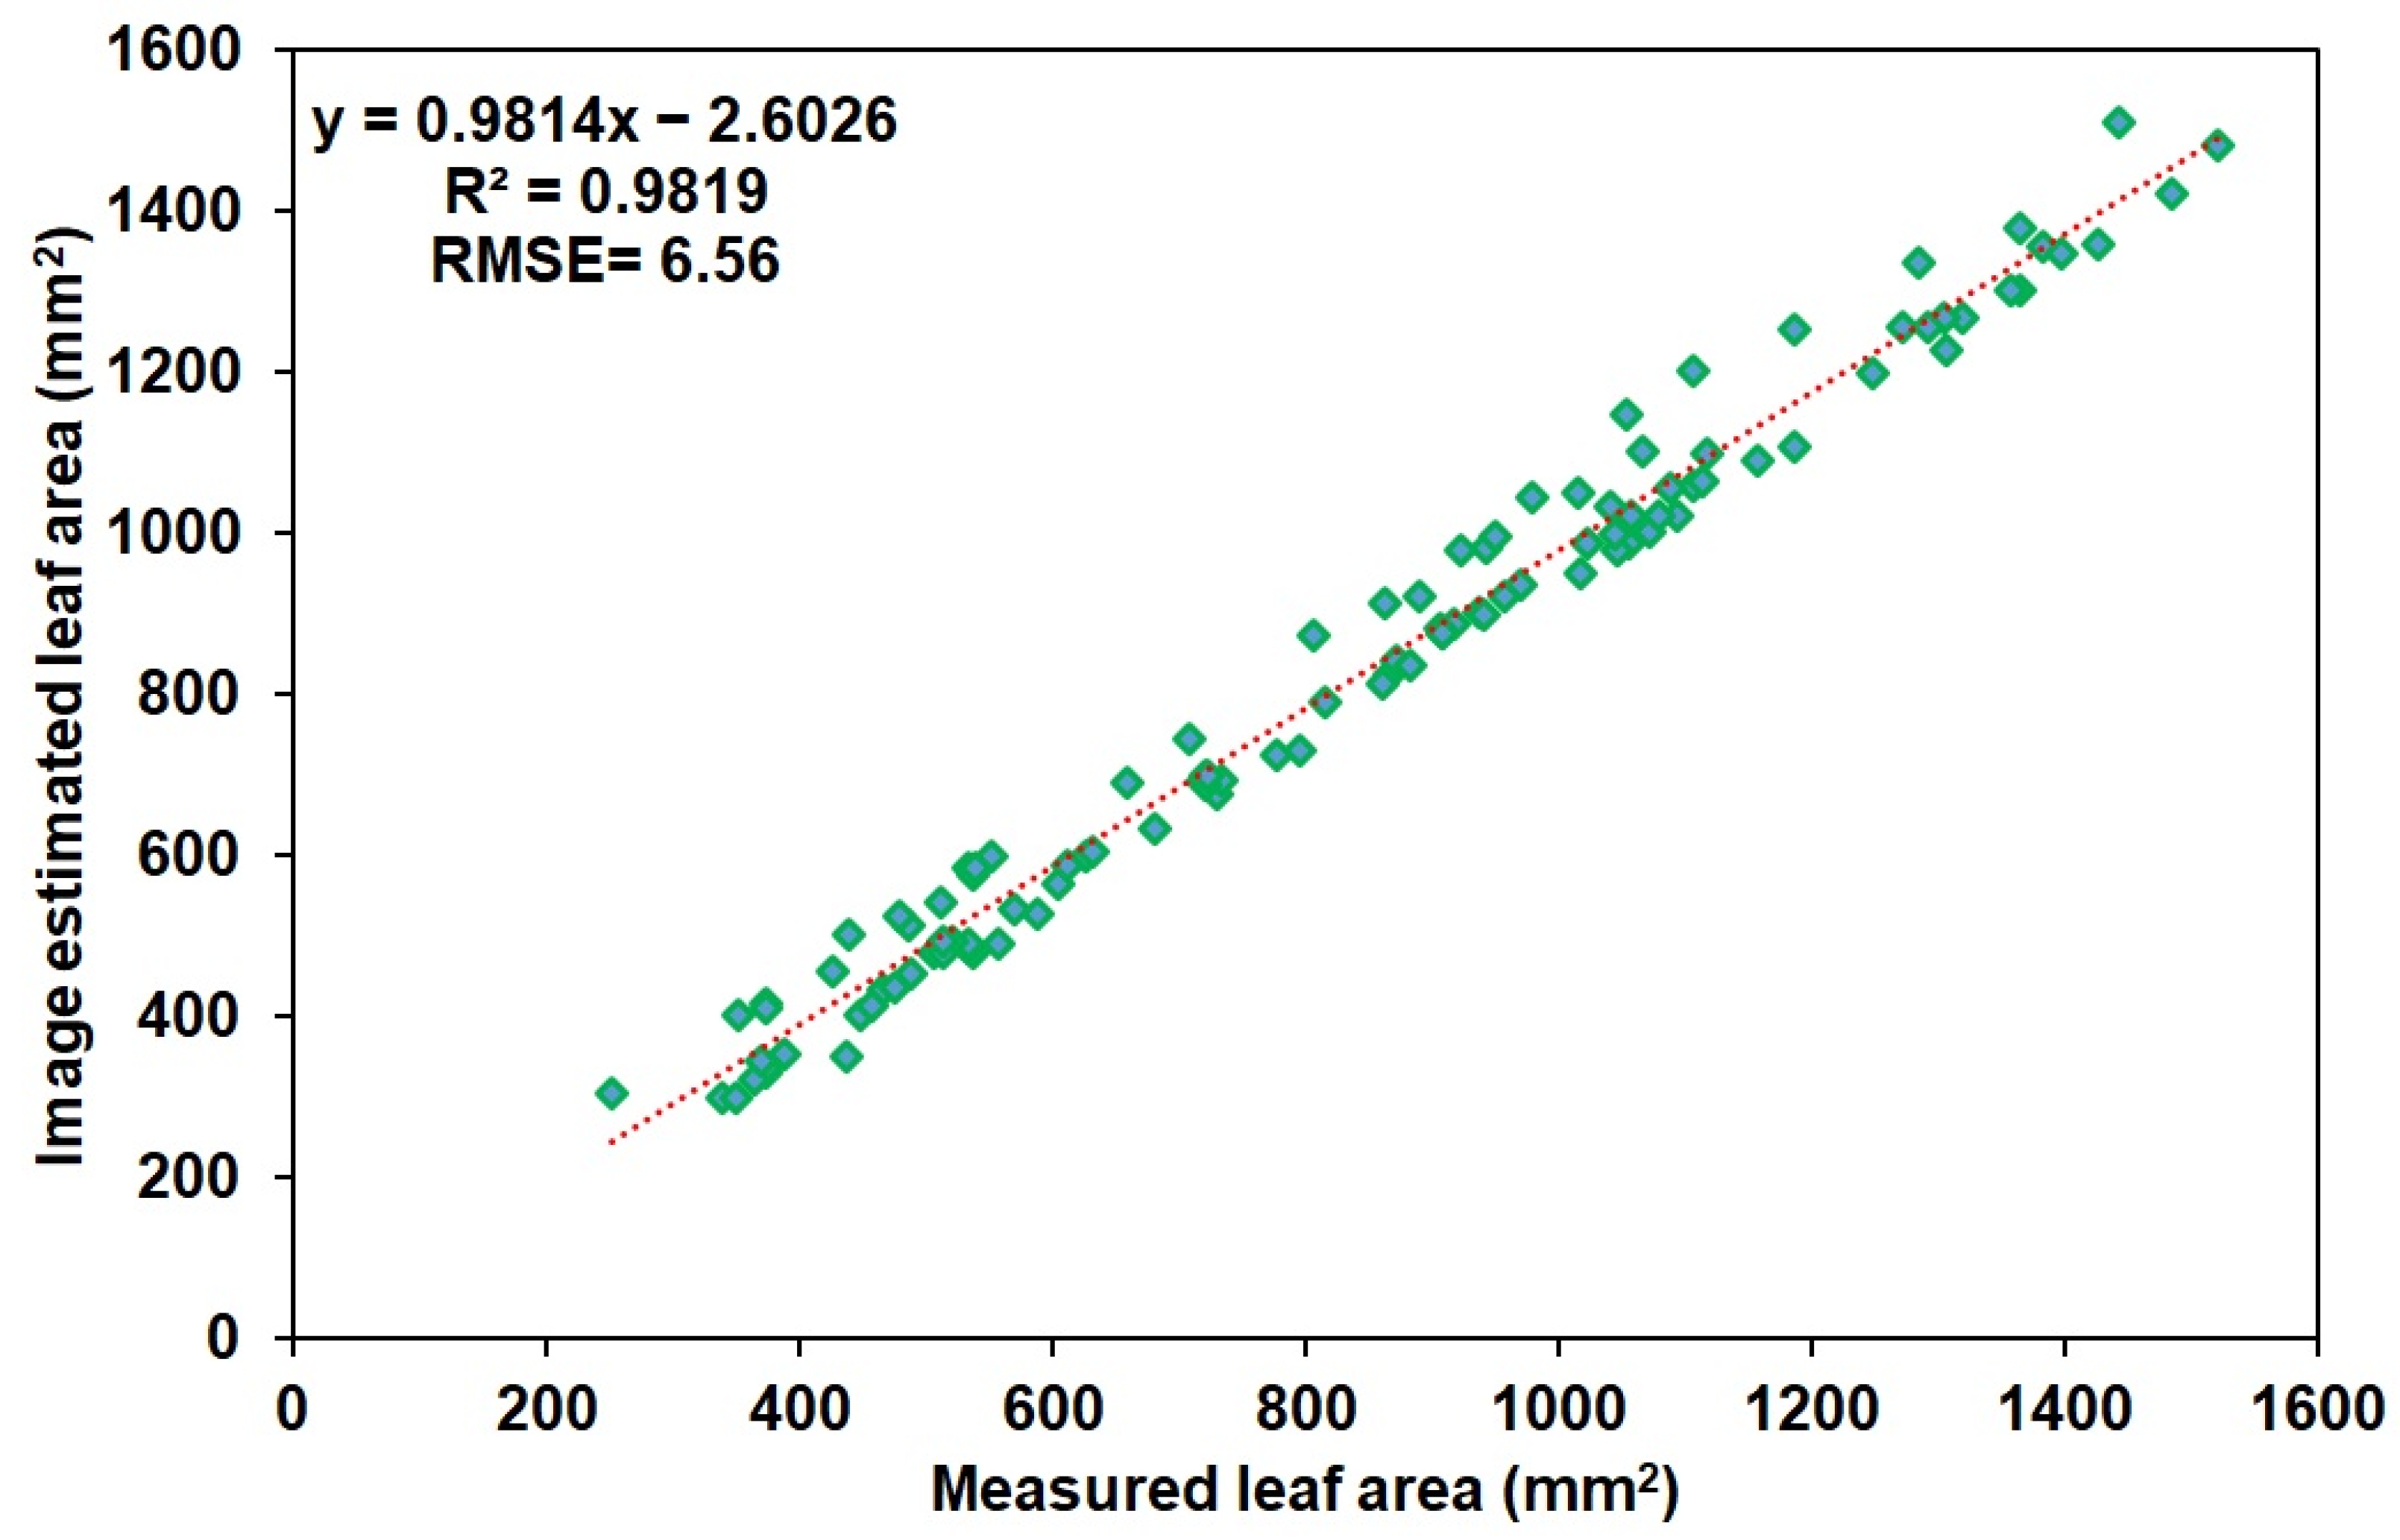
3.1. Leaf Area Estimation Using Image Processing

Figure 6 shows the image processing steps utilizing the proposed algorithm. The processing steps began with RGB images (Figure 6a), which were converted into grayscale images. These grayscale images (Figure 6b) underwent enhancement through histogram equalization (Figure 6c,g) to enhance the image quality. Subsequently, binary masking was applied (Figure 6d) to the grayscale images, categorizing each pixel as part of the region of interest or the background. Afterward, the masked images were segmented, and the leaf region was filled using a region-filling technique (Figure 6e). Finally, grayscale value-based contour detection was used to partition images into distinct regions based on brightness and texture, aiding in the identification of overlapped leaves. (Figure 6f). This process allowed us to calculate the total number of pixels within the leaf region, thereby determining the overall leaf pixel area. By referencing the actual pixel size, estimated from known objects within the images, we calculated the leaf area for each leaf. However, in cases of very high overlap conditions, the contour may overlap the image leaves area, which can provide less efficacious leaf area data. This can lead to potential underestimation of individual leaf areas and reduced accuracy in leaf area estimation.
In Figure 7, the validation results illustrate the coefficient of determination (R2) for both the actual and measured leaf areas across all samples. The pennywort plant leaves exhibit a better R2 value of 0.98, indicating a high constancy in reflecting the true measured leaf area. Our proposed method showed a similar coefficient of determination for estimating leaf area from the images as those reported in [24], and compared to different previous studies [29,30], our proposed method showed a higher coefficient of determination for estimating leaf area from the images. The average accuracy of our proposed method was found to be around 96.6%. While certain studies [25] have reported higher accuracy levels than this study, it is crucial to note that the conditions in this study were more complex than those in the comparative studies. Additionally, the methodology exhibited remarkable performance under diverse lighting conditions.

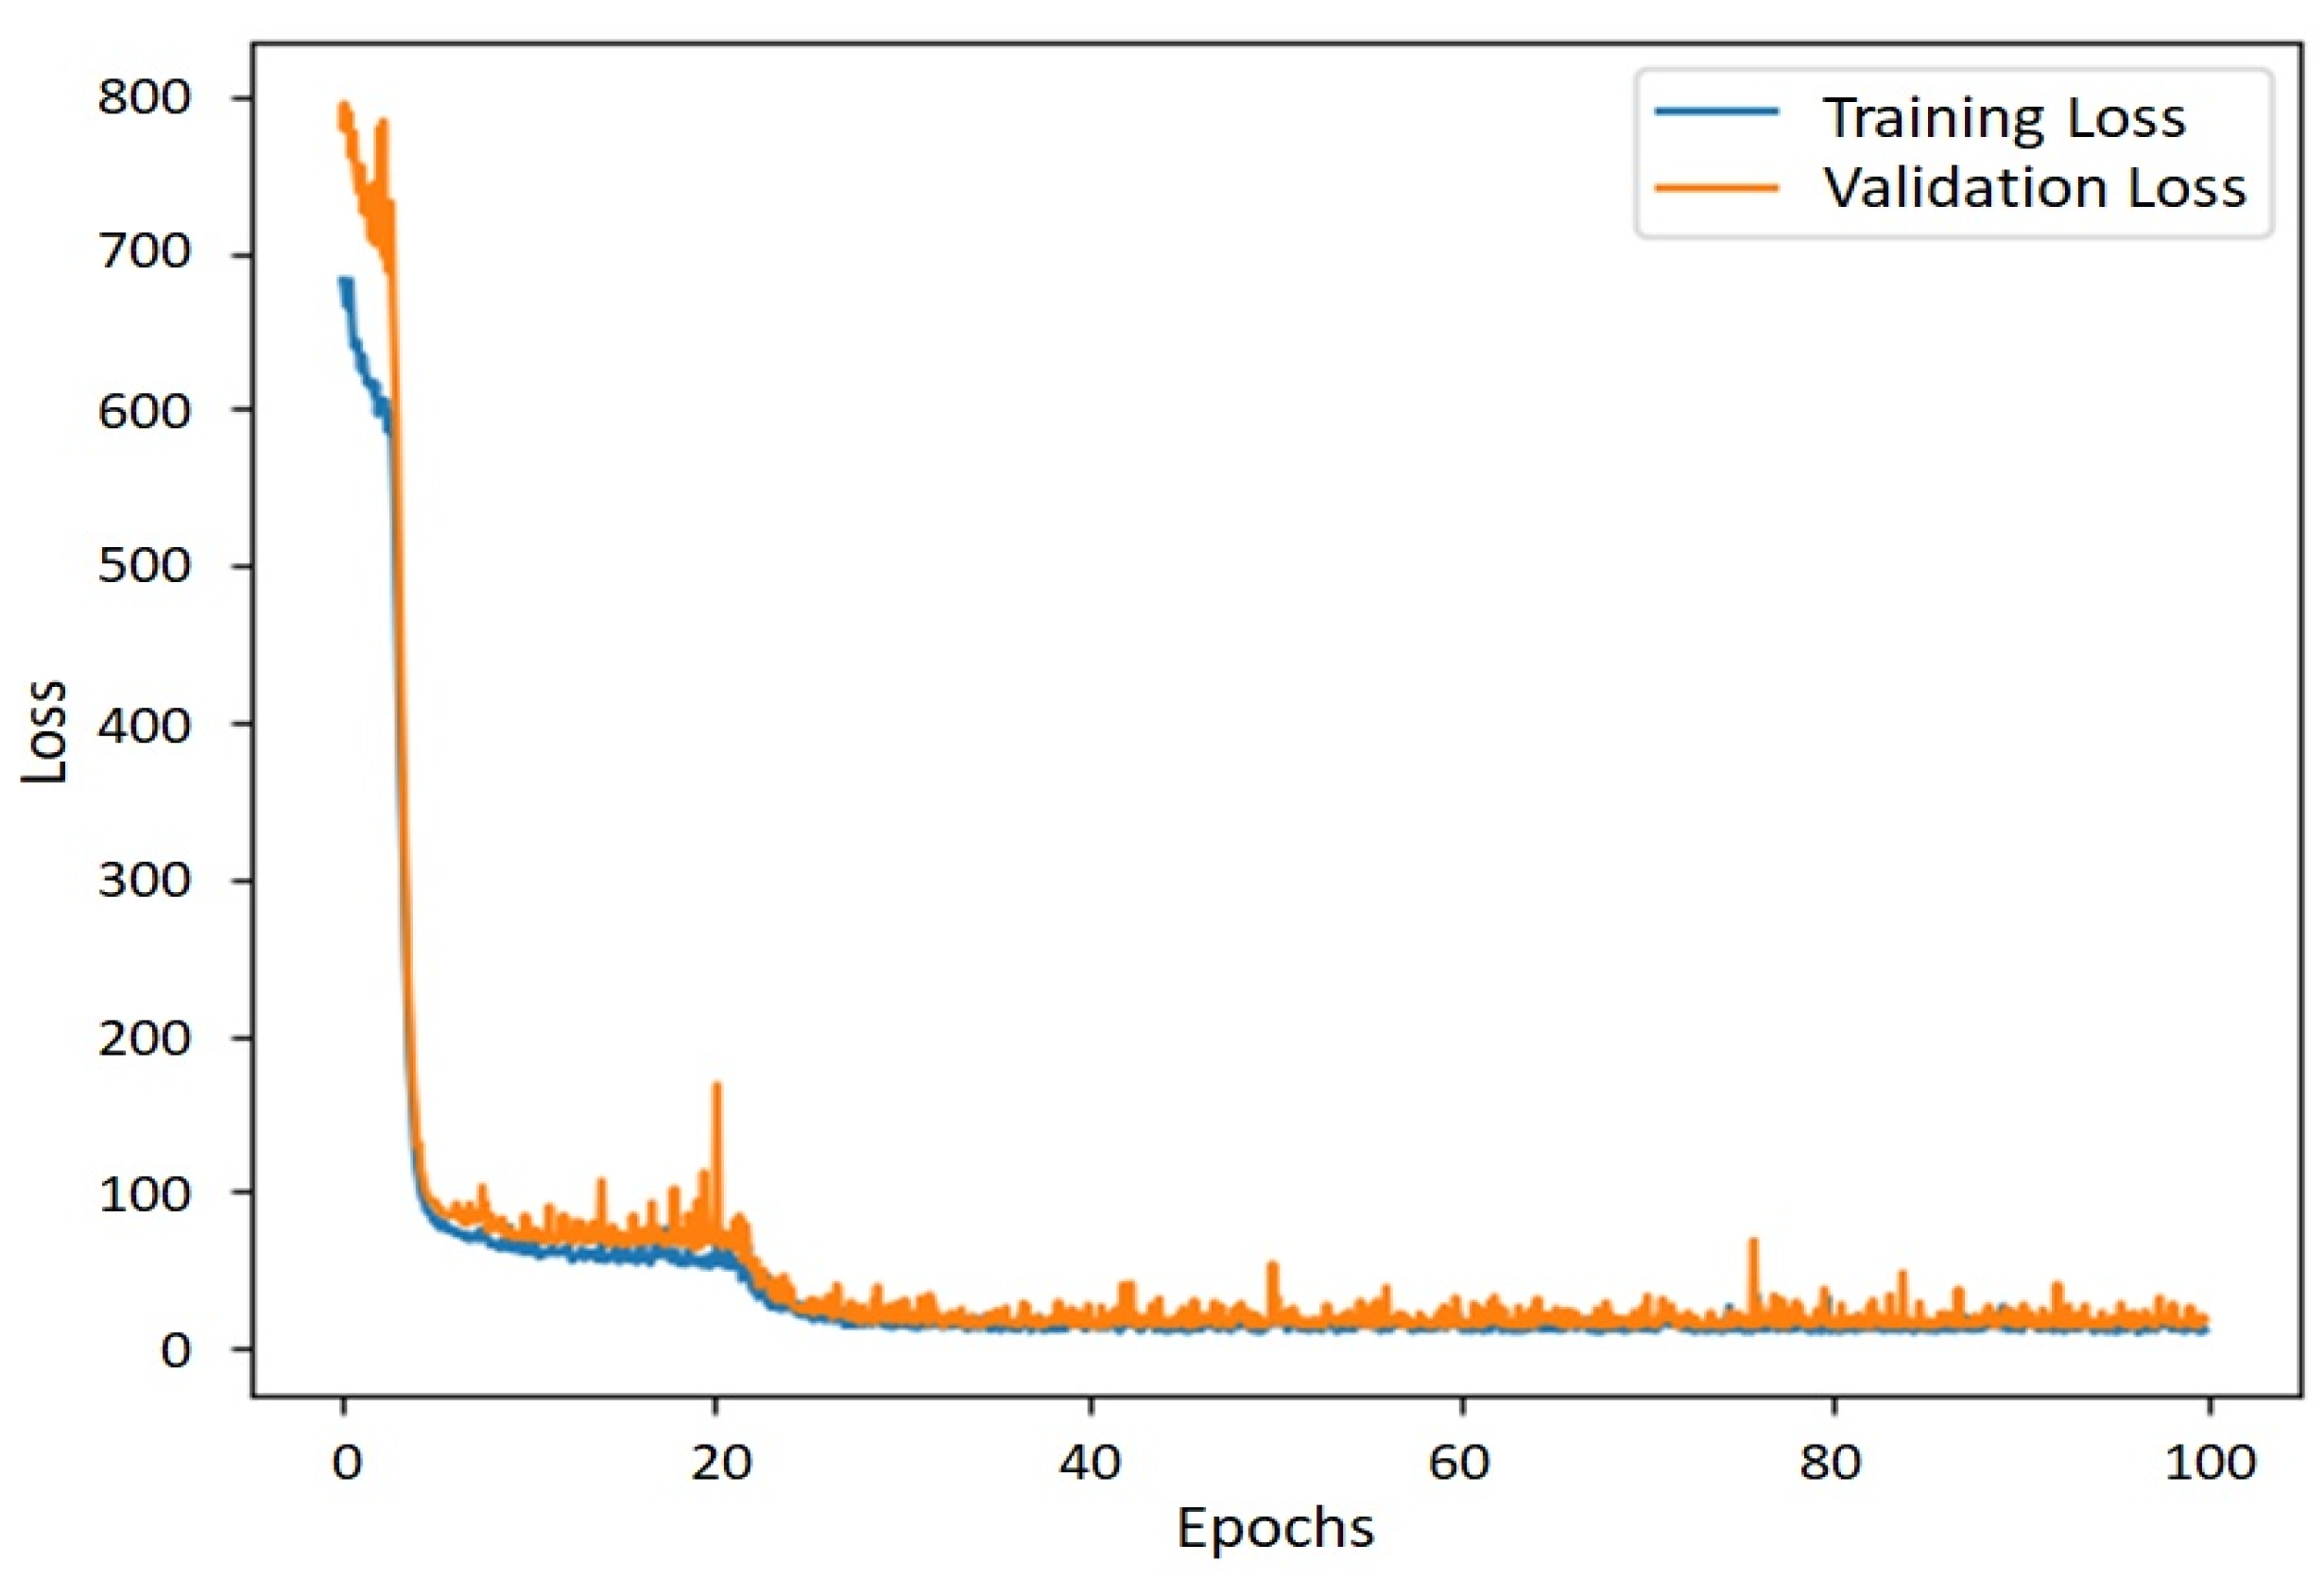
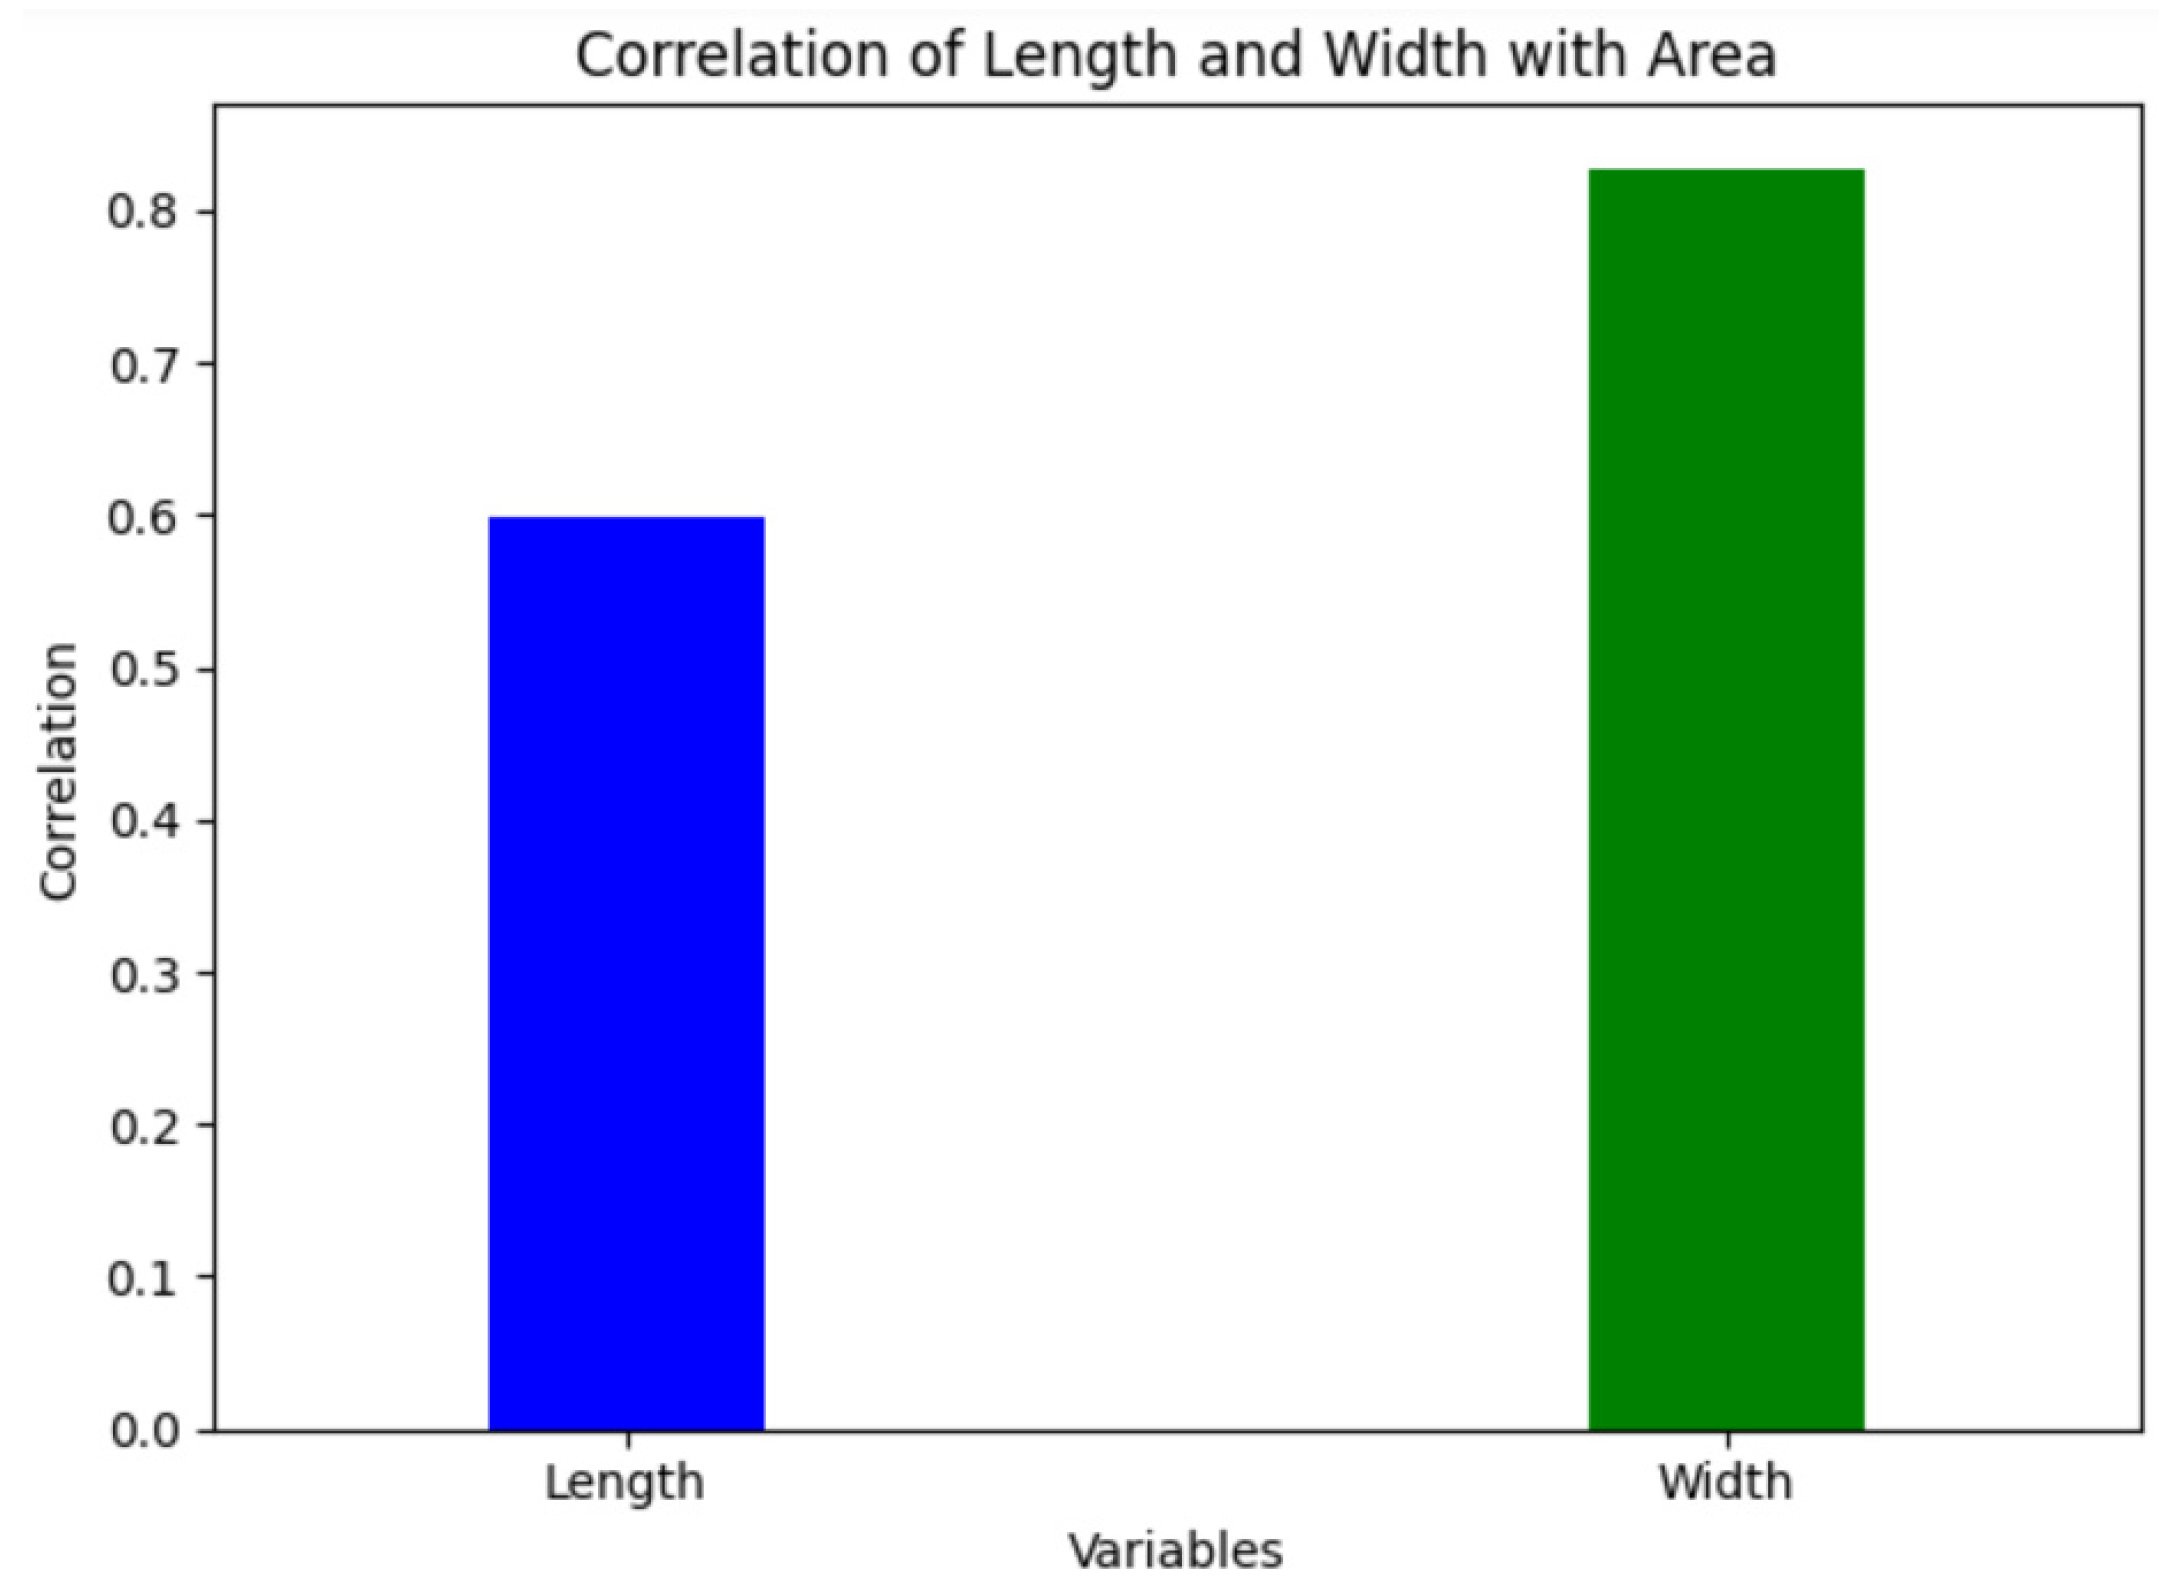
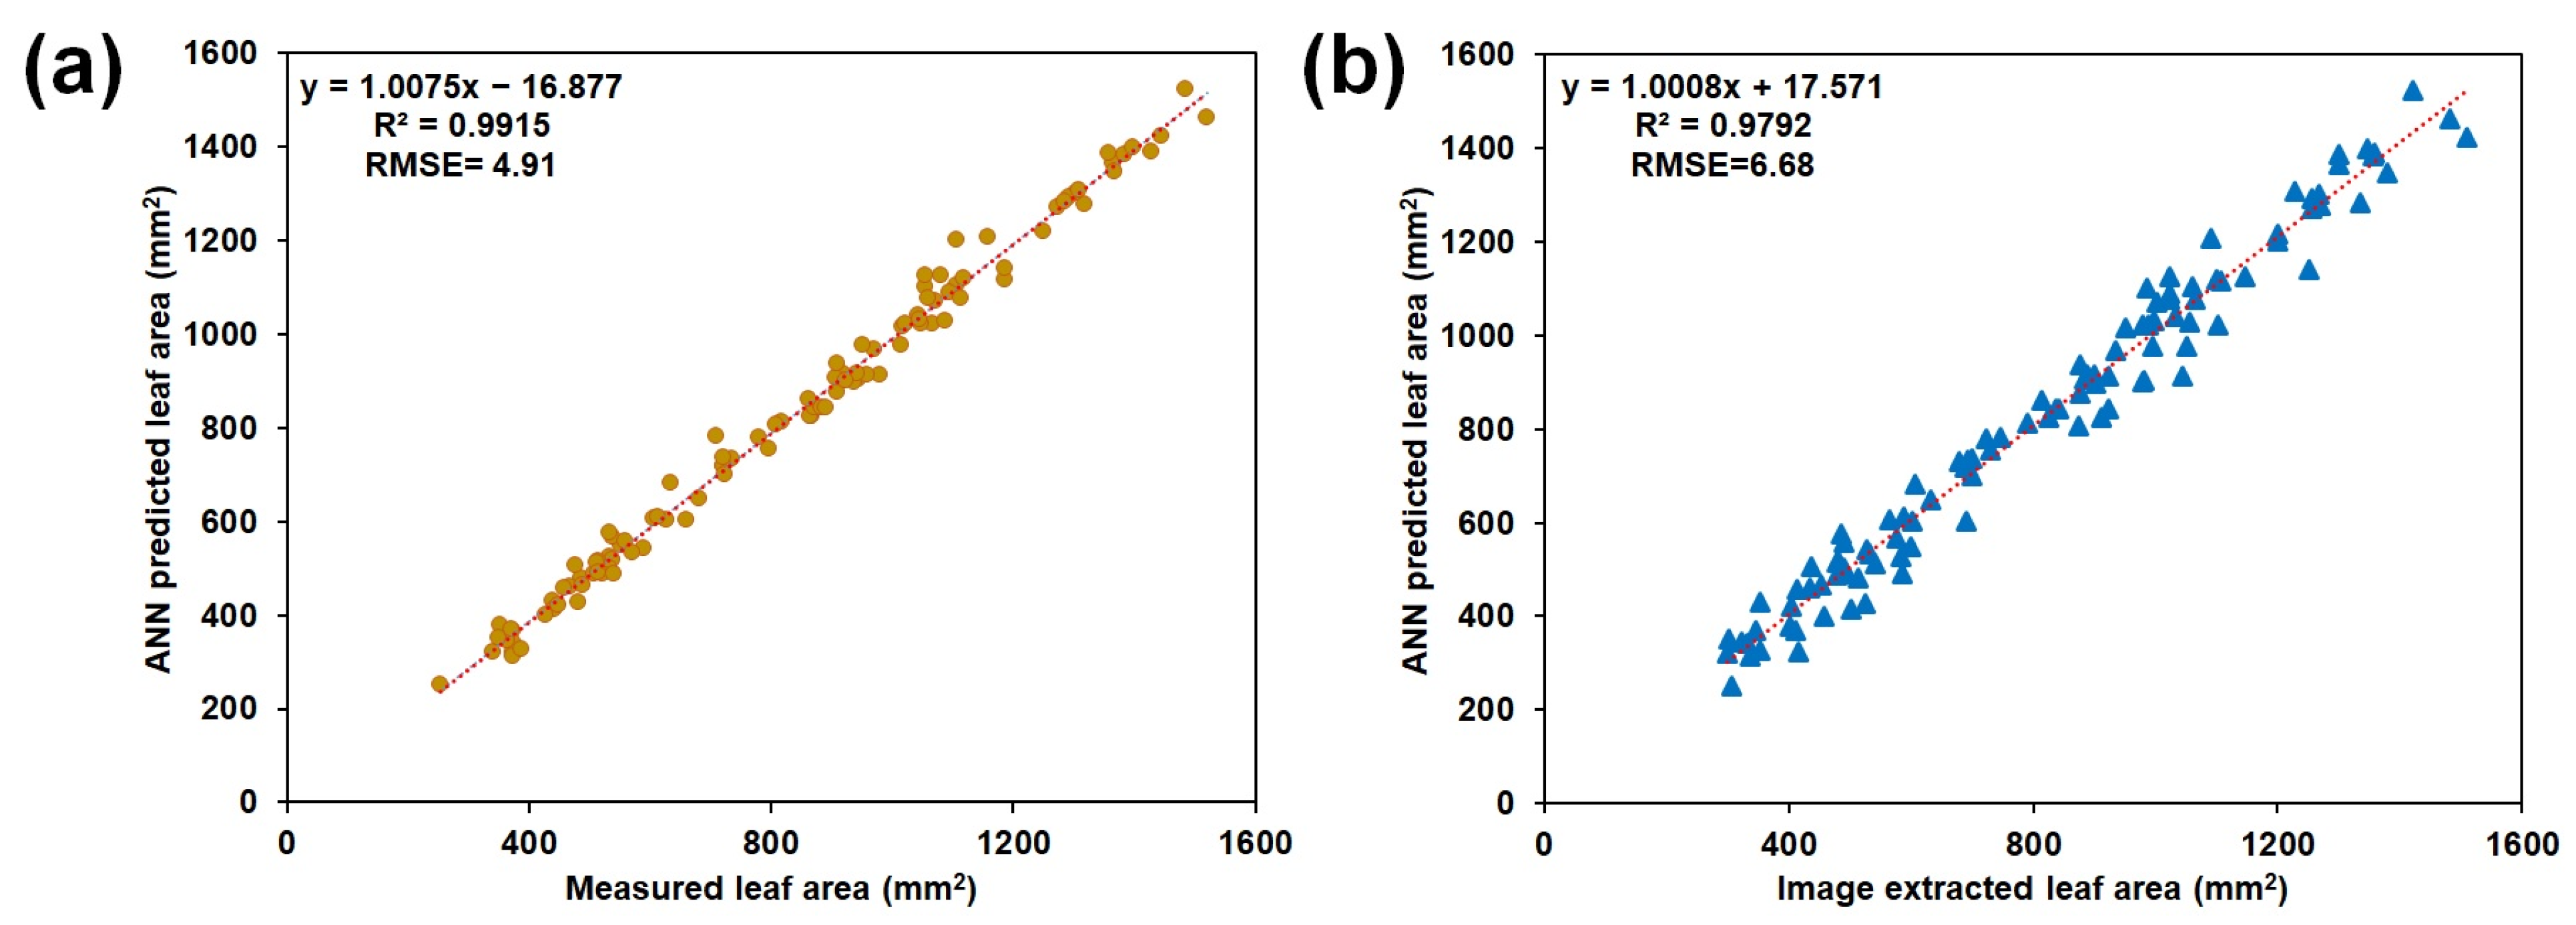
3.2. Leaf Area Estimation Using ANN Model

The means, standard deviations, and the minimum and maximum values of the input and output data used for model building are shown in Table 4. The initial step in modeling the pennywort leaf area involved applying the ANN method. To construct and validate the model, the complete dataset of 1320 samples was randomly partitioned into two segments: 70% for training (924 leaves) and 30% for testing (396 leaves).
The ANN underwent training for 100 epochs, with an iteration of 1000 and a batch size of 32, encompassing the entire dataset. The training and validation loss of 100 epochs is shown in Figure 8. A summary of the ANN and the results of the trained and tested ANN model are presented in Table 5. The R2 and MAPE values range between 96.4 to 97.1% and 6.33 to 6.59, respectively. From the results, it was observed that there is a 97.1% correlation in the training phase and a 96.6% correlation in the testing phase between the actual and estimated leaf areas (Table 5). These results also showed the good generalization capacity of the network [62]. As the MAPE values were less than 10%, this estimation model was ascertained to have a high degree of accuracy [63]. A sensitivity analysis was conducted to assess the individual contributions of each input variable to the output variable. The findings revealed that leaf length accounted for 59.89% of the network’s output, while leaf width contributed 82.774% to the network’s overall output. Figure 9 illustrates the proportional impact of the two inputs on the ANN model.
Further analysis, specifically classifying groups based on leaf size, demonstrated that the ANN consistently performed better than the image processing method in terms of accuracy. The statistical significance was substantiated by a p-value of 0.029, obtained from Welch’s test for mean differences (one-way ANOVA), indicating a significantly higher accuracy in individual leaf area estimation compared to the image processing method. Refer to Table 6 for a detailed presentation of these findings.
In the comparative analysis, the ANN model demonstrated clear superiority over the image processing method. Assessing based on established criteria, the ANN model consistently showcased higher R2 values (>0.99) and lower errors (RMSE: ≤4.91), contrasting with the image processing method, which yielded an R2 of 0.98 and higher errors (RMSE: ≤6.68). These findings distinctly indicate the superior accuracy of the ANN model over the image processing method, as shown in Figure 10. Studies [64,65] utilized ANNs with architectures like 2-50-1 and 2-3-1, achieving accuracy rates of 99.99% and high correlation (>0.98) for estimating leaf area in various plant species, including wheat, triticale, durum, and sesame. Another study [66] compared methods like ANN, adaptive neuro-fuzzy inference system, and regression, reporting accuracy ranges of 97–99% for cereals. Additionally, the study [67] assessed basic ANN, ANFIS, and regression methods, affirming the potential of ANNs in precise leaf area estimation based on leaf characteristics. The proposed study showed similar approaches with higher correlation and accuracy. This approach demonstrates the potential of ANN in predicting leaf area based on leaf characteristics. Given their capacity to capture non-linear relationships between input and output values, ANN models performed better than image processing models in explaining greater variability and demonstrating a higher accuracy in estimating leaf area.
Furthermore, ANN models play an important role in interpreting the intricate relationship between leaf area development and diverse environmental conditions. The actual leaf area observed about leaf length and width, exhibited irregularities. These irregularities could be linked to diverse morphotypes among pennyworth plants, complicating measurements and leading to both underestimations and overestimations. Conversely, the utilization of the ANN model offered a more consistent estimation of leaf area, providing a more regular and reliable assessment despite the variations inherent in the plant morphologies [63]. Implementing ANN and image processing for field-based leaf area prediction requires a standardized, diverse dataset. Choose a suitable ANN architecture for real-world applications and deploy the trained model on field devices like smartphones or web applications for effective real-time predictions. Continuous monitoring and updates ensure optimal performance across various plant species and shapes, facilitating informed plant growth management decisions.

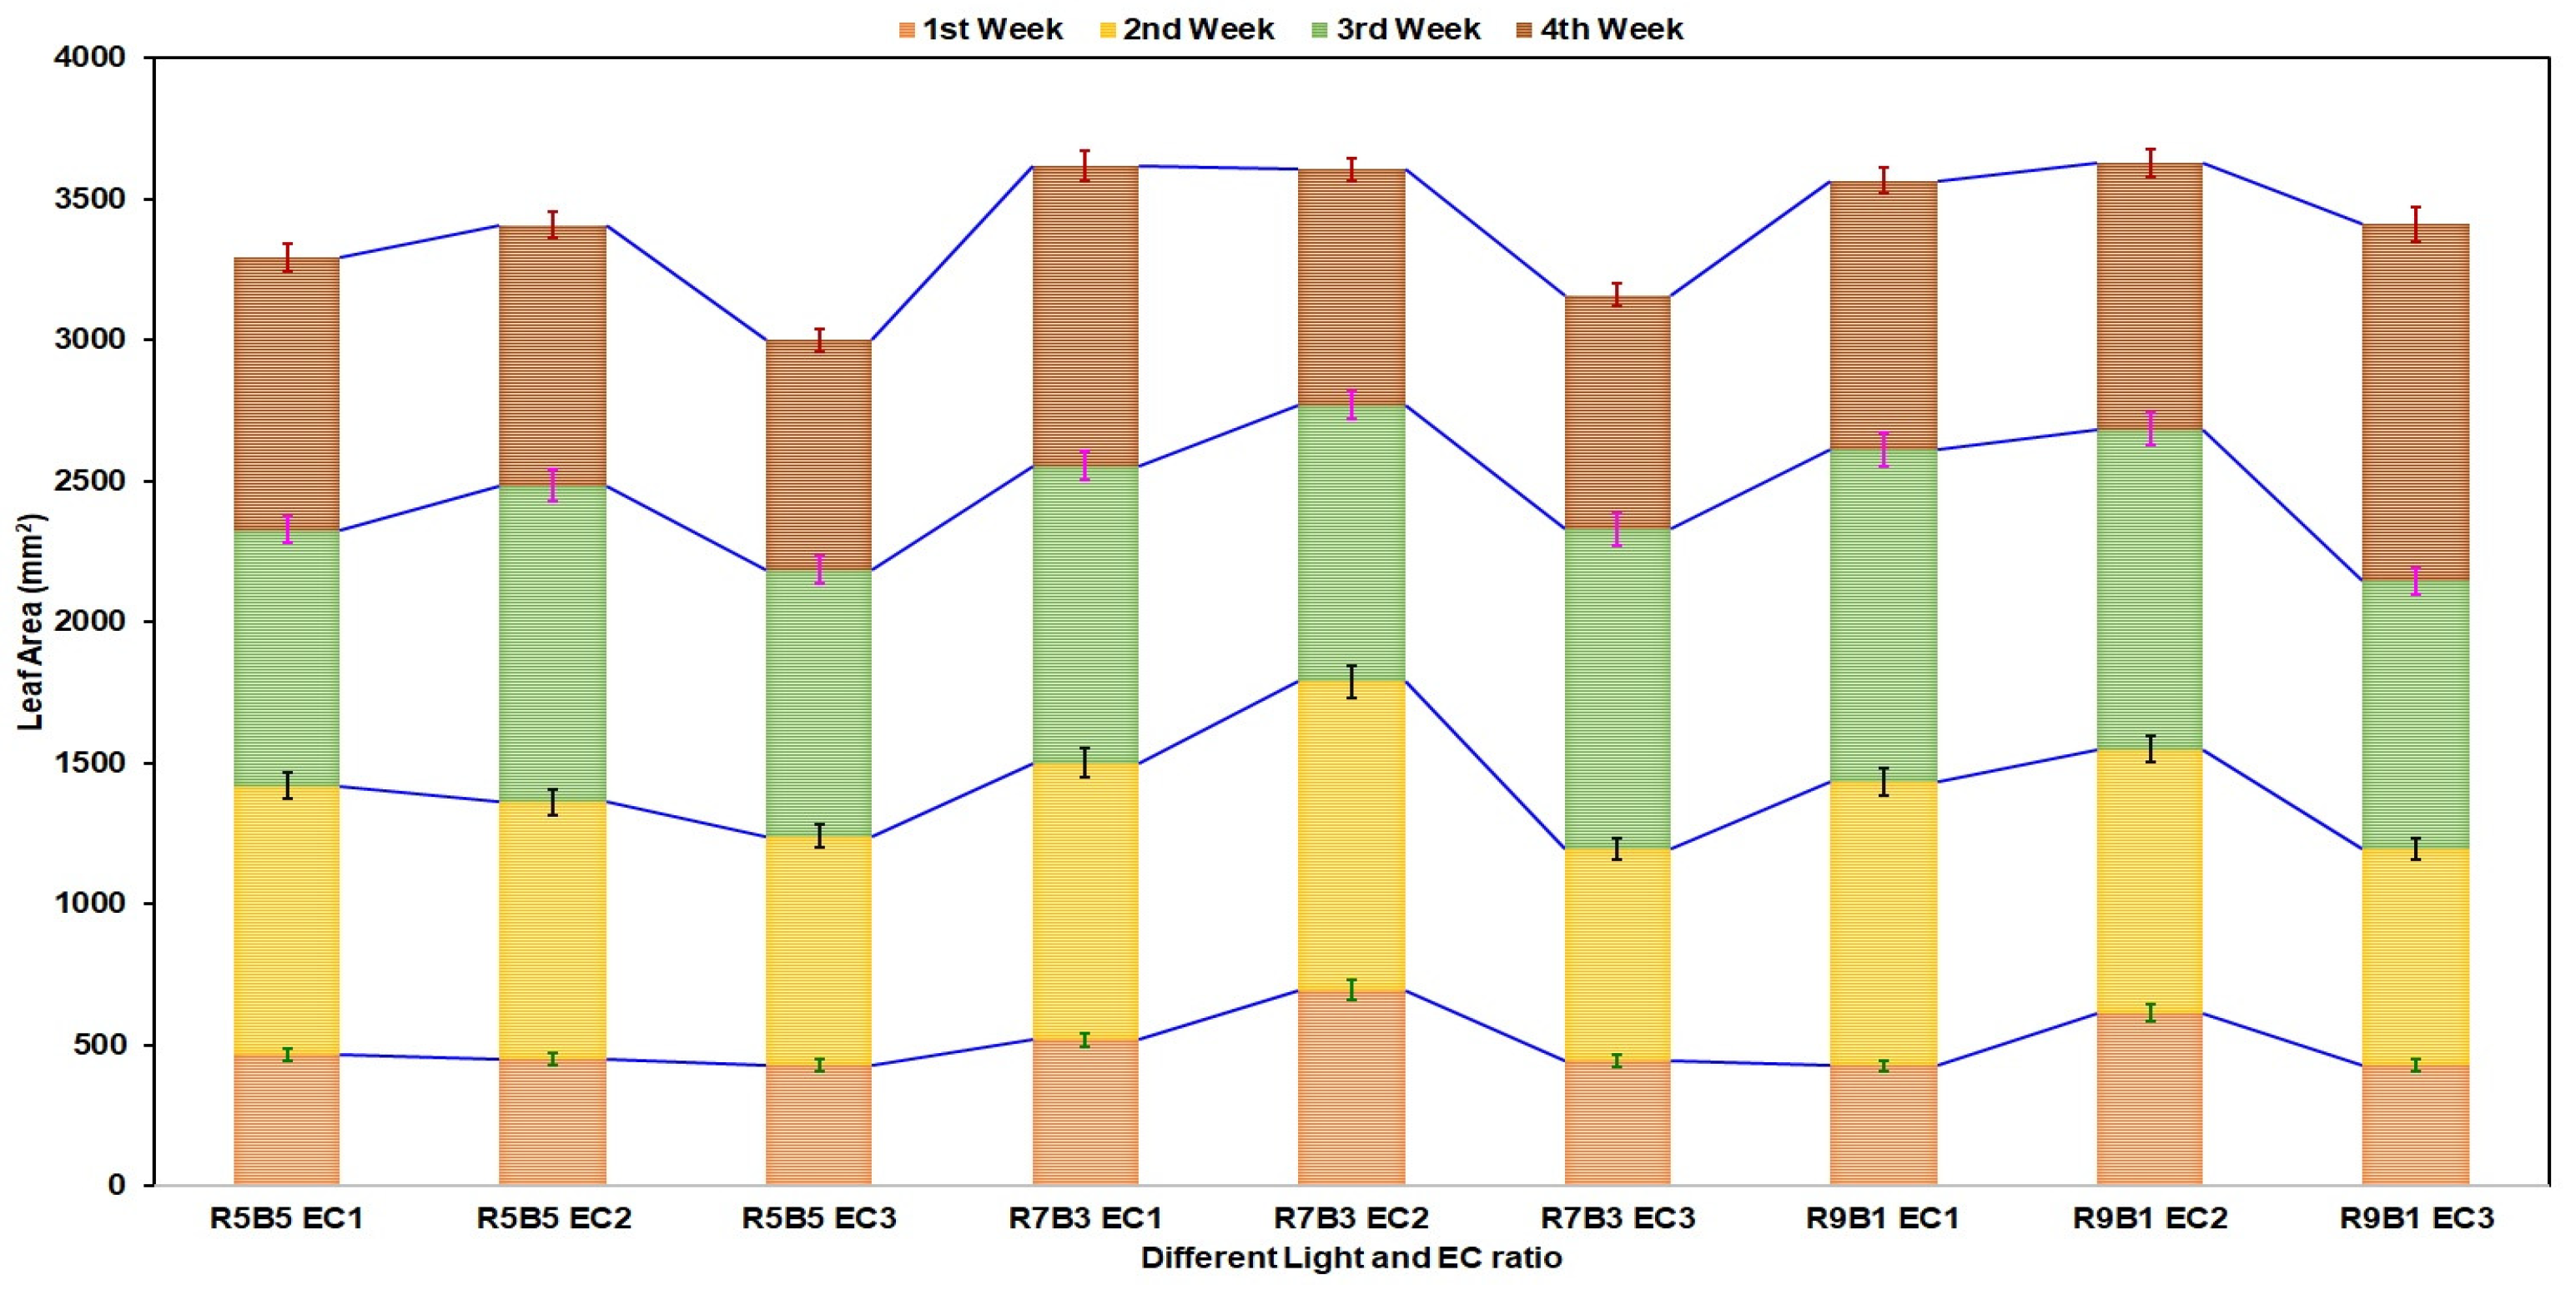
3.3. Effect of Light and Nutrients on Leaf Area

Figure 11 shows the varying leaf area across the growth period under different LED light combinations and three EC conditions. The R70:B30 LED light ratio with nutrient level 2 (2.0 dS·m−1) facilitated the most favorable growth for pennywort plants. In different weeks, the growth status can be forecasted based on the leaf area estimation and monitoring. Different light combinations and EC affected the plant growth and development.
There is limited study on the effect of the combination of red and blue LED light with EC on leaf area in pennywort plants. However, studies on other plant species shed light on the effects of red and blue LED light on leaf characteristics. For instance, Nair et al. (2021) [68] highlighted that an increased ratio of blue to red light positively influenced the growth and leaf biomass of large-leaf pennywort (Hydrocotyle bonariensis). Additionally, research by Zheng and Van Labeke (2017) [69] demonstrated that blue light influenced the leaf thickness of medicinal plants like dicot (Ficus benjamina) and dicot (Sinningia speciosa) varieties. In various plant species such as peppers, cucumbers, and lettuce, the addition of blue light to the light spectrum has been observed to augment leaf area compared to growth under red or other light spectra [70]. Studies on lettuce [71], revealed that specific light combinations, such as high-energy blue and low-energy far-red light, influenced the number and expansion of individual leaves. Moreover, in tomato plantlets, research [72] indicated that different combinations of red and blue LED light affected growth characteristics and pigment content. Optimal ratios of red to blue light, however, varied based on plant species and growth conditions. This variability underscores the need for further investigation to determine the ideal red-to-blue LED light ratios for different plant species and diverse growth conditions.
This study presented a first approach for the non-destructive estimation of leaf area in pennywort plants cultivated under varying light and nutrient conditions within a controlled plant factory using an artificial neural network model. The estimated leaf area values derived from the ANN closely align with the actual measurements, indicating a high level of accuracy and reliability in the model’s predictions. One of the strengths of the proposed ANN prediction model is its simplicity and speed. It relies solely on easily obtainable leaf length and width measurements, eliminating the necessity for expensive or specialized instruments. This streamlined approach facilitates swift and straightforward data collection, making it highly accessible for all researchers.
Furthermore, the non-destructive nature of this method is a significant advantage. It allows for repeated measurements on the same leaves over time without causing any harm to the plant, enabling longitudinal studies and the tracking of changes in leaf area under varying growth conditions. This capability enhances the feasibility and precision of research in controlled environments, offering a valuable tool for ongoing and detailed plant growth assessments.

4. Conclusions

This study aimed to develop and compare a leaf area prediction model for pennywort plants in a controlled environment. It evaluated both an image processing technique and an ANN model using measured data. The image processing method demonstrated a solid correlation (R2 of 0.98) with the measured data, while the ANN model performed better, showing robust accuracy in predicting leaf area. The ANN displayed significant performance, achieving 97.1% correlation in training and 96.6% in testing. The sensitivity analysis emphasized the significant impact of leaf length (59.89%) and leaf width (82.774%) on the output of the ANN model. Moreover, the ANN consistently surpassed the image processing method in terms of accuracy, validated by a higher p-value of 0.029. Monitoring the leaf area under different LED light combinations and three EC conditions revealed that the R70:B30 LED light ratio with nutrient level 2 (2.0 dS·m−1) fostered the most favorable growth for the pennywort plants. Acknowledging the high accuracy and reliability of the ANN model, the study identified limitations in addressing irregularities stemming from diverse plant morphologies. Future studies could refine the ANN model to accommodate these variations, ensuring even more precise predictions. Additionally, considering the impact of environmental conditions, further research into determining optimal red-to-blue LED light ratios for different plant species and varied growth conditions could significantly advance our understanding of environmental influences on leaf area.

Author Contributions

Conceptualization, M.N.R., M.C. and S.-O.C.; methodology, M.N.R. and S.-O.C.; software, M.N.R. and M.C.; validation, M.N.R., M.C., S.I., M.S.N.K. and S.U.P.; formal analysis, M.N.R., S.I., S.U.P., G.-J.L. and J.C.; investigation, G.-J.L., J.C. and S.-O.C.; resources, S.-O.C.; data curation, M.N.R., S.I. and S.U.P.; writing—original draft preparation, M.N.R.; writing—review and editing, M.C., M.S.N.K., G.-J.L. and S.-O.C.; visualization, M.S.N.K., S.U.P. and J.C.; supervision, S.-O.C.; project administration, G.-J.L.; funding acquisition, G.-J.L. All authors have read and agreed to the published version of the manuscript.

Funding

This work was supported by the National Research Foundation of Korean Grant 2021 funded by the Korean Government (MOE).

Data Availability Statement

Data are contained within the article.

Conflicts of Interest

The authors declare no conflict of interest.

References

  1. Arora, D.; Kumar, M.; Dubey, S.D. Centella asiatica—A Review of It’s Medicinal Uses and Pharmacological Effects. J. Nat. Remedies 2002, 2, 143–149. [Google Scholar]
  2. Seevaratnam, V.; Banumathi, P.; Premalatha, M.R.; Sundaram, S.P.; Arumugam, T. Functional properties of Centella asiatica (L.): A review. Int. J. Pharm. Pharm. Sci. 2012, 4, 8–14. [Google Scholar]
  3. Das, A.J. Review on Nutritional, Medicinal and Pharmacological Properties of Centella asiatica (Indian penny-wort). J. Biol. Act. Prod. Nat. 2011, 1, 216–228. [Google Scholar] [CrossRef]
  4. Rattanachaikunsopon, P.; Phumkhachorn, P. Use of Asiatic Pennywort Centella asiatica Aqueous Extract as a Bath Treatment to Control Columnaris in Nile Tilapia. J. Aquat. Anim. Health 2010, 22, 14–20. [Google Scholar] [CrossRef] [PubMed]
  5. Singh, S.; Gautam, A.; Sharma, A.; Batra, A. Centella asiatica (L.): A plant with immense medicinal potential but threat-ened. Int. J. Pharm. Sci. Rev. Res. 2010, 4, 9–17. [Google Scholar]
  6. Yasurin, P.; Sriariyanun, M.; Phusantisampan, T. Review: The Bioavailability Activity of Centella asiatica. Appl. Sci. Eng. Prog. 2016, 9, 1–9. [Google Scholar] [CrossRef]
  7. Subathra, M.; Shila, S.; Devi, M.A.; Panneerselvam, C. Emerging role of Centella asiatica in improving age-related neurological antioxidant status. Exp. Gerontol. 2005, 40, 707–715. [Google Scholar] [CrossRef]
  8. Jensen, M.H. Controlled Environment Agriculture in Deserts, Tropics and Temperate Regions—A World Review. Acta Hortic. 2002, 578, 19–25. [Google Scholar] [CrossRef]
  9. Chowdhury, M.; Kiraga, S.; Islam, M.N.; Ali, M.; Reza, M.N.; Lee, W.H.; Chung, S.O. Effects of Temperature, Relative Humidity, and Carbon Dioxide Concentration on Growth and Glucosinolate Content of Kale Grown in a Plant Factory. Foods 2021, 10, 1524. [Google Scholar] [CrossRef]
  10. Kozai, T.; Niu, G. Chapter 4—Plant Factory as a Resource-Efficient Closed Plant Production System. In Plant Factory; Kozai, T., Niu, G., Takagaki, M., Eds.; Academic Press: San Diego, CA, USA, 2016; pp. 69–90. [Google Scholar] [CrossRef]
  11. Kozai, T.; Niu, G.; Masabni, J.G. Plant Factory Basics, Applications and Advances; Elsevier: Amsterdam, The Netherlands, 2021. [Google Scholar]
  12. Merrill, B.F.; Lu, N.; Yamaguchi, T.; Takagaki, M.; Maruo, T.; Kozai, T.; Yamori, W. Next evolution of agriculture: A review of innovations in plant factories. Handb. Photosynth. 2018, 3, 723–740. [Google Scholar]
  13. Chowdhury, M.; Jang, B.E.; Kabir, M.S.N.; Kim, Y.J.; Na, K.D.; Park, S.B.; Chung, S.O. Factors affecting the accuracy and precision of ion-selective electrodes for hydroponic nutrient supply systems. Acta Hortic. 2020, 1296, 997–1004. [Google Scholar] [CrossRef]
  14. Jones, J.B., Jr. Hydroponics: A Practical Guide for the Soilless Grower; CRC Press: Boca Raton, FL, USA, 2016. [Google Scholar]
  15. Khan, F.A. A review on hydroponic greenhouse cultivation for sustainable agriculture. Int. J. Agric. Environ. Food Sci. 2018, 2, 59–66. [Google Scholar] [CrossRef]
  16. Cho, W.J.; Kim, H.J.; Jung, D.H.; Kim, D.W.; Ahn, T.I.; Son, J.E. On-site ion monitoring system for precision hydroponic nutrient management. Comput. Electron. Agric. 2018, 146, 51–58. [Google Scholar] [CrossRef]
  17. Chowdhury, M.; Islam, M.N.; Reza, M.N.; Ali, M.; Rasool, K.; Kiraga, S.; Lee, D.H.; Chung, S.O. Sensor-based nutrient recirculation for aeroponic lettuce cultivation. J. Biosyst. Eng. 2021, 46, 81–92. [Google Scholar] [CrossRef]
  18. Chowdhury, M.; Kabir, M.S.N.; Kim, H.T.; Chung, S.O. Method of pump, pipe, and tank selection for aeroponic nutrient management systems based on crop requirements. J. Agric. Eng. 2020, 51, 119–128. [Google Scholar] [CrossRef]
  19. Jung, D.H.; Kim, H.J.; Choi, G.L.; Ahn, T.I.; Son, J.E.; Sudduth, K.A. Automated lettuce nutrient solution management using an array of ion-selective electrodes. Trans. ASABE 2015, 58, 1309–1319. [Google Scholar]
  20. Basso, B.; Cammarano, D.; Carfagna, E. Review of crop yield forecasting methods and early warning systems. In Proceedings of the First Meeting of the Scientific Advisory Committee of the Global Strategy to Improve Agricultural and Rural Statistics, FAO Headquarters, Rome, Italy, 18–19 July 2013; p. 19. [Google Scholar]
  21. Hachicha, M.; Kallel, A.; Louati, M. Prediction of plant growth based on statistical methods and remote sensing data. J. Appl. Remote Sens. 2021, 15, 042410. [Google Scholar] [CrossRef]
  22. Horie, T.; Yajima, M.; Nakagawa, H. Yield forecasting. Agric. Syst. 1992, 40, 211–236. [Google Scholar] [CrossRef]
  23. Rizkiana, A.; Nugroho, A.P.; Irfan, M.A.; Sutiarso, L.; Okayasu, T. Crop growth prediction model at vegetative phase to support the precision agriculture application in plant factory. AIP Conf. Proc. 2019, 2202, 020104. [Google Scholar] [CrossRef]
  24. Islam, S.; Reza, M.N.; Chowdhury, M.; Islam, M.N.; Ali, M.; Kiraga, S.; Chung, S.O. Image processing algorithm to estimate ice-plant leaf area from RGB images under different light conditions. IOP Conf. Ser. Earth Environ. Sci. 2021, 924, 012013. [Google Scholar] [CrossRef]
  25. Chaudhary, P.; Godara, S.; Cheeran, A.N.; Chaudhari, A.K. Fast and accurate method for leaf area measurement. Int. J. Comput. Appl. 2012, 49, 22–25. [Google Scholar] [CrossRef]
  26. Easlon, H.M.; Bloom, A.J. Easy Leaf Area: Automated digital image analysis for rapid and accurate measurement of leaf area. Appl. Plant Sci. 2014, 2, 1400033. [Google Scholar] [CrossRef] [PubMed]
  27. Tech, A.R.B.; da Silva, A.L.C.; Meira, L.A.; de Oliveira, M.E.; Pereira, L.E.T. Methods of image acquisition and software development for leaf area measurements in pastures. Comput. Electron. Agric. 2018, 153, 278–284. [Google Scholar] [CrossRef]
  28. Hajjdiab, H.; Obaid, A. A vision-based approach for nondestructive leaf area estimation. In Proceedings of the 2010 The 2nd Conference on Environmental Science and Information Application Technology, Wuhan, China, 17–18 July 2010; pp. 53–56. [Google Scholar] [CrossRef]
  29. Lü, C.; Ren, H.; Zhang, Y.; Shen, Y. Leaf area measurement based on image processing. In Proceedings of the 2010 International Conference on Measuring Technology and Mechatronics Automation, Changsha, China, 13–14 March 2010; Volume 2, pp. 580–582. [Google Scholar] [CrossRef]
  30. Patil, S.B.; Bodhe, S.K. Betel leaf area measurement using image processing. Int. J. Comput. Sci. Eng. 2011, 3, 2656–2660. [Google Scholar]
  31. Prasad, A.; Prakash, O.; Mehrotra, S.; Khan, F.; Mathur, A.K.; Mathur, A. Artificial neural network-based model for the prediction of optimal growth and culture conditions for maximum biomass accumulation in multiple shoot cultures of Centella asiatica. Protoplasma 2017, 254, 335–341. [Google Scholar] [CrossRef] [PubMed]
  32. Nagano, S.; Moriyuki, S.; Wakamori, K.; Mineno, H.; Fukuda, H. Leaf-movement-based growth prediction model using optical flow analysis and machine learning in plant factory. Front. Plant Sci. 2019, 10, 227. [Google Scholar] [CrossRef] [PubMed]
  33. Van Klompenburg, T.; Kassahun, A.; Catal, C. Crop yield prediction using machine learning: A systematic literature review. Comput. Electron. Agric. 2020, 177, 105709. [Google Scholar] [CrossRef]
  34. Khan, T.; Sherazi, H.H.R.; Ali, M.; Letchmunan, S.; Butt, U.M. Deep Learning-Based Growth Prediction System: Use Case of China Agriculture. Agronomy 2021, 11, 1551. [Google Scholar] [CrossRef]
  35. Yue, Y.; Li, J.H.; Fan, L.F.; Zhang, L.L.; Zhao, P.F.; Zhou, Q.; Wang, N.; Wang, Z.Y.; Huang, L.; Dong, X.H. Prediction of maize growth stages based on deep learning. Comput. Electron. Agric. 2020, 172, 105351. [Google Scholar] [CrossRef]
  36. Dou, H.; Niu, G.; Gu, M.; Masabni, J.G. Effects of Light Quality on Growth and Phytonutrient Accumulation of Herbs under Controlled Environments. Horticulturae 2017, 3, 36. [Google Scholar] [CrossRef]
  37. Lanoue, J.; St. Louis, S.; Little, C.; Hao, X. Continuous lighting can improve yield and reduce energy costs while increasing or maintaining nutritional contents of microgreens. Front. Plant Sci. 2022, 13, 983222. [Google Scholar] [CrossRef] [PubMed]
  38. Zhou, J.; Li, P.; Wang, J.; Fu, W. Growth, photosynthesis, and nutrient uptake at different light intensities and temperatures in lettuce. HortScience 2019, 54, 1925–1933. [Google Scholar] [CrossRef]
  39. Daud, Z.M.; Ismail, M.F.; Hakiman, M. Effects of LED Red and Blue Spectra Irradiance Levels and Nutrient Solution EC on the Growth, Yield, and Phenolic Content of Lemon Basil (Ocimum citriodurum Vis.). Horticulturae 2023, 9, 416. [Google Scholar] [CrossRef]
  40. Chowdhury, M.; Gulandaz, M.A.; Islam, S.; Reza, M.N.; Ali, M.; Islam, M.N.; Park, S.U.; Chung, S.O. Lighting conditions affect the growth and glucosinolate contents of Chinese kale leaves grown in an aeroponic plant factory. Hortic. Environ. Biotechnol. 2023, 64, 97–113. [Google Scholar] [CrossRef]
  41. Li, Y.; Zheng, Y.; Zheng, D.; Zhang, Y.; Song, S.; Su, W.; Liu, H. Effects of supplementary blue and UV-A LED lights on morphology and phytochemicals of Brassicaceae baby-leaves. Molecules 2020, 25, 5678. [Google Scholar] [CrossRef] [PubMed]
  42. Xu, J.; Guo, Z.; Jiang, X.; Ahammed, G.J.; Zhou, Y. Light regulation of horticultural crop nutrient uptake and utilization. Hortic. Plant J. 2021, 7, 367–379. [Google Scholar] [CrossRef]
  43. Kolatkar, V.; Chhatre, U.; Jawalekar, V. Effect of red, blue and uv light on constituents of Centella asiatica L. urban grown under controlled environment. Psychiatry 2004, 238, 242. [Google Scholar]
  44. Li, K.; Chen, J.; Wei, Q.; Li, Q.; Lei, N. Effects of transgenerational plasticity on morphological and physiological properties of stoloniferous herb Centella asiatica subjected to high/low light. Front. Plant Sci. 2018, 9, 1640. [Google Scholar] [CrossRef]
  45. Nawae, W.; Yoocha, T.; Narong, N.; Paemanee, A.; Ketngamkum, Y.; Romyanon, K.; Toojinda, T.; Tangphatsornruang, S.; Pootakham, W. Transcriptome sequencing revealed the influence of blue light on the expression levels of light-stress response genes in Centella asiatica. PLoS ONE 2021, 16, e0260468. [Google Scholar] [CrossRef]
  46. Priyanka, S.P.; Sujatha, S.; Smitha, G.R.; Suryanarayana, M.A.; Kalaivanan, D. Biomass accumulation, bioactive compounds and nutrient uptake in Centella asiatica (L.) in relation to organic nutrition in open-field and shade. Ind. Crops Prod. 2022, 176, 114352. [Google Scholar] [CrossRef]
  47. Farshana, K.L.; Deepa, P. In vitro salt tolerance induced secondary metabolites production in Abrus precatorius L. Curr. Bot. 2021, 12, 115–120. [Google Scholar]
  48. Ibrahim, M.H.; Shibli, N.I.; Izad, A.A.; Zain, N.A.M. Growth, chlorophyll fluorescence, leaf gas exchange and phytochemicals of Centella asiatica exposed to salinity stress. Annu. Res. Rev. Biol. 2018, 1–13. [Google Scholar] [CrossRef]
  49. Müller, V.; Lankes, C.; Zimmermann, B.F.; Noga, G.; Hunsche, M. Centelloside accumulation in leaves of Centella asiatica is determined by resource partitioning between primary and secondary metabolism while influenced by supply levels of either nitrogen, phosphorus or potassium. J. Plant Physiol. 2013, 170, 1165–1175. [Google Scholar] [CrossRef] [PubMed]
  50. Murugan, K.; Sathish, D.K. Ameliorative effect by calcium on NaCI salinity stress related to proline metabolism in the callus of Centella asiatica L. J. Plant Biochem. Biotechnol. 2005, 14, 205–207. [Google Scholar] [CrossRef]
  51. Pipatsitee, P.; Praseartkul, P.; Theerawitaya, C.; Taota, K.; Tisarum, R.; Singh, H.P.; Cha-um, S. Exogenous NaCl salt elicitor improves centelloside content and physio-morphological adaptations in indian pennywort (Centella asiatica). J. Plant Biochem. Biotechnol. 2021, 31, 777–787. [Google Scholar] [CrossRef]
  52. Chung, S.O.; Kang, S.W.; Bae, K.S.; Ryu, M.J.; Kim, Y.J. The potential of remote monitoring and control of protected crop production environment using mobile phone under 3G and Wi-Fi communication conditions. Eng. Agric. Environ. Food 2015, 8, 251–256. [Google Scholar] [CrossRef]
  53. Mohapatra, P.; Ray, A.; Sandeep, I.S.; Nayak, S.; Mohanty, S. Tissue-Culture-Mediated Biotechnological Inter-vention in Centella asiatica: A Potential Antidiabetic Plant. In Biotechnology of Anti-diabetic Medicinal Plants; Springer: Berlin/Heidelberg, Germany, 2021; pp. 89–116. [Google Scholar]
  54. Solet, J.M.; Simón-Ramiasa, A.; Cosson, L.; Guignard, J.L. Centella asiatica (L.) Urban, (Pennywort): Cell Culture, Production of Terpenoids, and Biotransformation Capacity. In Medicinal and Aromatic Plants X; Springer: Berlin/Heidelberg, Germany, 1998; pp. 81–96. [Google Scholar]
  55. He, J.; Reddy, G.V.P.; Liu, M.; Shi, P. A general formula for calculating surface area of the similarly shaped leaves: Evidence from six Magnoliaceae species. Glob. Ecol. Conserv. 2020, 23, e01129. [Google Scholar] [CrossRef]
  56. Kanan, C.; Cottrell, G.W. Color-to-Grayscale: Does the Method Matter in Image Recognition? PLoS ONE 2012, 7, e29740. [Google Scholar] [CrossRef]
  57. Reza, M.N.; Na, I.S.; Lee, K.H. Automatic Counting of Rice Plant Numbers after Transplanting Using Low Altitude UAV Images. Int. J. Contents 2017, 13, 1–8. [Google Scholar] [CrossRef]
  58. Guerra-Rosas, E.; Álvarez-Borrego, J. Methodology for diagnosing of skin cancer on images of dermatologic spots by spectral analysis. Biomed. Opt. Express 2015, 6, 3876–3891. [Google Scholar] [CrossRef]
  59. Worden, K.; Tsialiamanis, G.; Cross, E.J.; Rogers, T.J. Artificial neural networks. In Machine Learning in Modeling and Simulation: Methods and Applications; Springer International Publishing: Cham, Switzerland, 2023; pp. 85–119. [Google Scholar]
  60. Yang, X.; Yan, J.; Wang, W.; Li, S.; Hu, B.; Lin, J. Brain-inspired models for visual object recognition: An overview. Artif. Intell. Rev. 2022, 55, 5263–5311. [Google Scholar] [CrossRef]
  61. Halagundegowda, G.R.; Singh, A. Multilayer Perceptron Method of Artificial Neural Network for Classification of Farmers Based on Adoption of Drought Coping Mechanisms. Int. J. Pure Appl. Biosci. 2018, 6, 1408–1414. [Google Scholar]
  62. Smith, G.N. Probability and statistics in civil engineering. In Collins Professional and Technical Books; Nichols Publishing Company: Asbury, IA, USA, 1986; p. 244. [Google Scholar]
  63. Kumar, M.K.; Kumar, R.S.; Sankar, V.; Sakthivel, T.; Karunakaran, G.; Tripathi, P.C. Non-destructive estimation of leaf area of durian (Durio zibethinus)—An artificial neural network approach. Sci. Hortic. 2017, 219, 319–325. [Google Scholar] [CrossRef]
  64. Asriani, E. Application of artificial neural network with backpropagation algorithm for estimating leaf area. IOP Conf. Ser. Earth Environ. Sci. 2020, 599, 012046. [Google Scholar] [CrossRef]
  65. Da Silva Ribeiro, J.E.; dos Santos Coêlho, E.; de Oliveira, A.K.S.; da Silva, A.G.C.; Lopes, W.D.A.R.; de Almeida Oliveira, P.H.; da Silveira, L.M. Artificial neural network approach for predicting the sesame (Sesamum indicum L.) leaf area: A non-destructive and accurate method. Heliyon 2023, 9, e17834. [Google Scholar] [CrossRef] [PubMed]
  66. Sabouri, H.; Sajadi, S.J.; Jafarzadeh, M.R.; Rezaei, M.; Ghaffari, S.; Bakhtiari, S. Image processing and prediction of leaf area in cereals: A comparison of artificial neural networks, an adaptive neuro-fuzzy inference system, and regression methods. Crop Sci. 2021, 61, 1013–1029. [Google Scholar] [CrossRef]
  67. Ercanlı, İ.; Günlü, A.; Şenyurt, M.; Keleş, S. Artificial neural network models predicting the leaf area index: A case study in pure even-aged Crimean pine forests from Turkey. For. Ecosyst. 2018, 5, 29. [Google Scholar] [CrossRef]
  68. Nair, I.; Mazumdar, P.; Singh, P.; Rengasamy, N.; Harikrishna, J.A. Increasing the ratio of blue to red light improves growth and phytochemical content in Hydrocotyle bonariensis. Russ. J. Plant Physiol. 2021, 68, 337–346. [Google Scholar] [CrossRef]
  69. Zheng, L.; Van Labeke, M.C. Long-term effects of red-and blue-light emitting diodes on leaf anatomy and photosynthetic efficiency of three ornamental pot plants. Front. Plant Sci. 2017, 8, 917. [Google Scholar] [CrossRef]
  70. Gao, Q.; Liao, Q.; Li, Q.; Yang, Q.; Wang, F.; Li, J. Effects of LED Red and Blue Light Component on Growth and Photosynthetic Characteristics of Coriander in Plant Factory. Horticulturae 2022, 8, 1165. [Google Scholar] [CrossRef]
  71. Muneer, S.; Kim, E.J.; Park, J.S.; Lee, J.H. Influence of green, red and blue light emitting diodes on multiprotein complex proteins and photosynthetic activity under different light intensities in lettuce leaves (Lactuca sativa L.). Int. J. Mol. Sci. 2014, 15, 4657–4670. [Google Scholar] [CrossRef] [PubMed]
  72. Naznin, M.T.; Lefsrud, M.; Azad, M.O.K.; Park, C.H. Effect of Different Combinations of Red and Blue LED Light on Growth Characteristics and Pigment Content of In Vitro Tomato Plantlets. Agriculture 2019, 9, 196. [Google Scholar] [CrossRef]
Figure 1. Prepared plant factory: layout of the whole plant factory (a), layout of each cultivation shelf (b), cultivation shelf for pennywort seedling adaption with hydroponic system and ambient environment (c), and cultivation shelves for experiment with different LED combinations (d).
Horticulturae 09 01346 g001
Figure 2. Pennywort seedling preparation and adaptation: seedlings in the soil pots (a), a separated and cleaned seedling (b), and seedlings moved into the DFT system under fluorescent light for adaptation (c).
Horticulturae 09 01346 g002
Figure 3. Pennywort cultivation: transplantation day (a), four weeks after transplantation under R90:B10 LED combination (b), and plant sample collection under R50:B50 LED combination (c).
Horticulturae 09 01346 g003
Figure 4. Image acquisition system in the plant factory: Intel RealSense D435i camera setup with Raspberry Pi 4B board (a), remote acquisition and monitoring with VNC viewer with Raspberry Pi 4B (b), and plant images with the reference object in the plant factory (c).
Horticulturae 09 01346 g004
Figure 5. (a) The architecture features a 2-4-1 multi-layer perceptron (MLP), where two input neurons (length and width) transmit a pair of features to a hidden layer containing four neurons; (b) the final computations and output generation (leaf area) are handled by a single output neuron.
Horticulturae 09 01346 g005
Figure 6. Image processing steps for the leaf area estimation: (a) RGB image, (b) grayscale image, (c) enhanced grayscale image, (d) binary masking of grayscale image, (e) background segmentation and region filling, (f) leaf contour detection of the segmented image (e), and (g) equalized histogram of image (c).
Horticulturae 09 01346 g006
Figure 7. Correlation between measured leaf area and image estimated leaf area.
Horticulturae 09 01346 g007
Figure 8. Training loss and validation loss curve (learning rate 0.01 and epoch 100).
Horticulturae 09 01346 g008
Figure 9. Proportional impact of the two input variables on the ANN model.
Horticulturae 09 01346 g009
Figure 10. Leaf area prediction: (a) a comparison of the predicted leaf area using ANN and measured value, and (b) a comparison of the predicted leaf area using ANN and image-extracted value.
Horticulturae 09 01346 g010
Figure 11. Estimated leaf area with different light combinations and nutrient conditions in different growth periods.
Horticulturae 09 01346 g011
Table 1. A summary of overall cultivation conditions maintained in the plant factory during pennywort plant cultivation.
ParameterSet ValueSensor UsedSpecification
Temperature (°C)25 ± 1ETH-01DV, ECONARAE, Seoul, Republic of KoreaTemp. meas. range: −40~80 °C
Humi. meas. range: 0–100%
Temp. accuracy: ±0.5
Hum. accuracy: ±2%
Compatible: 3.0~5 V
Humidity (%)65 ± 5
CO2 (ppm)600 ± 100SH-300-DS, SOHA TECH Co., Ltd., Seoul, Republic of KoreaMeasurement: 0 to 2000 ppm
Accuracy: ± 70 ppm
Compatible: 4.5~5.25 V
LED type (R:B)90:10, 70:30, 50:50--
Light intensity
(µmol m−2s−1)
150 ± 10GY-30, ROHM Co., Ltd., Kyoto, JapanRange: 1~65,535 lx
Accuracy: ±20%
Compatible: 3.3 and 5 V
Photoperiod (h)18/6MaxiRex 5QT, Legrand, Republic of Korea-
Cultivation systemDFT and NFT--
EC (dS m−1)1, 2, 3 ± 0.3EC-BTA, Vernier, OR, USARange: 2–2000 dS m−1
Temperature range: 0~80 °C
pH6.50 ± 0.5pH-BTA, Vernier, OR, USARange: 0~14
Temperature range: 5–80 °C
Table 2. Specification of the microcontroller and the camera used in this study.
ParametersSpecificationsParametersSpecifications
Sensor NameRealSense D435iNameRaspberry Pi 4B board
CompanyIntelCompanyRaspberry Pi
SensorGlobal ShutterCPUQuad-core Cortex-A72, 64-bit, 1.8 GHz
Resolution2.0 MPRAM8 GB LPDDR4-3200
Frame Resolution1280 × 720 pixelConnectionStandard 40-pin GPIO header
Frame Rate30 fpsOperating systemLinux based
ControlAutomaticPower supply5 V DC
ConnectionUSB-C 3.1Operating temperature0° to 50 °C
ManufacturerRaspberry Pi Foundation, UK
Table 3. ANN parameters to predict pennywort leaf area.
ParametersValue
Number of neurons in the input layer2
Number of hidden layers1
Number of hidden layers4
Number of output layers1
Learning rate0.01
Maximum number epoch100
Loss functionMean absolute error (MAE)
Activation functionRectified linear unit (ReLu)
Table 4. Descriptive statistics were used in this study.
ParameterMaxMinMean and Standard Deviation
Leaf length (L), mm35.7110.05.4 ± 0.12
Leaf width (D), mm60.4518.011.43 ± 0.26
Leaf area (LA), mm21591.74141.3297.197 ± 6.82
Table 5. Results of ANN model.
ValuesTraining DataTesting Data
RMSE 3.264.53
MAPE6.336.59
MAE1.331.59
R20.970.96
Table 6. Statistical (one-way ANOVA) difference in leaf area between measured and estimated values using image processing and ANN.
Leaf AreaMeanp-Value
Measured
Image processing−116.840.019
ANN−94.140.029
Disclaimer/Publisher’s Note: The statements, opinions and data contained in all publications are solely those of the individual author(s) and contributor(s) and not of MDPI and/or the editor(s). MDPI and/or the editor(s) disclaim responsibility for any injury to people or property resulting from any ideas, methods, instructions or products referred to in the content.

