Article

Identification of Fatty Acid Components and Key Genes for Synthesis during the Development of Pecan Fruit

1
College of Horticulture and Landscape Architecture, Yangzhou University, Yangzhou 225009, China
2
Joint International Research Laboratory of Agriculture and Agri-Product Safety, The Ministry of Education of China, Yangzhou University, Yangzhou 225009, China
*
Author to whom correspondence should be addressed.
Horticulturae 2023, 9(11), 1199; https://doi.org/10.3390/horticulturae9111199
Submission received: 8 October 2023 / Revised: 30 October 2023 / Accepted: 31 October 2023 / Published: 3 November 2023
(This article belongs to the Section Genetics, Genomics, Breeding, and Biotechnology (G2B2))

Abstract

:
Carya illinoinensis (Wangenh.) K. Koch, a species native to North America, is one of the most famous fruit oil trees worldwide. Fatty acids are essential energy storage substances in the human body. Transcriptome sequencing of pecan kernels was used to screen the key genes of fatty acid synthesis in pecan fruit development. The dynamic changes in the fatty acid fractions of the pecan kernels in different periods were analyzed using GC-MS. This study shows that oil accumulation in seeds follows an ‘M’-shaped bimodal curve, according to the proportion of fatty acid components, from big to small, for oleic acid, linoleic acid, palmitic acid, stearic acid, and linolenic acid. A total of 83.82 Gb of clean data was annotated using the RNA-seq of pecan fruits at distinct stages after flowering, 5376 new genes were discovered, and 2761 new genes were annotated in at least one database. SAD and FAD2 were significantly upregulated at 80–95 and 95–110 days, and downregulated at 110–130 days after flowering. These differently expressed genes (DEGs) were enriched in fatty acid biosynthesis, elongation, and concentration. This study aims to reveal the pecan high-oil synthesis mechanism of unsaturated fatty acids for the genetic improvement of pecan in potential genetic resources in order to promote the work of breeding pecan.

1. Introduction

Carya illinoinensis (Wangenh.) K. Koch is a plant of the genus Carya Nutt. in the Juglandaceae family, also named the American pecan or long pecan. The dried fruit product is called Bigen fruit, also known as the longevity fruit, and is currently one of the most famous dried fruit oil species worldwide [1]. North American Indians have eaten pecan for centuries, and it is the only commercially important nut species native to North America [2]. Pecan production, at 122,500 tons, means that it was the sixth-largest tree nut in the world in 2018 [3]. The fruit can be sold whole, in the shell or shelled, or sold as flakes or crushed nuts, of which the kernel is usually used to make desserts, sweets, ice cream, and breakfast cereals [4]. Pecan nuts are rich in unsaturated fatty acids, and eating nuts with skins can also supplement cellulose in the human body [5]. The high content and large proportion of phospholipids and glycerolipids in mature pecan kernels provide a theoretical basis for the processing and utilization of plant and edible oils. The characteristics of being rich in triacylglycerol (TG), phosphatidylcholine, and other lipids in various mature pecan cultivars give them unique potential in food nutrition and health care [6].
Fatty acids (FAs) are a group of aliphatic carboxylic acid compounds composed of carbon, hydrogen, and oxygen. According to whether the hydrocarbon chain is saturated, FAs can be divided into saturated fatty acids (SFAs) and unsaturated fatty acids (UFAs). SFAs have no double-bond unsaturated hydrocarbon chain of. According to the number of unsaturated bonds in their hydrocarbon chain, SFAs can be divided into single unsaturated fatty acids (MUFAs) and polyunsaturated fatty acids (PUFAs). The human body can synthesize MUFAs by itself, but not PUFAs, and human physiology shows that polyunsaturated fatty acids are essential [7]. PUFAs are indispensable vital nutrients in the process of human growth and development. Plant oils and marine creatures are necessary for the human body to obtain PUFA diameters [8]. In higher plants, lipid synthesis can be mainly divided into three stages: First, fatty acids are synthesized in the plastids. Then, free fatty acids are assembled in the endoplasmic reticulum to synthesize TGs. Finally, TGs are encapsulated and bound by oil droplet proteins to form oil droplets, which are stored in the organelles of oil droplets in the form of microsomes. Fatty acids are usually found in plant seeds in the triacylglyceride (TAG) bond form (grease); meanwhile, in no-seed oil crops such as olive (Canarium album) and palm (Trachycarpus fortunei), fatty acids accumulate in the fleshy peel of the fruit [9]. The leaves of plants or other vegetative tissues may also accumulate a small amount of TAG [10]. Fatty acids are energy sources for the human body. Cells use glucose or free fatty acids for phospholipid and sphingolipid biosynthesis. Phospholipids and sheath fat play an essential role in cell signal transduction and are the main elements of the cell membrane [11]. Under low-temperature stress, the cell membrane changes its state from a liquid phase to a gel phase, slowing down the metabolism of the body. Consequently, cold-sensitive plants suffer from injury or death [12]. Additionally, many plant lipids or their metabolic derivatives have certain biological activities, which are closely related to cell recognition, specificity and tissue immunity [13].
Wang used thin-film drilling–vacuum filtration technology [14], and Geng used surfactant and salt-aided aqueous extraction technology to extract walnut oil [15]. Jia used the comparative transcriptome analysis of pecan (female and male inflorescences) to enhance understanding of the gene specialization of flowers of different sexes [16]. However, the genes related to fatty acid synthesis in pecan kernels remain unknown, and there are few studies on the changes in their components during development. In this research, through the identification of ‘Mahan’ pecan fatty acid composition and the changing trends observed in the kernel, RNA-Seq was used to analyze the transcriptome patterns of the ‘Mahan’ kernel at 80 days, 90 days, 110 days, and 130 days after anthesis. The analysis results provide an overview of the complete development process of the ‘Mahan’ pecan in fatty acids into a molecular control network. These differentially expressed genes could be candidate genes for further functional verification, providing potential gene resources for the genetic improvement of pecan and the promotion of pecan breeding work.

2. Materials and Methods

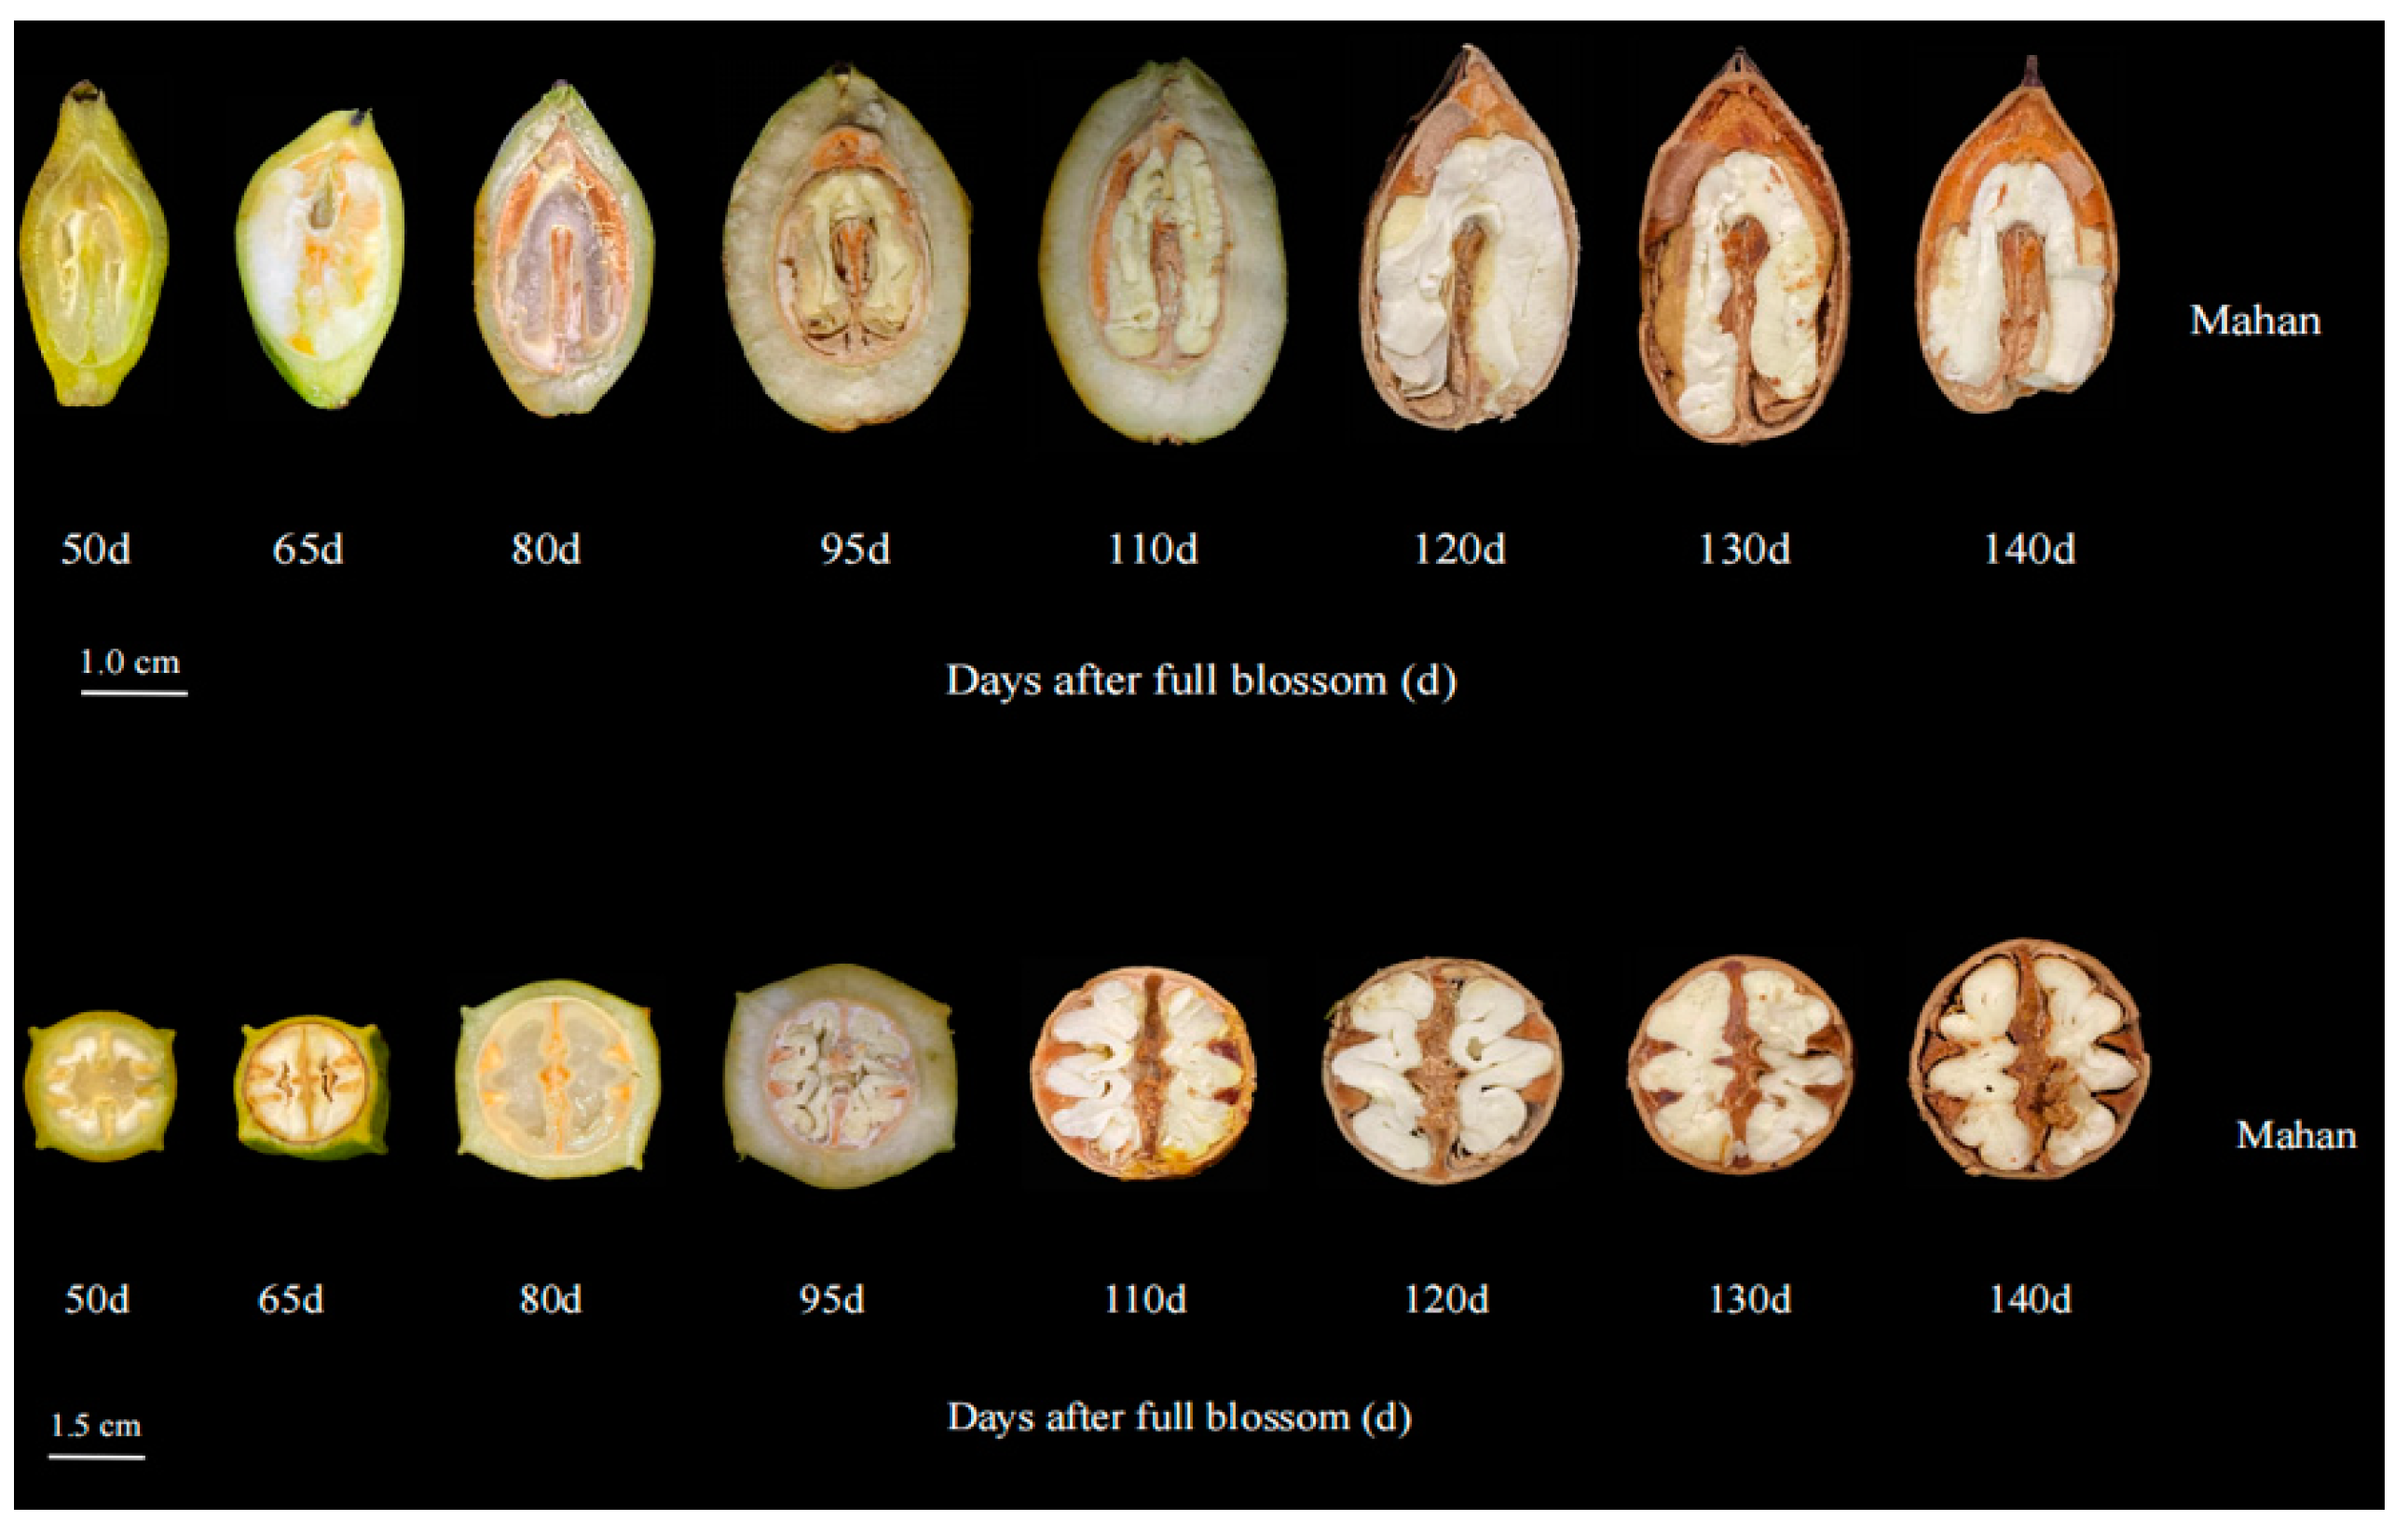
2.1. Plant Material and Treatment

The plant materials used were the fruits of the ‘Mahan’ pecan, collected in Heyue Garden, Yangzhou Baoying County, Jiangsu Province, China (N 33°02′46″~33°24′55″, E 119°07′43″~119°42′51″). The trees with a good growth status and development condition and a relatively consistent tree potential were selected for marking. The samples were collected eight times from 50 to 140 days after anthesis, and the full and substantial fruits without obvious diseases and pests were selected for each plant. After sampling, water was used to flush the dust from the pecan surface, half of the fruits were placed into an ice box and the others into liquid nitrogen, and they were taken back to the laboratory quickly. The former sample was photographed in transverse and longitudinal sections using a hammer to cut out seeds and mixed samples. Next, the sample was added to a −20 °C refrigerator until testing. Another part of the sample was added to a −80 °C refrigerator and set aside. Three biological replicates were set up for each experiment, and five fruits were measured for each biological replicate.

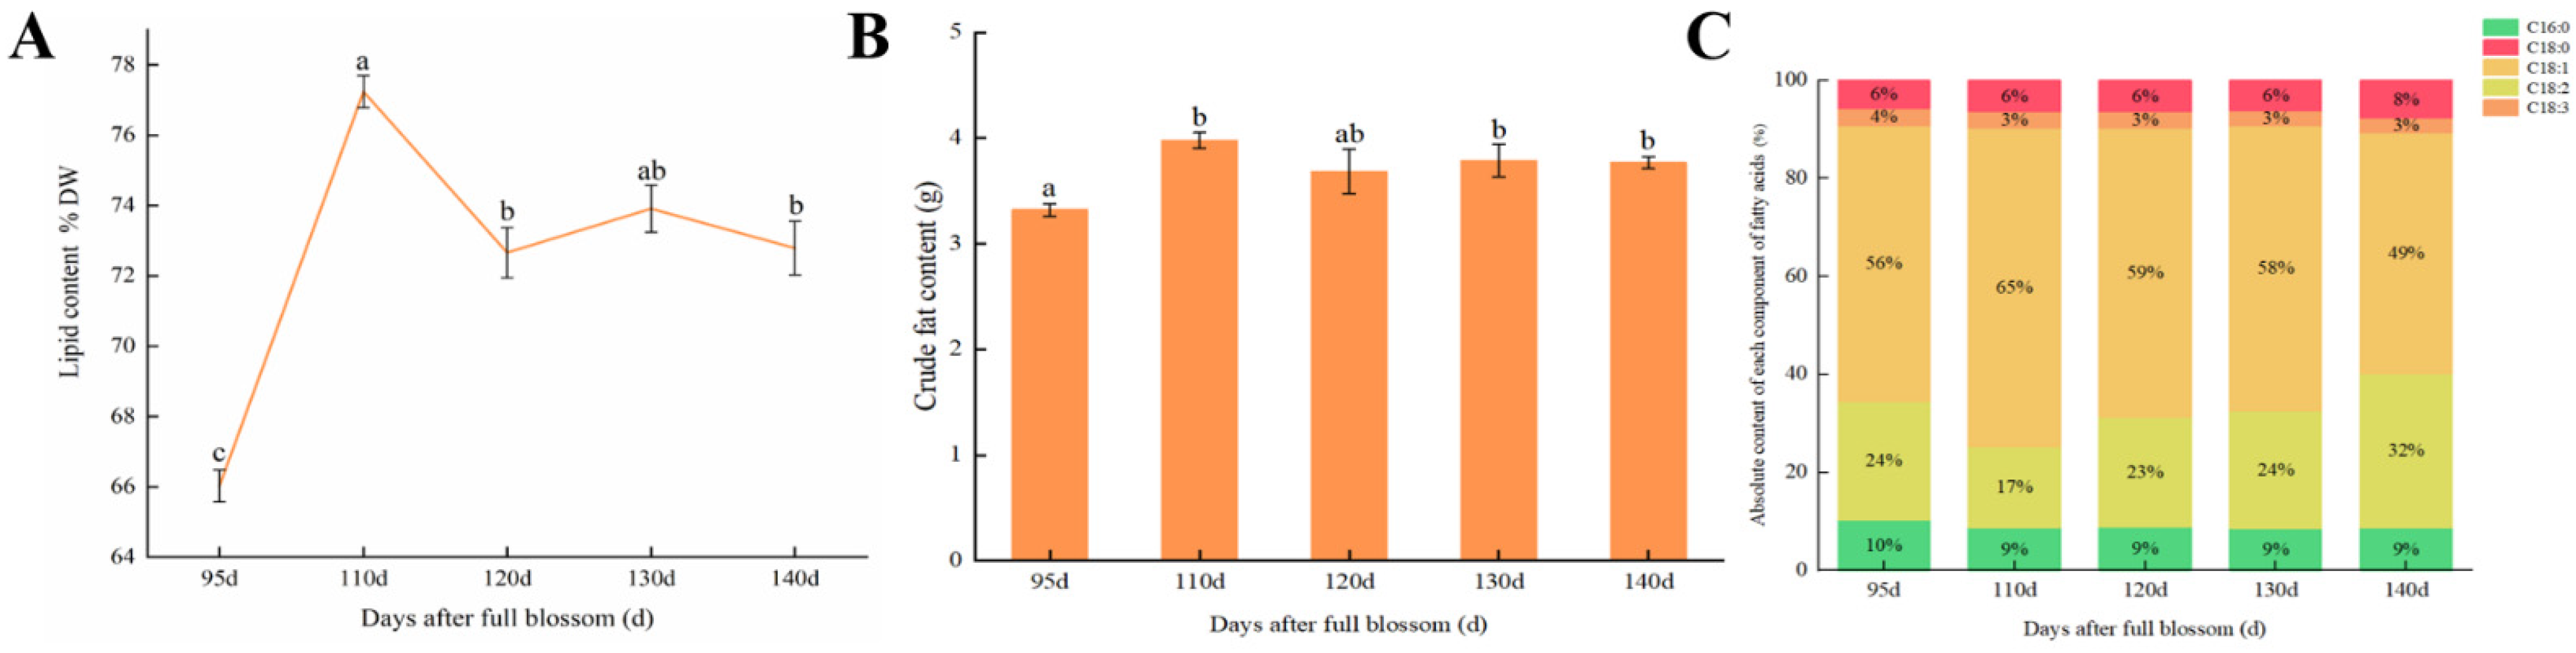
2.2. Measurement of Biochemical Parameters

The Soxhlet extraction method was used to extract the pecan oil. Next, the seeds were put in the oven at 105 °C and dried to a constant weight. Later, petroleum ether was added to the Soxhlet extractor, placing a filter paper cartridge containing the sample in the extraction bottle. Next, this was heated to 80–85 °C for 6–8 h to extract the colorless transparent liquid in the bottle. Next, the round-bottom flask was removed, and the oil ether mixture was rotationally evaporated to a constant weight, keeping the light-yellow transparent liquid in the bottle as the pecan oil.
The gas chromatography–mass spectrometry (GC-MS) method was used to identify the fatty acid components. GC-MS model: Trace GC DSQII GC instrument (chromatographic column for HP-5MS, 30.0 m × 0.25 mm × 0.25 μm). The chromatographic conditions were as follows: the injection port temperature was 250 °C, helium was used as the carrier gas, and the flow rate was 1.0 mL·min−1. The procedures were performed at a temperature of 50 °C and maintained for 2 min. Next, the sample was maintained at 4 °C/min. With an increased speed, the temperature was increased to 200 °C and maintained for 5 min. Finally, at 5 °C/min, the speed increased to 220 °C for 20 min. The mass spectrometry conditions were as follows: electron impact ion source, 70 eV, electronic energy spectrum scan range, 30–450 amu, and full-scan mode.
Later, a −80 °C refrigerator was used at 80, 95, 110, and 130 days after the flowering of the pecan nut samples. Samples were transported on dry ice to Biomarker Technologies Co., Ltd. (Beijing, China) for transcriptome sequencing, and three repeats were set in each period. SPSS 26, Excel 2016, and Origin 2018 software were used for data processing and mapping analysis.

2.3. RNA Extraction, Library Construction, and Sequencing

The Biomarker Plant Total RNA Isolation Kit (polysaccharides and polyphenolics-rich) was used to extract the total RNA of the four different development periods of the ‘Mahan’ pecan kernel. The NanoDrop 2000 (Thermo Scientific, Waltham, MA, USA) spectrophotometer was used to inspect the purity and concentration of RNA. The purity, concentration, and integrity of the RNA samples were examined using NanoDrop, Qubit 2.0 (Thermo Scientific, Waltham, MA, USA) and Agilent 2100 (Agilent, Santa Clara, CA, USA). Only RNA with an adequate quality could move on to the following procedures. Qualified RNA was processed for library construction. The procedures were as follows: (1) mRNA was isolated using oligo(dT)-attached magnetic beads. (2) The mRNA was then randomly fragmented in a fragmentation buffer. (3) First-strand cDNA was synthesized, with fragmented mRNA as a template and random hexamers as primers, followed by second-strand synthesis with the addition of PCR buffer, dNTPs, RNase H, and DNA polymerase I. The purification of cDNA was performed using AMPure XP beads. (4) Double-strand cDNA was subjected to end repair. Adenosine was added to the end and ligated to the adapters. AMPure XP beads were applied here to select fragments within the 300–400 bp size range. (5) The cDNA library was obtained via certain rounds of PCR on the cDNA fragments generated during step 4. Qubit 2.0 and Agilent 2100 were used to examine the concentration of the cDNA and the insert size to ensure library quality. Q-PCR was performed to obtain a more accurate library concentration. A library with a concentration larger than 2 nM was acceptable. The qualified library was pooled based on the pre-designed target data volume and then sequenced on the Illumina (San Diego, CA, USA) sequencing platform. After the sequencing data were offline, the bioinformatics analysis process provided by BMKCloud (www.biocloud.net accessed on 10 March 2023) was used for the data analysis.

2.4. Bioinformatics Analysis of RNA-Seq Data

Based on sequencing-by-synthesis (Sequencing By Synthesis, SBS) technology, cDNA libraries were sequenced on the high-throughput platform of Illumina, generating significant amounts of high-quality data known as raw data. It is crucial to ensure the quality of the read before moving on to the following analysis. This is because raw data contains useless data, such as primers and adapters, which must be removed before analysis. The data quality control procedures were as follows: (1) adapter contaminations were trimmed, and (2) nucleotides with a low-quality score were removed. The data processed via the above steps were named “clean data”.
HISAT2 [17] is a highly efficient system for mapping RNA-seq reads, and is a more advanced version of TopHat2/Bowtie2. HISAT2 uses a Burrows–Wheeler transform and a Ferragina–Manzini (FM) index-based search. HISAT2 uses one global graph FM index (GFM) to represent the general population, and small indexes (local indexes) combined with several alignment strategies to achieve more efficient alignment. StringTie [18] was applied to assemble the mapped reads. The algorithm was established based on optimality theory. It utilizes a novel network flow algorithm and an optional de novo assembly step to assemble and quantify transcripts representing the multiple spliced variants for each gene locus. The discovery of novel transcripts and genes was achieved using StringTie, based on the reference genome, to optimize the annotation information of a genome. The mapped reads were assembled and compared with the original annotations of the genome. The transcript regions without annotation obtained using the above processes were novel transcripts.
Novel genes were annotated using DIAMOND [19] against databases including the Non-Redundant Protein Sequence Database (NR) [20], Swiss-Prot [21], Clusters of Orthologous Groups of proteins (COG) [22], Clusters of orthologous groups for eukaryotic complete genomes (KOG) [23], and Kyoto Encyclopedia of Genes and Genomes (KEGG) [24]. The KEGG orthology of novel genes was obtained using the above processes. The Gene Ontology (GO) [25] orthology of novel genes was obtained using the underlying software InterProScan [26], based on the InterPro database. The amino acid sequences of novel genes were blasted against the Pfam [27] database using HMMER [28] to gain annotation information.
The number of fragments from a transcript is affected by the sequencing Jones, P data volume (or number of mapped reads), the length of the transcript, and the expression level of transcripts. The number of mapped reads must be normalized according to the size of the transcripts in order to reveal the expression level of each transcript more accurately. Fragments per kilobase of transcript per million fragments mapped (FPKM) were applied to measure the expression level of a gene or transcript using the StringTie maximum flow algorithm [29].
The expression of a gene can be influenced by both external stimuli and the internal environment, which are highly temporal-specific and tissue-specific. The genes that expressed significantly differently under different conditions, such as treatment vs. control, wild type vs. mutants, different time points, and tissues, were defined as differentially expressed genes (DEGs). The collection of genes that is acquired in differential expression analysis is called a DEG set. Similarly, transcripts with significantly different expression levels are named differentially expressed transcripts (DETs). For the experiments with biological replicates, differential expression analysis was processed using DESeq2 [30]. The criteria for differentially expressed genes were set as a fold-change (FC) ≥ 2 and a false discovery rate (FDR) < 0.05. FC refers to the ratio of gene expression in two samples. FDR refers to the adjusted p-value and is used to measure the significance of the difference.

2.5. Validation of RNA-Seq Data by qRT-PCR

Eight genes were selected from the significantly enriched DEGs in the fatty acid anabolic pathways for real-time quantitative PCR (qRT-PCR) analysis. Specific primers were designed through the genscript online website (https://primer3.ut.ee/ accessed on 5 May 2023), and the selection of the CiActin reference gene was in reference to Mo [31]. qRT-PCR treatment was performed using the SYBR Green PCR Master Mix (Takara, Japan).Using the iQTM 5 multicolor Real-Time PCR detection system (Bio-Rad, Hercules, CA, USA) to analyze the reaction after the dissolution curve analysis. The relative gene expression was calculated using the 2−ΔΔCT method. Each gene analysis was repeated three times.

3. Results and Discussion

3.1. Biochemical Analysis of Lipid and Fatty Acid Content of Pecan Kernels

The fruit of ‘Mahan’ is ellipsoid with four-ribbed bulging. With the maturity of the fruit, the ‘Mahan’ fruit peeled off gradually, and the color changed from green to yellow. The nutshell formed 65 days after the flowering and turned brown and thickened. From the initial watery liquid, the nut gradually thickened and whitened, turning milky kernel. Ninety-five days after anthesis, the kernel formed, and with the arrival of the ripening stage of the fruit, it continued to increase in size and fullness until it tended to be stable (Figure 1).
After drying and crushing the ‘Mahan’ Pecan kernel, the Soxhlet extraction method was used to extract the oil. The oil content and crude fat content of the fruit development period, from fruit expansion to maturity, were calculated. Next, the pecan oil was analyzed using the fruit dynamic accumulation mode (Figure 2). The results showed that the kernel of the pecan oil accumulation type “M” bimodal growth trend, namely at the beginning of the growth of seeds, oil content, and crude fat content, is low. A significant difference was found during the rest of the time, but the rapid accumulation of crude fat increased, and the oil content peaked with further mature seeds. The accumulation rate of oil can slow with the enlargement of the fruit. Then, the rate of oil accumulation continued to grow. The fruit oil content was slightly slow with the advent of the end of the fruit mature harvest time, and the crude fat content was slightly reduced. However, the difference was not significant. The stabilizing oil content and crude fat content no longer changed.
GC-MS was used to determine the pecan fatty acid components in the development of the fruit. The external standard method was used to analyze the relative content of fatty acids (Figure 2) (standard: 37 kinds of fatty acid methyl ester mix sample). A standard curve was drawn, and the absolute content of components was calculated. The results showed that there were five kinds of fatty acids in the pecan kernel, and their content ranged from high to low: oleic acid (C18:1), linoleic acid (C18:2), palmitic acid (C16:0), stearic acid (C18:0), and linolenic acid (C18:3) (Table 1). This is consistent with the results found by Özrenk [32]. The saturated fatty acids C16:0 and C18:0 accounted for a minority of the oil in the pecan, and their proportion was stable; meanwhile, the unsaturated fatty acids C18:1, C18:2, and C18:3 accounted for the majority, of which C18:1 accounted for the highest proportion and was abundant. The C18:1 content reached its highest value at 110 days after flowering. Still, the development of seed enrichment gradually reduced its content. The content of C18:1 was negatively correlated with that of C18:2, which reached its highest level during the ripening and harvesting periods of the fruit. The content of C18:3 was consistently lower than that of the other four fatty acids. Still, as a polyunsaturated fatty acid, it benefits human health, so its existence cannot be ignored.

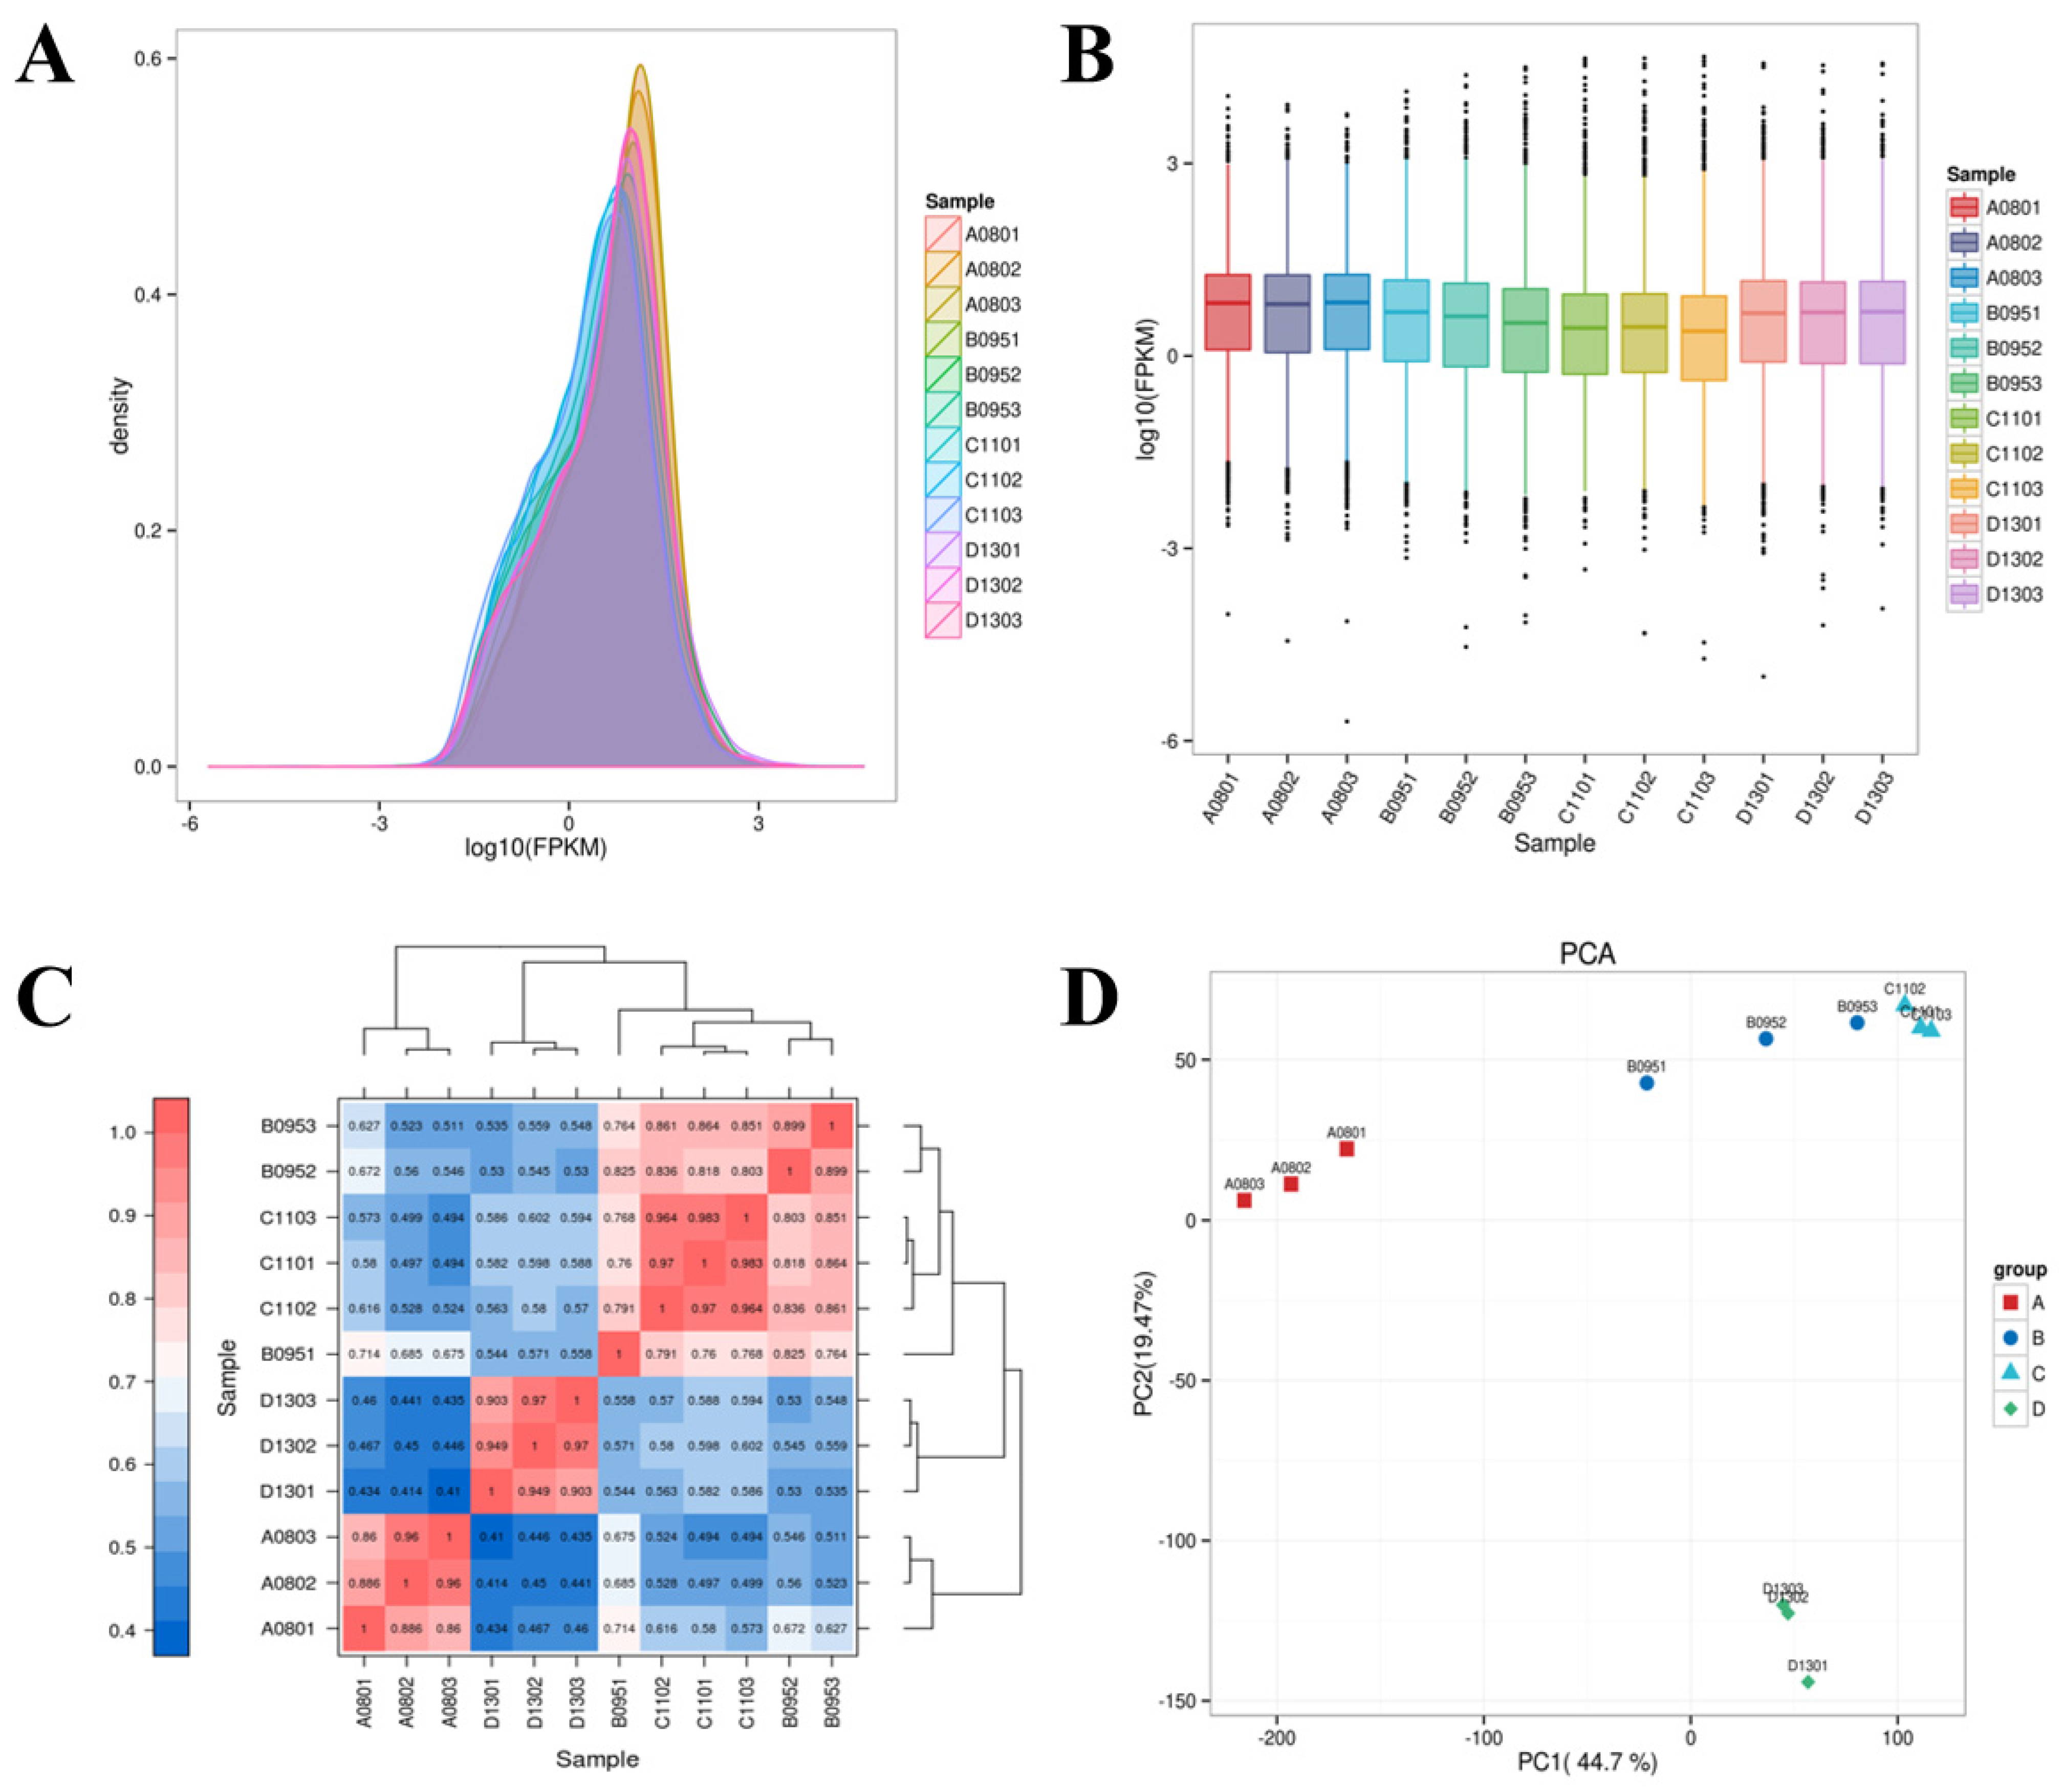
3.2. RNA-Seq Quality

Based on the synthesis and sequencing (sequencing by short, SBS) technology, the alignment of the clean reads with the reference genome was of a high quality (version information: Carya_illinoinensis.pecan_v1.genome.fa). The Illumina high-throughput sequencing platform was used days after blossoming [80 (A), 95 (B), 110 (C), and 130 (D) days after pecan kernel development] in the RNA-Seq analysis. A total of 12 were processed for transcriptome sequencing, generating 83.82 Gb of clean data. At least 6.22 Gb of clean data was generated for each sample, with a minimum of 94.38% of clean data achieving a quality score of Q30 (base identification accuracy > 99.9%). The GC content was between 44.92% and 48.73%, which showed that the sequencing was of a high quality. After evaluating the statistics of the alignment results, the alignment efficiency between the reads of each sample and the reference genome was between 92.33% and 95.79% (Table 2). This proves that the selected reference genome assembly has many annotations and can meet information analysis needs.

3.3. Functional Annotation of Novel Genes

Excluding short transcripts (coding peptides with fewer than 50 amino acids) or those containing only one exon, 5376 novel genes were discovered in this project. The new gene annotation was obtained to compare the new genes and the database. A total of 2761 new genes were found in at least one database annotation. Among these, 2040 new genes were annotated in the GO database. There were 1533 new genes annotated to the KEGG number according to the library, 2040 new genes were annotated to the Nr database, and in the TrEMBL database that commented on the newest genes, there were 2722.

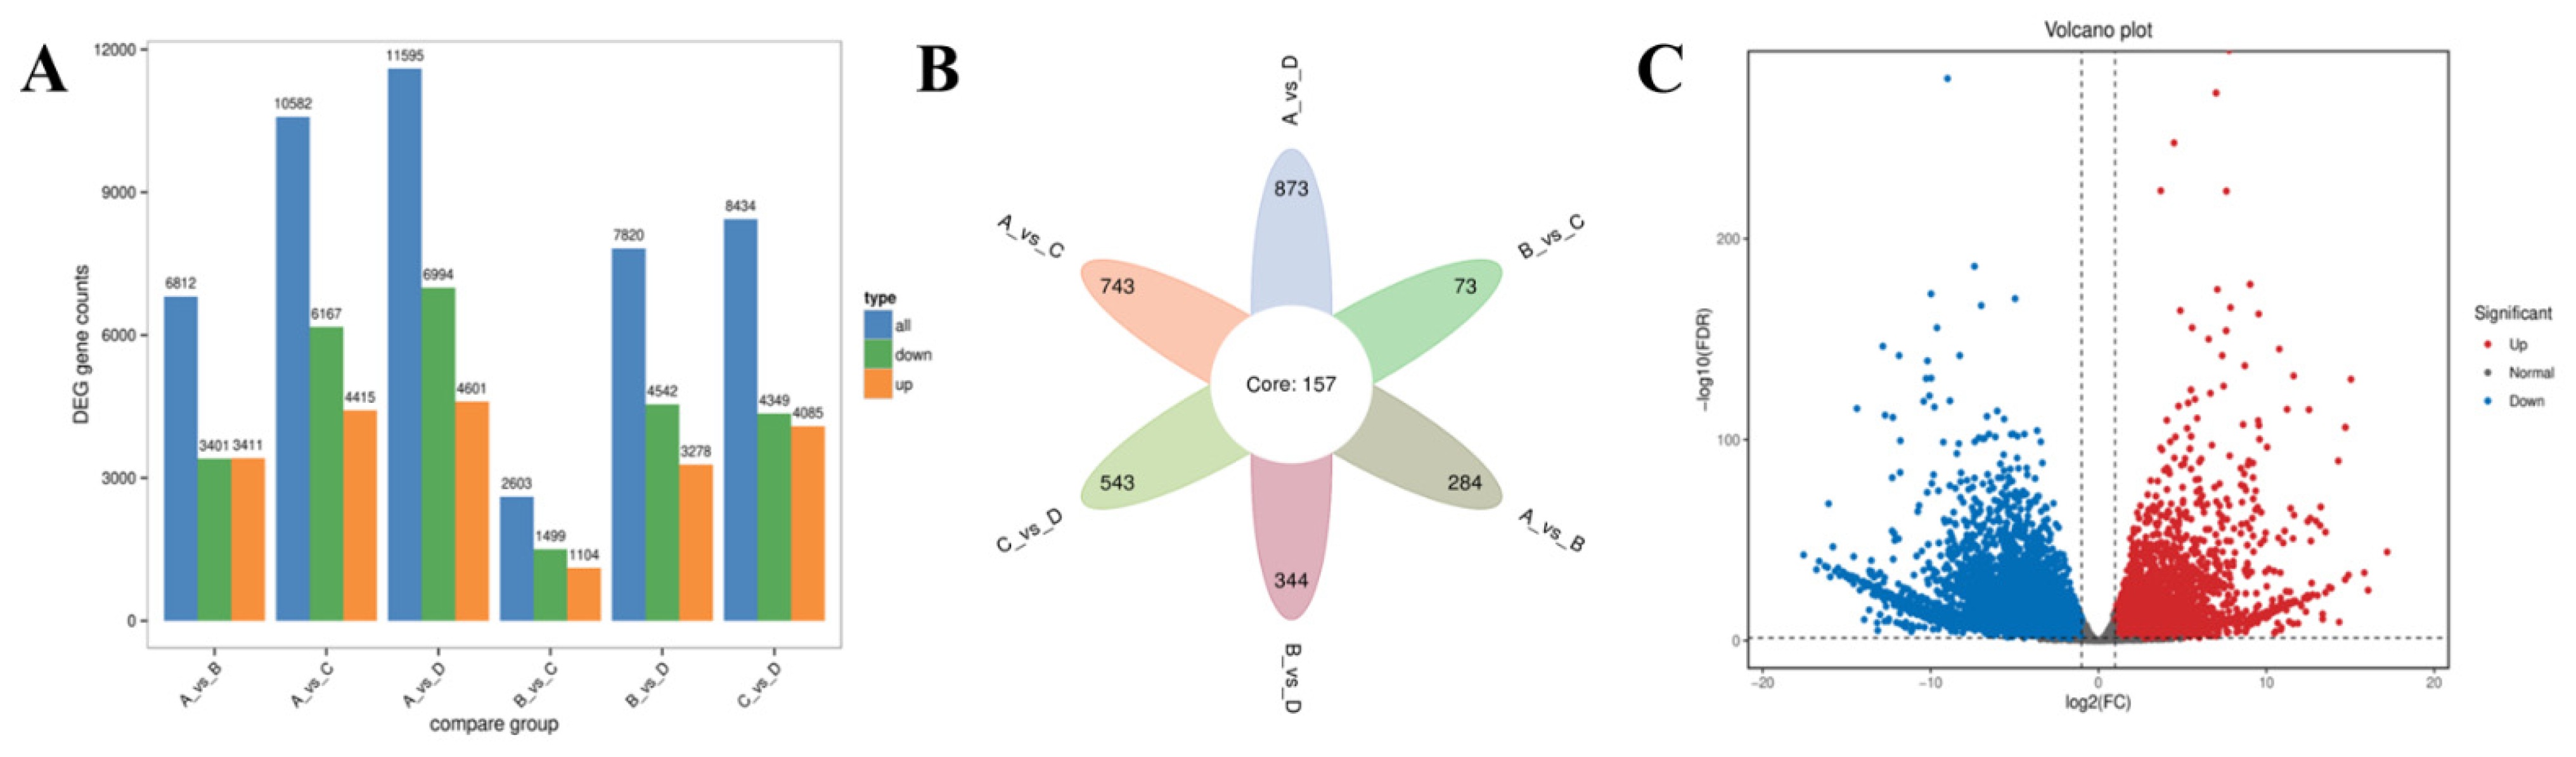
3.4. Differential Expression Analysis

RNA-Seq can achieve the highly sensitive quantification of gene expression. A detectable transcriptome expression (FPKM) ranges from 10−2 to 10−4 [33]. As can be seen in Figure 2, the gene expression levels of the pecan kernel sent this time show a normal distribution. That is, the density of both ends is small, and the density of the middle is large. The expression levels of most genes were concentrated between 10−2 and 102, and the degree of dispersion among each sample group was small, which indicated that the expression levels of the samples in the same period were consistent. Each phase of the principal component analysis (PCA) sample was moderately concentrated when discovered, according to Figure 3. The samples at 95 and 110 days after anthesis had the slightest difference and the highest correlation, while those at 80 and 130 days after anthesis had a low correlation and significant differences. This was because the fruits had a hardcore stage 95 and 110 days after anthesis. In contrast, at 80 and 130 days after anthesis, the milk and fruit maturity stages were reached, and there was a significant difference in the development stage.
The expression of a gene can be influenced by both external stimuli and the internal environment, which were highly temporal-specific and tissue-specific in this study. The gene sets were named “A_VS_B” to specify the comparing pair in the result files. Typically, “A” represents the control group, wild type, or former time point. “B” represents the corresponding treated group, mutant, or later time point. The genes with a higher expression level in B than in A are defined as upregulated genes. The genes with lower expression levels in B are defined as down-regulated genes. A pairwise comparison of the three replicates of the samples revealed that A_vs_D had the largest number of differentially expressed genes. A total of 11,595 DEGs were screened, including 4601 upregulated and 6994 downregulated genes. A histogram can intuitively show the differences between the set number of DEGs, including the A_vs_D contrast group compared with the B_vs_C with the biggest difference. The DEG set of 157 common DEGs, including A_vs_D DEGs, comprised 873 genes (Figure 4).

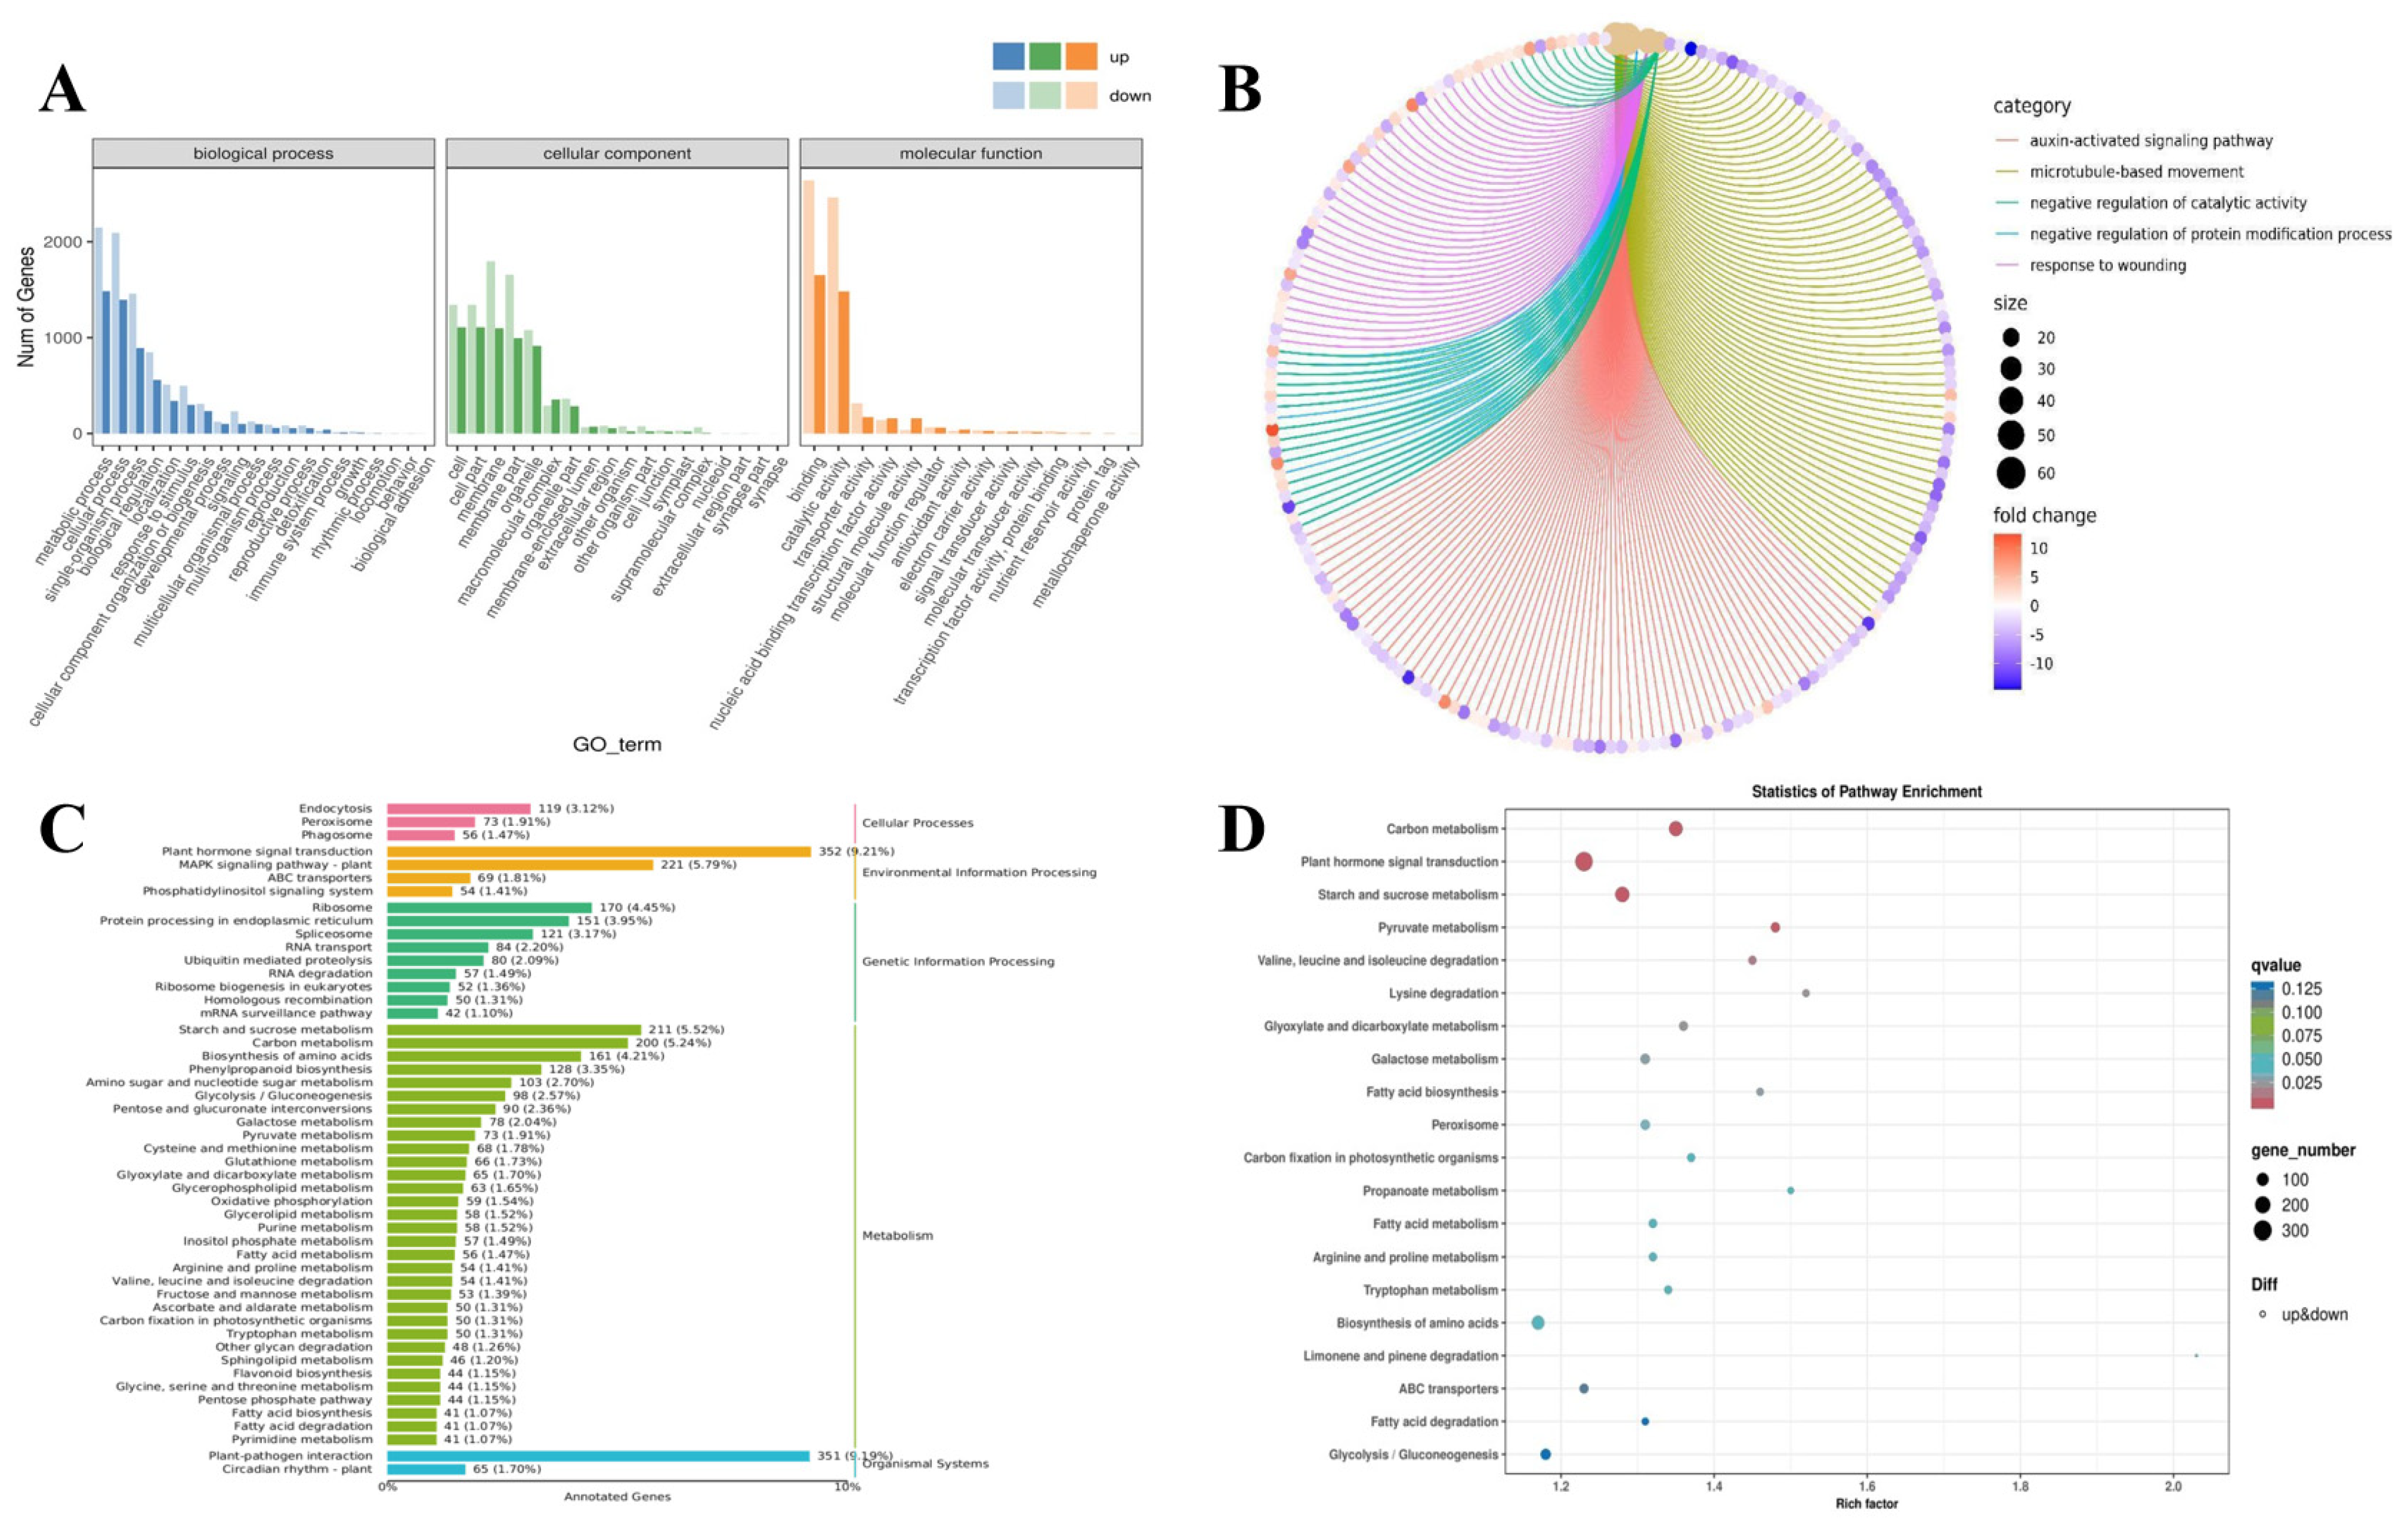
3.5. Enrichment Analysis of DEGs

The functional annotation of DEGs in the database and the DEGs with comments to quantity statistics are shown in Table 3.
The GO database is a database of classification systems for gene functional descriptions, and the basic unit is the term. The GO system can be divided into three categories. The biological process (BP) describes the process in which the product encoded by a gene is involved. Molecular function (MF) is the molecular function of the product. The cellular component (CC) describes the cellular environment in which the product is located. A total of 2040 new genes were annotated into the three major categories of the GO database for the pecan fruits in this trial. The GO terms for the three high-ranking enrichments in BP were metabolism, process, and single organizational processes. The GO terms for the three high-ranking enrichments in MF were membrane, membrane part, and cell, respectively. The GO terms for the three high-ranking enrichments in CC were binding, catalytic activity, and transporter activity (Figure 5). The GO database annotation results show a series of unigenes in pecan fat synthesis during fruit development.
The KEGG is an integrated chemical composition and function of system information database. The KEGG pathway database is a collection of hand-drawn metabolic pathways, which divides biological metabolic pathways into seven categories: metabolism, genetic information processing, environmental information processing, cellular processes, organismal systems, human diseases, and drug development. Each system was classified as having two, three, and four layers. A total of 1533 new genes were annotated into 50 pathways in the KEGG database. Among them, the number of pathways annotated in metabolism was the largest (32). The plant hormone signal transduction pathway had the most annotated new genes, with 352, accounting for 9.21% (Figure 5). After analysis, 85 pathways were related to oil metabolism in pecan fruits. Glycerolipid metabolism and sphingolipid metabolism were the most annotated DEGs, totaling 14. Among them were metabolic pathways related to fatty acid synthesis and metabolism, fatty acid biosynthesis and elongation, fatty acid degradation and metabolism, and others (Table 4).
The critical genes of fatty acid synthesis in pecan fruits were screened and combined with the expression of DEGs. Most of them involved in the fatty acid biosynthesis pathway were upregulated at 95 and 110 days after flowering. Among these, the expression of acyl-[acyl-carrier-protein] desaturase (SAD) was the highest (Table 5).

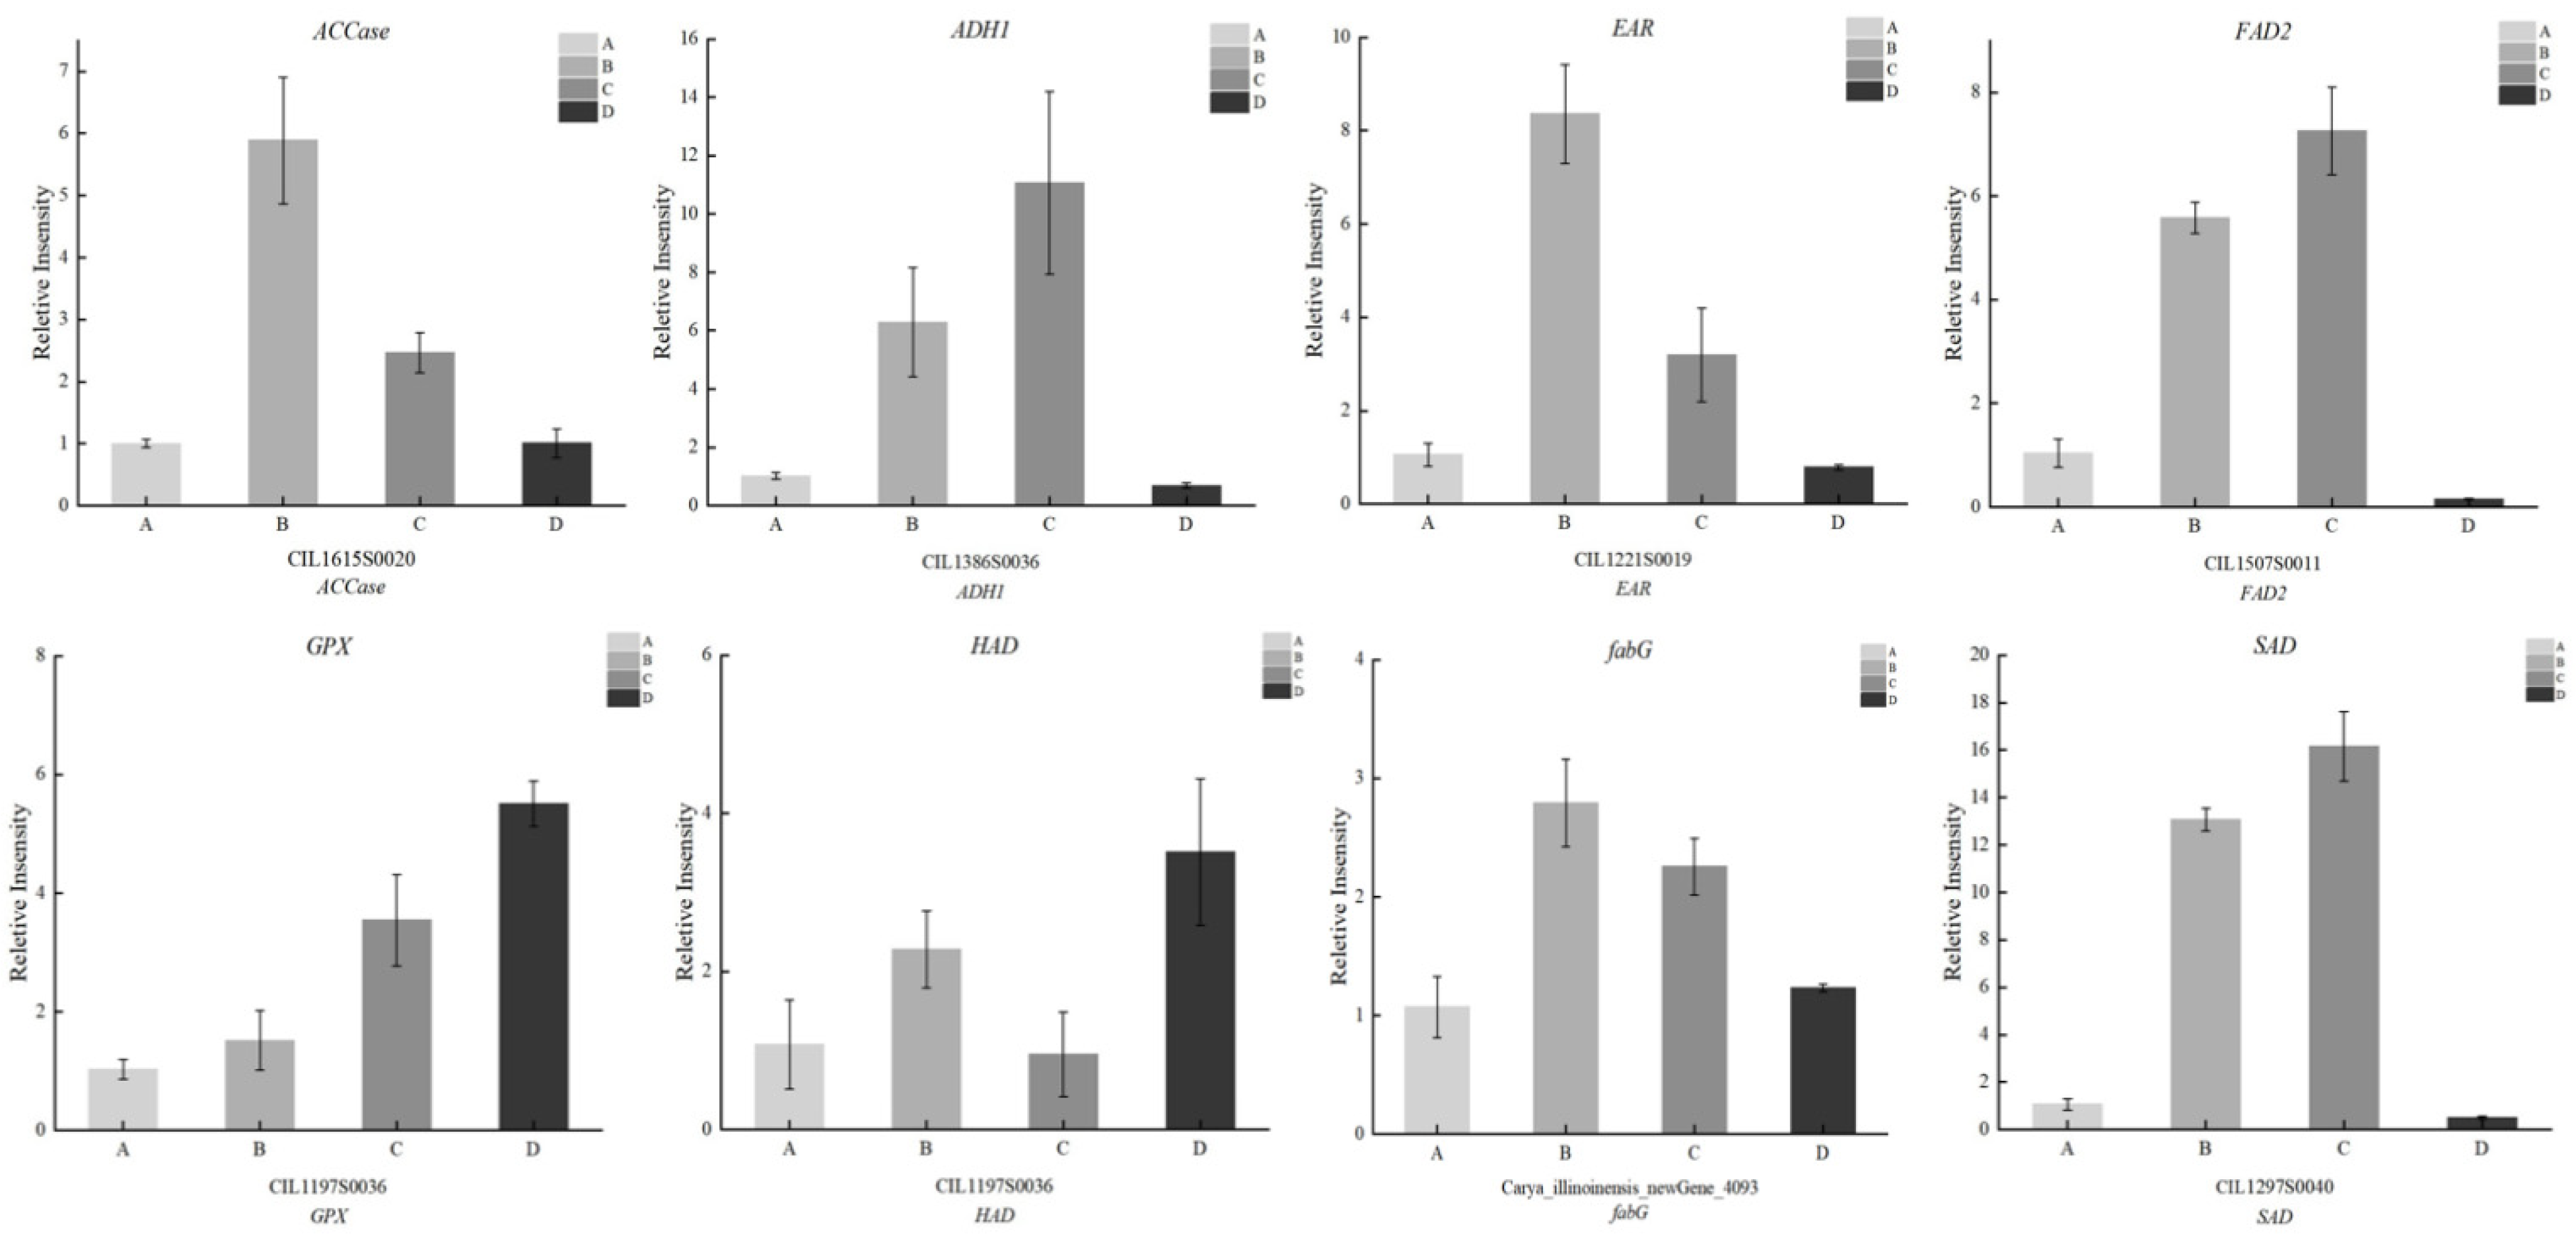
3.6. qPCR Validation of Gene Expression

The expression patterns of eight randomly selected DEGs were evaluated using qPCR to ensure the reliability of the RNA-Seq data (Figure 6). Although the specific folds of differential expression differed, the expression regulation pattern was consistent with the results obtained from transcriptome sequencing (Table 6). The expression profiles of all eight genes showed the same trend between the qPCR and RNA-Seq results, demonstrating that the RNA-Seq data were highly reliable for further analysis.

3.7. Key Enzymes in the Fatty Acid Synthesis of Pecan

Acetyl-CoA is a fatty acid (FA) synthesis precursor, providing initial FA synthesis and a carbon chain extended to two carbon atoms. Acetyl-CoA is catalyzed in plastids by acetyl-CoA carboxylase (ACCase) to form malonyl-CoA, the first key rate-limiting enzyme in FA synthesis. ACCase is a multi-enzyme complex, and ACCases in organisms include homotypic ACCase and heterogeneous ACCase. The homotypic ACCase contains biotin carboxylase (BC), biotin carboxylase carrier protein (BCCP), and carboxyl transferase (CT) domains. The CT of the heterogeneous ACCase was divided into α-CT and β-CT, composed of four subunits [34]. BC, BCCP, and α-CT were encoded by the nuclear genes accC, accB, and accA, while the plastid gene accD encoded β-CT [35]. The expression of ACCase increased from 80 to 95 days, decreased from 95 to 110 days, and then continued to decrease from 110 to 130 days (Table 6). It may be that kernels begin to form during the early stage of fruit development, and that ACCase synthesizes FA in large quantities at the initial stage, resulting in increased expression. The fruit is full to saturation, the FA of the fruit is desaturated, and the expression of ACCase decreases with further fruit development.
The enzyme 3-hydroxyacyl-CoA dehydrogenase (HAD) participates in the dehydration step of carbon chain elongation. HAD catalyzes the dehydration of β-hydroxyacyl-ACP to form α, β-enoyl-ACP, which eventually leads to the condensation (Claisen condensation reaction) of one molecule of acetyl-CoA and multiple malonyl-CoA, carbonyl reduction, dehydration, and re-reduction. Therefore, each cycle can add two carbon atoms to the carbon chain [36]. HAD increased from 80 to 95 d and from 110 to 130 days after flowering, and decreased from 95 to 110 days after flowering during the development of pecan fruits (Table 6).
Enoyl-[acyl-carrier protein] reductase I (EAR) catalyzes the last step of the first cycle of fatty acid synthesis and catalyzes the reduction of α,β-enoyl-ACP to saturated butyryl-ACP [37] to complete the process. In fruit development, the expression of the enzyme increased from 80 to 95 and from 95 to 110 days after flowering, and decreased from 110 to 130 days after flowering (Table 6).
The enzyme 3-oxoacyl-[acyl carrier-protein] reductase (fabG) is involved in the biosynthesis of PUFA. It is an oxidoreductase that takes NAD+ or NADP+ as an acceptor and acts on the donor CH–OH group. The enzyme catalyzes the formation of β-hydroxyacyl-ACP from the substrate. fabG was upregulated from 80 to 95 days after flowering. Still, it was downregulated from 95 to 110 days and from 110 to 130 days after flowering (Table 6). However, the overall expression levels were not high, possibly because the general content of PUFA in pecan is not the majority.
The enzyme acyl-[acyl carrier-protein] desaturase (SAD) catalyzes stearoyl-ACP to form oleoyl-ACP (C18:1-ACP), with one cis-unsaturated double bond at position Δ9 of the carbon chain [38]. C18:1-ACP acts synergistically with fatty acyl-ACP thioesterase A (FATA) and 1-aminocyclopropane-1-carboxylic acid synthase (ACS) to form oleoyl-Coa, which is transported from the plastids to combine with glycerol 3-phosphate (G3P) in the endoplasmic reticulum to form oleic acid (C18:1). Among the fatty acid fractions of pecan, C18:1 is abundant, which is also the reason for the high expression of this enzyme. This is consistent with the results found in olive [39], flax [40], and Walnut [41]. The expression of UFA increased in the hardcore stage (from 80 to 95 and 95 to 110 days after flowering). In contrast, the content of UFA increased in the later stage, and the expression of UFA decreased at 110–130 days after flowering (Table 6). Oleic acid and oleic-acid-rich foods may have beneficial health effects in humans [42]).
The enzyme omega-6 fatty acid desaturase (FAD2) catalyzes the formation of linoleic acid from oleic acid at position Δ12 on the endoplasmic reticulum. Oleic acid is a critical fork in the fatty acid synthesis pathway, and its further desaturation represents a future direction for study. The oil derived from sunflower seeds is nutritionally valued for its high content of unsaturated fatty acids, such as linolenic and linoleic acids, which help to reduce cholesterol levels and prevent arterial fat clots [43]. During the development of the pecan fruit, FAD2 increased from 80 to 95 days and continued to grow from 95 to 110 days after flowering. Its expression decreased only 110–130 days after flowering (Table 6). This is consistent with the results found by Dar: When the expression level of FAD is high, it is in the period of rapid fruit expansion. The decrease in FAD2 may be due to stable fruit development or environmental reasons [44].

4. Conclusions

In this study, we comprehensively analyzed the changes in fatty acid composition during the fruit development of pecan fruits. The results showed that at the physiological level, the oil accumulation of the ‘Mahan’ kernel followed an ‘M’-shaped curve with the development of the fruit, and that the fatty acid fractions from high to low were oleic acid, linoleic acid, palmitic acid, stearic acid, and linolenic acid. At the molecular level, a total of 83.82 Gb of clean data was annotated using RNA-seq from 80, 95, 110, and 130 days after flowering, 5376 new genes were discovered, and 2761 new genes were annotated in at least one database. SAD and FAD2 were significantly upregulated from 80 to 95 and from 95 to 110 days after flowering, and downregulated from 110 to 130 days after flowering. These DEGs were enriched in fatty acid biosynthesis, elongation, and degradation. These results indicate that these genes play an essential role in fatty acid accumulation in pecan. The synthesis mechanism of high oil and unsaturated fatty acids in pecan kernels was revealed using RNA-Seq. The changes in the gene expression levels were analyzed, which is expected to provide a theoretical reference for the analysis of plant oil synthesis mechanisms, enrich the research content regarding oil synthesis, and provide potential gene resources for further academic research and the genetic improvement of pecan to promote pecan breeding. The excavated genes were not further analyzed in this paper. In future work, the functions of related genes can be verified via overexpression analysis and gene silencing. Yeast one-hybrid and dual-luciferase assays were used to verify the interaction between genes, and yeast two-hybrid was used to verify the protein interaction, so as to analyze the related network of pecan fatty acid synthesis.

Author Contributions

F.W. performed the experiments, analyzed the data, organized the figures, wrote and revised the manuscript. Z.Z. and T.H. performed parts of experiments and analyzed the data. C.Z. designed this experiment and critically revised the manuscript. All authors have read and agreed to the published version of the manuscript.

Funding

This study was financially supported by Forestry Science and Technology Innovation and Promotion Project of Jiangsu Province (LYKJ [2020]14) in China.

Data Availability Statement

No new data were created or analyzed in this study. Data sharing is not applicable to this article.

Acknowledgments

We are grateful to Yangzhou University for supporting this work. We would like to express our gratitude to Jiangsu Lanxin Garden Co., Ltd. for providing pecan fruits as experimental materials.

Conflicts of Interest

The authors declare no conflict of interest.

References

  1. Flack, J.R. The Spread and Domestication of the Pecan (Carya illinoinensis) in the United States. Ph.D. Thesis, University of Wisconsin, Madison, WI, USA, 1970. [Google Scholar]
  2. Hall, D.G. Pecan food potential in prehistoric North America. Econ. Bot. 2000, 54, 103–112. [Google Scholar] [CrossRef]
  3. Tanwar, B.; Modgil, R.; Goyal, A. Nutritional and phytochemical composition of pecan nut [Carya illinoinensis (Wangenh.) K. Koch] and its hypocholesterolemic effect in an animal model. Br. Food J. 2020, 123, 1433–1448. [Google Scholar] [CrossRef]
  4. Tong, X.; Szacilo, A.; Chen, H.T.; Tan, L.B.; Kong, L.Y. Using rich media to promote knowledge on nutrition and health benefits of pecans among young consumers. J. Agric. Food Res. 2022, 10, 100387. [Google Scholar] [CrossRef]
  5. Venkatachalam, M.; Sathe, S.K. Chemical composition of selected edible nut seeds. J. Agric. Food Chem. 2006, 54, 4705–4714. [Google Scholar] [CrossRef] [PubMed]
  6. Zhao, Z.; Wang, F.; Hu, T.; Zhou, C.H. Lipidomic analyses of five Carya illinoinensis cultivars. Food Sci. Nutr. 2023, 11, 6336–6348. [Google Scholar] [CrossRef] [PubMed]
  7. Masoodi, L.; Gull, A.; Masoodi, F.A.; Gani, A.; Nissar, J.; Ahad, T.; Nayik, G.A.; Mukarram, S.A.; Kovács, B.; Prokisch, J.; et al. An Overview on traditional vs. green technology of extraction methods for producing high quality walnut oil. Agronomy 2022, 12, 2258. [Google Scholar] [CrossRef]
  8. Zou, K.Y.; Ying, M.; Sun, Z.J.; Xiong, Y.; Wu, B.; Yang, X.W. Research status and mechanism of polyunsaturated fatty acids in the treatment of alopecia. China Oils Fats 2023, 48, 69–72. [Google Scholar]
  9. Salas, J.J.; Sanchez, J.; Ramli, U.S.; Manaf, A.M.; Williams, M.; Harwood, J.L. Biochemistry of lipid metabolism in oliveand other oil fruits. Prog. Lipid Res. 2000, 39, 151–180. [Google Scholar] [CrossRef]
  10. Slocombe, S.P.; Cornah, J.; Pinfield, W.H.; Soady, K.; Zhang, Q.Y.; Gilday, A.; Dyer, J.M.; Graham, I.A. Oil accumulation in leaves directed by modification of fatty acid breakdown and lipid synthesis pathways. Plant Biotechnol. J. 2009, 7, 694–703. [Google Scholar] [CrossRef]
  11. Petrenko, V.; Sinturel, F.; Riezman, H.; Dibner, C. Lipid metabolism around the body clocks. Prog. Lipid Res. 2023, 91, 101235. [Google Scholar] [CrossRef]
  12. Ramesh, A.M.; Anuma, S.; Rahul, G.S.; Paul, T.S.; Peter, M.G.; Latha, R. Identification of two genes encoding microsomal oleate desaturases (FAD2) from the biodiesel plant Pongamia pinnata L. Trees 2016, 30, 1351–1360. [Google Scholar]
  13. Song, S.X. Cloning and Expression Analysis of Paeonia Ostii Fatty Acid Desaturase Gene PoFAD2. Ph.D. Thesis, Shandong Agricultural University, Tai’an, China, 2016. [Google Scholar]
  14. Wang, L.M.; Pei, M.H.; Xu, Y.J.; Chen, Y.M. Extraction of walnut oil body and its demulsification based on thin film drying-vacuum filtration technology. Trans. Chin. Soc. Agric. Eng. 2023, 39, 241–248. [Google Scholar]
  15. Geng, Q.N.; Chen, J.; Guo, R.; Zhang, L.Y.; Li, Q.; Yu, X.Z. Salt-assisted aqueous extraction combined with Span 20 allow the obtaining of a high-quality and yield walnut oil. LWT 2020, 121, 108956. [Google Scholar] [CrossRef]
  16. Jia, Z.; Wang, G.; Xuan, J.; Zhang, J.; Zhai, M.; Jia, X.; Guo, Z.; Li, M. Comparative Transcriptome Analysis of Pecan Female and Male Inflorescences. Russ. J. Plant Physiol. 2018, 15, 186–196. [Google Scholar] [CrossRef]
  17. Kim, D.; Langmead, B.; Salzberg, S.L. HISAT: A fast spliced aligner with low memory requirements. Nat. Methods 2015, 12, 357–360. [Google Scholar] [CrossRef]
  18. Pertea, M.; Pertea, G.M.; Antonescu, C.M.; Chang, T.C.; Mendell, J.T.; Salzberg, S.L. String Tie enables improved reconstruction of a transcriptome from RNA-seq reads. Nat. Biotechnol. 2015, 33, 290–295. [Google Scholar] [CrossRef] [PubMed]
  19. Buchfink, B.; Xie, C.; Huson, D.H. Fast and sensitive protein alignment using DIAMOND. Nat. Methods 2015, 12, 59–60. [Google Scholar] [CrossRef] [PubMed]
  20. Deng, Y.Y.; Li, J.Q.; Wu, S.F.; Zhu, Y.P.; Chen, Y.W.; He, F.C. Integrated nr database in protein annotation system and its localization. Comput. Eng. 2006, 32, 71–74. [Google Scholar]
  21. Apweiler, R.; Bairoch, A.; Wu, C.H.; Barker, W.C.; Boeckmann, B.; Ferro, S.; Gasteiger, E.; Huang, H.Z.; Lopez, R.; Magrane, M.; et al. UniProt: The universal protein knowledgebase. Nucleic Acids Res. 2004, 32, 115–119. [Google Scholar] [CrossRef]
  22. Tatusov, R.L.; Galperin, M.Y.; Natale, D.A. The COG database: A tool for genome scale analysis of protein functions and evolution. Nucleic Acids Res. 2000, 28, 33–36. [Google Scholar] [CrossRef]
  23. Koonin, E.V.; Fedorova, N.D.; Jackson, J.D.; Jacobs, A.R.; Krylov, D.M.; Makarova, K.S.; Mazumder, R.; Mekhedov, S.L.; Nikolskaya, A.N.; Rao, B.S.; et al. A comprehensive evolutionary classification of proteins encoded in complete eukaryotic genomes. Genome Biol. 2004, 5, R7. [Google Scholar] [CrossRef]
  24. Kanehisa, M.; Goto, S.; Kawashima, S.; Okuno, Y.; Hattori, M. The KEGG resource for deciphering the genome. Nucleic Acids Res. 2004, 32, D277–D280. [Google Scholar] [CrossRef]
  25. Ashburner, M.; Ball, C.A.; Blake, J.A.; Botstein, D.; Butler, H.; Cherry, J.M.; Davis, A.P.; Dolinski, K.; Dwight, S.S.; Eppig, J.; et al. Gene ontology: Tool for the unification of biology. Nat. Genet. 2000, 25, 25–29. [Google Scholar] [CrossRef] [PubMed]
  26. Jones, P.; Binns, D.; Chang, H.Y.; Fraser, M.; Li, W.Z.; McAnulla, C.; McWilliam, H.; Maslen, J.; Mitchell, A.; Nuka, P.; et al. InterProScan 5: Genome-scale protein function classification. Bioinformatics 2014, 30, 1236–1240. [Google Scholar] [CrossRef] [PubMed]
  27. Bateman, A.; Coin, L.; Durbin, R.; Finn, R.D.; Hollich, V.; Griffiths, J.S.; Khanna, A.; Marshall, M.; Moxon, S.; Sonnhammer, E.L.L.; et al. Pfam: The protein families database. Nucleic Acids Res. 2013, 1223, 276–280. [Google Scholar]
  28. Eddy, S.R. Profile hidden Markov models. Bioinformatics 1998, 14, 755–763. [Google Scholar] [CrossRef] [PubMed]
  29. Trapnell, C.; Williams, B.A.; Pertea, G.; Mortazavi, A.; Kwan, G.; Van Baren, M.J.; Salzberg, S.L.; Wold, B.J.; Pachter, L. Transcript assembly and quantification by RNA Seq reveals unannotated transcripts and isoform switching during cell differentiation. Nat. Biotechnol. 2010, 28, 511–515. [Google Scholar] [CrossRef] [PubMed]
  30. Love, M.I.; Huber, W.; Anders, S. Moderated estimation of fold change and dispersion for RNA-seq data with DESeq2. Genome. Biol. 2014, 15, 550. [Google Scholar] [CrossRef]
  31. Mo, Z.H.; Chen, Y.Q.; Lou, W.R.; Jia, X.D.; Zhai, M.; Xuan, J.P.; Guo, Z.R.; Li, Y.R. Identification of suitable reference genes for normalization of real-time quantitative PCR data in pecan (Carya illinoinensis). Trees 2020, 34, 1233–1241. [Google Scholar] [CrossRef]
  32. Özrenk, K.; Javidipour, I.; Yarilgac, T.; Balta, F.; Gündogdu, M. Fatty acids, tocopherols, selenium and total carotene of pistachios (P. vera L.) from Diyarbakir (Southestern Turkey) and walnuts (J. regia L.) from Erzincan (Eastern Turkey). Int. J. Food Sci. Technol. 2010, 18, 55–62. [Google Scholar] [CrossRef]
  33. Djebali, S.; Davis, C.A.; Merkel, A.; Dobin, A.; Lassmann, T.; Mortazavi, A.; Tanzer, A.; Lagarde, J.; Lin, W.; Schlesinger, F.S.; et al. Landscape of transcription in human cells. Nature 2012, 489, 101–108. [Google Scholar] [CrossRef]
  34. Sasaki, Y.; Nagano, Y. Plant acety-CoA carboxylase: Structure, biosynthesis, regulation, and gene manipulation for plant breeding. Biosci. Biotech. Bioch. 2004, 68, 1175–1184. [Google Scholar] [CrossRef]
  35. Wang, B.M.; Yan, S.H.; Tan, X.F. Study on the structure, function and expression regulation of ACCase genes in plants. Anhui Agric. Sci. Bulletin. 2021, 27, 17–24. [Google Scholar]
  36. Chen, S.L. Identification and Functional Study of Lipid Synthesis Related Genes in Peanut. Ph.D. Thesis, Chinese Academy of Agricultural Sciences, Beijing, China, 2012. [Google Scholar]
  37. Dong, H.J.; Cronan, J.E. Unsaturated fatty acid synthesis in Enterococcus faecalis requires a specific enoyl-ACP reductase. Mol. Microbiol. 2022, 118, 541–551. [Google Scholar] [CrossRef] [PubMed]
  38. Shanklin, J.; Cahoon, E.B. Desaturation and related modifications of fatty acids. Annu. Rev. Plant Physiol. Plant Mol. Biol. 1998, 49, 611–640. [Google Scholar] [CrossRef] [PubMed]
  39. Ben, A.R.; Ennouri, K.; Ercişli, S.; Hajer, B.H.; Mohsen, H.; Slim, S.; Ahmed Rebai, F.M. First study of correlation between oleic acid content and SAD gene poly-morphism in olive oil samples through statistical and bayesian modeling analyses. Lipids Health Dis. 2018, 17, 74. [Google Scholar]
  40. Dmitriev, A.A.; Kezimana, P.; Rozhmina, T.A.; Zhuchenko, A.A.; Povkhova, L.V.; Pushkova, E.N.; Novakovskiy, R.O.; Pavelek, M.; Vladimirov, G.N.; Nikolaev, E.N.; et al. Genetic diversity of SAD and FAD genes responsible for the fatty acid composition in flax cultivars and lines. BMC Plant Biol. 2020, 20 (Suppl. S1), 301. [Google Scholar] [CrossRef]
  41. Huang, R.M.; Zhou, Y.; Zhang, J.P.; Ji, F.Y.; Jin, F.; Fan, W.; Pei, D. Transcriptome Analysis of Walnut (Juglans regia L.) Embryos Reveals Key Developmental Stages and Genes Involved in Lipid Biosynthesis and Polyunsaturated Fatty Acid Metabolism. J. Agric. Food Chem. 2021, 69, 377–396. [Google Scholar] [CrossRef]
  42. Dhakal, K.H.; Jung, K.H.; Chae, J.H.; Shannon, J.G.; Lee, J.D. Variation of unsaturated fatty acids in soybean sprout of high oleic acid accessions. Food Chem. 2014, 164, 70–73. [Google Scholar] [CrossRef]
  43. Puttha, R.; Venkatachalam, K.; Hanpakdeesakul, S.; Wongsa, T.; Parametthanuwat, T.; Srean, P.; Pakeechai, K.; Charoenphun, N. Exploring the Potential of Sunflowers: Agronomy, Applications, and Opportunities within Bio-Circular-Green Economy. Horticulturae 2023, 9, 1079. [Google Scholar] [CrossRef]
  44. Dar, A.A.; Choudhury, A.R.; Kancharla, P.K.; Arumugam, N. The FAD2 Gene in Plants: Occurrence, Regulation, and Role. Front. Plant Sci. 2017, 8, 1789. [Google Scholar] [CrossRef]
Figure 1. Changes in fruit appearance.
Horticulturae 09 01199 g001
Figure 2. Oil content, crude fat, and fatty acid components of pecan kernels. (A): Lipid content in the growth and development of pecan fruit. (B): Crude fat content in the growth and development of pecan fruit. (C): Absolute content of each component of fatty acids. Note: Each graph point represents the mean of three biological replicates ± SD (p ≤ 0.05), the letters represent salience and the error bar represents the standard error.
Horticulturae 09 01199 g002
Figure 3. Correlation plots of FPKM for each sample. (A) FPKM box plot of each sample. (B) FPKM box plot of each sample. (C) Correlation heatmap between samples. (D) PCA plot.
Horticulturae 09 01199 g003
Figure 4. Correlation plots of DEGs. (A) Statistical bar chart of DEGs. (B) Venn diagram of DEGs. (C) Volcano plot on differential expression.
Horticulturae 09 01199 g004
Figure 5. GO and KEGG correlation diagrams. (A) Classification statistical figure. (B) Enrichment of the string figure. (C) Differentially expressed genes KEGG classification figure. (D) DEGs of the KEGG bubble chart.
Horticulturae 09 01199 g005
Figure 6. Fatty acid synthesis metabolism-related gene expression of ‘Mahan’ pecan at different development stages.
Horticulturae 09 01199 g006
Table 1. Changes in fatty acid composition (% of total fatty acids) in developing kernels of ‘Mahan’ (mean ± SD, p ≤ 0.05).
AnalyteSample Class
95 Days110 Days120 Days130 Days140 Days
C16:07.810 ± 0.035 a6.430 ± 0.036 e6.513 ± 0.025 d6.677 ± 0.035 c6.937 ± 0.057 b
C18:02.143 ± 0.015 d2.327 ± 0.045 c2.320 ± 0.010 c2.420 ± 0.066 b3.010 ± 0.026 a
C18:170.423 ± 0.270 d78.080 ± 0.035 a72.057 ± 0.068 c72.970 ± 0.061 b64.107 ± 0.040 e
C18:218.307 ± 0.025 b11.970 ± 0.090 e17.970 ± 0.020 c16.747 ± 0.112 d24.803 ± 0.076 a
C18:31.320 ± 0.242 a1.187 ± 0.025 a1.143 ± 0.040 a1.187 ± 0.032 a1.140 ± 0.017 a
Note: Significant difference letter marking, in which the largest mean is marked with the letter a and the mean is compared with each other, and the mean significantly different from it is marked with the letter b, until the smallest mean is marked with a letter e.
Table 2. Samples with the selected reference genome sequencing data sequence alignment results.
SampleTotal ReadsMapped ReadsUniq Mapped ReadsMultiple Map ReadsReads Map to ‘+’Reads Map to ‘−’
A80144,611,82041,188,894 (92.33%)40,148,548 (90.00%)1,040,346 (2.33%)21,217,825 (47.56%)21,251,742 (47.64%)
A80248,505,20845,161,914 (93.11%)44,064,795 (90.85%)1,097,11 (2.26%)23,229,480 (47.89%)23,269,975 (47.97%)
A80352,534,94848,558,039 (92.43%)47,362,292 (90.15%)1,195,747 (2.28%)24,990,755 (47.57%)25,024,059 (47.63%)
B95145,958,90842,897,631 (93.34%)41,749,011 (90.84%)1,148,620 (2.50%)22,133,775 (48.16%)22,172,300 (48.24%)
B95246,090,54043,103,232 (93.52%)41,304,339 (89.62%)1,798,893 (3.90%)22,673,701 (49.19%)22,695,095 (49.24%)
B95347,187,01444,972,673 (95.31%)43,449,342 (92.08%)11,523,331 (3.23%)23,431,052 (49.66%)23,453,666 (49.70%)
C110141,641,34439,457,525 (94.76%)37,856,182 (90.91%)1,601,343 (3.85%)20,700,039 (49.71%)20,754,808 (49.84%)
C110241,792,26639,992,132 (95.69%)38,311,525 (91.67%)1,680,580 (4.02%)21,042,988 (50.35%)21,053,642 (50.38%)
C110357,865,39055,427,094 (95.79%)52,668,638 (91.02%)2,758,456 (4.77%)29,426,371 (50.85%)29,448.572 (50.89)
D130142,464,80040,360,537 (95.04%)39,035,159 (91.92%)1,325,378 (3.12%)20,992,211 (49.43%)20,963,422 (49.37%)
D130243,473,70441,497,574 (95.45%)40,109,711 (92.26%)1,387,863 (3.19%)21,618,944 (49.73%)21,622,341 (49.74%)
D130348,545,27646,435,876 (95.65%)45,083,142 (92.87%)1,352,734 (2.79%)24,038,643 (49.52%)24,037,113 (49.51%)
Note: A801 represents the first repetition 80 days after flowering (period A), B951 represents the first repetition 95 days after flowering (period B), C1101 represents the first repetition 110 days after flowering (period C), and D1301 represents the first repetition 130 days after flowering (period D). Reads mapped to a ‘+’ or ‘−’: positive or negative chain alignment to reference genome reads.
Table 3. Annotation statistics of the number of DEGs.
DEG SetTotalCOGGOKEGGKOGNRPfamSwiss-ProteggNOG
A_vs_B636522265248432132626359529147915481
A_vs_C986332308079671151169849813273308394
A_vs_D10,882360889367465565610,870900981419346
B_vs_C24378291953163112182435205317962103
B_vs_D747426216174523040517470632756976488
C_vs_D798528066587562243477979670360526905
Table 4. Number of unigenes related to oil metabolism obtained via annotation in KEGG.
Pathway NamePathways NumberDEGs Number
Fatty acid biosynthesisko000611
Fatty acid elongationko000622
Fatty acid degradationko000718
Synthesis and degradation of ketone bodiesko000722
Cutin, suberine, and wax biosynthesisko000735
Steroid biosynthesisko001008
Glycerolipid metabolismko0056114
Glycerophospholipid metabolismko005647
Ether lipid metabolismko005655
Arachidonic acid metabolismko005903
Linoleic acid metabolismko005914
alpha-Linolenic acid metabolismko005929
Sphingolipid metabolismko0060014
Fatty acid metabolismko012123
Total-85
Table 5. List of transcripts related to fatty acid synthesis in pecan (in part).
Annotation80 d95 d 110 d 130 d
3-Hydroxyacyl-CoA dehydrogenase74.90684.63652.174647.727
Acyl-sn-glycerol-3-phosphate Acyltransferase74.06092.38555.007120.418
Acyl-[acyl-carrier-protein] desaturase221.1441188.3411787.6790.977
Acetyl-CoA carboxylase208.514467.61692.75848.297
Alcohol dehydrogenase class-P305.1921659.1101707.98267.504
Oxoacyl-[acyl-carrier protein] reductase93.442868.771707.29099.485
Glutathione peroxidase111.326251.159327.642656.789
Enoyl-[acyl-carrier protein] reductase I133.260512.245223.75515.479
Omega-6 fatty acid desaturase84.676306.651488.60596.185
Acetyl-CoA acyltransferase 1144.33769.06560.953237.704
Table 6. Carya illinoinensis fatty acid biosynthesis in fruit expression patterns of essential enzyme genes in distinct stages.
Gene IDGene NameProtein NameGene Expression Patterns
UpregulatedDownregulated
CIL1204S0021HAD, MFP23-hydroxyacyl-CoA dehydrogenase80–95 d, 110–130 d95–110 d
CIL1297S0040SAD, FAB2acyl-[acyl-carrier-protein] desaturase80–95 d, 95–110 d110–130 d
CIL1615S0020accCacetyl-CoA carboxylase80–95 d95–110 d, 110–130 d
CIL1386S0036ADH1alcohol dehydrogenase class-P80–95 d, 95–110 d110–130 d
Carya_illinoinensis_newGene_4093fabG3-oxoacyl-[acyl-carrier protein] reductase80–95 d95–110 d, 110–130 d
CIL1197S0036gpx, btuEglutathione peroxidase80–95 d, 95–110 d, 110–130 d-
CIL1221S0019EAR, fabIenoyl-[acyl-carrier protein] reductase I80–95 d, 95–110 d110–130 d
CIL1507S0011FAD2omega-6 fatty acid desaturase80–95 d, 95–110 d110–130 d
Disclaimer/Publisher’s Note: The statements, opinions and data contained in all publications are solely those of the individual author(s) and contributor(s) and not of MDPI and/or the editor(s). MDPI and/or the editor(s) disclaim responsibility for any injury to people or property resulting from any ideas, methods, instructions or products referred to in the content.

