Article

The Variations of C/N/P Stoichiometry, Endogenous Hormones, and Non-Structural Carbohydrate Contents in Micheliamaudiae ‘Rubicunda’ Flower at Five Development Stages

1
School of Life Science and Engineering, Southwest Jiaotong University, Chengdu 611756, China
2
Department of Forestry, Faculty of Forestry, Sichuan Agricultural University, Chengdu 611130, China
*
Authors to whom correspondence should be addressed.
Horticulturae 2023, 9(11), 1198; https://doi.org/10.3390/horticulturae9111198
Submission received: 13 September 2023 / Revised: 18 October 2023 / Accepted: 23 October 2023 / Published: 3 November 2023
(This article belongs to the Special Issue Physiological and Molecular Biology Research on Ornamental Flower)

Abstract

:
Michelia maudiae ‘Rubicunda’ (M. maudiae ‘Rubicunda’) is one of the most popular ornamental plants. However, relatively little is known regarding its floral development. Here, the variations of the mineral, endogenous hormone, and non-structural carbohydrate (NSC) contents in the petals and gynoecium and androecium (GA) at five developmental stages during M. maudiae ‘Rubicunda’ flower development were analyzed. The results suggested that the carbon (C), nitrogen (N), and phosphorus (P) endogenous hormones, NSC contents, and C/N/P stoichiometric ratios exhibit large variations during flower development. There were significant differences in N and P contents in the GA and petals among the five growth stages, while C contents did not change significantly. In the five flower development stages, the average N and P contents in the GA were higher than those in the petals. The maximum C/N and N/P ratios in the GA and petals were foundat the senescent flower stage (stage5) and green bud stage (stage1), respectively. The C/P ratio in petals reached its maximum value at the mature bud stage (stage 2), and the C/P ratio in the GA reached its maximum value at the senescent flower stage (stage 5). The C/N/P stoichiometric ratios in the petals were more sensitive to development stages than those in the GA. There were highly significant correlations between the NSC and C/N/P stoichiometric ratios in the GAand petals. Moreover, acetic acid (IAA), abscisic acid (ABA), gibberellic acid 3 (GA3), and cytokinin (CTK) contents in the petals exhibited significant changes in response to development stages. Principal component analysis (PCA) revealed significant correlations and clear differences in the test indexes between the development stage and organs, and the variation was explained by PC-1 (55.6%), PC-2 (23.3%), and the cumulative contribution percentage of the total biplot (78.9%). These studies can lay the foundation for elucidating the requirements and dynamic balance among C, N, P, NSC, and hormone contents during the flower development of M. maudiae‘ Rubicunda’.

1. Introduction

Flowers are reproductiveand temporal organs in plants and are also highly prized objects of beauty with commercial and industrial value [1]. Flower development is a highly complex process characterized by two distinct physiological stages: bud initiation and floral bud development [2]. These two stages include growth, development, senescence, and abscission, which are events that can be affected by internal and external factors. The internal factors includeminerals, endogenous hormones, carbohydrates, and transcription factors, while the external factors includetemperature, water status, light, etc. [3,4]. Thus, understanding flower development is very important for ensuring successful production and improving orchard management, which would help enhance the visual quality and vase life of flowers, thus increasing their commercial value.
Carbon (C), nitrogen (N), and phosphorus (P) are essential components for plant growth and plant metabolism, including flower development [5,6]. C, N, and P contents, as well as C/N/P stoichiometry, are the most investigated nutrient relationships in the study of plants because these elements often limit organism growth andinevitably affect the growth rate and primary production of plants [7]. To date, several studies have been conducted on a wide-scale basis to explain many phenomena at all levels of biology, from genes and molecules to whole organisms and even to ecosystems, which largely reflect the vegetation composition, dynamics, and nutrient limitation of plants. The C/N/P stoichiometry of terrestrial plants can reflect how plants adjust themselvesto adapt to growth conditions [5,6]. Recently, many researchers have reported the distribution of mineral nutrients and some metabolites in many plant species [8], and significantly changed mineral nutrients and metaboliteswere also observedduring the flower development of Hibiscus rosa-sinensis and Camellia sinensis [9,10]. Moreover, some measurements have already been recorded on the spatiotemporal variations, biological regulation mechanisms, and ecological implications of C/N/P stoichiometric ratios during flower development [11,12].These studies help to offer beneficial information on the distribution and changes in nutrient contents and stoichiometry, as well as their relationships during flower development.
Non-structural carbohydrates (NSCs) are important energy sources and signaling and regulatory molecules for plant growth, reproduction, and metabolism. NSC contents and composition are measures of the relationship between plant carbon uptake (photosynthesis) and carbon consumption (growth and respiration) in plants [13,14]. Carbohydrates perform various functions during flower development, such as acting as energy sources, osmotic regulators, and precursors of metabolic processes. Thus, the lack of carbohydrates will lead to undersized petal development or stop flower development [10,15,16]. During bud break, high carbon demand may exceed the carbon supplied by current photosynthesis in evergreen species that also partly depend on the NSC pool [17,18]. Earlier studies showed that the changes in glucose and fructose content are associated with inflorescence development, differentiation, blooming, and color formation in different plant species, including Asiatic lilies [19], Campanula rapunculoides [20], Borago officinalis, and Centaurea cyanus [21]. Thus, there are complex changes in carbohydrates during flower development, which have an important rolein the nutritional composition, taste, texture, and other indicators of flowers. Moreover, flower development is affected by a complex network of genes that integrate multiple endogenous signals, thus ensuring that flowering occurs at the right time. Hormones, their content, and ratios are involved in the formation of flowers [2,9]. Accumulated studies have shown that flower development showed a positive and/or negative correlation with the contents of endogenous hormones—for example, acetic acid (IAA), abscisic acid (ABA), gibberellic acid 3 (GA3), and cytokinin (CTK) [22,23]. It has been shown that ABAand GAs are crucial regulators for plant growth, and these play an important role in flower development, affecting floral transition [9,23]. From the results obtained, it was clear that changes in carbohydrate and endogenous hormone content play an important role during flower development.
Michelia maudiae ‘Rubicunda’ (M. maudiae ‘Rubicunda’), a member of the Magnoliaceae family, is mainly cultivated in subtropical China. It is a very ornamental and aromatic plant due to its long flowering period anddistinctive flower colors (Figure 1 and Figure 2). The tree can reach a height of 3−8 m with extended branches and can blossom 4−5 years after planting. The flowering period is fromEarlyFebruary to LateApril, and the fruiting period is from September to October [24,25]. Its flower color is purplish red, which differs from the original subspecies of the Magnoliaceae family. It is also an excellent plant resource for studying flower color gene regulation and for breeding new varieties of Magnoliaceae. Apart from these remarkable features, the flowercontains proteins, minerals, carbohydrates, vitamins, amino acids, essential oils, etc. It has alsobeen used to prepare various traditional foods such as cakes, casseroles, herbal teas, and drinks [26]. However, studies on flower development in M. maudiae ‘Rubicunda’ are rather limited. Thus, the main objective of our study was toclarifythe changes in C, N, and P, endogenous hormones, non-structural carbohydrates (NSCs) content, and C/N/P stoichiometry in the gynoecium and androecium (GA) and petals of M. maudiae ‘Rubicunda’ flower at five developmental stages.

2. Materials and Methods

2.1. Study Site

The experimental site is located in Xie-yuan Town, Da-yi County, Chengdu, China (30°37′ N, 103°20′ E, altitude: ≈771 m). The regionhas a classic subtropical monsoon climate with an average temperature of 15.1 °C, an annual rainfall of 1095.5 mm, an average relative air humidity of 83%, a frost-free period of 284 days, and total annual sunshine of 1076.5 h. The weather data were obtained from the China Meteorological Administration.

2.2. Flowers Collection and Parameters Measurement

Ten six-year-old M. maudiae ‘Rubicunda’ trees with similar height were marked for flower harvesting. The dates of the beginning and end of flowering were recorded for each tree from February to April 2023. The fresh flowers were harvested in the early morning (08:00−11:00am). Referring to the Biologische Bundesantalt, Bundes-sortenamt, and Chemische Industrie(BBCH) scales [27,28], M. maudiae ‘Rubicunda’ flower development is divided into five stages, including green bud stage (S1), mature flower budstage (S2), early bloomingstage (S3), fully opened flower stage (S4), and senescent flowerstage(S5) (Figure 1A and Figure 2B). At each stage, buds and flowersfrom ten trees were randomly selected, numbered, photographed, and measured. Each flower at five developmental stages was separated as petal and gynoecium and androecium (GA) (Figure 1B,C) and immediately weighed. Samples weredivided into two parts, one of which was oven-dried at 65 °C for 24 h, weighed, ground, and sieved for chemical analysis. The other was immediately frozen in liquid nitrogen and then stored at −80 °C for analysis of endogenous hormones.

2.3. Determination of C, N, and P Contents

A total of 500mg of sample was added into polytetrafluoroethylene (PTFE, Teflon®) vessels, and then 10 mL of concentrated HNO3 and 2 mL of H2O2 were added. The samples were mixed and digestedcompletely, and 1 mL of digested solution was adjusted up to 25 mL with Milli-Q deionized water for further analysis. The total C content (g/Kg) was determined by the H2SO4/K2Cr2O7 oxidization-FeSO4 titration method. Total N concentration (g/Kg) was analyzed by the Kjeldahl determination method. Total P content (g/Kg) was determined and analyzed using the Mo-Sb colorimetric method [29]. The concentrationwas expressed as g/Kg dry weight (DW). The C/N, N/P, and C/P ratios were calculated from the content ratio.

2.4. Determination of NSC Content

Soluble sugar and starch contents were determined according to theanthrone colorimetric method [30]. A 0.1 g sample wasmixed with 10 mL of 80% ethanol and incubated in a boiling water bath for 10 min. The extracts were centrifuged at 2380× g for 10 min, and the supernatant was collected. Theaforementioned process was performed intriplicate to ensure complete extraction. Then, the precipitate was further resuspended in 30% perchloric acid (10 mL), and the samples sat undisturbed for 12 h. Then, the samples wereplaced in an 80 °C water bath for 10 min and were centrifuged at 5000 rpm for 10 min.The supernatant was diluted to achieve a 50 mL constant volume for measuring starch contents. For glucose and starch measurements, 0.1 mL of soluble sugar extraction and 5 mL of anthrone reagent were mixed, and the solution was carried out in a 90 °C water bath for 15 min. For sucrose analysis, 0.1 mL of sugar extraction and 0.1 mL of 7.6 mol/L KOH solution were mixed and then incubated in a boiling water bath for 15 min. After cooling to room temperature, 5 mL of anthrone solution was added, and mixed, placed in a 90 °Cwater bath for 15 minuntil analysis. For fructose analysis, 0.1 mL of sugar extract and 5 mL of anthrone solution were mixed and kept for 90 min at room temperature. The absorption values at 620 nmof the above solutions were measured and were calculated according to the standard curve ofglucose, sucrose, fructose, and starch, respectively. The NSC contents were calculated as the sum ofglucose, sucrose, fructose, and starch contents, and the results were representedas mg per g dry weight (DW).

2.5. Endogenous Hormone Measurement

IAA, IBA, ABA, and GA3 were detected using enzyme-linked immunosorbent assay (ELISA) method [23]. In brief, 500 mg offresh sampleswere crushed into powder in liquid nitrogen and dissolved in 4 mL of 95% methanol. The mixture was sonicated for 30 min and kept at 4 °C overnight, and then the supernatant was collected by centrifuging at 4000 rpm for 10 min at 4 °C for the next use. This step was performed three times to ensure complete extraction. These supernatants were retained, combined, andevaporated at 40 °C until the organic phase was removed.The concentrated samples were filtered with a 0.22 μm filter membrane, and the hormone contents were measured byELISA according to the manufacturer’s protocol. Every sample was measured in triplicate.

2.6. Statistical Analysis

Data were expressed as the mean ± standard deviation (SD) with at least three replications. Data were analyzed with SPSS 20.0 (SPSS, Inc., Chicago, IL, USA) and Microsoft Excel 2007 (IBM Corp., Armonk, NY, USA). One-way analyses of variance (ANOVAs) and two-way ANOVA were used to assess the effects of development stages and organs as well as their interactionson the C, N, and P contents, C/N/P stoichiometric ratios, endogenous hormones, and NSC contents. The mean values of measured parameters at five development stages were used for principal component analysis (PCA). Differences were considered significant for all statistical tests at p ≤ 0.05. Figures were drawn using Origin 18.0 (Origin Lab., Northampton, MA, USA).

3. Results

3.1. Flower Developmentand Morphological Features

As shown in Figure 2, the flowers of M. Maudiae ‘Rubicunda’ are showy red solitary flowers with eight petals. The flowers are mostly foundon axillary leaves or rarely on the tops of branches (Figure 2A). Inflorescence emergence occurs from early to midAugust, depending on temperature and growing conditions.In the early stages of development (Figure 2B, a, stage 50), it was difficult to distinguish the floral bud or leaf bud until the air temperature gradually increased in early February of the following year. Flower differentiation resumed, and rapid development took place; the floral buds began to swell and open, the scales loosened and separated, and then the buds broke (Figure 2B, b, stage 52). As the temperature increasedtowards the middle/end of February, the flower buds developed rapidlyvia three dehiscence steps, and three rings of bract shedding marks were observed on the pedicel (Figure 2B, c–f, stages 54, 57, 58, and 59). When the bractsare completely abscised, the flowers with 7–9 petals are about to bloom. Moreover, the outer ring of petals is obovate, and the inner two rings become narrower. When the flowerfirst opens, the petals are purplish red, and the stamens are close to the pistil (Figure 2B, g, stage 62). The flowers are fully unfolded, the petals are erect, the upper part is whitish, the lower part is purplish red, and the stamens are slightly open (Figure 2B, h, stage 65). Asthe petals begin to wither, the stamens arefully spread out, and the pistils are clearly visible (Figure 2B, i, stage 67), followed by fruit development (Figure 2B, j, stage 69). During flower development, longer periods and partial/total overlap are observedbetween inflorescence development and flowering within individual trees (Figure 2A). Moreover, morphological parameters were also measured, and the results showed that flower length ranged from 38.62 mm to 71.78 mm and width ranged from 11.75 mm to 45.22 mm at five developmental stages, respectively. The length of petals ranged from 39.24 mm to 78.96 mm at five developmental stages, and the width ranged from 23.16 mm to 33.85 mm, respectively. Moreover, the relative water content (RWC) in the petals varied from 73% to 85% (Table S1).

3.2. C, N, and Pcontents

As shown in Figure 3, developmental stages and organs have significant effects on C, N, and P contents, but no significant differences were found in the interaction effects between developmental stages and organs (p > 0.05). The C contents in the petal ranged from 452.7 to 490.9 g/kg and 454.1 to 482.4 g/kg in the GA, respectively. The maximum C concentration in the petal and GA was found in the S4 and S5, respectively. There were no significant differences among the five development stages (Figure 3A). The N contents in the petal ranged from 10.8 to 12.7 g/kg, butthe values showed slightly decreasing trends from S1 to S5. Similar to the patterns in the petal, the N contents in the GA also displayed a decrease from S1 toS5, and the values ranged from 16.4 to 23.0 g/kg over the flower development stages. In addition, the values in the GA were significantly higher than those in the petal at five developmental stages (Figure 3B). The P contents in the petal ranged from 0.533 to 0.652 g/kg, and the values showed increasing trends from S1 to S5. However, the P contents in the GA tended to decrease from S1 to S5, and the values ranged from 0.773 to 0.848 g/kg duringflower development. Moreover, the values in the GA were significantly higher than those in the petals at five development stages (Figure 3C). These results showed that the responses of N and P contents in flowers were more sensitive to developmental stages and organs than those of C contents.

3.3. C/N/P Stoichiometry

As shown in Figure 4, developmental stages and organs significantly affected the patterns of C/N, C/P, and N/P ratios, but no significant differences in the interaction effects of developmental stage and organ were found (p > 0.05). The C/N ratios in the petal ranged from 36.3 to 43.3,andthose in the GA ranged from 20.4 to 28.5 at five developmental stages, respectively. The maximum C/N ratios in the petal and GA were found in S5 (Figure 4A). The C/P ratios were significantly different at five developmental stages, and the values ranged from 752.3 to 869.0in the petal and from 551.7 to 603.7in the GA, respectively (Figure 4B). The N/P ratios in the petal and GA ranged from 17.5 to 23.1 and 20.9 to 27.2 over the flower development stages, respectively. The N/P ratios in the petal tended to decrease from S1 to S5, and the N/P ratios in the GA also showed a slight decreasing trend from S1 to S5. The values of N/P ratios in the petal were significantly lower than those in the GA atfive developmental stages (Figure 4C). These observations suggested that the C/N, C/P, and N/P ratios in flowers are significantly affected by developmental stages and organs.

3.4. Non-Structural Carbohydrates (NSC) Contents

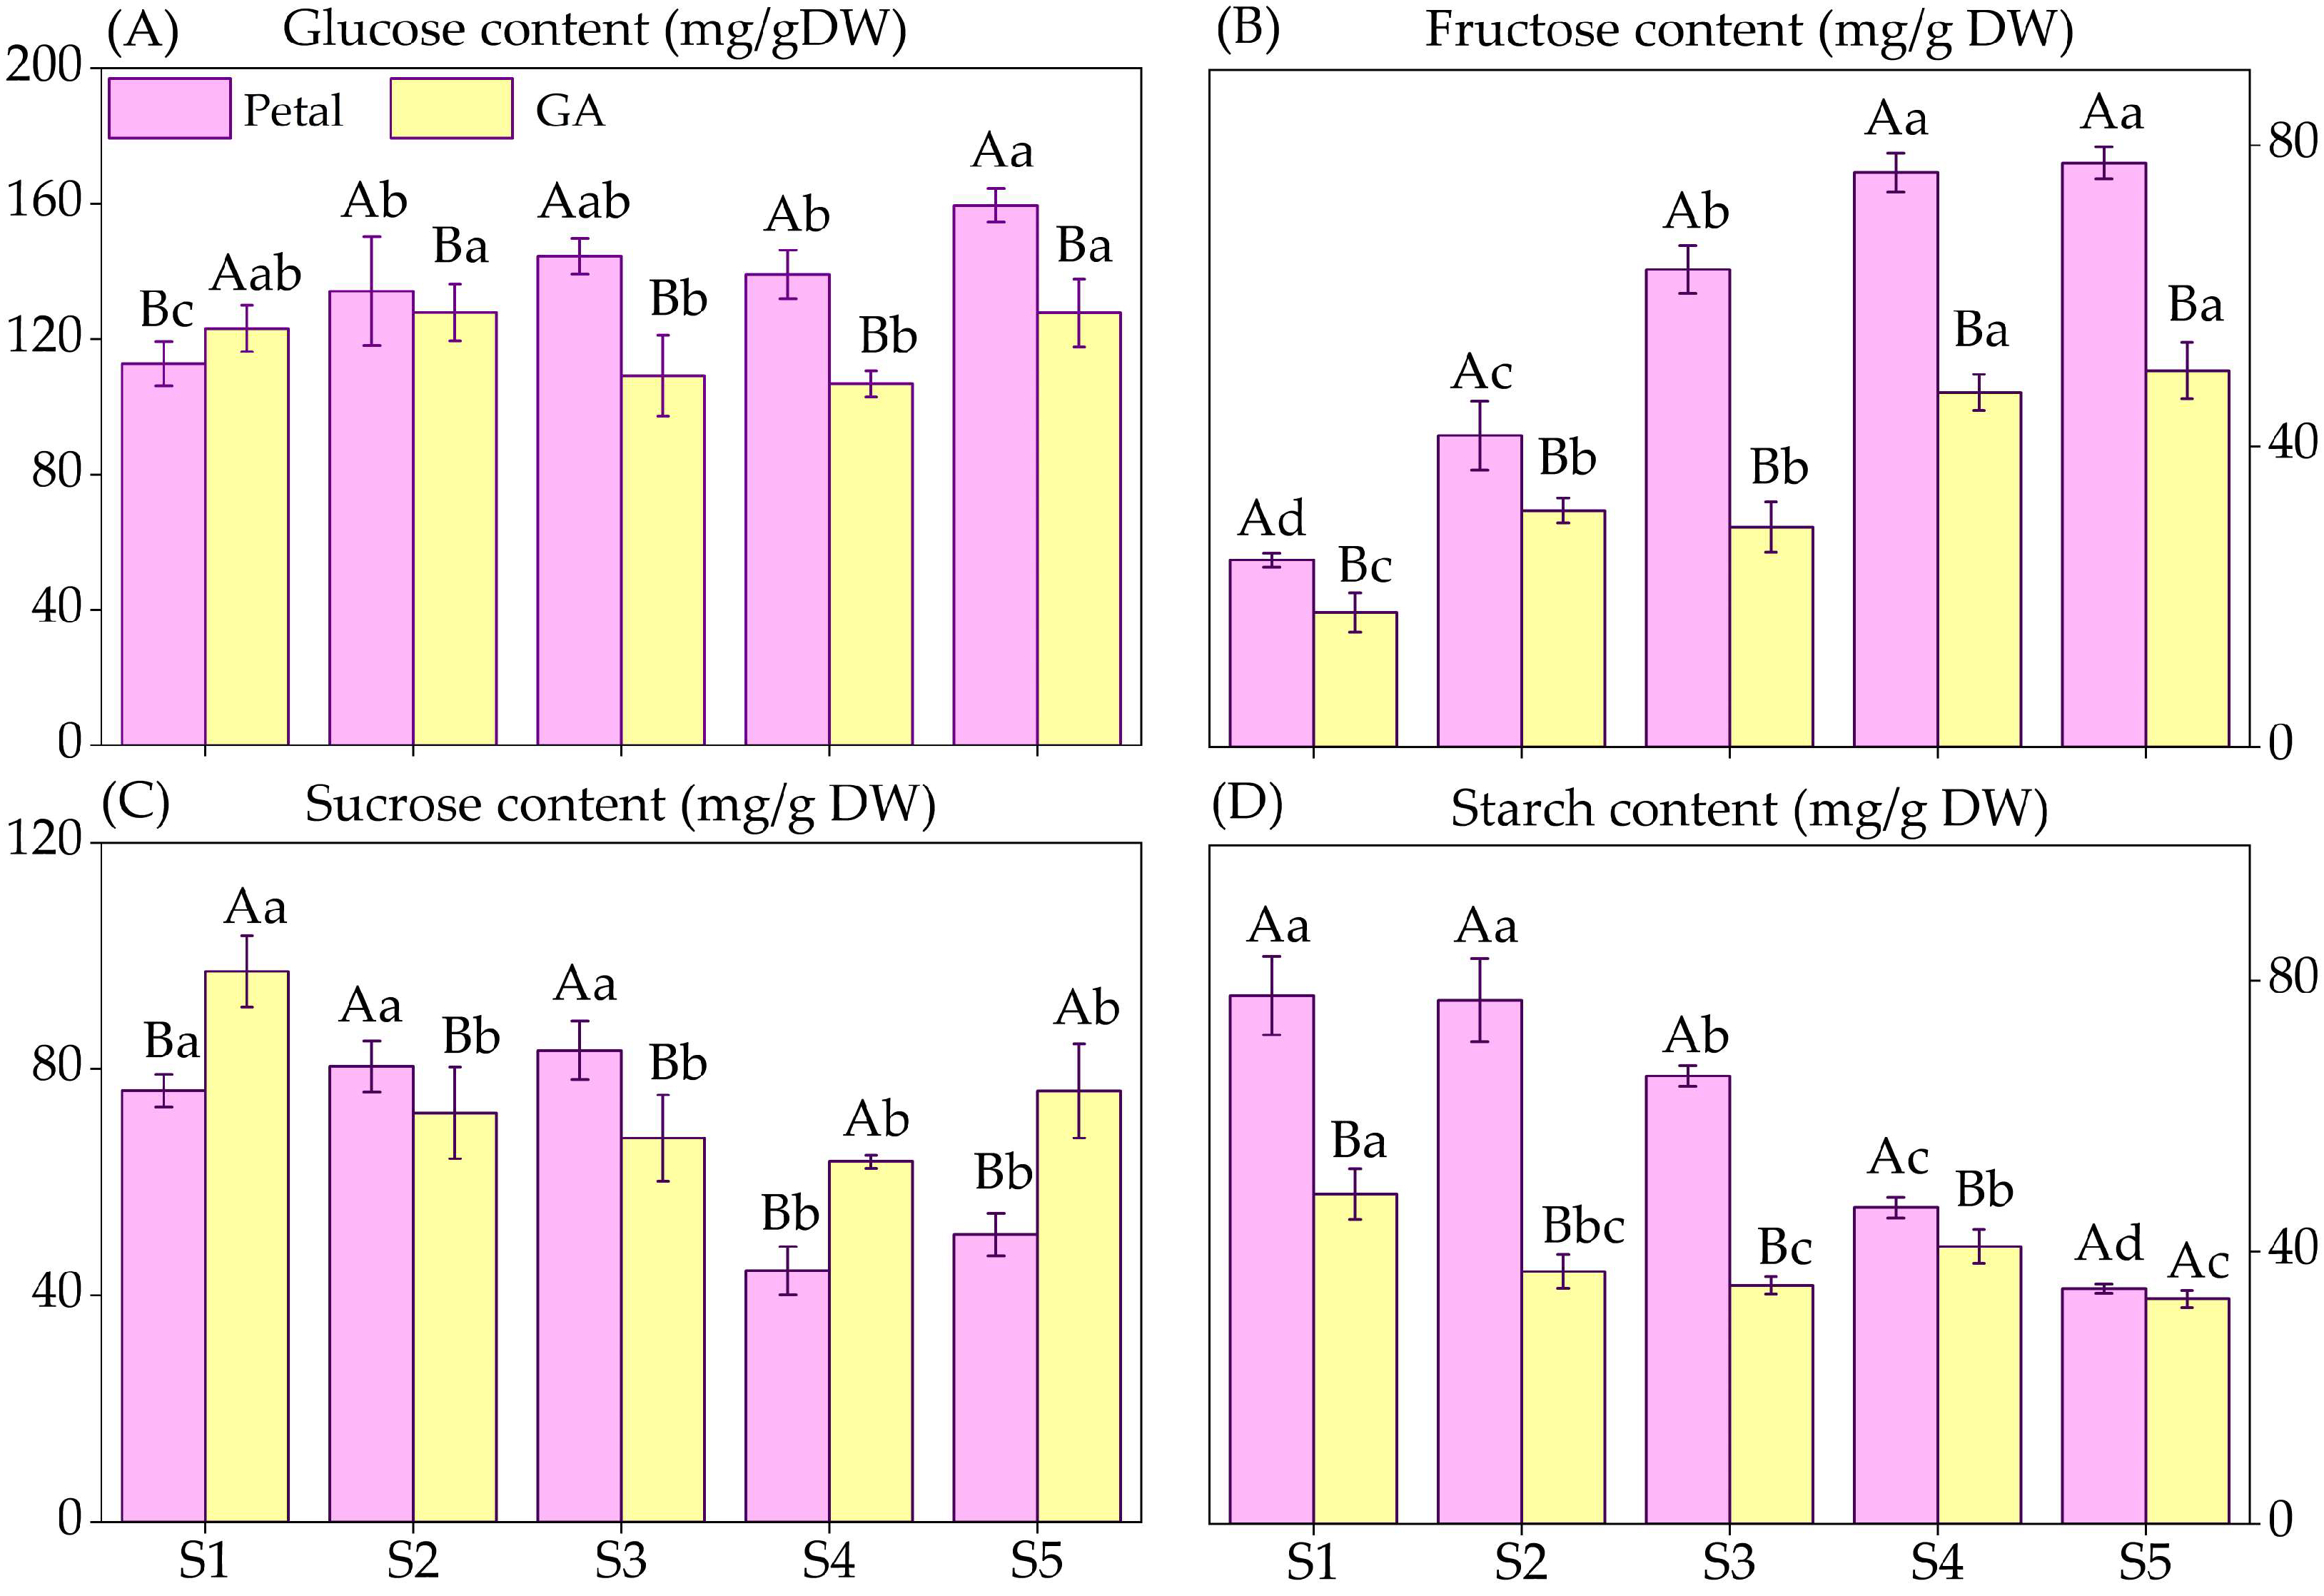
As shown in Figure 5, significant differences in the NSC contents in the petal and GA were observed at five developmental stages. The glucose contents in the petal ranged from 112.8 to 159.5 mg/g and 106.8 to 127.8 mg/g in the GA, respectively. The glucose contents in the petal had a tendency to increase from S1 to S5, but the GA glucose contents showed a slight decreasing trend from S2 to S3. The values in the petal were significantly higher than those in the GA, except for at S1 (Figure 5A). The fructose contents in the petal and GA ranged from 24.9 to 77.7 mg/g and 17.9 to 50.1 mg/g, respectively. The fructose content in the petal had a tendency to increase from S1 to S5, and the highest and the lowest values were found at S5 (77.7 mg/g DW) and S1 (24.9 mg/g DW), respectively. The GA fructose content also showed aremarkable increasing trend from S1 to S5, reaching its maximum value at S5 (50.1 mg/g DW) and its minimum value at S1(17.9 mg/g DW). The fructose content in the petal was significantly higher than that in the GA at five developmental stages (Figure 5B). The sucrose contents were significantly different at five developmental stages; the values in the petal ranged from 44.3 to 83.2 mg/g and 63.6 to 97.2mg/g in the GA, respectively. In the petal, the maximum and minimum sucrose contents were recorded at S3 and S4, respectively. In the GA, the maximum and minimum sucrose contents were found at S1 and S4, respectively (Figure 5C). The starch contents in the petal and GA had a tendency to continue to decrease fromS1 to S5 and ranged from 34.6 to 77.8 mg/g in the petal and 33.1 to 48.5 mg/g in the GA, respectively (Figure 5D). These observations showed that the glucose, sucrose, fructose, and starch contents in flowers are significantly affected by developmental stages and organs and their interactions.

3.5. Endogenous Hormones Content and Their Specific Values

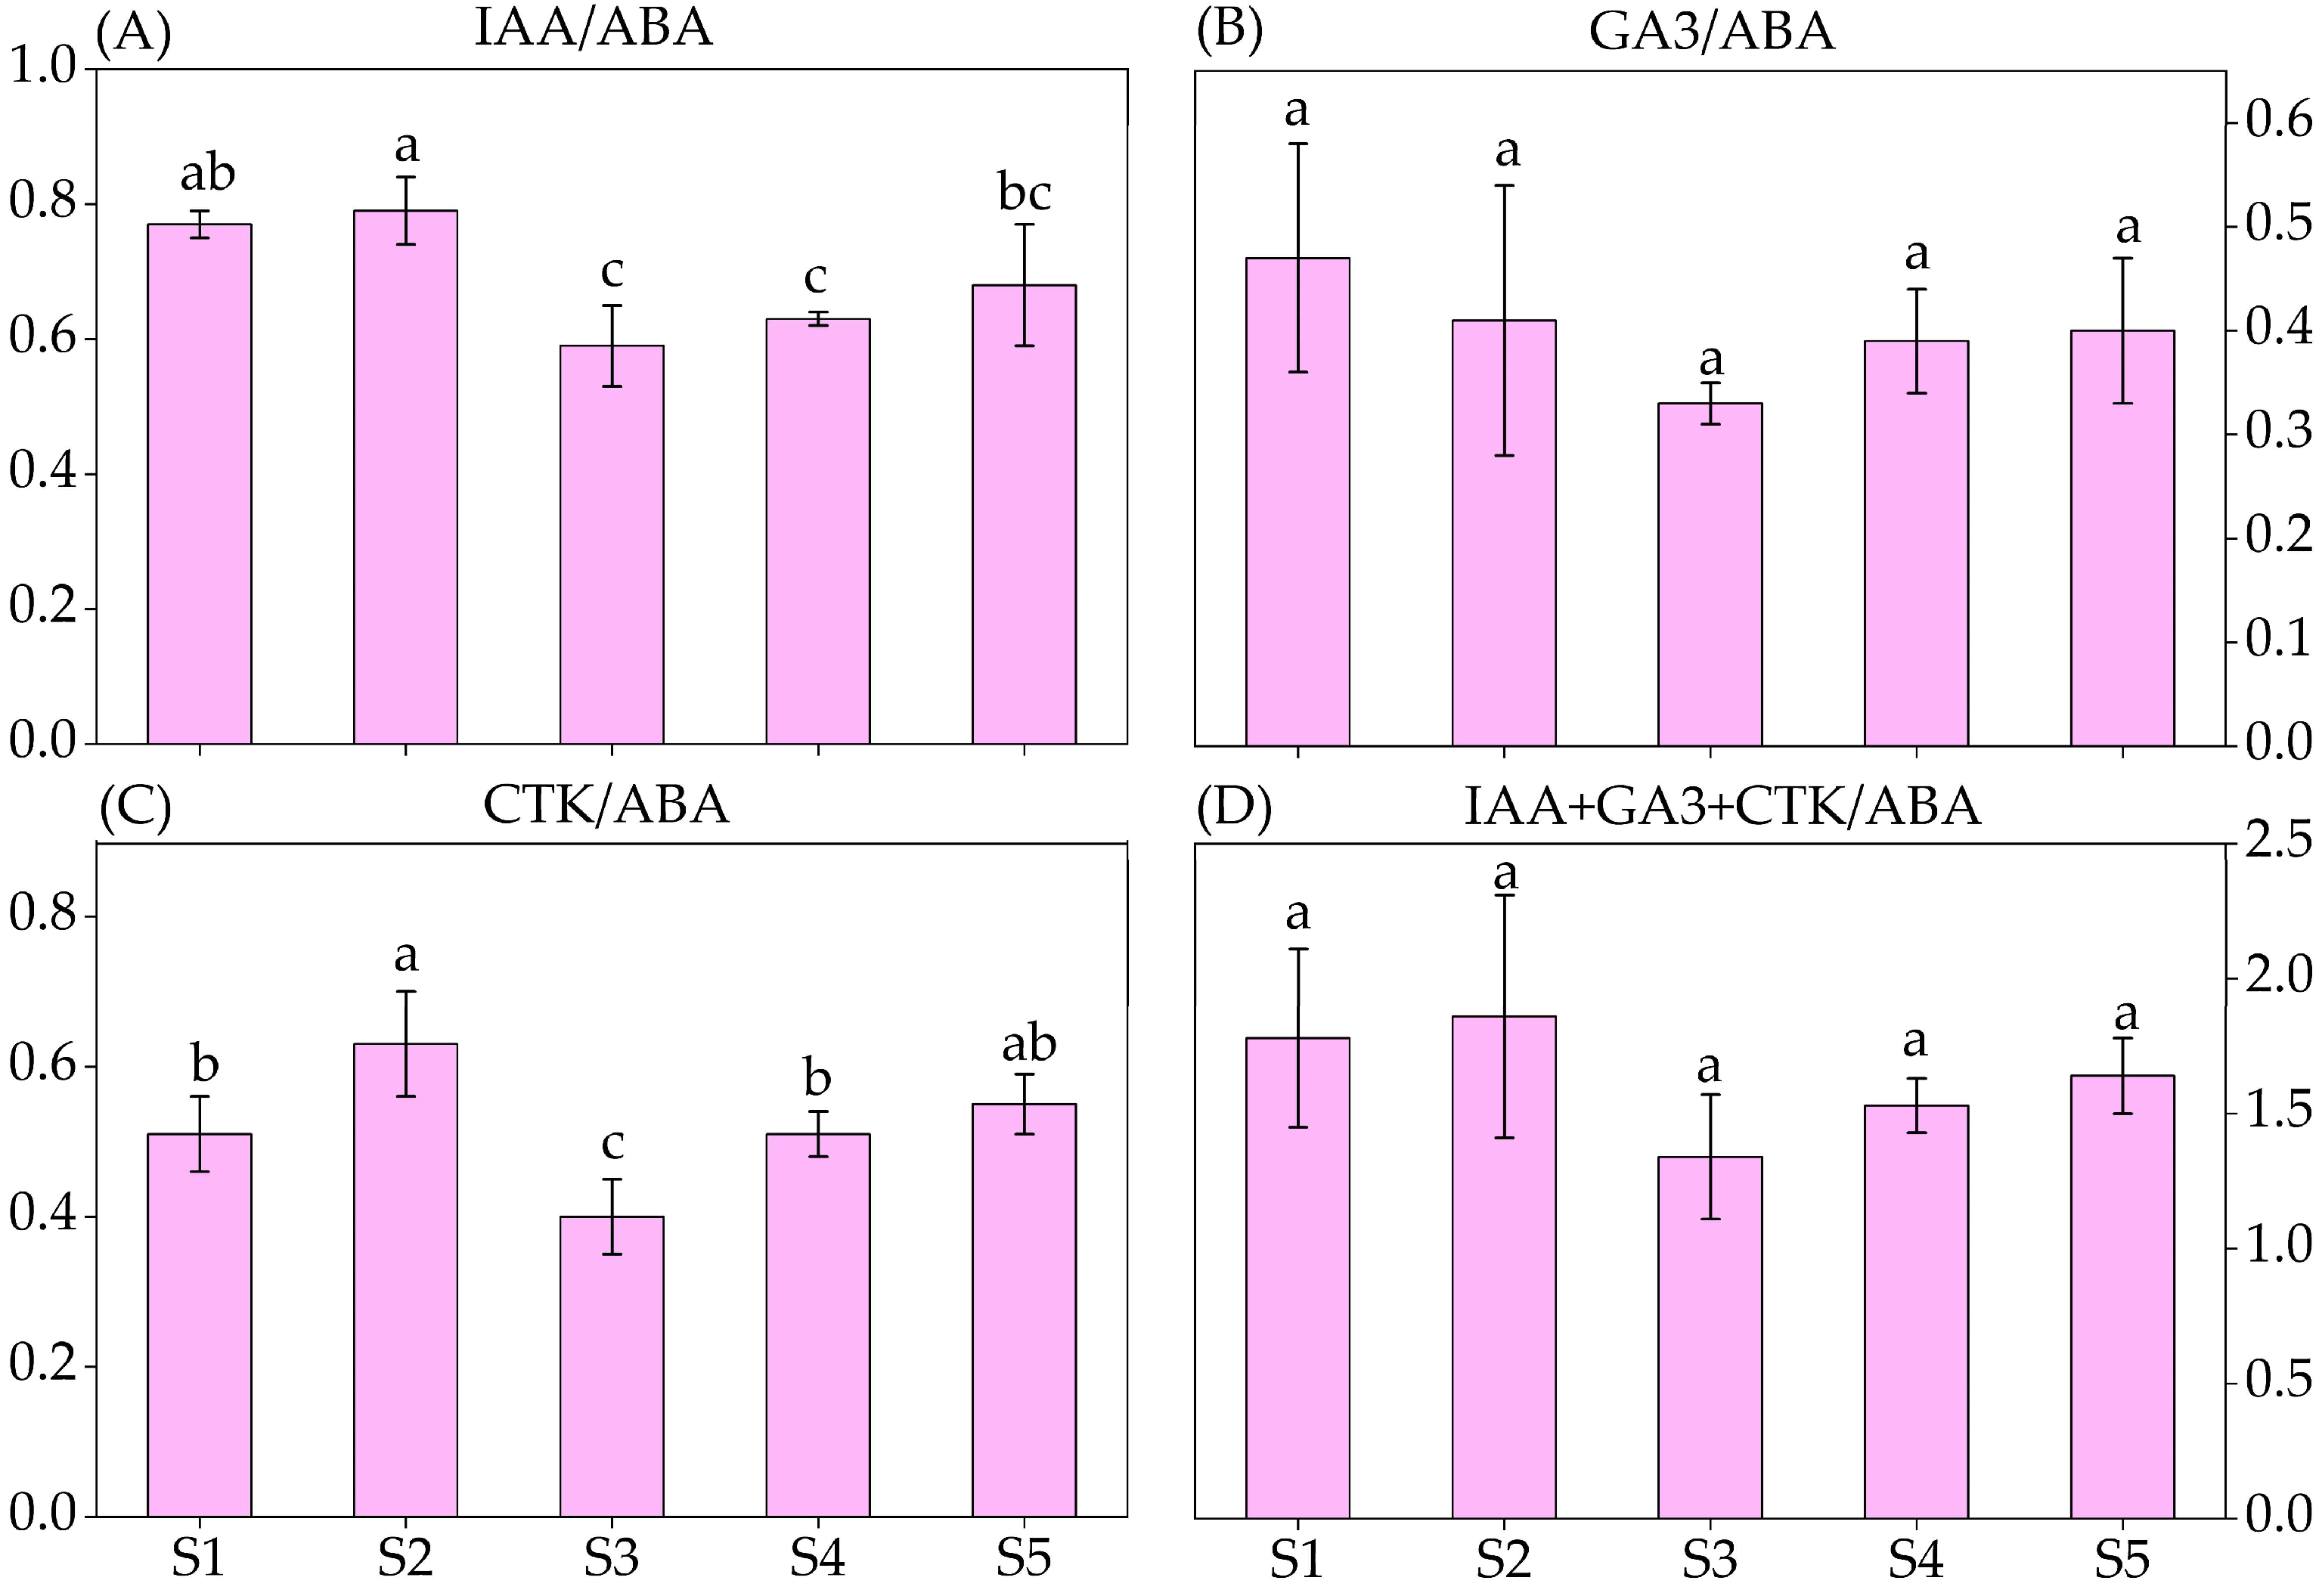
As shown in Figure 6, developmental stages can significantly affect the contents of ABA, IAA, CTK, and GA3, and significant differences were foundinthe interaction effects of developmental stage and organs (p ≤ 0.05). The IAA content in the petal gradually decreased from S1 to S5, reaching its minimum level of 1.04 nmol/g (Figure 6A). The ABA, GA3, and CTK contents reached the maximum levels of 1.92 nmol/g (Figure 6B), 0.72 nmol/g (Figure 6C), and 0.94 nmol/g (Figure 6D), respectively. As shown in Figure 7, the GA3/CTK ratio gradually decreased from S1 to S5, and the maximum value was 0.92 at S1. The ratios of GA3/IAA and CTK/IAA ranged from 0.51 to 0.62 and from 0.66 to 0.83 at five developmental stages, respectively. As shown in Figure 8, the ratios of IAA/ABA, GA3/ABA, CTK/ABA, and (IAA + GA3 + CTK)/ABA at S1 and S2 were significantly higher than those at S3, S4, and S5. The highest ratios of IAA/ABA, GA3/ABA, CTK/ABA, and (IAA + GA3 + CTK)/ABA were recorded at S2 (0.81), S1 (0.47), S2 (0.64), and S2 (1.86), respectively. The minimum ratios of IAA/ABA, GA3/ABA, CTK/ABA, and (IAA + GA3 + CTK)/ABA were observed at S3 (0.60), S3 (0.33), S2 (0.41), and S2 (1.34), respectively.

3.6. Principal Component Analysis (PCA)

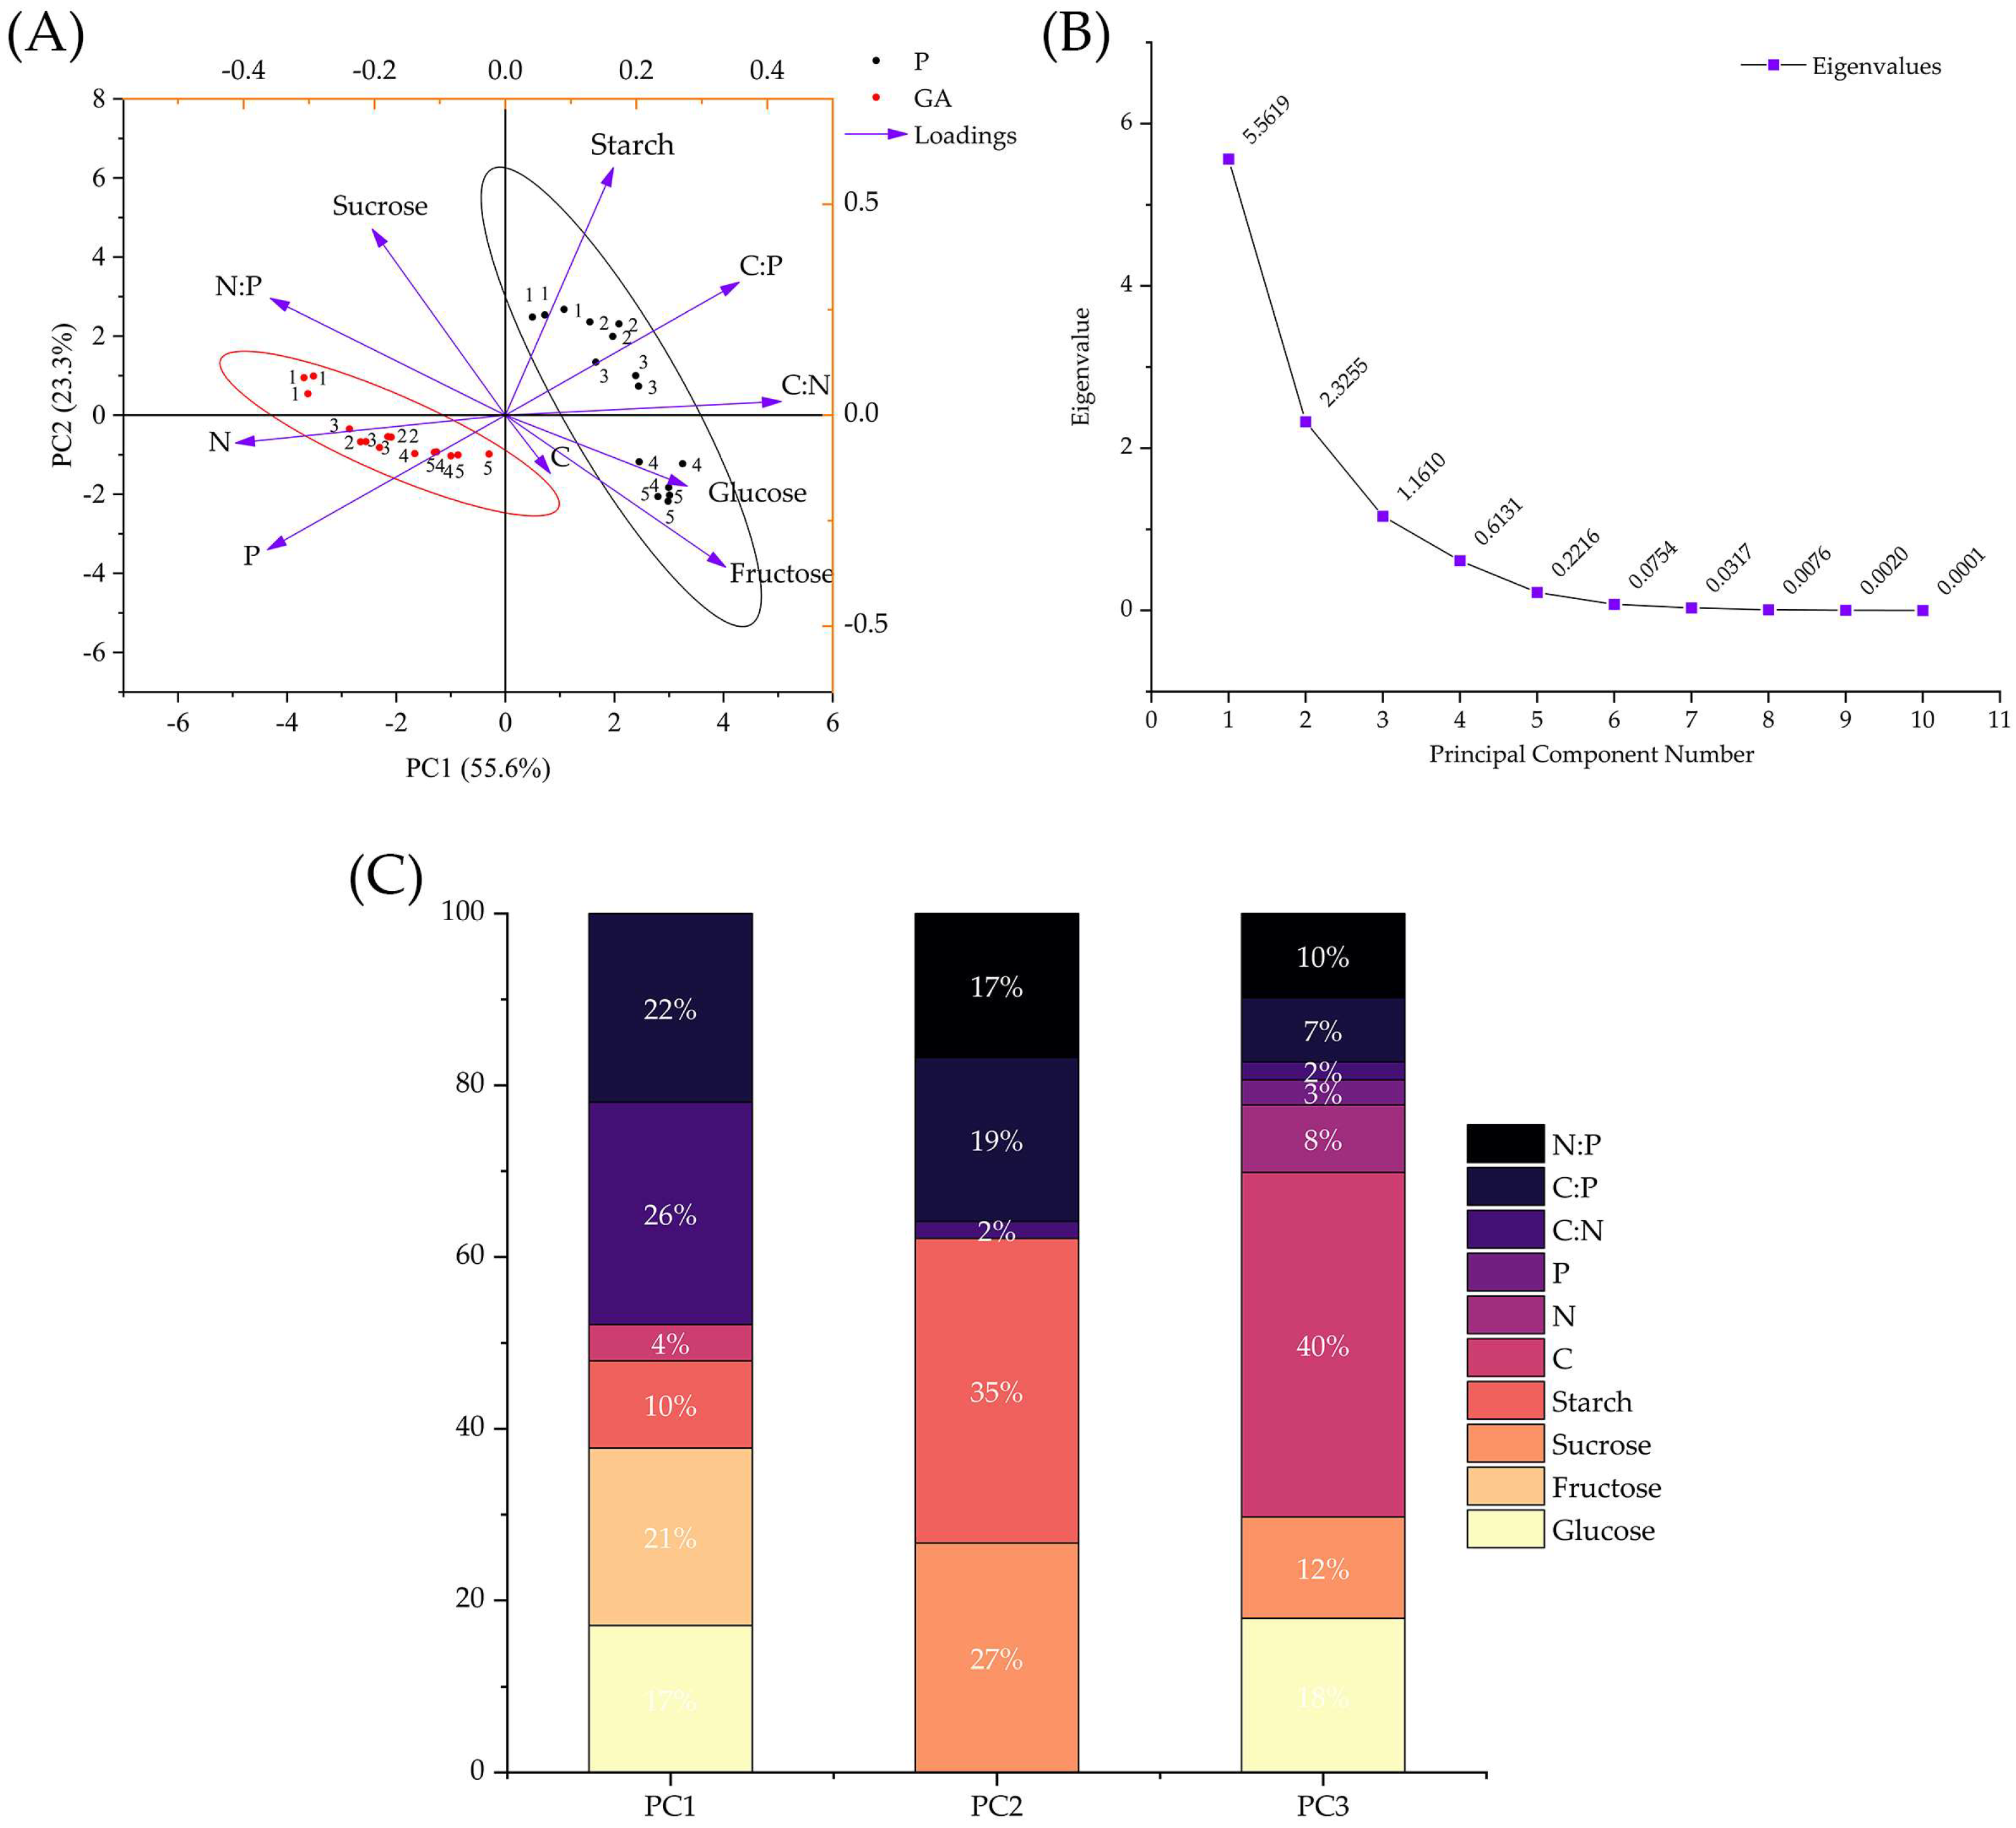
As shown in Figure 9, PCA results showed that significant differences (p  <  0.05) are observed in C, N, P, and NSC contents, as well as C/N/P stoichiometric ratios at five developmental stages. Two principal components (PCs) accounted for 100.00% of the total variance, of which principal component 1 (PC1) and principal component 2 (PC2) contributed 55.6% and 23.3%, respectively. The PCA plot revealed that the variables (mineral contents, nutrient ratios, and NSC) were divided into four main clusters. Starch, C/N, and C/P were in the upper right, indicating that theywere significantly positively correlated with five development stages. N/P ratio, fructose, glucose, and sucrose also contributed significantly. N and P showed a negative relationship with other parameters (Figure 9A). These results indicated that mineral contents, C/N/P stoichiometric ratios, and NSC were highly correlated with developmental stages and flower organs. As shown in Figure 9B, the eigenvalues of PC1, PC2, and PC3 are 5.56, 2.33, and 1.16, respectively, and may describe 90.48% of the totalPC. Figure 9C represents the 100% stacked bar, showing the trend of the percentage contribution of each tested parameter over the development stages. The results show that the ratios of C/N and C/P ratiosin PC1 have the highest contribution to flower development, the starch content in PC2 is the key index of flower development, and the C content in PC3 plays an important role during flower development.

4. Discussion

M. maudiae ‘Rubicunda’ is one of the most popular ornamental plants due to its long-lasting flowering period and distinctive beauty. In general, the variation in flower bud differentiation time may depend on nutrient level, cultivation, and environmental conditions [24,25]. The RWC of petals is an important factor for petal growth, and the quality of oil-bearing rose petals [10]. In our study, the RWC of petals increased with the developmental stage during flower development. Variations in morphological parameters and RWC of flowers have been reported in Styrax japonicus and other ornamental species during flower development [10,31,32]. Moreover, during flower development, a longer period and partial/total overlap between inflorescence development and flowering was observed within individual trees of M. maudiae ‘Rubicunda’ (Figure 2A). Similarly, this long period of inflorescence bud development has also been observed in many species, such as Pistacia vera, Hysalis peruviana, and Abelmoschus manihot [30,33,34]. However, during the flower development of M. Maudiae ‘Rubicunda’, this phenomenon occurred simultaneously for 3−4 months, the reason for which requires further analysis.
N and P are two of the most important mineral nutrientsthatinfluence growth, biomass production, metabolism, energy, and protein synthesisin plants [7]. C, N, and P contents and C/N/P stoichiometry largely reflect thenutrient status and the ability of plants to capture resources, which are strongly coupled in their biochemical functioning and balance [5,6]. Studies have reported the variationof C, N, and P contents during flower development, such as for Juglans sigillata, Cercis chinensis, olive, etc. [11,12,35]. In the current study, the C contents of the petals and GA showed less variation compared to those of N and P at five developmental stages in M. maudiae ‘Rubicunda’ flowers. Generally, total N and P contents in the GA were significantly higher than those in petals and decreased with developmental times (Figure 3A). One potential explanation is that the petals may have a buffering function to store N and P in flowers, but the GA is an important organ for maintaining flower development in M. maudiae ‘Rubicunda’ [2,4]. The N and P patterns may reflect the general constraints or allocation rules governing the partitioning of nutrients among the organs of flowers. This canalso be explained by the fact that the rapidly growing organ needs relatively more P-rich ribosomal RNA (approx. 9% by mass) to maintain a rapid rate of protein synthesis [5,7,36]. Thus, the differences between N and P content may be due to the uptake, allocation, and transport of these nutrients across compartments based on different physiological needs in different organs of flowers. Moreover, there are great variations of C/N/P stoichiometric ratios in the petal and GA of the M. maudiae ‘Rubicunda’ flower during flower development. The ratios of C/Nand C/P in the petals were remarkably higher than those in the GA at different stages of development, while an opposite trend was observed for the N/P ratio (Figure 4). There are two possible reasons for these differences. One potential reason is an imbalance between C assimilation and N supply for the different efficiencies in the petals and GA. The other potential reason is that the N supply surpasses demand when more N is allocated to the GAand/or petals during flower development in M. maudiae ‘Rubicunda’. Guo et al. (2022) noted that the C/N ratio of buds was higher at the stage of flower bud differentiation in Lycium ruthenicum, which may be due to the fact that carbohydratesmayincrease vascular sap levels and provide key nutrients for flower bud differentiation [23]. N/P ratios may provide a reliable index of N and/or Plimitation in plants, and the optimal range of N/P ratios is between 10 and 20 on a mass basis. As a general rule, N/P ratios < 14 indicate N limitation, while N/P ratios > 16 indicate P limitation [5,7]. The present study showed that N/P ratios in the petal and GA ranged from 17.5 to 23.1 and 20.9 to 27.2 at five developmental stages, respectively, and were significantly higher than 16. This is consistent with the previous finding that flowers are rich in mitochondria, which have higher N and P levels [37]. Based on the above results, the variation in C, N, and P contents, as well as stoichiometric ratios, reflects the nutrientrequirements and dynamic balances between developmental stages and organs, as demonstrated by the strong positive correlations with NSC and hormone contents (Figure 9). However, it remains unclear to what extent the differences in nutrient levels and their stoichiometry in M. maudiae ‘Rubicunda’ affect flower development, and further studies are still needed.
During flower development, NSCs have important contributions as energy sources, osmotic regulators, and precursors of metabolic processes [15,38]. Numerous studies have confirmed that flower development is dependent on carbohydrate metabolism in Dendrobium crumenatum, Oncidium orchid, and Creeping bellflower [13,17,39]. Some reports have also shown that soluble sugars are the main source of energy for flowers, and the lack of sugar leads to undersized petals or arrests flower development [21]. In our research, the higher glucose, fructose, and starch contents in petals were observed compared to those in the GA, and the NSC contents in the petals appeared to be more viable than those in the GA. Moreover, the significant variations in glucose, sucrose, fructose, and starch were corrected with developmental stages and organs (Figure 5). From the above results, it can be concluded thatthe variations of NSC contentsin developing flowers of M. maudiae ‘Rubicunda’ were more sensitive to developmental stages and/or organs. Contradictory to our results, sucrose, and glucose content did not change, but fructose content increased during the development of borage flowers. In cornflowers, the sucrose content did not show any changes, but glucose and fructose content increased as flower development progressed in sweet briar rose [21,40]. These different phenomena may be due to the fact that the variations of NSC contentsnot only depend on flower development stages but also on plant species, nutrient availability, growth conditions, etc. Moreover, highly significant correlations were described between NSC and C/N/P stoichiometric variables at five developmental stages in M. maudiae ‘Rubicunda’flowers, which are the probably result of the dynamic balances of NSC storage, migration, conversion, and availability.
Endogenous hormone levels and their ratiosplay important rolesduring flower development. Numerous studies have reported that IAA, ABA, GA3,and CTK are the primary factors involved in the regulation of flower development [2,9,41,42]. In Lycium ruthenicum, IAA levels decreased significantly from flower bud pre-differentiation to late flower differentiation, which indicated that floral induction needs lower IAA levels. ABA levels significantly increased from flower bud pre-differentiation to late flower differentiation, showing that ABA could promote flower differentiation, flower opening, and senescence in Lycium ruthenicum [23]. Moreover, previous studies have also reported that GA3 levelswere significantly changed in the homeotic transformation of flower organs in double-flower loquat, and the higher GA3 can promote the flower differentiation of Lycium ruthenicum, olive, and loquat [23,35,43]. These findings showed that endogenous hormones are also controversial, showing that they have positive and/or negative effects during flower development. In the present study, IAA, ABA, GA3,and CTK levels in the petals were dynamicat five developmental stages in M. maudiae ‘Rubicunda’ flowers (Figure 6). During flower development, flower formation is the result of hormone levels, their interaction, and/or their ratio, including promoting endogenous hormone ratio and promoting endogenous hormones to suppress endogenous hormone ratio [23,44]. The present results showed that the ratios of IAA, ABA, GA3,and CTK in the petal varied significantly at five developmental stages in M. maudiae ‘Rubicunda’ flowers (Figure 7 and Figure 8). It is worth noting that the ABA content correlates significantly with the developmental stages and is the main reason for the changes in the ratios between the phytohormone concentrations. However, further studies are needed to clarify the relationship between developmental stages and hormone levels in M. maudiae ‘Rubicunda’ flowers.

5. Conclusions

In summary, the current study provides a detailed description of the morphological features and changes in C, N, P, and NSC contents and hormone content in M. maudiae ‘Rubicunda’ at five developmental stages. The C, N, P, and NSC contents and endogenous hormone content in M. maudiae ‘Rubicunda’ flower exhibited variations at different development stages and organs. In addition, higher contents of ABA, GA3, and CTK and higher ABA/IAA ratio and ABA/GA3 ratio in petals may also be beneficial to the flower bud differentiation of M. maudiae ‘Rubicunda’. Taken together, the variations of C, N, and P contents were closely related to the NSC and endogenous hormone contents during the flowering process in M. maudiae ‘Rubicunda’. PCA analysis revealed that C, N, and P contents, C/N/P stoichiometric ratios, and NSC were highly correlated with developmental stages and flower organs in M. maudiae ‘Rubicunda’. Overall, these tested parameters help to understand the flower development of M. maudia ‘Rubicunda’ and provide valuable information for the effective management of this species. Further studies will focus on the complex regulatory networks of color formation in the petals underlying flower development in M. maudiae ‘Rubicunda’.

Supplementary Materials

The following supporting information can be downloaded at https://www.mdpi.com/article/10.3390/horticulturae9111198/s1. Table S1: Morphological characteristics of M. maudiae ‘Rubicunda’ flowers at five development stages. Table S2: Correlation coefficients of C, N, P, and NSC contents as well as C/N/P ratio variables of M. maudiae ‘Rubicunda’ flowers at five developmental stages.

Author Contributions

Conceptualization, H.L. and S.G.; methodology, T.Y., Y.Y. and H.W.; software, validation, and formal analysis, T.Y., Y.Y. and H.W.; investigation, T.Y., Y.Y., H.W. and W.Q.; writing, original draft preparation, T.Y., H.L. and S.G.; writing, review and editing, T.Y., Y.Y., H.W., W.Q., Y.H., H.L. and S.G.; visualization and supervision, H.L. and S.G. All authors have read and agreed to the published version of the manuscript.

Funding

This research received no external funding.

Data Availability Statement

The data presented in this study are available on request from the corresponding author.

Acknowledgments

We are grateful to all of the group members and workers for their assistance in the field experiment.

Conflicts of Interest

The authors declare no conflict of interest.

References

  1. Pinakin, D.J.; Kumar, V.; Suri, S.; Sharma, R.; Kaushal, M. Nutraceutical potential of tree flowers: A comprehensive review on biochemical profile, health benefits, and utilization. Food Res. Int. 2020, 127, 108724. [Google Scholar] [CrossRef] [PubMed]
  2. Reid, M.S. Flower development: From bud to bloom. In Proceedings of the ISHS Acta Horticulturae 669: VIII International Symposium on Postharvest Physiology of Ornamental Plants, Doorwerth, The Netherlands, 1 February 2005; ISHS: Korbeek-Lo, Belgium, 2005; Volume 669, p. 12. [Google Scholar] [CrossRef]
  3. Sood, S.; Vyas, D.; Nagar, P.K. Physiological and biochemical studies during flower development in two rose species. Sci. Hortic. 2006, 108, 390–396. [Google Scholar] [CrossRef]
  4. van Doorn, W.G.; Kamdee, C. Flower opening and closure: An update. J. Exp. Bot. 2014, 65, 5749–5757. [Google Scholar] [CrossRef] [PubMed]
  5. Agren, G.I. Stoichiometry and nutrition of plant growth in natural communities. Annu. Rev. Ecol. Evol. Syst. 2008, 39, 153–170. [Google Scholar] [CrossRef]
  6. Güsewell, S. N:P ratios in terrestrial plants: Variation and functional significance. New Phytol. 2004, 164, 243–266. [Google Scholar] [CrossRef]
  7. Minden, V.; Kleyer, M. Internal and external regulation of plant organ stoichiometry. Plant Biol. 2014, 16, 897–907. [Google Scholar] [CrossRef]
  8. Jia, S.; Wang, Y.; Hu, J.; Ding, Z.; Liang, Q.; Zhang, Y.; Wang, H. Mineral and metabolic profiles in tea leaves and flowers during flower development. Plant Physiol. Biochem. 2016, 106, 316–326. [Google Scholar] [CrossRef]
  9. Trivellini, A.; Ferrante, A.; Vernieri, P.; Mensuali-Sodi, A.; Serra, G. Effects of promoters and inhibitors of ethylene and ABA on flower senescence of Hibiscus rosa-sinensis L. J. Plant Growth Regul. 2011, 30, 175–184. [Google Scholar] [CrossRef]
  10. Önder, S.; Tonguç, M.; Erbaş, S.; Önder, D.; Mutlucan, M. Investigation of phenological, primary and secondary metabolites changes during flower developmental of Rosa damascena. Plant Physiol. Biochem. 2022, 192, 20–34. [Google Scholar] [CrossRef]
  11. Zhang, W.; Li, J.; Zhang, W.; Njie, A.; Pan, X. The changes in C/N, carbohydrate, and amino acid content in leaves during female flower bud differentiation of Juglans sigillata. Acta Physiol. Plant. 2022, 44, 19. [Google Scholar] [CrossRef]
  12. Ren, H.Y.; Qian, W.Z.; Yi, L.; Ye, Y.L.; Gu, T.; Gao, S.; Cao, G.X. Nutrient composition and antioxidant activity of Cercis chinensis flower in response to different development stages. Horticulturae 2023, 9, 961. [Google Scholar] [CrossRef]
  13. Liu, Z.; Shi, Y.; Xue, Y.; Wang, X.; Huang, Z.; Xue, J.; Zhang, X. Non-structural carbohydrates coordinate tree peony flowering both as energy substrates and as sugar signaling triggers, with the bracts playing an essential role. Plant Physiol. Biochem. 2021, 159, 80–88. [Google Scholar] [CrossRef]
  14. Han, H.; He, H.; Wu, Z.; Cong, Y.; Zong, S.; He, J.; Fu, Y.; Liu, K.; Sun, H.; Li, Y.; et al. Non-structural carbohydrate storage strategy explains the spatial distribution of treeline species. Plants 2020, 9, 384. [Google Scholar] [CrossRef]
  15. Cho, L.H.; Pasriga, R.; Yoon, J.; Jeon, J.S.; An, G. Roles of sugars in controlling flowering time. J. Plant Biol. 2018, 61, 121–130. [Google Scholar] [CrossRef]
  16. Park, C.H.; Yeo, H.J.; Kim, Y.J.; Nguyen, B.V.; Park, Y.E.; Sathasivam, R.; Kim, J.K.; Park, S.U. Profiles of secondary metabolites (phenolic acids, carotenoids, anthocyanins, and galantamine) and primary metabolites (carbohydrates, amino acids, and organic acids) during flower development in Lycoris radiata. Biomolecules 2021, 11, 248. [Google Scholar] [CrossRef] [PubMed]
  17. Yap, Y.M.; Loh, C.S.; Ong, B.L. Regulation of flower development in Dendrobium crumenatum by changes in carbohydrate contents, water status and cell wall metabolism. Sci. Hortic. 2008, 119, 59–66. [Google Scholar] [CrossRef]
  18. Önder, S.; Tonguç, M.; Önder, D.; Erbaş, S.; Mutlucan, M. Flower color and carbohydrate metabolism changes during the floral development of Rosa damascena. S. Afr. J. Bot. 2023, 156, 234–243. [Google Scholar] [CrossRef]
  19. Roderick, B.; John, E.; Julian, H.; Allan, W. Flower opening in asiatic lily is a rapid process controlled by dark-light cycling. Ann. Bot. 2000, 86, 1169–1174. [Google Scholar] [CrossRef]
  20. Vergauwen, R.; Ende, W.V.D.; Van Laere, A. The role of fructan in flowering of Campanula rapunculoides. J. Exp. Bot. 2000, 51, 1261–1266. [Google Scholar] [CrossRef]
  21. Fernandes, L.; Pereira, J.A.; Saraiva, J.A.; Ramalhosa, S.E.; Casal, B. Phytochemical characterization of Borago officinalis L. and Centaurea cyanus L. during flower development. Food Res.Int. 2019, 123, 771–778. [Google Scholar] [CrossRef]
  22. Arrom, L.; Munné-Bosch, S. Hormonal changes during flower development in floral tissues of Lilium. Planta 2012, 236, 343–354. [Google Scholar] [CrossRef] [PubMed]
  23. Guo, Y.; An, L.; Yu, H.; Yang, M. Endogenous hormones and biochemical changes during flower development and florescence in the buds and leaves of Lycium ruthenicum Murr. Forests 2022, 13, 763. [Google Scholar] [CrossRef]
  24. Callaghan, C.B.; Png, S.K. Twenty-six additional new combinations in the Magnolia (Magnoliaceae) of China and Vietnam. PhytoKeys 2020, 146, 1–35. [Google Scholar] [CrossRef] [PubMed]
  25. Lang, X.; Yang, L.; Cui, T.; Zhang, S.; Qi, J. Relationship between diurnal changes of Micheliamaudiae var. rubicunda photosynthetic rate and environmental factors. J. Southwest For. Univ. 2017, 37, 22–27. [Google Scholar]
  26. Lang, X.A.; Yang, L.L.; Zhang, S.Z.; Li, L.F.; Zhang, S.Z. Morphological variation and reproductive application of Micheliamaudiae var. rubicunda. Subtrop. Plant Sci. 2019, 48, 50–55. [Google Scholar] [CrossRef]
  27. Meier, U.; Bleiholder, H.; Buhr, L.; Feller, C.; Hack, H.; Heß, M.; Lancashire, P.D.; Schnock, U.; Stauß, R.; van denBoom, T. The BBCH system to coding the phenological growth stages of plants, history and publications. J. Für Kult. 2009, 61, 41–52. [Google Scholar]
  28. Qian, W.; Hu, Y.; Lin, X.; Yu, D.; Jia, S.; Ye, Y.; Mao, Y.; Yi, L.; Gao, S. Phenological growth stages of Abelmoschus manihot: Codification and description according to the BBCH Scale. Agronomy 2023, 13, 1328. [Google Scholar] [CrossRef]
  29. Zhi, X.; Zou, J.; Ma, N.; Liu, T.; Hu, Y.; Yao, Y.; Wang, H.R.; Gao, S. Responses of the growth and nutrient stoichiometry in Ricinus communis seedlings on four soil types. J. Elem. 2022, 27, 223–238. [Google Scholar] [CrossRef]
  30. Liu, Q.; Huang, Z.; Wang, Z.; Chen, Y.; Wen, Z.; Liu, B.; Tigabu, M. Responses of leaf morphology, NSCs contents and C:N:P stoichiometry of Cunninghamia lanceolata and Schima superba to shading. BMC Plant Biol. 2020, 20, 354. [Google Scholar] [CrossRef]
  31. Chen, C.; Chen, H.; Ni, M.; Yu, F. A study on petal morphological and physiological characteristics of Styrax japonicus during the flowering period. Agronomy 2021, 11, 1498. [Google Scholar] [CrossRef]
  32. Chumber, M.; Jhanji, S. Morpho-physiological and biochemical characterization of Chrysanthemum varieties for early flowering under heat stress. S. Afr. J. Bot. 2022, 146, 603–613. [Google Scholar] [CrossRef]
  33. Polito, J.I.H.S. Pistillate and staminate flower development in dioecious Pistacia vera (Anacardiaceae). Amer. J. Bot. 1996, 83, 759–766. [Google Scholar] [CrossRef]
  34. Ramírez, F.; Fischer, G.; Davenport, T.L.; Pinzón, J.C.A.; Ulrichs, C. Cape gooseberry (Physalis Peruviana L.) phenology according to the BBCH phenological scale. Sci. Hortic. 2013, 162, 39–42. [Google Scholar] [CrossRef]
  35. Ulger, S.; Sonmez, S.; Karkacier, M.; Ertoy, N.; Akdesir, O.; Aksu, M. Determination of endogenous hormones, sugars and mineral nutrition levels during the induction, initiation and differentiation stage and their effects on flower formation in olive. Plant GrowthRegul. 2004, 42, 89–95. [Google Scholar] [CrossRef]
  36. Kerkhoff, A.J.; Fagan, W.F.; Elser, J.J.; Enquist, B.J. Phylogenetic and growth form variation in the scaling of nitrogen and phosphorus in the seed plants. Am. Nat. 2006, 168, E103–E122. [Google Scholar] [CrossRef]
  37. Handa, H.; Itani, K.; Sato, H. Structural features and expression analysis of a linear mitochondrial plasmid in rapeseed (Brassica napus L.). Mol. Genet. Genom. 2002, 267, 797–805. [Google Scholar] [CrossRef]
  38. Boriboonkaset, T.; Theerawitaya, C.; Yamada, N.; Pichakum, A.; Supaibulwatana, K.; Cha-um, S.; Takabe, T.; Kirdmanee, C. Regulation of some carbohydrate metabolism-related genes, starch and soluble sugar contents, photosynthetic activities and yield attributes of two contrasting rice genotypes subjected to salt stress. Protoplasma 2013, 250, 1157–1167. [Google Scholar] [CrossRef]
  39. Wang, C.Y.; Chiou, C.Y.; Wang, H.L.; Krishnamurthy, R.; Venkatagiri, S.; Tan, J.; Yeh, K.W. Carbohydrate mobilization and gene regulatory profile in the pseudobulb of Oncidium orchid during the flowering process. Planta 2008, 227, 1063–1077. [Google Scholar] [CrossRef]
  40. Msaada, K.; Hammami, M.; Marzouk, B.; Salem, N.; Limam, F. Variation in anthocyanin and essential oil composition and their antioxidant potentialities during flower development of Borage (Borago officinalis L.). Plant Biosyst. 2014, 148, 444–459. [Google Scholar] [CrossRef]
  41. Shalit, A.; Rozman, A.; Alvarez, J.P.; Bowman, J.L.; Eshed, Y.; Lifschitz, E. The flowering hormone florigen functions as a general systemic regulator of growth and termination. Proc. Natl. Acad. Sci. USA 2009, 106, 8392–8397. [Google Scholar] [CrossRef] [PubMed]
  42. Kitamura, Y.; Yamane, H.; Gao-Takai, M.; Tao, R. Changes in plant hormone contents in Japanese apricot flower buds during prolonged chilling exposure. In Proceedings of the ISHS Acta Horticulturae 1208: II Asian Horticultural Congress, Chengdu, China, 30 August 2018; ISHS: Korbeek-Lo, Belgium, 2018; Volume 1208, pp. 251–256. [Google Scholar] [CrossRef]
  43. Chi, Z.; Wang, Y.; Deng, Q.; Zhang, H.; Pan, C.; Yang, Z. Endogenous phytohormones and the expression of flowering genes synergistically induce flowering in loquat. J. Integrat. Agric. 2020, 19, 2247–2256. [Google Scholar] [CrossRef]
  44. Wu, Y.; Peng, C.; Yu, X.; Shen, Y. Biochemical Changes during fruit and seed development in Nanjing Linden (Tilia miqueiana M.). Forests 2023, 14, 969. [Google Scholar] [CrossRef]
Figure 1. Morphological changes in flower development in M. maudiae‘ Rubicunda’ at five development stages. (A) Whole flower, (B) Petals, (C) Gynoecium, and androecium (GA). S1: green bud stage/flower bud differentiation (stage 1). S2: mature flower budstage/floral bud elongation (stage 2). S3: early bloomingstage(stage 3). S4: fully opened flower stage (stage 4). S5: senescent flowerstage (stage 5). Scale bar = 1 cm.
Horticulturae 09 01198 g001
Figure 2. The general look of M. maudiae ‘Rubicunda’ tree (A) and its flower development (B). Scale bar = 1 cm. a (Stage 50), the first tender green flower buds are visible on the main stem. b (Stage 52), the flower bud breaks through the first layer of bracts; the outer bracts are light brown, and the inner flower buds are green. c (Stage 54), flower buds and peduncles are elongated, and the first bract shedding marks are clearly visible. d (Stage 57), pedicels continue to elongate; second bract shedding mark is clearly visible. e (Stage 58), flower buds break through the third bract, purple petals visible. f (Stage 59), the third layer of bracts falls off, the whole petal closes, and flower bud begins to open. The first flower will blossom the next day. g (Stage 62), the petals are purple-red, and the stamens are close to the pistils. h (Stage 65), the petals are erect, the upper part is whitish, the lower part is purple-red, and the stamens are slightly open. i (Stage 67), the petals wither, the stamens fully unravel, and the flower begins to decay. j (Stage 69), end of flowering, and fruit set visible.
Horticulturae 09 01198 g002
Figure 3. Changes in C (A), N (B), and P (C) contents atfive developmental stages of M. maudiae‘Rubicunda’ flowers. Values represent the mean ± standard deviation (n = 3). Different lowercase letters above bars indicatesignificant differences among stages at p ≤ 0.05. Different uppercase letters above the bars indicate significant differences among organs at p ≤ 0.05.
Horticulturae 09 01198 g003
Figure 4. Changes in C/N (A), N/P (B), and C/P (C) ratios at five developmental stages of M. maudiae ‘Rubicunda’ flowers. Each value represents the mean ± standard deviation (n = 3). Different lowercase letters above bars indicate significant differences among stages at p ≤ 0.05. Different uppercase letters above the bars indicate significant differences among organsat p ≤ 0.05.
Horticulturae 09 01198 g004
Figure 5. Changes inglucose (A), fructose (B), sucrose (C), and starch (D) contents in five developmental stages of M. maudiae ‘Rubicunda’ flowers. Each value representsthe mean ± standard deviation (n = 3). Different lowercase letters above bars denote significant differences among stages at a significance level of p ≤ 0.05. Different uppercase letters above bars denote significant differences among organs at a significance level of p ≤ 0.05.
Horticulturae 09 01198 g005
Figure 6. Changes in endogenous hormone contents in the petal during M. maudiae ‘Rubicunda’ flower development at five developmental stages. (AD) represent the acetic acid (IAA), abscisic acid (ABA), gibberellic acid 3 (GA3), and cytokinin (CTK) contents, respectively. Each value represents the mean ± standard deviation (n = 3). Different lowercase letters above bars denote significant differences among stages at a significance level of p ≤ 0.05.
Horticulturae 09 01198 g006
Figure 7. Changes in promoting endogenous hormone ratio in the petal of M. maudiae ‘Rubicunda’ flower at five developmental stages. Value represents the mean ± standard deviation(n = 3). (A) the ratios of GA3/CTK. (B) the ratios ofGA3/IAA. (C) the ratios of CTK/IAA. Different lowercase letters above bars denote significant differences among stages at a significance level of p ≤ 0.05.
Horticulturae 09 01198 g007
Figure 8. Changes in promoting endogenous hormones to suppress endogenous hormone ratio in the petalof M. maudiae ‘Rubicunda’ flower at five developmental stages. Value represents the mean ± standard deviation(n = 3). (A) the ratios of IAA/ABA. (B) the ratios of GA3/ABA. (C) the ratios of CTK/ABA. (D) the ratios of (IAA + GA3 + CTK)/ABA. Different lowercase letters above bars denote significant differences among stages at a significance level of p ≤ 0.05.
Horticulturae 09 01198 g008
Figure 9. Principal component analysis (PCA) of tested parameters of M. maudiae ‘Rubicunda’ flowersat five developmental stages. (A) Distribution plots of PC1 and PC2. (B) The histogram from PC1 to PC10. (C) The contribution of the tested parameters to PC1, PC2, and PC3. The loadings of the variables in PC1 and PC2 are indicated by the direction and strength of the vector lines; 1, 2, 3, 4, and 5 represent S1, S2, S3, S4, and S5, respectively. The black and red elliptical regions represent petals and GA, respectively. The percentage of variation explained by each component is given next to the axis. The location of the trait in the diagram closest to the intersection of 0 on the X−axis (PC1) and Y-axis (PC2) shows similarity.
Horticulturae 09 01198 g009
Disclaimer/Publisher’s Note: The statements, opinions and data contained in all publications are solely those of the individual author(s) and contributor(s) and not of MDPI and/or the editor(s). MDPI and/or the editor(s) disclaim responsibility for any injury to people or property resulting from any ideas, methods, instructions or products referred to in the content.