Article

Influence of the Phytosanitary Status, Cultivar, and Harvest Time on the Phenolic, Chlorophyll, and Alkaloid Content of Rosa sp. Leaves

by
Adelina Larisa Munteanu
1,
Loredana Elena Vijan
2,*,
Carmen Mihaela Topală
2 and
Rodi Mitrea
1,3
1
Doctoral School of Plant and Animal Resources Engineering, University of Craiova, 13 A.I. Cuza Street, 200585 Craiova, Romania
2
Faculty of Sciences, Physical Education and Computer Science, The National University of Science and Technology Politehnica Bucharest, Pitesti University Centre, 1 Targu din Vale Street, 110040 Pitesti, Romania
3
Department of Horticulture and Food Science, Faculty of Horticulture, University of Craiova, 13 A.I. Cuza Street, 200585 Craiova, Romania
*
Author to whom correspondence should be addressed.
Horticulturae 2023, 9(11), 1169; https://doi.org/10.3390/horticulturae9111169
Submission received: 30 September 2023 / Revised: 17 October 2023 / Accepted: 24 October 2023 / Published: 26 October 2023
(This article belongs to the Special Issue Bioactive Compounds in Horticultural Plants—2nd Edition)

Abstract

:
Diplocarpon rosae Wolf is the most common and damaging fungal pathogen in roses. Nationwide, the attack of this pathogenic fungus is very serious in most rose gardens due to rapid disease development that typically leads to leaf yellowing and defoliation. This study aimed to assess the way in which the fungus’s attack affects the chemical composition of Rosa sp. leaves. The research was conducted in the summer of 2023 on ten cultivars of rose grown in the rosary in the ‘Alexandru Buia’ Botanical Garden in Craiova. The influence of the cultivar and harvest time was discussed. Leaf black spot on roses produced by the fungus Diplocarpon rosae Wolf affected plants in all cultivars and the differences between cultivars highlighted the sensitivity of the relationship between plants and pathogens when exposed to some microclimatic environment factors. The correlations of attack degree with tannins, chlorophyll, or alkaloids were significant, negative for tannins (r = −0.189 *) and chlorophyll (r = −0.517 ***) and positive for alkaloids (r = 0.510 ***). Between phenolic compounds, tannins, flavonoids, and chlorophyll, very significant positive correlations were found. Alkaloids established negative and also very significant correlations with phenolic compounds (r = −0.403 ***), tannins (r = −0.339 ***), flavonoids (r = −0.409 ***), and chlorophyll (r = −0.604 ***).

1. Introduction

The rose (Rosa sp.) belongs to the Rosaceae family. It is an important flowering plant used both in the cosmetics industry and for ornamental purposes due to its fragrance and appearance [1]. The diversity of its morphological characteristics, such as color, fragrance, and size, but also its adaptability to the environment and the long flowering period have contributed to its intensive spread and cultivation [2].
The present study aimed to assess the impact of Diplocarpon rosae Wolf’s attack on the chemical composition of rose leaves. Polyphenols are among the most important bioactive compounds in a plant due to their anti-inflammatory, antioxidant, anti-proliferative, antimicrobial effects, and enzymatic implications [3]. The phenolic composition can be influenced by several factors, for example: the period and place of collection, storage conditions, processing (time, temperature, pressure, and solvents), etc. [1,3,4]. Therefore, qualitative and/or quantitative determination of polyphenolic compounds in plants is necessary. Numerous research projects on rose biology have shown that the resistance of wild rose to pathogens, such as Diplocarpon rosae Wolf, is much higher than in cultivated ones [5]. Other elements that influence resistance to infection are age and variety, the latter being able to also influence the maintenance cost of the plant [2].
Fungal disease is a major source of damage to roses. The main fungi that wreak havoc in the Romanian rose gardens include Diplocarpon rosae Wolf, Alphitomorpha pannosa, and Cercospora puderi. Of these, black spot is considered the most serious disease of roses (Rosa sp.), Diplocarpon rosae Wolf being a hemibiotrophic fungus that infects members of the genus Rosa [6]. Diplocarpon rosae can be found on some species of wild roses and most varieties of roses grown in gardens. It deforms leaves and reduces the vitality of sensitive plants unless they are regularly treated with systemic fungicides [7]. However, as a result of public concerns and increasing legal restrictions on pesticide use in parks and gardens, the availability of effective fungicides is steadily decreasing. Therefore, rose growers are interested in developing attractive roses with a high level of strength. A prerequisite for this is the availability of resistant germplasm as a source of effective resistance genes. Because of limited genetic diversity among rose varieties, most of which are highly susceptible, the search for new resistance genes focuses on wild rose species [8].
Infection of rose plant genotypes susceptible to Diplocarpon rosae Wolf leads to the appearance of black spots on the leaves, surrounded in many cases by chlorotic areas. The damage caused by this disease is not only indirect, due to the loss of the aesthetic value of the commercial product, but also impacts directly by weakening plants to the point of killing highly susceptible genotypes. Propagation of the pathogen occurs mainly by asexual conidia, thus, the disease spreads rapidly through water and direct contact [6,9].
Phenolic substances are toxic to pathogenic microorganisms and increase the physical and mechanical strength of the host cell wall [10]. The oxidation of these phenolic compounds using polyphenol oxidase produces quinones (antimicrobial compounds), which are toxic to invading fungi, thus, providing resistance against a wide range of pathogens [11]. Phenylalanine ammonia-lyase, one of the key enzymes in the phenylpropanoid pathway, has a role in the synthesis of phytoalexin and salicylic acid. Increased chipboard activity subsequently increases the content of phenolics, providing resistance to plant diseases [12].
Understanding the mechanism of plant resistance against pathogens at different levels provides new opportunities for producing improved varieties with better disease resistance. There have not been many studies in this line on infection with black spot disease in roses. Saidulu et al. (2022) [10] investigated the role of different defense-related enzymes and compounds during different periods of progression after infection with the black spot pathogen in different rose genotypes that possess differential resistance. The attack of two pathogens, Sphaerotheca pannosa var. rosae and Diplocarpon rosae Wolf, in some rose varieties revealed changes in plant growth and development [13]. Thus, through the attack of Diplocarpon rosae on the roses, the length of the leaves was reduced between 3.7% (‘Paul McCartney’) and 18.7% (‘Melina’). Their width was reduced between 0.9% (‘Paul McCartney’) and 14.0% (‘Melina’), with even the diameter of the flower suffering reductions between 7.7% (‘Terracotta’) and 14.1% (‘Paul McCartney’). In order for the roses to achieve the purpose for which they are grown, one must know the harmful agents whose attack can lead not only to quantitative deteriorations, but especially to qualitative and sometimes difficult to estimate deteriorations.
Fourier transform infrared spectroscopy (FTIR) is a useful method for early detection of rose disease. Attenuated total reflectance-Fourier transform infrared spectroscopy (ATR-FTIR) generates an IR spectrum comprising bands from all cellular components (membranes, proteins, and nucleic acids) and evaluates the entire composition of an organism cell [14,15]. The created spectrum can be used to identify the biochemical or metabolic ‘fingerprint’ of a sample by measuring the vibrations of bonds within chemical functional groups. By obtaining IR spectra from plant samples, one can detect minor changes in primary and secondary metabolites [16,17].
This paper aimed to quantify the attack produced by the fungus Diplocarpon rosae Wolf in some varieties of roses grown in the rosary of the ‘Alexandru Buia’ Botanical Garden in Craiova. The pathogen attack on rose leaves was quantified by frequency, intensity, and degree of attack. FTIR spectroscopy was used to realize a correlation between the spectra of FTIR and the health status of roses. The analysis of the content of some bioactive compounds in the healthy and affected leaves, at three different moments (28–29 June, 12–13 July, and 4–5 September 2023), before and after treating the roses with a mixture of Faster 10 CE, Ditan, and Nissorun 10 WP (conducted on 7 July 2023) aimed at emphasizing the influence of the phytosanitary status, cultivar, and harvest time on the rose leaves.

2. Materials and Methods

2.1. Plant Material and Sampling

The research was conducted in the summer of 2023 on ten varieties of rose (‘Orient Express’, ‘Paul McCartney’, ‘Terracotta’, ‘Glorious’, ‘Mythos’, ‘Holstein Perle’, ‘Melina’, ‘Asja’, ‘Velvet Fragrance’, and ‘Cluj 2010’) grown in the rosary in the ‘Alexandru Buia’ Botanical Garden in Craiova, belonging to the University of Craiova. The university botanical garden is located in the south-west of Craiova municipality (altitude of about 99 m, latitude 44019′24.3″ N, and longitude 23047′17.9″ E), on an area of approximately 12.8 hectares, and the rosary is located in the south-west of the garden, in the nursery sector.
The plants were inspected frequently to determine the presence of some pathogens. The presence of the fungus Diplocarpon rosae Wolf was detected early and the ‘black spot’ disease of roses was carefully monitored. The fungus inoculation was carried out spontaneously without intervening in the pathogenesis process until the necessary treatments were carried out. Simultaneous to the installation and evolution of the disease, no other spontaneous pathologies were noted on the surface of the plant or in the anatomical–physiological structure. The periodic observations followed the determination of the attack frequency, intensity, and degree on each rose cultivar. The ‘black spot’ disease is considered to be one of the most injurious diseases of outdoor grown roses in Romania, causing great damage depending on the climatic conditions each year but also on the phytosanitary program. The control of pathogen propagation in culture heavily relies on fungicides. Thus, all roses from the nursery sector were treated on 7 July 2023 with a mixture of Faster 10 CE, Ditan, and Nissorun 10 WP.
To estimate the pathogen attack on the Rosa sp. cultivars, the mature leaves from the median area of plants were analyzed. The severity of the attack was estimated using the calculation formulae elaborated by Săvescu and Rafailă (1978) [18], using the length and width of sheets related to attacked and unattacked organs. The attack frequency and intensity were obtained as average values of ten determinations. The number was considered sufficient because the errors in this case were very low [19]. Based on the attack degree (AD) values calculated according to the average values of the attack frequency and intensity, the following resistance classes were used to classify the analyzed cultivars [13,20]: resistant (R, with AD = 0–1%), medium resistant (MR, with AD = 1–5%), sensitive (S, with AD = 5–10%), and very sensitive (FS, with AD > 10%).

2.2. Chemicals and Reagents

All reagents used in this research were analytical grade reagents and were obtained from Merck-Sigma-Aldrich, Darmstadt, Germany.

2.3. Extraction Procedures and Biochemical Determinations

For the extraction of polyphenols, flavonoids, alkaloids, and tannins from rose leaves, three ground samples of 1 g leaves in 10 mL methanol (for the first three biochemical compounds) or distilled water (for the extraction of tannins) were used. All samples were subjected to the following protocol: vortexing for 5 min at 3000 rpm, ultrasonication for 30 min at 40 kHz, and centrifugation at 6500 rpm for 30 min [21].
An amount of 1 mL filtered extract was used for the determination of these bioactive compounds, according to the methodology proposed by Giosanu et al. (2018) [22] (for polyphenols), Giura et al. (2019) [23] (for flavonoids and tannins), and Singh et al. (2004) [24] (for alkaloids). The content of polyphenols (TPC) and tannins (TTC) was expressed as mg gallic acid equivalents (GAE) 100 g−1 fresh leaves. Similarly, the flavonoid’s (TFC) and the alkaloid’s content were expressed as mg catechin equivalents (CE) 100 g−1 fresh leaves and mg atropine sulfate equivalents (AE) 100 g−1 fresh leaves.
Determination of chlorophyll content was made according to the methodology proposed by Vijan et al. (2019) [25], using 0.1 g of rose leaves and 10 mL of 90% acetone for extraction. Similarly, the chlorophyll content was expressed as mg 100 g−1 fresh leaves.

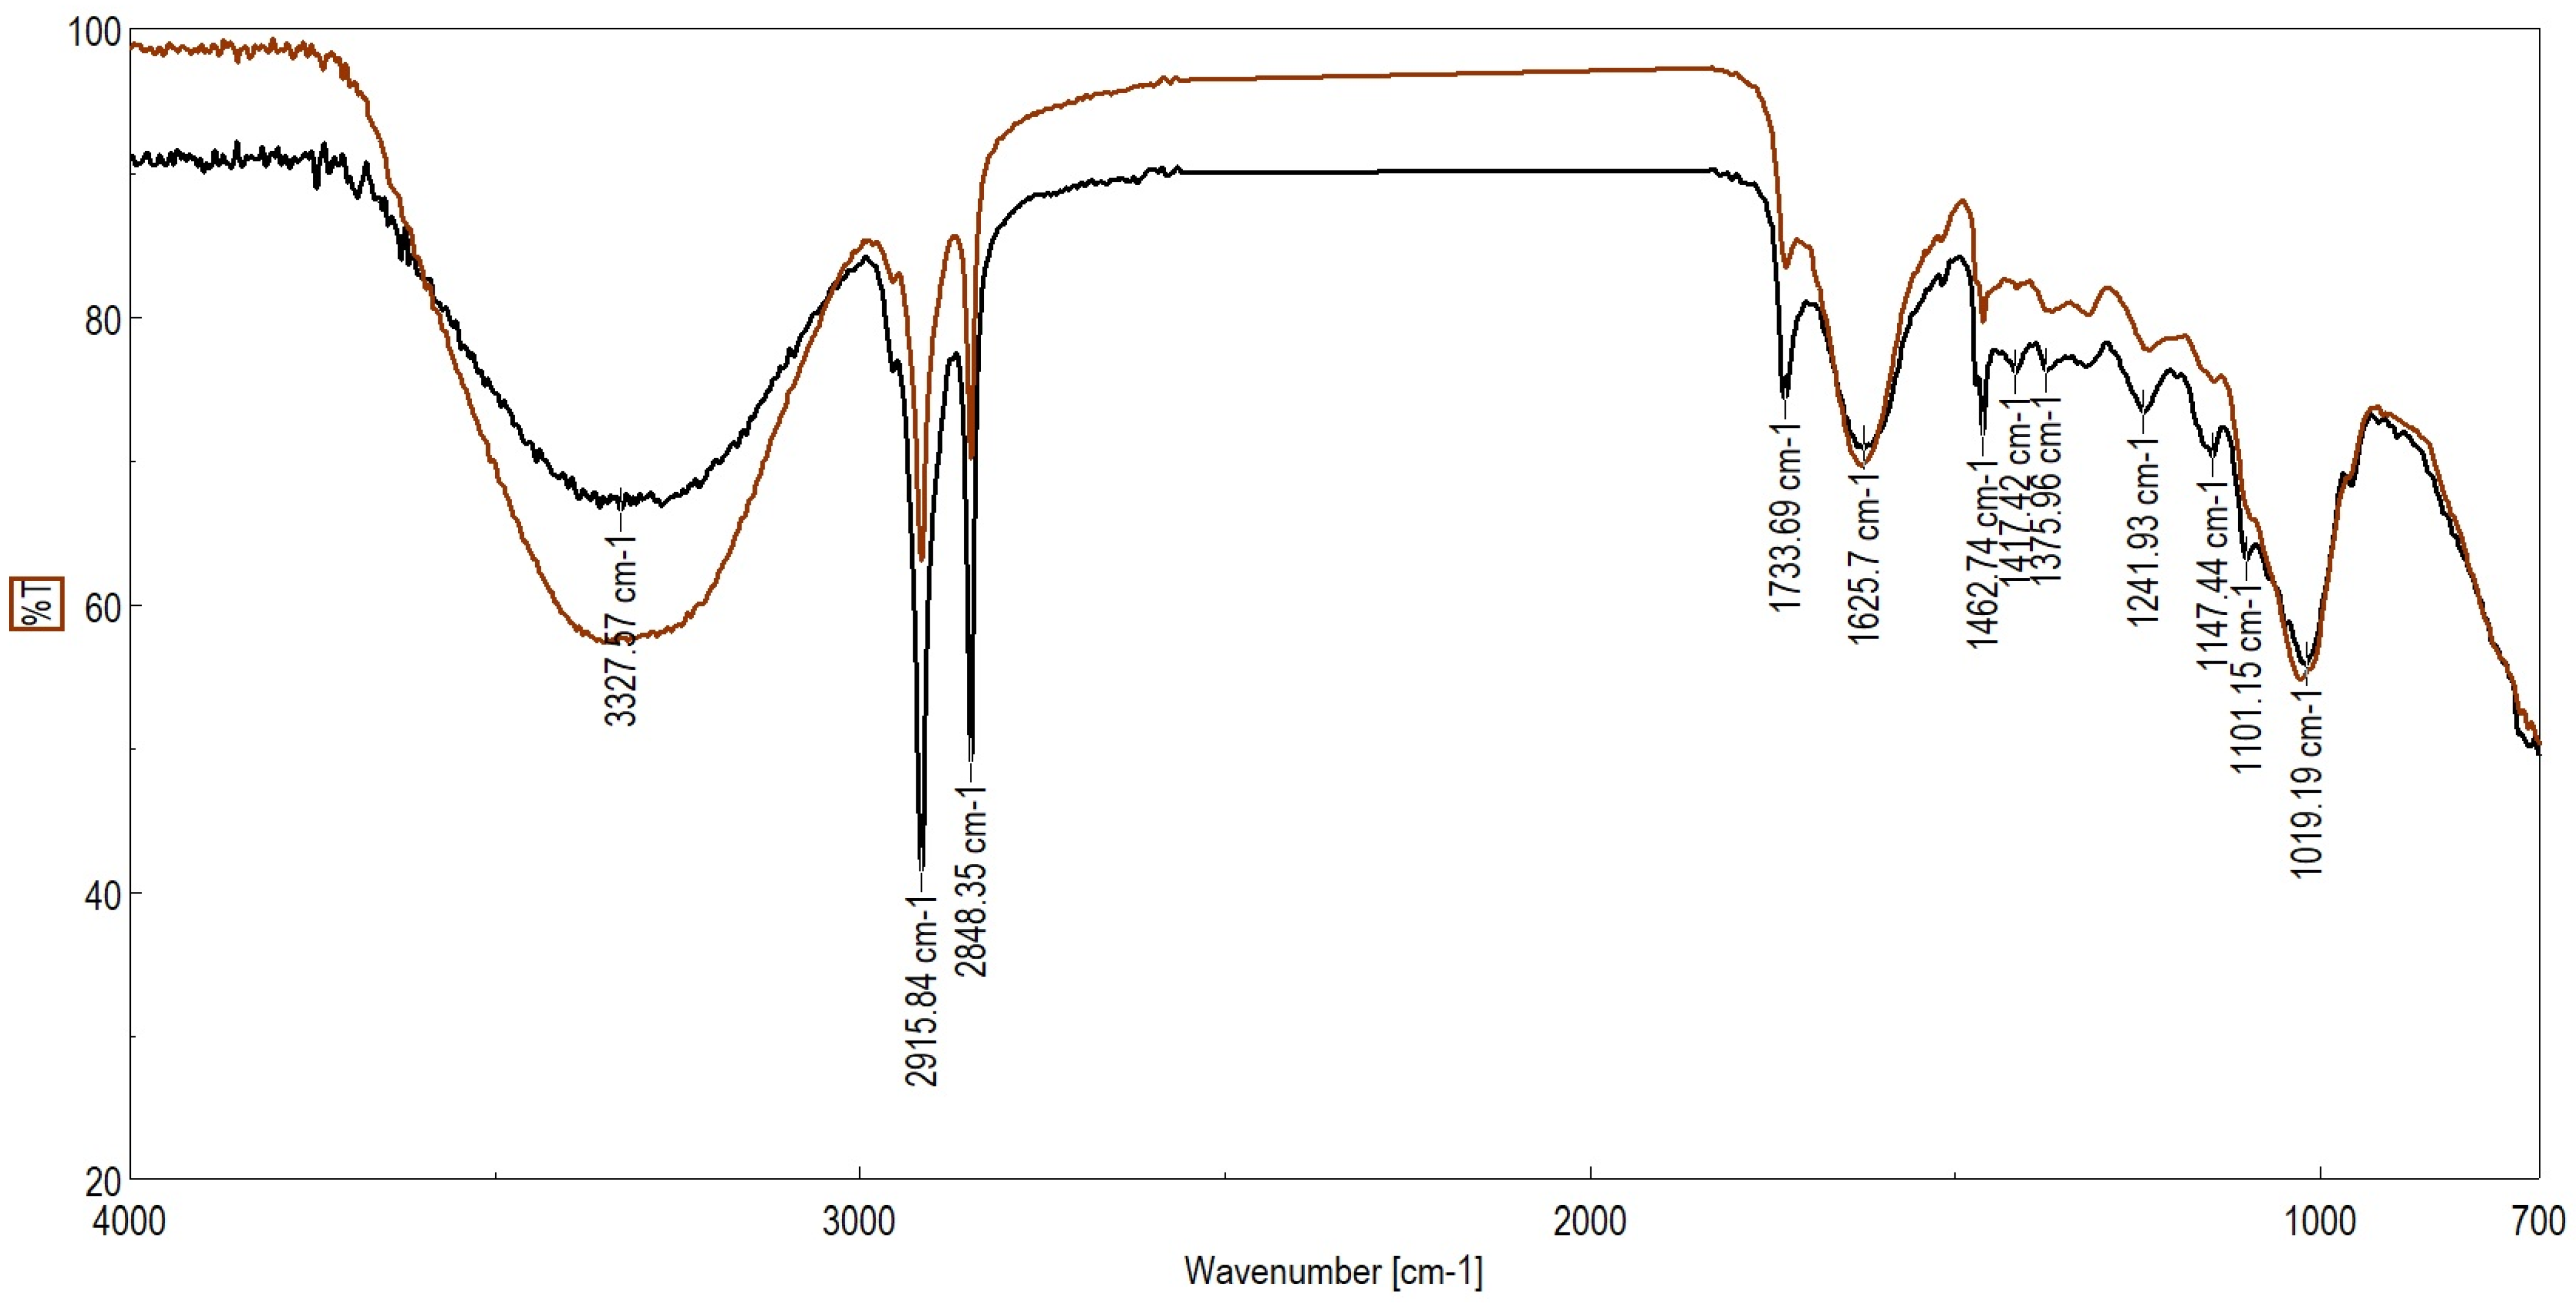
2.4. ATR-FTIR Analysis

The spectral measurements were made with an FTIR Jasco 6300 spectrometer. An ATR accessory equipped with a diamond crystal (Pike Technologies, Madison, WI, USA) allows the collection of FTIR spectra directly from a sample without any special preparation. The spectra were recorded in the region of 4000–400 cm−1, detector TGS, apodization Cosine. The spectral data were processed with JASCO Spectra Manager II software, Easton, PA, USA. Samples were scanned at 4 cm−1 resolution, accumulation: 100 scans. In all cases, rose leaves (healthy and diseased) were collected in batches of ten samples. ATR-FTIR spectra were obtained from every tissue of leaves (healthy and diseased). For each group of tissue, an average spectrum was used from the Spectra Manager II software for further analysis.

2.5. Statistical Analysis

Statistical analysis was performed with the trial version of IBM SPSS Statistics 26.0 software package, Armonk, New York, USA. A total of 180 samples of rose leaves (90 healthy and 90 affected by Diplocarpon rosae Wolf’s attack) were analyzed at three different moments (28–29 June, 12–13 July, and 4–5 September 2023). Data were reported as means ± standard deviation. Factorial ANOVA with three independent variables was performed (data is normally distributed and has homogeneous variance). Comparisons between means between groups were performed with Duncan`s multiple range test. Differences were considered significant when p < 0.05. Microsoft Excel 2021 was used for graphical representation.

3. Results and Discussions

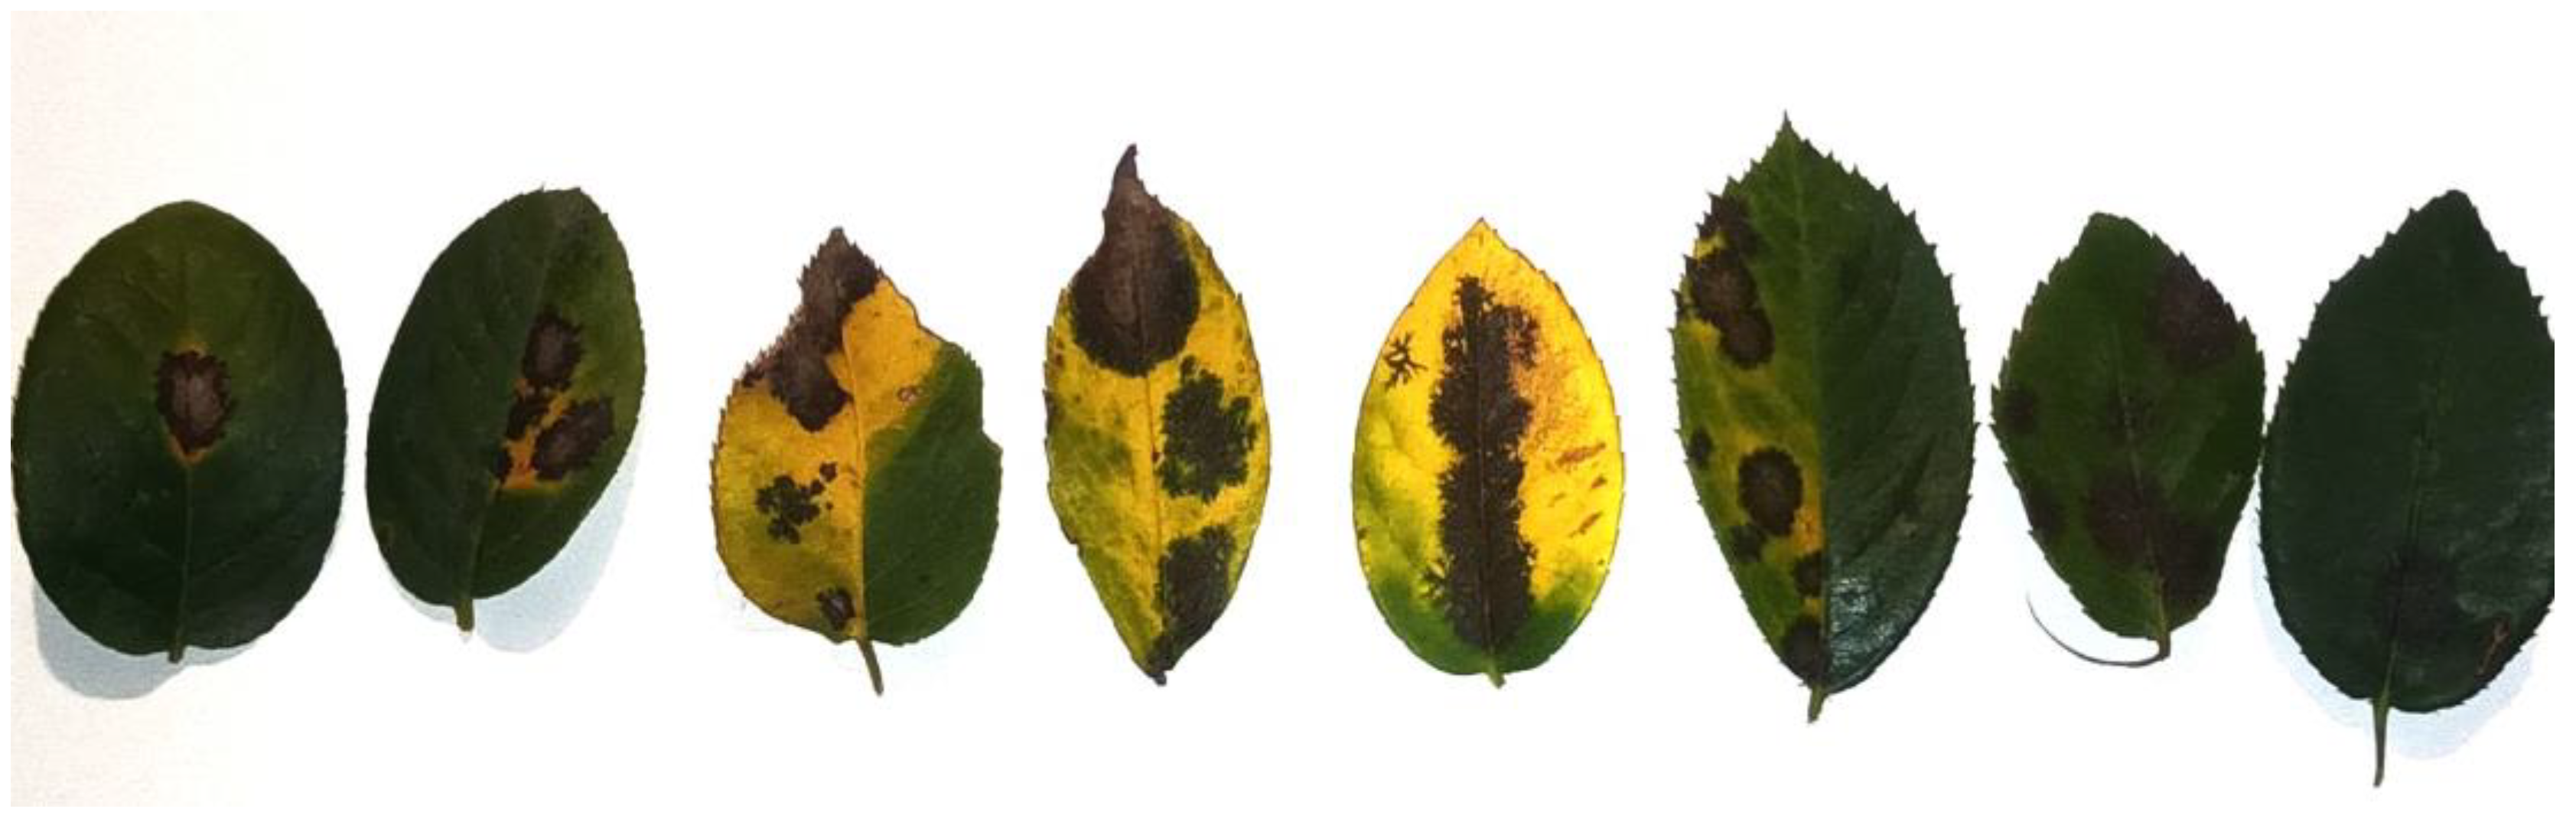
3.1. Attack Severity Analysis of Diplocarpon rosae Wolf on the Rose Leaves

Damage due to Diplocarpon rosae Wolf in rose leaves from the rosary in the ‘Alexandru Buia’ Botanical Garden in Craiova ranged from minimal lesions (spots) on foliage to loss of some leaves (weakening the plant). The disease symptoms first appeared on the older leaves on the lower area of plants, and later the symptoms spread upwards. On the superior side of leaves, black spots were formed. They were small at the beginning, with radial aspect, and with no precise limited margins (Figure 1). In some cases, one noticed a brown coloration of the tissues on the inferior side of the leaves. The infected area of the leaves turned yellow around the spots, resulting in premature leaf fall. Severe infection can result in complete defoliation and dieback of the infected plants, but this did not happen in the botanical garden in Craiova as a result of the treatment applied to roses immediately after the appearance of the disease. However, roses with severe levels of infection produced less new growth and fewer blooms. The status of the health of the foliage ultimately impacts the health and longevity of the plant.
Data presented in Table 1 illustrate that the attack of the fungus Diplocarpon rosae Wolf on roses grown in the rosary in the ‘Alexandru Buia’ Botanical Garden, Craiova in the summer of 2023 was strong, the calculated values of the attack degree oscillating between 9.2% (‘Asja’) and 40% (‘Melina’ and ‘Cluj 2010′). The average value of the attack degree in the ten cultivars of roses is 26.92%, the result indicating the constant presence of this pathogenic fungus all over the research area. It can be noted that in the climatic conditions experienced this year, one of the studied cultivars (‘Asja’) was susceptible to the phytoparasite attack while the other nine cultivars were very sensitive.
Leaf black spot on roses produced by the fungus Diplocarpon rosae Wolf affected the plants in all cultivars analyzed where the assessment was performed, but the differences between those cultivars highlighted the sensitivity of the relationship between plants and pathogens when exposed to some microclimatic environment factors. Diplocarpon rosae Wolf is a very dangerous pathogen because it causes premature aging of the roses. Also, this pathogen severely damages the young shoots by exposing them to frost because the wood of these shoots presents deep cracks where water will freeze, the effect accentuated by the premature defoliation of the affected leaves.
Our findings are similar to the results revealed by Yasin et al. (2016) [26], who found that the maximum means for rose black spot disease incidence in Pakistan was 56%, while the minimum threshold was 43.6%. Their research was performed in 40 rose gardens in Lahore, Kasur, Chakwal, and Rawalpindi districts of Punjab province, Pakistan during the spring seasons of 2012 and 2013. Knight and Wheeler (1978) [27] also found variation in rose susceptibility to different Diplocarpon rosae isolates.
FTIR spectroscopy was used to study diseased leaves comparatively with healthy rose leaves. The results of the ATR-FTIR spectra for the healthy plants and diseased plants (Figure 2) revealed the existence of various chemical constituents in leaves (Table 2).
To compare disease-affected leaves to the control leaves (healthy leaves), peak assignments for observed bands were made (Table 2 and Table 3). NH absorption was observed around 3350-–3290 cm−1. Bands appearing in the region of 2920–2918 and 2851–2850 cm−1 were assigned to the asymmetric (νasym) and symmetric (νsym) CH2 stretching vibrations.
The infrared spectra of protein are characterized by a set of absorption regions known as the amide region and the C–H region. Amide I band appears at 1625–1629 cm−1 as a very strong band. In diseased leaves, this band appears at low wavenumber. In addition, the peak at 1729–1731 cm−1 assigned to the C=O stretching vibration means that there are some carbonyl compounds (wax esters and ketones) or carboxylic acid groups.
Some attention was also paid to the amide bands (1626 cm−1 and 1315 cm−1) and to the C–O stretching region between 1200 and 1000 cm−1. The bands corresponding to the stretching vibrations of polysaccharides (νasymO–C–O) appeared at a lower wavenumber in the diseased leaves (Table 2 and Table 3). Amide III bands from around 1315 cm−1 are mainly associated with CN stretching and NH bending vibrations and increase in intensity in affected leaves.
A band at 687 cm−1 which appeared in all samples is attributed to the methylene rocking vibration νCH2.
The comparison between the FTIR spectrum of healthy rose leaves and the diseased leaves reveals a clear difference in the carbohydrates that are present in each plant (Table 2 and Figure S1).

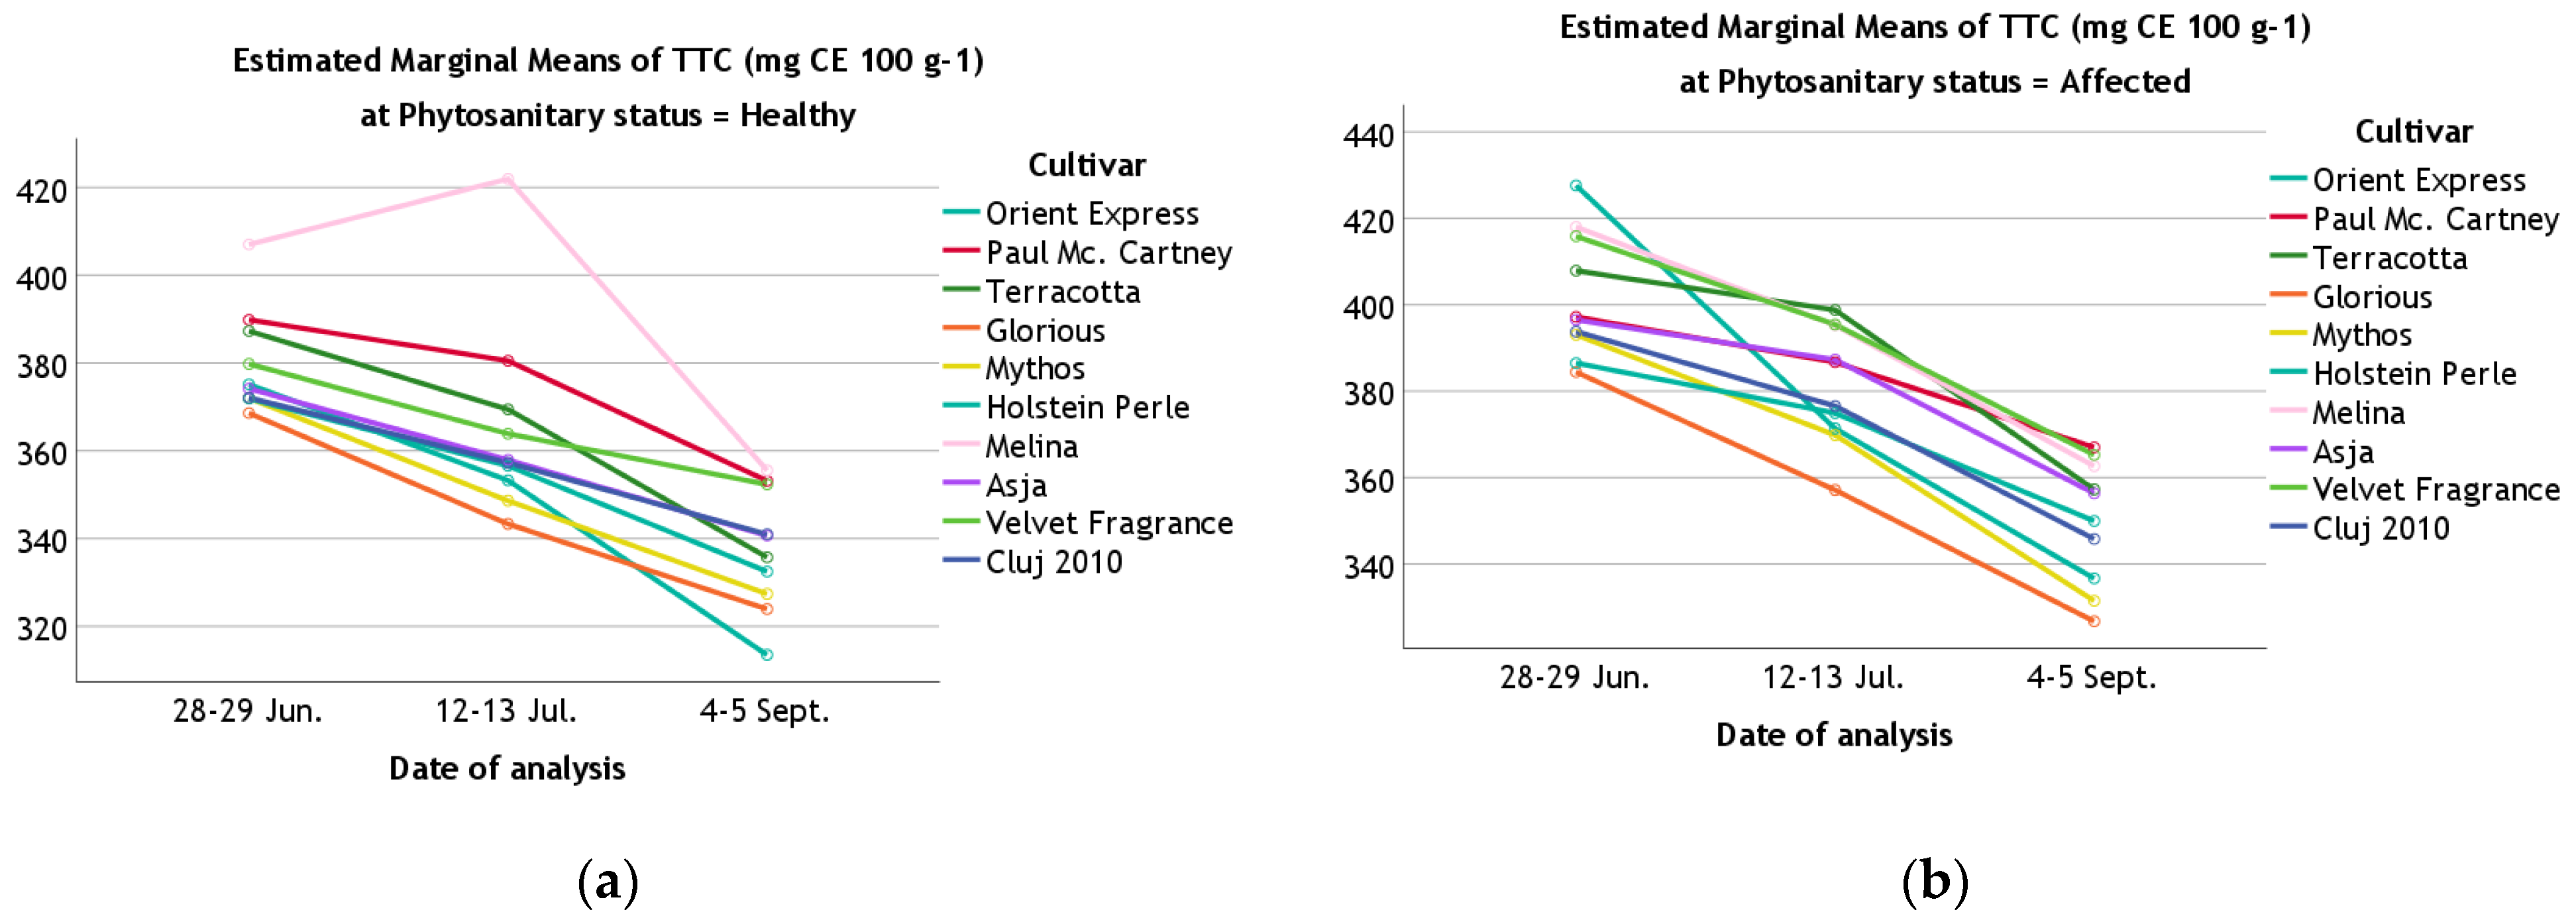
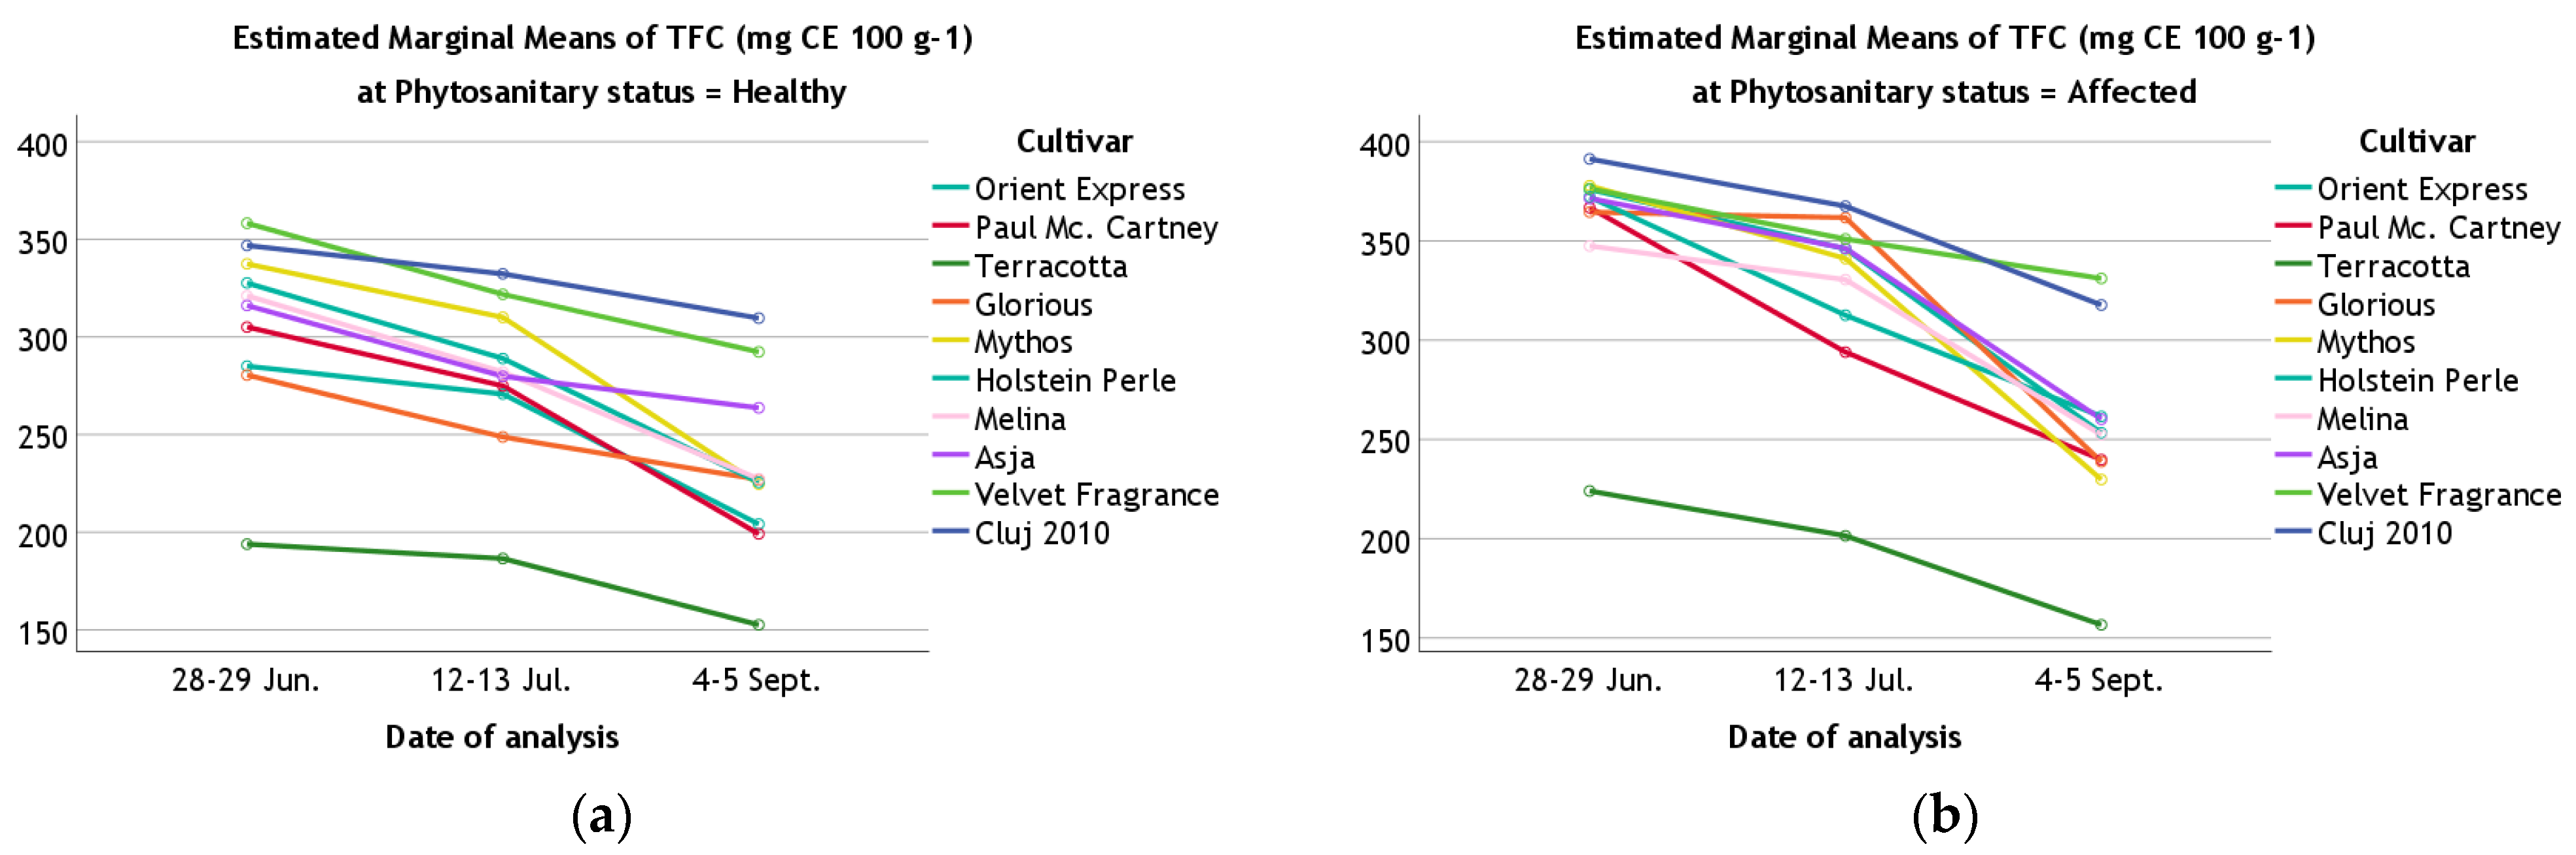
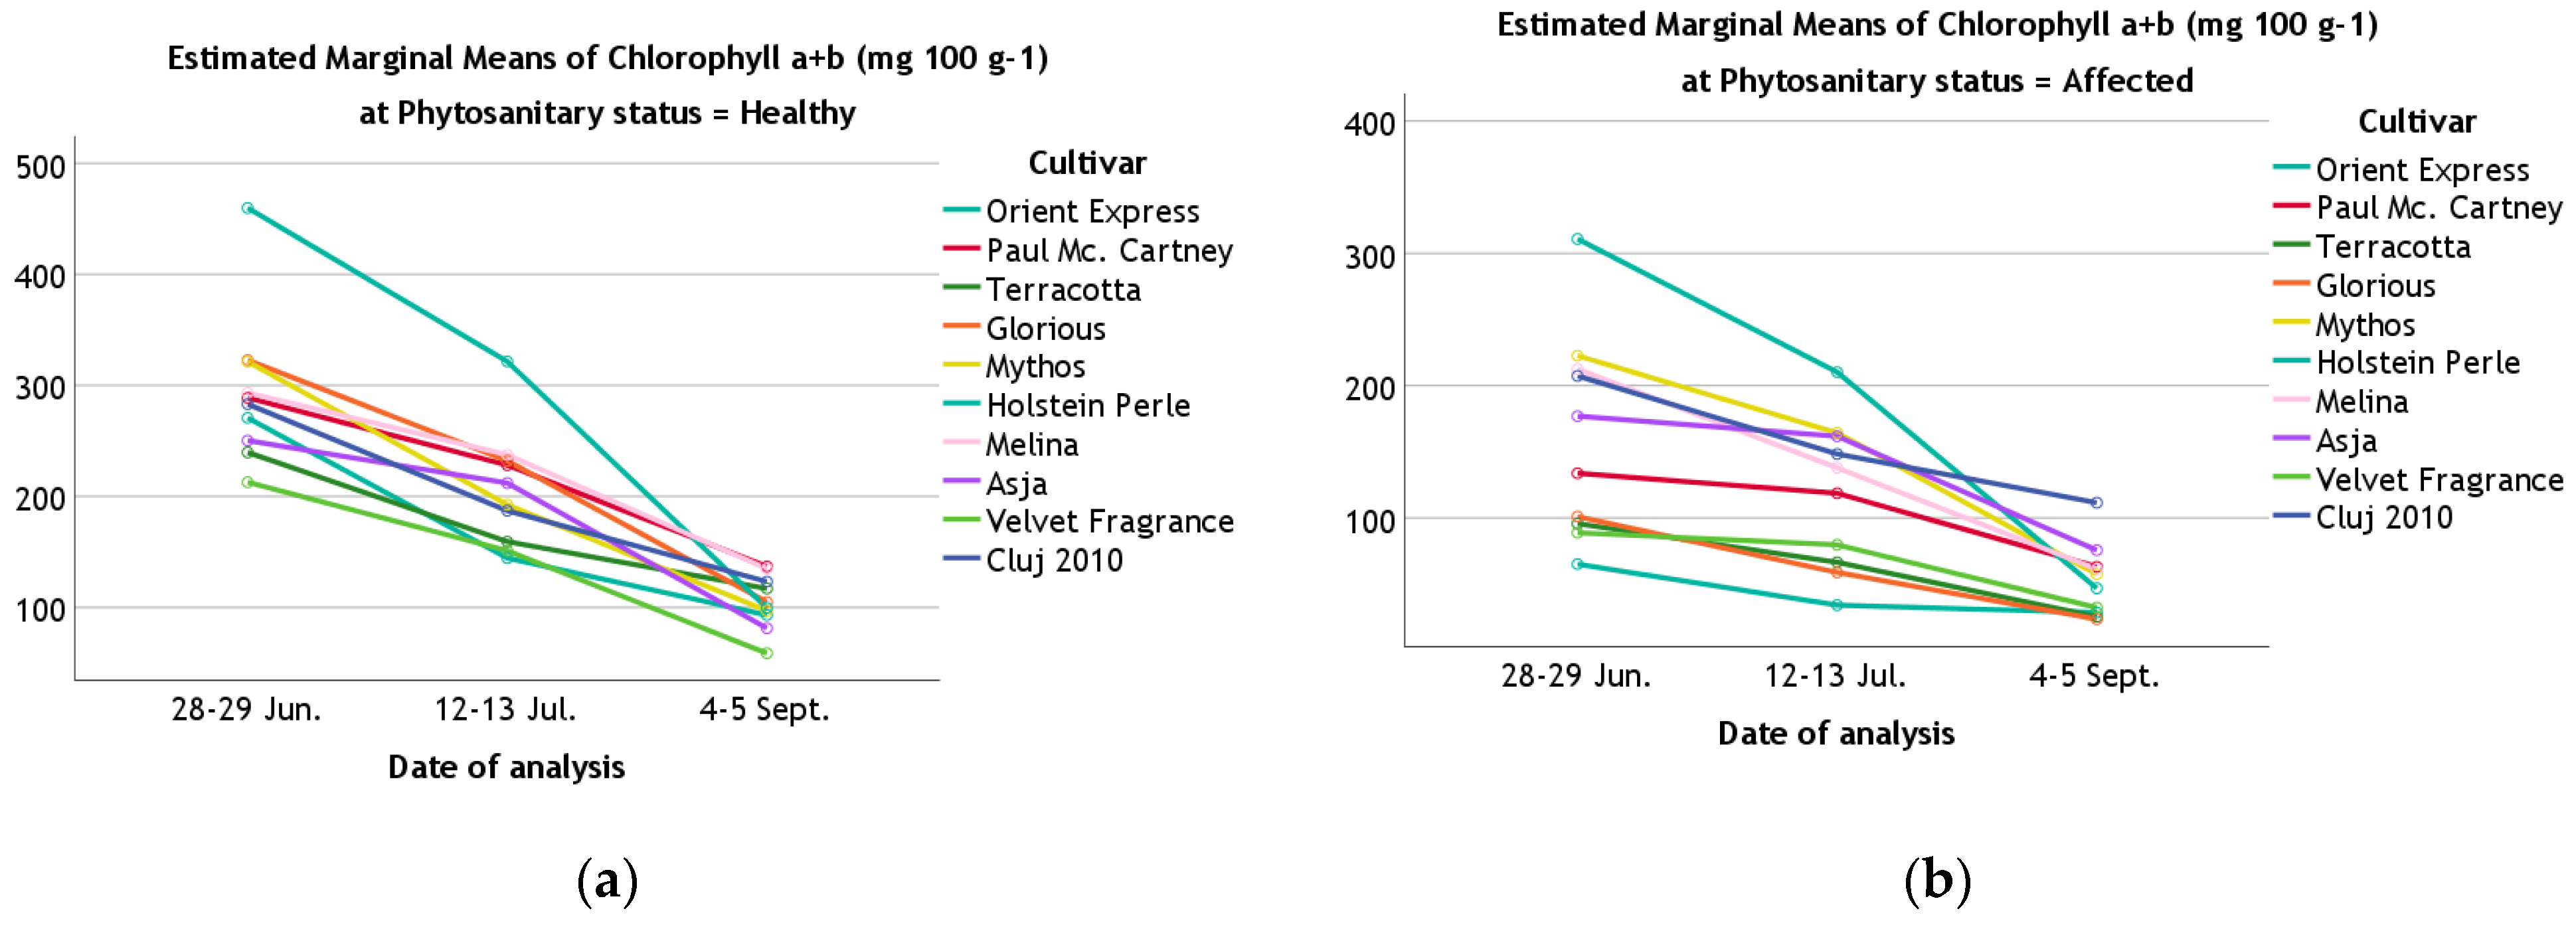
3.2. Influence of the Phytosanitary Status, Cultivar, and Harvest Time on the Phenolic, Chlorophyll, and Alkaloid Content of Rose Leaves

Table 4 shows the levels of phenolic compounds (TPC), tannins (TTC), flavonoids (TFC), chlorophyll, and alkaloids, determined in the leaves of ten rose cultivars depending on their phytosanitary status, at three moments of analysis.
As an overview, a comparison between the healthy leaves of all cultivars at the first moment of analysis (28–29 June 2023) indicated that the group consisting of ‘Melina’ (1237.65 mg GAE 100 g−1), ‘Mythos’ (1151.75 mg GAE 100 g−1), ‘Asja’ (1147.90 mg GAE 100 g−1), ‘Cluj 2010’ (1090.65 mg GAE 100 g−1), ‘Velvet Fragrance’ (1020.98 mg GAE 100 g−1), and ‘Holstein Perle’ (1020.77 mg GAE 100 g−1) presented the highest values of TPC, but also presented the highest values of TFC (358.25 mg CE 100 g−1, ‘Velvet Fragrance’; 346.83 mg CE 100 g−1, ‘Cluj 2010’; 337.41 mg CE 100 g−1, ‘Mythos’; 327.63 mg CE 100 g−1, ‘Holstein Perle’; 321.06 mg CE 100 g−1, ‘Melina’; and 316.09 mg EC 100 g−1 ‘Asja’). In addition, similar to ‘Terracotta’ (387.28 mg GAE 100 g−1) and ‘Paul McCartney’ (389.83 mg GAE 100 g−1), ‘Melina’ cv. stood out as having the highest level of tannins, 406.99 mg GAE 100 g−1. Last but not least, the tannins fraction dominated the phenolic compounds profile compared to flavonoids (the tannins/flavonoids ratio ranged from 1.06, in ‘Velvet Fragrance’ cv., to 2.00, in ‘Terracotta’ cv.).
The results obtained in this study regarding TPC are comparable to those reported by Nowak and Gawlik-Dziki (2007) [31] for the leaves from 17 Rosa L. cultivars in the Lublin region of Poland, harvest in June 2003 during the florescence of plants. Low levels of TPC were found in R. rugosa (570 mg GAE 100 g−1) and R. vosagiaca (770 mg GAE 100 g−1), whereas R. canina var. dumalis and other R. canina species (except for R. canina var. canina, with 990 mg GAE 100 g−1) contained the highest amounts of phenolics in leaves (1220 to 1520 mg GAE 100 g−1). Cunja et al. (2014) [32] have reported more than 50 phenolic compounds (belonging to the subclasses of flavonols, phenolic acids, and their derivatives) present in leaves of four rose species (R. glauca, R. canina, R. sempervirens, and R. rubiginosa) and three cultivars (Rosarium Uetersen, Ulrich Brunner Fils, and Schwanensee) grown in the botanical garden in Ljubljana. The TFC values of rose leaves in our study were lower than those reported for different Rosa sp. species by D’Angiolillo et al. (2018) [33] and Ozsoy et al. (2013) [34]. As in our study, the authors indicated a moderate influence based on cultivar and little differences between TFC values determined at different harvesting periods of leaves.
The highest total chlorophyll content in the healthy leaves was found for ‘Holstein Perle’ cv. (459.72 mg 100 g−1), while the lowest values were found in the healthy leaves of ‘Velvet Fragrance’ (212.73 mg 100 g−1) and ‘Terracotta’ (239.62 mg GAE 100 g−1). In our study, the total chlorophyll content was higher than those levels reported by D’Angiolillo et al. (2018) [33] in the leaves of four Sicilian roses harvested during two different periods (June and October). As in the present study, their results showed that the total chlorophyll content was higher in the leaves of all species harvested in June (92 mg 100 g−1, on average) than in those harvested in October (76 mg 100 g−1, on average). Differences among the species were higher in June (from 76 to 111 mg 100 g−1 for R. micrantha and R. corymbifera, respectively) and lower in October (from 66 to 83 mg 100 g−1 for R. micrantha and R. sempervirens, respectively). In addition, Sparinska and Rostoks (2012) [35] reported high variations (from 134 to 193 mg 100 g−1) in the leaf chlorophyll content of R. rugosa cultivars in Latvia and they mainly associated these differences with the genotype.
The cultivars with alkaloid content in the healthy leaves exceeding 88 mg AE 100 g−1 were ‘Melina’ and ‘Mythos’ (with 88.07 and 88.24 mg AE 100 g−1, respectively), while the smallest values were found in the cultivars ‘Asja’ (75.88 mg AE 100 g−1) and ‘Orient Express’ (78.50 mg AE 100 g−1).
Figure 3, Figure 4, Figure 5, Figure 6 and Figure 7 graphically present the variation in the contents of TPC, TTC, TFC, total chlorophyll, and alkaloids recorded for the healthy and affected rose leaves of the studied cultivars at the three moments of analysis.
Without exception, a tendency for the TPC and total chlorophyll content to decrease during the harvest period could be observed for both healthy and unhealthy plants (Figure 3 and Figure 6).
In the case of TPC, in the group of healthy plants the strongest oscillation between the first and last moment of analysis was observed for ‘Melina’ and ‘Mythos’ cvs., followed by ‘Orient Express’, ‘Asja’, and ‘Cluj 2010’. A similar reduction in TPC content was also observed in the group of unhealthy plants, mainly for ‘Melina’ and ‘Mythos’ cvs., followed by ‘Cluj 2010’ and ‘Orient Express’. At the opposite pole, the smallest differences in TPC between the first and the last moment of harvest were observed for ‘Paul McCartney’ and ‘Terracotta’ cvs. (in both groups of plants, healthy and unhealthy).
With only one exception (‘Melina’ cv., healthy plants, second harvest time), TTC decreased continuously between the three harvest times, and the highest TTC reduction in the group of healthy plants was recorded for ‘Orient Express’, ‘Terracotta’, and ‘Melina’ cvs. An even more pronounced TTC reduction was observed in unhealthy plants of the ‘Orient Express’ cultivar, as well as in those of ‘Mythos’, ‘Glorious’, and ‘Melina’ cvs. The lowest tannin losses were shown by the healthy plants of ‘Velvet Fragrance’ and ‘Cluj 2010’ cvs., followed by ‘Asja’, and in the group of sick plants, by the ‘Paul McCartney’ cv.
‘Mythos’ cv., followed by ‘Paul McCartney’, had the greatest loss in terms of the leaves’ flavonoid content (in both groups of plants, healthy and diseased). Also, significant reductions in TFC were recorded in unhealthy specimens of ‘Glorious’ and ‘Orient Express’ cvs. Small differences between the first and the last harvest time were observed for ‘Cluj 2010’, ‘Terracotta’ (healthy plants), and ‘Velvet Fragrance’ (unhealthy plants) cvs.
The most intense losses of total chlorophyll content were observed for ‘Holstein Perle’ cv., followed by ‘Mythos’ (healthy and diseased plants), while those with the lowest levels of total chlorophyll were the unhealthy plants of the ‘Orient Express’ cvs., followed by ‘Velvet Fragrance’.
Alkaloids were the only chemicals in this study whose level increased between the first and the last harvest time, the greatest increase being found for ‘Glorious’ and ‘Asja’ cvs., but with increases also observed for ‘Orient Express’ and ‘Velvet Fragrance’ (healthy and unhealthy plants). The lowest oscillation of alkaloids was observed for ‘Melina’ and ‘Mythos’ cv. unhealthy plants. This behavior is explainable because, in plants, alkaloids are secondary metabolites produced in response to environmental modulations and biotic or abiotic stress, which gives them structural diversity and significant biological activities [36,37]. The growth of leaf alkaloid content with the increasing age of the plant was observed in all species [38,39,40,41]. Since the availability of nitrogen (N) is expected to play an important role in the biosynthesis and accumulation of alkaloids in plants, the content of alkaloids is further increased in diseased plants.
As presented in Table 5, the phenolic, tannin, flavonoid, chlorophyll, and alkaloid content was significantly influenced by the cultivar, the harvest time, the phytosanitary status, and their interaction.
The correlations between the total content of the five classes of compounds and the degree of attack (AD) from the leaves of the ten cultivars of Rosa sp. are summarized in Table 6. As shown in this table, the correlations between attack degree (AD) and tannins, total chlorophyll, or alkaloids were significant; they were negative for tannins (r = −0.189 *) and total chlorophyll (r = −0.517 ***) and positive for alkaloids (r = 0.510 ***). All correlations established between TPC, TTC, TFC, and total chlorophyll were positive and strongly significant. In the case of alkaloids, negative and very significant correlations were established with TPC (r = −0.403 ***), TTC (r = −0.339 ***), TFC (r = −0.409 ***), and total chlorophyll (r = −0.604 ***), respectively.

4. Conclusions

Our study evaluated the influence of phytosanitary status, cultivar, and harvest time on the phenolic, chlorophyll, and alkaloid content of Rosa sp. leaves.
In June 2023, in the rosary of the ‘Alexandru Buia’ Botanical Garden in Craiova, which is managed as an organic system, the presence of the Diplocarpon rosae Wolf was detected. The disease, called ‘black spot of rose’, is one of the diseases known for the damage it produces in this crop; it occurs naturally and affected all ten rose cultivations from the nursery sector. The attack of this pathogenic fungus on the ten rose cultivars was strong, with the calculated values of the attack degree oscillating between 9.2% (‘Asja’ cv.) and 40% (‘Melina’ and ‘Cluj 2010′ cvs.), with an average value of 26.92%. Only one of the studied cultivars (‘Asja’) was susceptible to the Diplocarpon rosae Wolf attack, while the other nine cultivars were very sensitive.
The treatment scheme (a mixture of Faster 10 CE, Ditan, and Nissorun 10 WP) conducted on 7 July 2023 stopped the disease spread in the entire area. Considering the severity of the attack produced by the fungus Diplocarpon rosae Wolf on the rose leaves in 2023, the management of the ‘Alexandru Buia’ Botanical Garden in Craiova decided that the best way to fight this disease would be preventive treatment. Due to the weather conditions in spring, with rains and high humidity, it must be taken into account that all rain that falls after the application of the fungicides will significantly reduce the protection they offer. In addition, the rain is brought by air currents, which, in addition to moisture, will also transport seeds. Despite the effectiveness of the treatment scheme applied this year to limit the spread of the disease, we appreciate that extensive research is needed on this topic, and that this is important in terms of the specifics of the latest climate change conditions and the particularities of rose plants. Fungal diseases are best managed through a multidisciplinary approach that includes plant selection, planting time, level of fertility, sanitation, and applications of fungicides. Some roses exhibit a greater tolerance than others as regards the attack of fungal diseases. Their different susceptibility to disease will dictate the management practices that must be employed to maintain the health of the rose garden.
The comparison of FTIR spectra of the healthy with those of the diseased leaves pointed out a clear difference in the carbohydrates that are present in each plant. The carbohydrate region (between 1000 and 1240 cm−1) is the region that was shown to be the most significant in terms of identifying virus diseases.
The results of this work show that rose leaves accumulate large amounts of phenolic compounds, these compounds having antioxidant and free radical scavenging abilities, with potential effects on human health. This finding highlights the need to include the edible rose in the human diet.
Special attention was paid to the influence of the cultivar and harvest time on the phenolic, chlorophyll, and alkaloid content of Rosa sp. leaves correlated to the phytosanitary status of roses. Our study indicated that between attack degree and tannins, total chlorophyll or alkaloids settled the significant correlations, negative for tannins (r = −0.189 *) and total chlorophyll (r = −0.517 ***) and positive for alkaloids (r = 0.510 ***). In addition, all correlations between phenolic compounds, tannins, flavonoids, and total chlorophyll were positive and very significant. In the case of alkaloids, negative and very significant correlations were established with TPC (r = −0.403 ***), TTC (r = −0.339 ***), TFC (r = −0.409 ***), and total chlorophyll (r = −0.604 ***), respectively.

Supplementary Materials

The following supporting information can be downloaded at: https://www.mdpi.com/article/10.3390/horticulturae9111169/s1, Figure S1: ATR-FTIR spectra of healthy and affected rose leaves, for ‘Orient Express’, ‘Paul Mc. Cartney’, ‘Terracotta’, ‘Glorious’, ‘Mythos’, ‘Melina’, ‘Asja’, ‘Velvet Fragrance’, and ‘Cluj 2010’ cultivars.

Author Contributions

Conceptualization, A.L.M., L.E.V. and R.M.; methodology, A.L.M., L.E.V. and C.M.T.; software, A.L.M. and C.M.T.; validation, L.E.V., C.M.T. and R.M; investigation, A.L.M., L.E.V. and C.M.T.; resources, A.L.M., L.E.V. and C.M.T.; writing—original draft preparation, A.L.M., L.E.V. and C.M.T.; writing—review and editing, A.L.M., L.E.V. and C.M.T.; supervision, L.E.V., C.M.T. and R.M. All authors have read and agreed to the published version of the manuscript.

Funding

This research received no external funding.

Data Availability Statement

Data presented in this study are available on request from the principal author. The data are not publicly available due to privacy.

Conflicts of Interest

The authors declare no conflict of interest.

References

  1. Khatun, S.; Bandyopadhyay, P.K.; Chatterjee, N.C. Phenols with their oxidizing enzymes in defence against black spot of rose (Rosa centifolia). Asian J. Exp. Sci. 2009, 23, 249–252. [Google Scholar]
  2. Zlesak, D.C.; Whitaker, V.M.; George, S.; Hokanson, S.C. Evaluation of roses from the Earth-Kind trials: Black spot (Diplocarpon rosae Wolf) resistance and ploidy. HortScience 2023, 45, 1779–1789. [Google Scholar] [CrossRef]
  3. Olech, M.; Pietrzak, W.; Nowak, R. Characterization of free and bound phenolic acids and flavonoid aglycones in Rosa rugosa Thunb. leaves and achenes using LC–ESI–MS/MS–MRM methods. Molecules 2020, 25, 1804. [Google Scholar] [CrossRef]
  4. dos Santos, A.M.P.; Silva, E.F.R.; dos Santos, W.N.L.; da Silva, E.G.P.; dos Santos, L.O.; da S. Santos, B.R.B.R.D.S.; da S. Sauthier, M.C.; dos Santos, W.P.C. Evaluation of minerals, toxic elements and bioactive compounds in rose petals (Rosa spp.) using chemometric tools and artificial neural networks. Microchem. J. 2018, 138, 98–108. [Google Scholar] [CrossRef]
  5. von Malek, B.; Debener, T. Genetic analysis of resistance to blackspot (Diplocarpon rosae) in tetraploid roses. Theor. Appl. Genet. 1998, 96, 228–231. [Google Scholar] [CrossRef]
  6. Whitaker, V.M.; Bradeen, J.M.; Debener, T.; Biber, A.; Hokanson, S.C. Rdr3, a novel locus conferring black spot disease resistance in tetraploid rose: Genetic analysis, LRR profiling, and SCAR marker development. Theor. Appl. Genet. 2010, 120, 573–585. [Google Scholar] [CrossRef]
  7. Drewes-Alvarez, R. Disease/black spot. In Encyclopedia of Rose Science; Roberts, A., Debener, T., Gudin, S., Eds.; Elsevier Academic Press: Amsterdam, The Netherlands, 2003; pp. 148–153. [Google Scholar]
  8. Debener, T. Strategies for the introduction of disease resistance genes from wild rose species into cultivated varieties. Hist. Rose J. 2000, 19, 29–33. [Google Scholar]
  9. Horst, R.K.; Cloyd, R.A. Rose Diseases. In Compendium of Rose Diseases and Pests, 2nd ed.; Lipa, J.J., Ed.; APS Press—The American Phytopathological Society: St. Paul, MN, USA, 2007; 83p. [Google Scholar]
  10. Saidulu, Y.; Tejaswini, P.; Upreti, K.K.; Sriram, S.; Seetharamu, G.K.; Devappa, V.; Mythili, J. B Biochemical characterization of defense responses in rose genotypes in response to artificial inoculation with black spot pathogen Diplocarpon rosae. J. Hortic. Sci. 2022, 17, 209–219. [Google Scholar] [CrossRef]
  11. Cahill, D.M.; McComb, J.A. A comparison of changes in phenylalanine ammonia-lyase activity, lignin and phenolic synthesis in the roots of Eucalyptus calophylla (field resistant) and E. marginata (susceptible) when infected with Phytophthora cinnamomi. Physiol. Mol. Plant Pathol. 1992, 40, 315–332. [Google Scholar] [CrossRef]
  12. Klessig, D.F.; Malamy, J. The salicylic acid signal in plants. Plant Mol Biol. 1994, 26, 1439–1458. [Google Scholar] [CrossRef]
  13. Munteanu, A.L.; Mitrea, R. Quantification of the attack produced by Sphaerotheca Pannosa (wallr.) lev. cousin. rosae Woron and Diplocarpon rosae Wolf in some rose varieties. Ann. Univ. Craiova Agric. Mont. Cadastre Ser. 2023, 52, 288–293. [Google Scholar] [CrossRef]
  14. Ami, D.; Natalello, A.; Doglia, S.M. Fourier transform infrared microspectroscopy of complex biological systems: From intact cells to whole organisms. Methods Mol. Biol. 2012, 895, 85–100. [Google Scholar] [CrossRef] [PubMed]
  15. Miller, L.M.; Dumas, P. Chemical imaging of biological tissue with synchrotron infrared light. Biochim. Biophys. Acta 2006, 1758, 846–857. [Google Scholar] [CrossRef]
  16. McCann, M.C.; Hammouri, M.; Wilson, R.; Belton, P.; Roberts, K. Fourier transform infrared microspectroscopy is a new way to look at plant cell walls. Plant Physiol. 1992, 100, 1940–1947. [Google Scholar] [CrossRef] [PubMed]
  17. Topală, C.M.; Tătaru, L.D.; Buciumeanu, E.C.; Guţă, I.C. FTIR spectra of grapevines (Vitis vinifera L.) in the presence of virus infections. Acta Hortic. 2017, 1188, 313. [Google Scholar] [CrossRef]
  18. Săvescu, A.; Rafailă, C. Prognoza în Protectia Plantelor; Ceres: București, Romania, 1978; p. 354. [Google Scholar]
  19. Elzinga, C.L.; Salzer, D.W.; Willoughby, J.W. Measuring and Monitoring Plant Populations; U.S. Bureau of Land Management Papers: Denver, CO, USA, 1998; pp. 61–90. [Google Scholar]
  20. Marin, A.M.; Butcaru, A.C.; Iacomi, B.M. Edible climbing rose diseases management in the organic system. Sci. Pap. Ser. B Hortic. 2022, LXVI, 109–114. [Google Scholar]
  21. Vijan, L.E.; Giura, S.; Mazilu, I.C.; Botu, M. Effect of Temperature and Storage Time on Some Biochemical Compounds from the Kernel of Some Walnut Cultivars Grown in Romania. Horticulturae 2023, 9, 544. [Google Scholar] [CrossRef]
  22. Giosanu, D.; Bărbuceanu, M.; Anghel, M.; Vîjan, L. The determination of the content of phenolic compounds from different Romanian wines using Folin-Ciocîlteu method. Curr. Trends Nat. Sci. 2018, 7, 155–159. [Google Scholar]
  23. Giura, S.; Botu, M.; Vulpe, M.; Vîjan, L.E.; Mitrea, R. Evolution of the polyphenols, flavonoids, and tannins content in walnut leaves and green walnut husk during growing season. Not. Bot. Horti Agrobot. Cluj-Napoca 2019, 47, 1264–1271. [Google Scholar] [CrossRef]
  24. Singh, D.K.; Srivastava, B.; Sahu, A. Spectrophotometric determination of Rauwolfia alkaloids: Estimation of reserpine in pharmaceuticals. Anal. Sci. 2004, 20, 571–573. [Google Scholar] [CrossRef]
  25. Vîjan, L.E.; Uleanu, F.; Vulpe, M.; Giosanu, D.; Ghiorghe, C. The effect of organic fertilizers on the biochemical parameters of tomato seedlings. Oltenia. Stud. Si Comun. Ser. Stiintele Nat. 2019, 35, 185–192. [Google Scholar]
  26. Yasin, N.A.; Ahmed, S.; Khan, W.U.; Ashraf, Y. Survey and pathogenicity of black spot disease of rose in Pakistan. J. Hortic. 2016, 3, 189. [Google Scholar] [CrossRef]
  27. Knight, C.; Wheeler, B.E.J. Evaluating the resistance of roses to blackspot. J. Phytopathol. 1978, 91, 218–229. [Google Scholar] [CrossRef]
  28. Dovbeshko, G.I.; Gridina, N.Y.; Kruglova, E.B.; Pashchuk, O.P. FTIR spectroscopy studies of nucleic acid damage. Talanta 2000, 53, 233–346. [Google Scholar] [CrossRef]
  29. Dovbeshko, G.I.; Chegel, V.I.; Gridina, N.Y.; Repnytska, O.P.; Shirshov, Y.M.; Tryndiak, V.P.; Todor, I.M.; Solyanik, G.I. Surface enhanced IR absorption of nucleic acids from tumor cells: FTIR reflectance study. Biopolymers 2002, 67, 470–486. [Google Scholar] [CrossRef]
  30. Yang, Y.; Sulé-Suso, J.; Sockalingum, G.D.; Kegelaer, G.; Manfait, M.; El Haj, A.J. Study of tumor cell invasion by Fourier transform infrared microspectroscopy. Biopolymers 2005, 78, 311–317. [Google Scholar] [CrossRef]
  31. Nowak, R.; Gawlik-Dziki, U. Polyphenols of Rosa L. leaves extracts and their radical scavenging activity. Z. Naturforsch. C. J. Biosci. 2007, 62, 32–38. [Google Scholar] [CrossRef]
  32. Cunja, V.; Mikulic-Petkovsek, M.; Stampar, F.; Schmitzer, V. Compound identification of selected Rose species and cultivars: An insight to petal and leaf phenolic profiles. J. Amer. Soc. Hortic. Sci. 2014, 139, 157–166. [Google Scholar] [CrossRef]
  33. D’Angiolillo, F.; Mammano, M.M.; Fascella, G. Pigments, polyphenols and antioxidant activity of leaf extracts from four wild rose species grown in Sicily. Not. Bot. Horti Agrobot. Cluj-Napoca 2018, 46, 402–409. [Google Scholar] [CrossRef]
  34. Ozsoy, N.; Kultur, S.; Melikoglu, G.; Can, A. Screening of the antioxidant potential of the leaves and flowers from Rosa horrida Fischer. J. Med. Plants Res. 2013, 7, 573–578. [Google Scholar]
  35. Sparinska, A.; Rostoks, N. Comparing ornamental and other quality traits of Rosa rugosa hybrids in Latvia. Acta Hortic. 2012, 953, 277–283. [Google Scholar] [CrossRef]
  36. Taha, H.S.; El-Bahr, M.K.; Seif-El-Nasr, M.M. In vitro studies on Egyptian Catharanthus roseus (L.). Ii. Effect of biotic and abiotic stress on indole alkaloids production. J. Appl. Sci. Res. 2009, 5, 1826–1831. [Google Scholar]
  37. Amiri, S.; Fotovat, R.; Panahi, B.; Tarinezhad, A.; Mohammadi, S.A. Review of abiotic and biotic elicitors’ roles in secondary metabolites biosynthesis of periwinkle (Catharanthus roseus (Linn.) G. Don). J. Med. Plants 2020, 19, 1–24. [Google Scholar] [CrossRef]
  38. Höft, M.; Verpoorte, R.; Beck, E. Growth and alkaloid contents in leaves of Tabernaemontana pachysiphon Stapf (Apocynaceae) as influenced by light intensity, water and nutrient supply. Oecologia 1996, 107, 160–169. [Google Scholar] [CrossRef]
  39. Almagro, L.; Fernández-Pérez, F.; Pedreño, M.A. Indole alkaloids from Catharanthus roseus: Bioproduction and their effect on human health. Molecules 2015, 20, 2973–3000. [Google Scholar] [CrossRef]
  40. Hanafy, M.S.; Matter, M.A.; Asker, M.S.; Rady, M.R. Production of indole alkaloids in hairy root cultures of Catharanthus roseus L. and their antimicrobial activity. S. Afr. J. Bot. 2016, 105, 9–18. [Google Scholar] [CrossRef]
  41. Monnerat, C.S.; Freitas, M.S.M.; Vieira, I.J.C.; Martins, M.A.; de Carvalho, A.J.C.; dos Santos, P.C.; Lima, T.C. Ajmalicine bioproduction in Catharanthus roseus (L) G. don inoculated with arbuscular Mycorrhiza and fertilized with Nitrogen. Rev. Bras. Ciênc. Solo 2018, 42, e0170057. [Google Scholar] [CrossRef]
Figure 1. Leaves affected by Diplocarpon rosae Wolf’s attack from the rosary in the ‘Alexandru Buia’ Botanical Garden in Craiova.
Horticulturae 09 01169 g001
Figure 2. FTIR spectra of rose leaves (dark—healthy leaf and red—diseased leaf).
Horticulturae 09 01169 g002
Figure 3. Estimated marginal means of TPC (mg GAE 100 g−1) in the healthy and affected leaves of roses depending on the date of analysis for ‘Orient Express’, ‘Paul McCartney’, ‘Terracotta’, ‘Glorious’, ‘Mythos’, ‘Holstein Perle’, ‘Melina’, ‘Asja’, ‘Velvet Fragrance’, and ‘Cluj 2010’ cultivars.
Horticulturae 09 01169 g003
Figure 4. Estimated marginal means of TTC (mg GAE 100 g−1) in the healthy and affected leaves of roses depending on the date of analysis for ‘Orient Express’, ‘Paul McCartney’, ‘Terracotta’, ‘Glorious’, ‘Mythos’, ‘Holstein Perle’, ‘Melina’, ‘Asja’, ‘Velvet Fragrance’, and ‘Cluj 2010’ cultivars.
Horticulturae 09 01169 g004
Figure 5. Estimated marginal means of TFC (mg CE 100 g−1) in the healthy and affected leaves of roses depending on the date of analysis for ‘Orient Express’, ‘Paul McCartney’, ‘Terracotta’, ‘Glorious’, ‘Mythos’, ‘Holstein Perle’, ‘Melina’, ‘Asja’, ‘Velvet Fragrance’, and ‘Cluj 2010’ cultivars.
Horticulturae 09 01169 g005
Figure 6. Estimated marginal means of total chlorophyll (mg 100 g−1) in the healthy and affected leaves of roses depending on the date of analysis for ‘Orient Express’, ‘Paul McCartney’, ‘Terracotta’, ‘Glorious’, ‘Mythos’, ‘Holstein Perle’, ‘Melina’, ‘Asja’, ‘Velvet Fragrance’, and ‘Cluj 2010’ cultivars.
Horticulturae 09 01169 g006
Figure 7. Estimated marginal means of alkaloids (mg AE 100 g−1) in the healthy and affected leaves of roses depending on the datea of analysis for ‘Orient Express’, ‘Paul McCartney’, ‘Terracotta’, ‘Glorious’, ‘Mythos’, ‘Holstein Perle’, ‘Melina’, ‘Asja’, ‘Velvet Fragrance’, and ‘Cluj 2010’ cultivars.
Horticulturae 09 01169 g007
Table 1. The behavior of some rose varieties exposed to attack by Diplocarpon rosae Wolf.
CultivarPhytosanitary StatusLength (cm)Width (cm)Attack
Degree (%)
Resistance Class
‘Orient Express’Unattacked7.2 ± 1.14.8 ± 0.730Very sensitive
(FS)
Attacked5.7 ± 1.24.2 ± 1.1
Diminished appropriation (%)20.8312.5
‘Paul McCartney’Unattacked6.2 ± 1.24.1 ± 1.315Very sensitive
(FS)
Attacked6.0 ± 1.63.7 ± 1.8
Diminished appropriation (%)3.229.76
‘Terracotta’Unattacked7.6 ± 1.64.9 ± 1.220Very sensitive
(FS)
Attacked5.2 ± 1.44.2 ± 1.4
Diminished appropriation (%)31.5814.28
‘Glorious’Unattacked5.9 ± 1.54.1 ± 0.435Very sensitive
(FS)
Attacked5.1 ± 0.93.9 ± 1.2
Diminished appropriation (%)13.554.88
‘Mythos’Unattacked8.20 ±1.85.1 ± 1.235Very sensitive
(FS)
Attacked7.15 ± 1.14.3 ± 1.0
Diminished appropriation (%)12.8015.69
‘Holstein Perle’Unattacked6.6 ± 1.94.2 ± 1.320Very sensitive
(FS)
Attacked6.0 ± 1.23.6 ± 1.1
Diminished appropriation (%)9.114.28
‘Melina’Unattacked7.6 ± 1.36.4 ± 1.6 40Very sensitive
(FS)
Attacked5.7 ± 1.24.9 ± 1.5
Diminished appropriation (%)25.0023.43
‘Asja’Unattacked6.2 ± 1.6 4.0 ± 1.39.2Sensitive
(S)
Attacked3.7 ± 1.82.9 ± 1.8
Diminished appropriation (%)40.3227.5
‘Velvet Fragrance’Unattacked5.2 ± 1.63.2 ± 1.330Very sensitive
(FS)
Attacked4.1 ± 1.62.6 ± 0.9
Diminished appropriation (%)21.1518.75
‘Cluj 2010′Unattacked4.5 ± 0.53.1 ± 0.540Very sensitive
(FS)
Attacked4.2 ± 0.92.5 ± 0.7
Diminished appropriation (%)6.6719.34
Table 2. ATR-FTIR spectra vibrational assignments for control (healthy) and diseased rose leaves.
Frequencies (cm−1)
Healthy LeavesDiseased LeavesPeak Assignment
32903292νO–H, N–H
29152915νasym C–H
28482848νsym C–H
17311726νC=O stretching due to lipids
16261625νC=O, Amide I, stretching of protein
14621462δasym CH2
13691376Deformation N–H, δ CH2
13151321νsym COO stretching mainly from pectin
12421235ν C–O from carbohydrates and lignin
11461152νasym O–C–O stretching of polysaccharides
11021100Stretching PO2 symmetric (phosphate II)
10261029νC–O stretching vibration coupled with C–O bending of the C–OH groups of carbohydrates
687685CH out-of-plane bending vibrations
Table 3. ATR-FTIR spectra vibrational assignments for healthy and diseased (with bold) rose leaves.
Frequencies (cm−1)
‘Orient Express’‘Paul McCartney’‘Terracotta’‘Glorious’‘Mythos’‘Melina’‘Asja’‘Velvet
Fragrance’
‘Cluj 2010′Peak Assignment
3353
3362
3359
3344
3329
3317
3316
3334
3312
3307
3329
3318
3327
3334
3326
3325
3290
3291
Stretching O–H, N–H, C–H, N–H asymmetric (asym) [28]
2915
2915
2915
2915
2916
2915
2915
2915
2916
2915
2915
2915
2915
2915
2915
2916
2915
2915
νasym C–H
2848
2848
2848
2848
2848
2848
2848
2848
2848
2848
2848
2848
2848
2848
2848
2849
2848
2848
νsym C–H
1732
1732
1732
1731
1731
1730
1731
1731
1726
1730
1731
1730
1733
1731
1732
1730
1731
1731
νC=O stretching due to lipids
1629
1626
1613
1633
1626
1615
1626
1622
1630
1634
1620
1625
1625
1627
1625
1600
1626
1614
νC=O, Amide I, stretching of protein
1462
1462
1462
1462
1462
1462
1462
1462
1462
1461
1462
1461
1462
1462
1462
1461
1464
1461
δasym CH2
13751375
1375
137013731370
1366
1373
1372
1375
1369
1374
1371
1369Stretching C–N [28]
Deformation N–H, δ CH2 [29]
1315
1314
1315
1317
1315
1316
1315
1314
1323
1310
1315
1310
1315
1316
1315
1313
1315
1318
Amide III band components of proteins [30]
1240
1234
1240
1236
1242
1240
1241
1233
1236
1233
1240
1234
1241
1234
1241
1233
1242
1238
νC–O from carbohydrates and lignin
1167
1145
1165
1148
1159
1159
1166
1146
1160
1159
1147
1144
1147
1144
1147
1149
1146
1164
νasymO–C–O stretching of polysaccharides
110111011100110211001099110110991100Stretching PO2 symmetric (phosphate II)
1028
1029
1021
1026
1030
1036
1021
1031
1030
1031
1025
1032
1019
1026
1029
1029
1026
1031
νC–O stretching vibration coupled with C–O bending of the C–OH groups of carbohydrates
718
716
717
716
718
718
718
717
714
713
718
716
718
718
718
718
718
718
out-of-plane bending vibrations
Table 4. Variations in the content of phenolic compounds (TPC), tannins (TTC), flavonoids (TFC), alkaloids, and chlorophyll in the rose leaves depending on the date of analysis. Data are presented as mean ± SD (standard deviation).
Biochemical ParametersTimePhytosanitary StatusCultivar
‘Orient
Express’
‘Paul
McCartney’
‘Terracotta’‘Glorious’‘Mythos’‘Holstein Perle’‘Melina’‘Asja’‘Velvet
Fragrance’
‘Cluj 2010′
TPC28–29 JuneHealthy980.17 ± 0.20889.20 ± 0.85984.85 ± 3.19975.41 ± 1.281151.75 ± 0.971020.77 ± 3.491237.65 ± 2.641147.90 ± 0.431020.98 ± 0.021090.65 ± 0.67
Affected985.13 ± 1.28929.35 ± 1.021017.98 ± 3.70953.73 ± 1.891364.24 ± 4.591091.76 ± 2.731269.07 ± 5.451152.61 ± 2.301105.25 ± 7.571249.14 ± 5.11
12–13 JulyHealthy959.32 ± 0.63867.76 ± 0.59950.73 ± 0.74929.04 ± 1.38998.13 ± 0.69959.32 ± 0.631074.53 ± 1.661040.09 ± 0.70932.78 ± 0.29999.96 ± 1.53
Affected962.01 ± 0.54887.83 ± 1.77976.60 ± 0.84946.53 ± 0.401141.84 ± 0.36984.85 ± 3.191099.61 ± 2.581052.01 ± 3.09965.71 ± 1.251076.78 ± 6.69
4–5 SeptemberHealthy709.49 ± 1.31784.79 ± 0.97873.12 ± 1.10829.25 ± 1.07833.28 ± 0.39821.04 ± 0.50 813.59 ± 0.73908.82 ± 1.60844.15 ± 0.32889.59 ± 1.19
Affected744.83 ± 1.12813.79 ± 0.62886.49 ± 1.12852.34 ± 0.91936.28 ± 2.04847.13 ± 0.61823.44 ± 0.62926.41 ± 1.15864.89 ± 0.83925.98 ± 1.74
TTC28–29 JuneHealthy375.14 ± 0.11389.83 ± 0.10387.28 ± 0.08368.57 ± 0.64371.98 ± 0.54371.87 ± 0.54406.99 ± 0.06374.14 ± 0.08379.77 ± 0.48372.09 ± 0.15
Affected427.60 ± 0.08397.19 ± 0.07407.88 ± 0.06384.42 ± 0.06393.02 ± 0.16386.50 ± 0.02418.02 ± 0.12396.49 ± 0.04415.86 ± 0.14393.79 ± 0.52
12–13 JulyHealthy353.24 ± 0.06380.49 ± 0.15369.42 ± 0.57343.32 ± 0.08348.61 ± 0.94356.58 ± 0.53421.92 ± 57.71357.92 ± 0.85363.87 ± 0.38357.25 ± 0.32
Affected371.35 ± 0.14386.71 ± 1.09398.78 ± 1.14357.11 ± 0.22369.82 ± 0.08374.91 ± 0.58395.25 ± 0.64387.29 ± 0.41395.42 ± 0.22376.55 ± 1.23
4–5 SeptemberHealthy313.50 ± 0.19353.14 ± 0.06335.72 ± 0.59323.93 ± 0.16327.38 ± 0.01332.46 ± 0.60355.53 ± 0.70340.66 ± 0.60352.33 ± 0.48340.97 ± 0.33
Affected336.65 ± 0.22366.99 ± 0.04357.25 ± 0.11326.73 ± 0.07331.48 ± 0.07349.94 ± 0.61362.65 ± 0.56356.34 ± 1.16365.24 ± 0.58345.79 ± 0.50
TFC28–29 JuneHealthy285.05 ± 1.78305.04 ± 4.37193.87 ± 3.55280.47 ± 3.94337.41 ± 4.07327.63 ± 2.91321.06 ± 1.65316.09 ± 3.66358.25 ± 1.45346.83 ± 1.41
Affected375.94 ± 4.19366.79 ± 4.21224.04 ± 3.09364.49 ± 2.81377.83 ± 1.92372.19 ± 4.01347.45 ± 3.90371.46 ± 2.99376.35 ± 4.97391.29 ± 3.82
12–13 JulyHealthy270.76 ± 3.46274.95 ± 2.15186.53 ± 2.89248.77 ± 2.53310.03 ± 2.01288.95 ± 1.42282.04 ± 1.49279.84 ± 3.24321.83 ± 1.63332.31 ± 3.47
Affected345.99 ± 2.17293.98 ± 1.49201.46 ± 1.79361.72 ± 3.25341.12 ± 1.96312.57 ± 1.45330.49 ± 1.56346.25 ± 4.25350.96 ± 2.80367.48 ± 2.17
4–5 SeptemberHealthy204.13 ± 0.42199.13 ± 1.60152.55 ± 1.87226.94 ± 1.62224.65 ± 2.69225.55 ± 1.67227.34 ± 1.95263.69 ± 2.35292.33 ± 1.32309.63 ± 1.82
Affected253.29 ± 1.28239.77 ± 2.90156.60 ± 1.82238.79 ± 1.42229.79 ± 1.64261.57 ± 2.29252.38 ± 2.43260.19 ± 2.04331.06 ± 4.24317.72 ± 4.93
Chlorophyll a + b28–29 JuneHealthy270.69 ± 1.60288.73 ± 1.24239.62 ± 1.11322.73 ± 1.17321.40 ± 1.04459.72 ± 5.80293.27 ± 0.57250.27 ± 0.60212.73 ± 0.75283.08 ± 0.89
Affected65.06 ± 0.91133.72 ± 0.1995.64 ± 0.10101.00 ± 0.47222.61 ± 4.56310.86 ± 5.34212.51 ± 2.44176.92 ± 0.0988.78 ± 2.62207.31 ± 0.48
12–13 JulyHealthy144.47 ± 5.45228.17 ± 0.70150.24 ± 0.82232.07 ± 0.41192.49 ± 0.75321.45 ± 0.99237.49 ± 5.39211.99 ± 5.24151.02 ± 0.22187.09 ± 5.28
Affected34.05 ± 0.02118.63 ± 0.2266.46 ± 1.0058.75 ± 0.27164.26 ± 5.67210.20 ± 0.63137.84 ± 0.43161.71 ± 0.8379.66 ± 1.70148.30 ± 0.08
4–5 SeptemberHealthy93.09 ± 0.67136.84 ± 4.21117.02 ± 4.71104.80 ± 5.8796.93 ± 0.5799.60 ± 0.43134.82 ± 0.3281.30 ± 3.9558.69 ± 0.20123.26 ± 3.00
Affected28.44 ± 0.3563.07 ± 2.5825.31 ± 0.0123.40 ± 0.1157.37 ± 0.3346.82 ± 0.1661.35 ± 0.2675.61 ± 0.7032.21 ± 0.24111.47 ± 4.51
Alkaloids28–29 JuneHealthy78.50 ± 0.0586.41 ± 0.0987.90 ± 0.1179.22 ± 0.0588.24 ± 0.0582.90 ± 0.5688.07 ± 0.0275.88 ± 0.0680.12 ± 0.3182.02 ± 0.01
Affected89.16 ± 0.0991.45 ± 0.0289.58 ± 0.0480.08 ± 0.0394.62 ± 0.0985.97 ± 0.1390.57 ± 0.0778.85 ± 0.0585.53 ± 0.0689.42 ± 0.08
12–13 JulyHealthy88.99 ± 0.0591.01 ± 0.1089.17 ± 0.1688.02 ± 0.0992.42 ± 0.0889.16 ± 0.0792.83 ± 0.0487.83 ± 0.0985.81 ± 0.0286.66 ± 0.01
Affected92.97 ± 0.1095.92 ± 0.1191.17 ± 0.1692.16 ± 0.0492.88 ± 0.1091.69 ± 0.0793.55 ± 0.0990.71 ± 0.0991.58 ± 0.0392.55 ± 0.03
4–5 SeptemberHealthy93.31 ± 0.1393.86 ± 0.1597.13 ± 0.1894.07 ± 0.0396.21 ± 0.0690.10 ± 0.0994.09 ± 0.0989.42 ± 0.0590.79 ± 0.0589.76 ± 0.11
Affected98.25 ± 0.1396.53 ± 0.1697.70 ± 0.1397.82 ± 0.0899.05 ± 0592.17 ± 0.1194.91 ± 0.0997.66 ± 0.0494.52 ± 0.1595.28 ± 0.06
Table 5. The significance of the influence of the cultivar, harvest time, and phytosanitary status on the phenolic, tannin, flavonoid, chlorophyll, and alkaloid content of rose leaves samples.
Investigated FactorTPC
(mg GAE 100 g−1)
TFC
(mg CE 100 g−1)
TFC
(mg CE 100 g−1)
Chlorophyll a + b
(mg 100 g−1)
Alkaloids
(mg AE 100 g−1)
Cultivar0.0000.0000.0000.0000.000
Harvest time0.0000.0000.0000.0000.000
Phytosanitary status0.0000.0000.0000.0000.000
Cultivar x Harvest time0.0000.0000.0000.0000.000
Cultivar x Phytosanitary status0.0000.0000.0000.0000.000
Harvest time x Phytosanitary status0.0000.0020.0000.0000.000
Cultivar x Time x Phytosanitary status0.0000.0000.0000.0000.000
p values are presented according to the ANOVA analysis of variance (significant at 0.05 level).
Table 6. Correlation matrix between the degree of attack (AD), the content of phenolic compounds (TPC), tannins (TTC), flavonoids (TFC), chlorophyll a + b, and alkaloids in the rose leaves (r values are presented).
AD
(%)
TPC
(mg GAE 100 g−1)
TTC
(mg GAE 100 g−1)
TFC
(mg CE 100 g−1)
Chlorophyll a + b
(mg 100 g−1)
Alkaloids
(mg AE 100 g−1)
ADPearson correlation1−0.107−0.189 *0.073−0.517 ***0.510 ***
Sig. (2-tailed) 0.1540.0110.3270.0000.000
TPCPearson correlation 10.636 ***0.629 ***0.506 ***−0.403 ***
Sig. (2-tailed) 0.0000.0000.0000.000
TTCPearson correlation 10.516 ***0.279 ***−0.339 ***
Sig. (2-tailed) 0.0000.0000.000
TFCPearson correlation 10.280 ***−0.409 ***
Sig. (2-tailed) 0.0000.000
Chlorophyll a + bPearson correlation 1−0.604 ***
0.000
Sig. (2-tailed)
* Correlation is significant at the 0.05 level; and *** the correlation is significant at the 0.001 level.
Disclaimer/Publisher’s Note: The statements, opinions and data contained in all publications are solely those of the individual author(s) and contributor(s) and not of MDPI and/or the editor(s). MDPI and/or the editor(s) disclaim responsibility for any injury to people or property resulting from any ideas, methods, instructions or products referred to in the content.

