Article

Enhancing the Nutritional Profile of Crataegus monogyna Fruits by Optimizing the Extraction Conditions

by
Konstantina Kotsou
1,
Dimitra Magopoulou
2,
Theodoros Chatzimitakos
1,
Vassilis Athanasiadis
1,
Eleni Bozinou
1,
Athanassios I. Sfougaris
2 and
Stavros I. Lalas
1,*
1
Department of Food Science and Nutrition, University of Thessaly, 43100 Karditsa, Greece
2
Crop Production and Rural Environment, Laboratory of Ecosystems and Biodiversity Management, Department of Agriculture, University of Thessaly, Fytokou Str., 38446 Volos, Greece
*
Author to whom correspondence should be addressed.
Horticulturae 2024, 10(6), 564; https://doi.org/10.3390/horticulturae10060564
Submission received: 20 April 2024 / Revised: 25 May 2024 / Accepted: 26 May 2024 / Published: 28 May 2024
(This article belongs to the Special Issue Bioactive Compounds in Horticultural Plants—2nd Edition)

Abstract

:
Crataegus monogyna (CM) fruits are highly regarded for their rich nutritional content, boasting elevated levels of various beneficial secondary metabolites like total polyphenols, including anthocyanins, and ample amounts of ascorbic acid and antioxidant activity. Despite the acknowledged benefits of CM fruits, researchers have directed more attention toward its leaves and flowers. Consequently, the current research attempts to optimize extraction techniques for CM fruit using a multifaceted approach involving varied durations, temperatures, and concentrations of ethanol solvent to isolate the diverse range of bioactive components present effectively. High-performance liquid chromatography coupled with a diode array detector (HPLC-DAD) is employed for the identification and quantification of polyphenolic compounds. According to the results, by following the optimum extraction parameters (50% ethanolic solvent, 50 °C extraction temperature, and 60 min extraction time), the total polyphenol content can be increased up to 410%, reaching 55.59 mg gallic acid equivalents/g. Using 50% ethanolic solvent, 80 °C extraction temperature, and extraction time of 90 min, the total anthocyanin content can be enhanced by more than 560%, reaching a quantity of 51.83 μg cyanidin equivalents/g. Moreover, the antioxidant activity of CM fruit extracts can reach 415.95 μmol ascorbic acid equivalents (AAE)/g dw (by FRAP method), using 50% ethanolic solvent, 50 °C extraction temperature, and 60 min extraction time, and 270.26 μmol AAE/g dw (by DPPH method) and 1053.28 mg/100 g dw ascorbic acid content, using 50% ethanolic solvent, 80 °C extraction temperature, and 90 min extraction time. This comprehensive study seeks to augment the already substantial content of bioactive compounds found in CM, resulting in an extract with promising applications across the pharmaceutical, food, and cosmetics industries.

1. Introduction

The hawthorn, a species of the Rosaceae family and genus Crataegus, is an important representative of the plant community [1]. The genus Crataegus is distinguished by the variety of its species, estimated to range from 150 to 1200 different species [2]. Although the classification of the genus poses a complex scientific challenge, the identification of the common hawthorn is primarily made under the name Crataegus monogyna Jacq (CM) [3], known as Crataegus oxyacantha, from the Greek kratos, meaning hardness; oxcus, meaning sharp; and akantha, meaning a thorn [4]. The CM is widely distributed in many regions, including Asia, Africa, and Europe [2]. Morphologically, CM typically appears as a semi-evergreen shrub or small tree with thorns, reaching heights of 5–15 m [5]. Its flowers have 5 to 25 stamens, five sepals, and five white or pink petals [3]. The leaves are alternate, simple, lobed, with serrated or straight edges [3]. Finally, its fruit, known as h‘aw’, resembles a berry and contains a pome with multiple seeds, similar to plums, and can be found in various colors, such as yellow, red, or black-purple [6,7].
The hawthorn fruits are widely recognized as they are consumed in a multitude of ways. For instance, in Tunisia, CM fruit is used for the preparation of traditional syrup—azarole syrup [8]—while in both China and Europe, it is consumed and processed into commercial products like wine, jam, and candy [9]. CM fruits are considered particularly beneficial due to their high levels of valuable secondary metabolites, such as total polyphenols, such as epicatechin, chlorogenic acid, and quercetin [10,11,12]. Moreover, they are rich in ascorbic acid (vitamin C) and possess a potent antioxidant capacity [13,14]. In addition to secondary metabolites, the fruits of CM possess several pharmacological activities and properties. Specifically, among their properties, they include hypolipidemic [15,16], anti-inflammatory [17], antimicrobial [17], and cardioprotective effects [18,19], as well as effects against anxiety and depression [20]. While the fruits are extremely beneficial, greater emphasis in the scientific community has been given to the extracts of the flowers and leaves, which are also distinguished for their numerous therapeutic properties [21,22,23,24]. As such, myocardial mitochondrial action (leaf and flower extracts) [21], mitochondrial antioxidant action (leaf and flower extracts) [21], protection against class II and III heart failure (leaf and flower extracts) [22], hepatoprotective action (leaf extracts) [23], and antidiabetic action (leaf extracts) [24].
Regarding CM fruits, various studies have been conducted on their content of total polyphenols [8,25,26] without providing the optimal extraction conditions to obtain maximum values of these bioactive compounds. In a study using ultrasound for 10 min with an acetone–water mixture (30% water and 70% acetone) at a solvent-to-sample ratio of 10:1, the total polyphenol content (TPC) isolated was 227.56 ± 29.27 mg of gallic acid equivalent (GAE) per 100 g of fresh weight [8]. In another study, a conventional extraction method, stirring, and two different solvents (water and ethanol) were used. The extract consisted of 25 g powder of dried CM fruit and 100 mL solvent (water or ethanol). According to the results, the TPC was determined and was composed of 70.58 mg quercetin/g of dried weight (dw) of aqueous extract and 71.69 mg quercetin/g of dw of ethanolic extract [25]. Last but not least, one more experimental survey was conducted, examining aqueous and ethanolic solvents for CM fruit extraction. For aqueous extraction, a ratio of 20.00 g fruit with 100 mL of highly filtered water at 80 °C for 20 min in a water bath shaker was applied. Ethanol extraction was carried out by percolation following the same ratio with 70% ethanol. The CM fruit ethanolic extract contained 182 ± 4 mg/100 mL of TPC, while the aqueous extract had a three times lower amount [26], indicating that ethanol is probably a suitable solvent for the extraction of CM fruit.
Given all the above-mentioned data, it is obvious that CM is a rich source of antioxidant compounds and a beneficial plant that can be utilized in the food, pharmaceutical, and cosmetic fields. Although there are various ways of extraction for the preparation of CM extracts, there is a need to propose an optimized extraction procedure, so as to obtain the maximum yield of bioactive compounds. Since ethanol can enhance the efficiency and yield of bioactive compounds in an extraction, and according to the aforementioned data, it appears to significantly promote the enhancement of TPC in the CM fruit. The choice of solvent affects not only the extraction yield but also the overall sustainability of the process, making ethanol a favorable option for both its extraction efficiency and lower environmental impact. The present work aimed to test a multifactorial extraction system with different temperatures, times, and percentages of ethanolic solvent in order to find the most suitable extraction parameters for CMs in order to prepare the optimum extract.

2. Materials and Methods

2.1. Chemicals and Reagents

Information regarding chemicals and reagents is given in Supplementary Materials.

2.2. Fruit Collection and Preparation

The CM fruits were collected in late September and early October 2023 from a field in the Pelion area, near Volos, Thessaly, in central Greece (39°22′39.2″ N 22°59′31.9″ E, altitude 374 m, according to Google Earth coordinates), where they were in full ripeness and had a distinctive red color [27]. The fruit was harvested by hand with care. Afterward, they were washed with tap water, rinsed with deionized water, and cut into small pieces with a stainless-steel knife before being subjected to lyophilization in a Biobase BK-FD10P lyophilizer (Jinan, China) for 24 h at 7 Pa and a temperature of −54 °C. After lyophilization, the fruits were ground to a fine powder and sieved using Analysette 3 PRO (Fritsch GmbH, Oberstein, Germany). Powder particles with an average diameter between 200 and 400 μm were obtained, stored in a deep freezer (−40 °C), and used for further experiments.

2.3. Extraction Procedure

In Table 1, the multifactorial system used for the extraction of CM fruits is presented, including various concentrations of ethanol (CEtOH, %, v/v), different temperatures (T, °C), and durations (t, min). Extraction was carried out by conventional stirring (ST) at 500 rpm using a magnetic stirrer (Heidolph Instruments GmbH & Co. KG, Schwabach, Germany), and a solvent-to-solute ratio of 20:1 was used [28]. Specifically, all extractions were performed in a 25 mL glass flask containing 0.5 g of dried CM fruit powder and 10 mL of solvent. Once the extraction process was completed, the sample underwent centrifugation at 3600× g for 10 min using a centrifuge from Remi Elektrotechnik Ltd. (Palghar, India). Following this, the supernatant was collected and preserved at −40 °C until it was used for further examination.

2.4. Response Surface Methodology (RSM) Optimization of Extraction and Experiment Design

In Supplementary Materials, detailed information on the application of Box–Behnken design and Response Surface Methodology (RSM) to improve the efficiency of the extraction is given.

2.5. Analyses of Extracts

2.5.1. Determination of Total Polyphenol Content (TPC)

The total polyphenol content (TPC) of the extracts was determined using the Folin–Ciocalteu assay, following a previously documented protocol [29]. In brief, 100 μL of the CM fruit extracts were mixed with an equal volume of the Folin–Ciocalteu reagent in an Eppendorf tube. After 2 min, 800 μL of Na2CO3 solution (5% w/v) was added, and the solutions were then heated at 40 °C for 20 min. Subsequently, the absorbance at 740 nm was measured using a Shimadzu spectrophotometer (UV-1700, Shimadzu Europa GmbH, Duisburg, Germany). To quantify the TPC, a calibration curve was constructed using gallic acid as a standard compound. The concentration of total polyphenols (CTP) was expressed as mg gallic acid equivalents (GAE) per L. The TPC was further expressed as mg GAE per gram of dry weight (dw), utilizing Equation (1):
TPC   ( mg   GAE / g   dw ) = C TP   ×   V w
where V is the volume of the extraction medium (in L), and w is the dry weight of the CM fruit (in g).

2.5.2. Determination of Total Anthocyanin Content (TAC)

The determination of TAC followed a previously reported method [30]. A total of 67 μL of the extract was mixed with 933 μL of hydrochloric acid solution (0.25 M in ethanol) in a 1.5 mL Eppendorf tube and vortexed. The absorbance at 520 nm was measured using an ethanolic HCl solution as a blank after exactly 10 min. The concentration of total anthocyanins (CTA) was calculated as cyanidin-3-O-glucoside equivalents (CyE), as indicated in Equation (2):
C TA   ( mg   CyE / L ) = A   ×   MW   ×   F D ε   ×   10 3
where A is the absorbance at 520 nm, MW is the cyanidin-3-O-glucoside molecular weight (449.2), FD is the dilution factor, and ε = 26,900.
As a consequence, the TAC was determined as follows in Equation (3):
TAC   ( mg   CyE / g   dw ) = C TA   ×   V w
where V is the volume of the extraction medium (in L), and w is the dry weight of the sample (in g).

2.5.3. Ascorbic Acid Content (AAC)

The AAC was assessed through an adapted colorimetric assay [31]. An aliquot of 100 μL of the sample was mixed with 900 μL of trichloroacetic acid (10% w/v), and to the resulting solution, 500 μL of 10% (v/v) Folin–Ciocalteu reagent was added. After 10 min, the absorbance was measured at 760 nm. A standard curve was constructed using ascorbic acid.

2.5.4. Ferric Reducing Antioxidant Power (FRAP) Assay

A previously outlined protocol was utilized [32]. Specifically, 50 μL of ferric (III) chloride solution (4 mM in 0.05 M HCl) was thoroughly mixed with 50 μL of the diluted CM fruit extract and subsequently placed in a water bath at 37 °C for 30 min. Following this, 900 μL of TPTZ solution (1 mM in 0.05 M HCl) was introduced, and the absorbance at 620 nm was measured precisely after 5 min. The Reducing Power (PR) was quantified as μmol of ascorbic acid equivalents (AAE) per g of dw, employing an ascorbic acid calibration curve (CAA, 50–500 μmol/L in 0.05 M HCl) according to Equation (4):
P R   ( μ mol   AAE / g   dw ) = C A A   ×   V w
where V is the volume of the extraction medium (in L), and w is the dry weight of the sample (in g).

2.5.5. Radical Scavenging Activity (AAR, DPPH Assay)

A modified version of the assay for DPPH scavenging was adhered, as previously described [31]. Specifically, 25 μL of the diluted CM fruit extract was blended with 975 μL of DPPH solution (100 μmol/L in methanol), and the absorbance at 515 nm was promptly measured upon vortexing (A515(i)) and precisely after 30 min (A515(f)). To compute the percentage of inhibition, Equation (5) was utilized:
Inhibition   % = A 515 i   A 515 f A 515 i   ×   100
For the evaluation of antiradical activity (AAR), expressed as μmol AAE per g of dw, an ascorbic acid calibration curve (CAA) in Equation (6) was used:
A AR   ( μ mol   AAE / g   d w ) = C A A   ×   V w
where V is the volume of the extraction medium (in L), and w is the dry weight of the sample (in g).

2.6. HPLC-Based Analysis of the Polyphenolic Compounds

The analysis was performed using a Shimadzu CBM-20A liquid chromatograph and a Shimadzu SPD-M20A diode array detector, both supplied by Shimadzu Europa GmbH in Duisburg, Germany. Compounds were separated on a Phenomenex Luna C18 (2) column from Phenomenex Inc. in Torrance, CA, USA, maintained at 40 °C (100 Å, 5 μm, 4.6 × 250 mm). The mobile phase consisted of 0.5% aqueous formic acid (A) and a mixture of 0.5% formic acid in acetonitrile/water (6:4) (B). The gradient program employed was as follows: starting at 0% B and increasing to 40% B, followed by a transition to 50% B over 10 min, further increasing to 70% B in the subsequent 10 min, and then maintaining this level for 10 min. The flow rate of the mobile phase was set at 1 mL/min. Compound identification was achieved through retention time and absorbance spectrum comparisons against those of pure chemical standards. Quantification was carried out using calibration curves ranging from 0 to 50 μg/mL.

2.7. Statistical Analysis

The analyses were conducted in triplicate, and the standard deviation was computed. The results were presented as the mean values of the triplicate analyses ± standard deviation. The statistical significance of differences in mean values was determined using a one-way analysis of variance (ANOVA) test, where p < 0.05 was considered statistically significant. JMP® Pro 16 software (SAS, Cary, NC, USA) was utilized for the associated statistical analyses.

3. Results and Discussion

3.1. Extraction Optimization

In order to evaluate the effect of each extraction factor and find the optimal extraction performance, the RSM approach was utilized. The impact of each extract was assessed through its results on each examined assay. The results are presented in detail in Table 2. The most promising extraction parameters are design points 1 and 13, while point 14 seems to be the less favorable one. According to the results, the most suitable solvent was a mixture of ethanol–water (50% ethanol and 50% water), whereas pure water appears to be the less suitable. Additionally, a low temperature of 20 °C does not seem to favor the isolation of bioactive compounds compared to higher temperatures (50 °C and 80 °C).
The solvent is one of the key factors that can influence the outcome of an extraction [33]. Bioactive compounds such as polyphenols, characterized by moderate polarity, cannot be efficiently extracted with water due to their highly polar nature [34]. On the contrary, the use of ethanol, in combination with water, promotes the extraction of bioactive compounds since the solvent mixture can match the polarity of the target compounds closer [35]. Temperature is another important factor that must be taken into account when developing extraction processes since it can have a significant impact on the extraction yield, especially for polyphenols [36]. In fact, for traditional extractions carried out by stirring, the highest TPC is usually achieved in the temperature range of 60–80 °C [37]. These data are fully compatible with the results of the present research concerning the optimal extraction conditions.
In Table 3, the statistical parameters, second-order polynomial equations (models), and coefficients (R2 > 0.89, with 1 being the maximum R2) obtained for each model are presented, suggesting a good fit for the developed models. Plots of the actual response versus the predicted response for each examined parameter, as well as the desirability functions, are given in Figures S1–S5. Three-dimensional response plots for TPC are given in Figure 1, while three-dimensional response plots for the rest of the responses are in Figures S6–S9.

3.2. Impact of Extraction Parameters to Assays through Pareto Plot Analysis

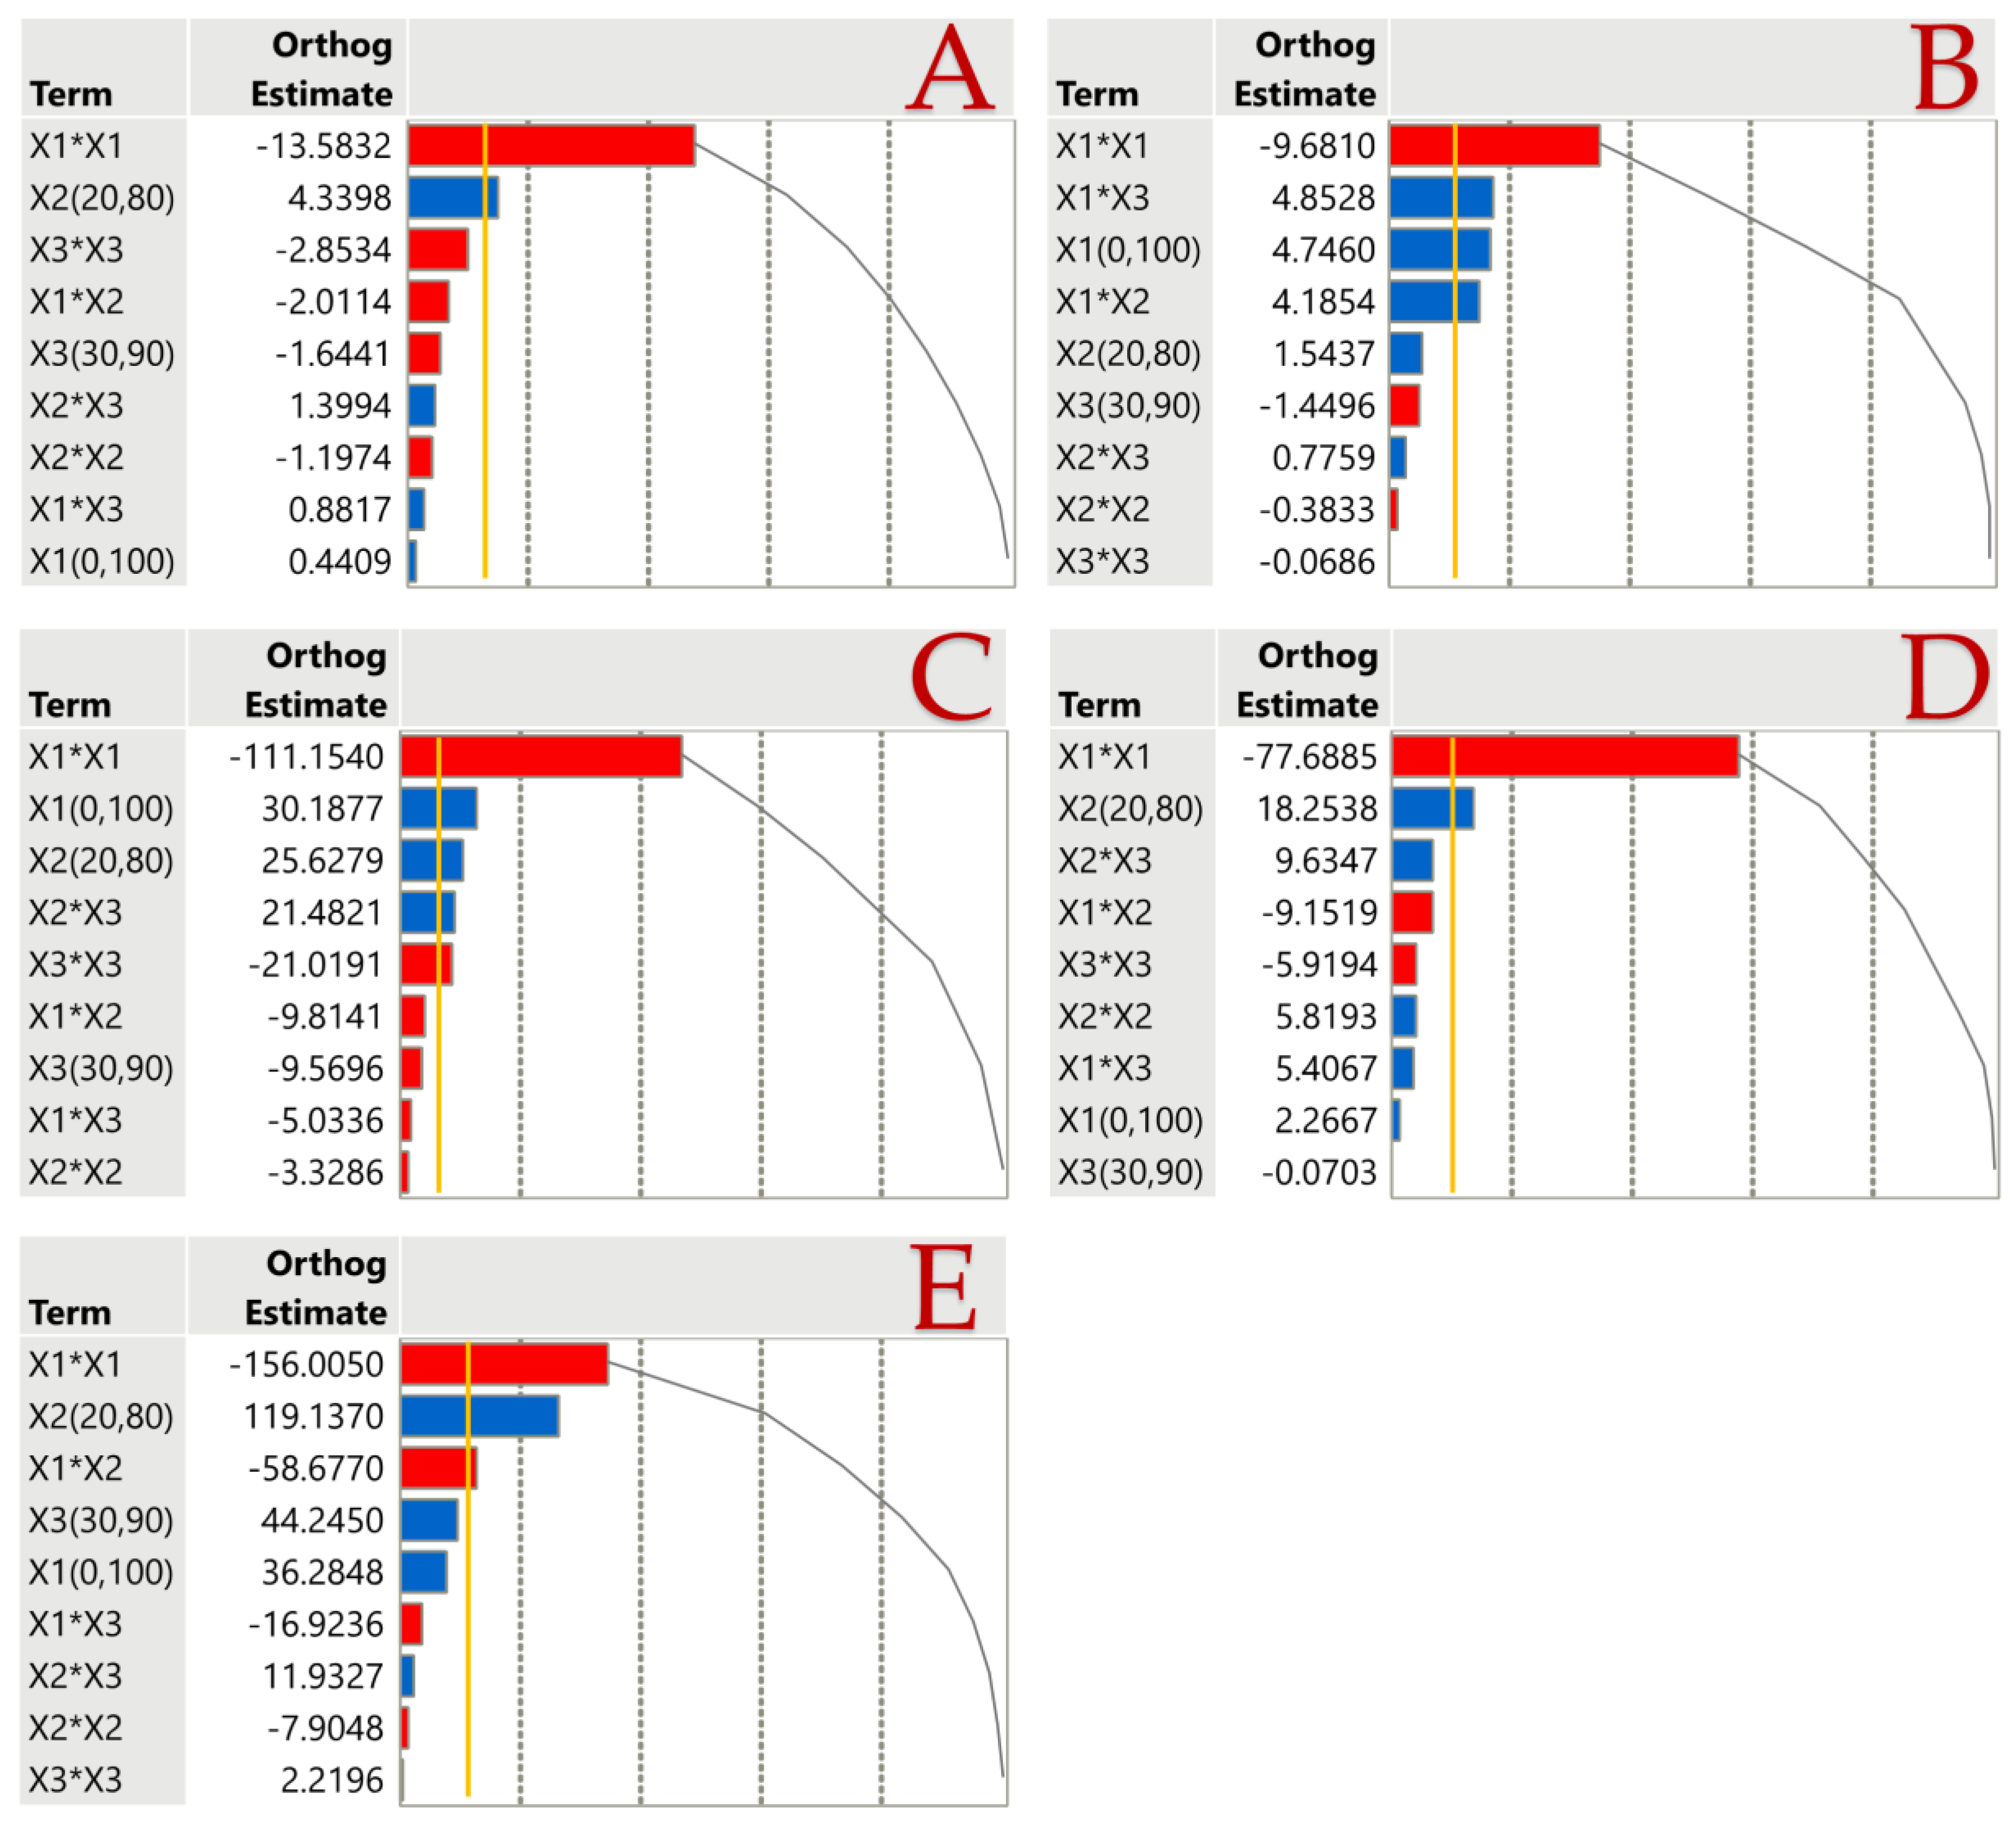
In line with the Pareto plot, Figure 2 illustrates how each extraction factor impacts the effectiveness of isolating the respective bioactive components, either positively or negatively. It is noteworthy that a negative association was observed with concentration of ethanol across all assays, as well as with antioxidant capacity. This strengthens the notion that neither water nor ethanol as solvents can extract the maximum amount of bioactive compounds, aligning with the findings of Table 2, where the highest levels of bioactivity are achieved with 50% ethanol solvent extraction. Meanwhile, a positive correlation with the extraction temperature is evident in all examined bioactive compounds and antioxidant capacity. This is in accordance with the results presented in Table 2, where high temperature promoted the isolation of high levels of TPC, TAC, and AAC and antioxidant activity from the CM fruits.

3.3. Analysis of the Extracts

3.3.1. TPC and TAC of the Extracts

The selected extraction parameters significantly influenced the TPC and TAC observed in the CM fruit extracts, as detailed in Table 2. TPC varied from 10.91 mg gallic acid equivalents (GAE)/g dw to 55.59 mg GAE/g dw, indicating an increase up to 409.53%. The highest yields of TPC were obtained using a 45% ethanol solvent along with an extraction duration of 60 min and a temperature of 80 °C, as outlined in Table 4. When compared with a previous study utilizing a single, green extraction method (ultrasound) for 30 min at 25 °C with a methanol/water (80:20) solvent mixture and a ratio of 1 g dried CM fruit to 25 mL solvent, it revealed significant differences. In the former case, a value of 35.85 ± 0.25 mg GAE/g was reported [38], reflecting a 55.06% decreased yield compared to the maximum value presented in Table 2. Additionally, when Kostić et al. [39] examined various fruit extracts of CM from Southeast Serbia, TPC values ranging from 2.12 to 30.63 mg/GAE g were observed. The maximum TPC value isolated by the suggested extraction parameters of the present study was 81.49% higher than the maximum amount presented in the aforementioned study. Through a comprehensive comparison of all the results, it becomes evident again that ethanol is a suitable solvent for extracting TP from CM fruits, highlighting the potential to produce enhanced CM fruit extracts for various applications.
Anthocyanins, which are part of the polyphenolic group, are water-soluble pigments accountable for the red, purple, and blue colors appearing in a variety of fruits and vegetables [40]. In addition, berries are well-known for their high TAC [40,41]. According to the aforementioned data, CM fruits and fruit extracts may be rich in TAC. According to Table 2, the TAC in CM extracts exhibited a range of values from 7.82 to 51.83 μg cyanidin equivalents (CyE)/g dw, ensuring a 562.79% increase. This result aligns perfectly with previous results, where TAC ranges from 0.004 to 0.132 mg CyE/g (i.e., 4 to 132 μg CyE/g) [42]. Following the optimum extraction parameters: 75% v/v ethanol solvent for 85 min extraction time at 80 °C presented in Table 4, the maximum TAC can be obtained around 55.47 μg CyE/g. Thus, it is evident that CM fruit extracts can be anthocyanin-rich extracts with an intense reddish-to-purplish color like CM fruits [43]. Various derivatives of cyanidin, such as cyanidin-O-hexoxide and cyanidin-3-O-glucoside, have been identified as anthocyanins in CM fruit [44], contributing to its intense red coloration [45]. Therefore, the rich coloration of the fruit may potentially be attributed to this anthocyanin. Taking everything into account, CM fruit extracts can be used as physical coloring agents in the pharmaceutical, cosmetic, and food industries, simultaneously providing various health benefits, as mentioned before.

3.3.2. Antioxidant Properties of the Extracts

Antioxidant properties of CM fruit extracts procured in the present study were evaluated by two in vitro methodologies, namely, FRAP and DPPH. In both approaches, the optimal extraction methods are fairly similar, as 50% ethanolic solvent and 80 °C extraction temperature are considered optimal conditions for both responses, as shown in Table 4. Concerning the extraction time, a difference of only 10 min was found between the two analyses, as 70 min of extraction is required for the optimal antioxidant capacity with the FRAP method and 80 min for the DPPH method. Based on Table 4, the highest predicted values for each method of measuring antioxidant capacity were 430.19 ± 44.46 μmol AAE/g dw for FRAP, while for DPPH, the corresponding value was 292.72 ± 46.39 μmol AAE/g dw, with desired values of 0.9553 and 0.9090, respectively, compared to the maximum value of 1. Referring to the antioxidant capacity through the two methods, it is observed that the samples show significant variability in their capacity depending on the method used. In particular, the values range from 49.24 to 415.95 μmol AAE/g according to Table 2, implying that the antioxidant capacity can be significantly increased up to 744.74% in the FRAP method. At the same time, in the DPPH method, the free radical scavenging capacity could be raised to 465.16%. In an earlier study, a methanol solvent (aqueous methanol 80% or acidified methanol 80%) was used, and the antioxidant capacity (by DPPH method) of CM fruit extracts was studied by Tahirović et al. [46]. In the aforementioned study, 1 g of powdered fruit sample was separately extracted twice with 12 mL of 80% aqueous methanol or acidified 80% methanol prepared by mixing 80 mL of absolute methanol with 20 mL of 1.5 M HCl in an ultrasonic bath (Elmecs, Italy) for 30 min. Results showed that with 80% methanol solvent, the antioxidant capacity reached 19.60 mg AAE/g (0.00011129 μmol AAE/g dw), while with acidic 80% methanol solvent, the antioxidant capacity reached 21.70 mg AAE/g (0.00012321 μmol AAE/g dw). The results demonstrate the importance of the selected solvent due to its influence on the isolation of various bioactive compounds and antioxidant activity in a variety of extracts. Finally, the antioxidant capacity of CM fruit extract may be considerably strengthened by using appropriate methods and developing a CM extract with a distinct multifaceted antioxidant capacity.

3.3.3. AAC of the Extracts

A diet rich in nutrients derived from fruits and vegetables, such as ascorbic acid, has been proven to reduce the risk of cardiovascular disease and cancer and is associated with longevity [47,48]. Ascorbic acid, known for its natural antioxidant properties [49], is found in high amounts in CM fruit extracts, according to Table 2, ranging from 213.69 to 1053.28 mg/100 g dw, pointing to a significant increase of 392.90%. Based on the data presented in Table 4, the optimum extraction conditions for achieving maximum AAC include the use of 40% ethanol solvent for 87 min at an extraction temperature of 80 °C, which can be characterized as the optimum temperature for isolating increased amounts of bioactive compounds and antioxidant activity of CM fruit extracts. Previous studies report that AAC in CM fruits ranges from 0.89 mg/g (i.e., 89 mg/100 g) [50] to 106.12–144.39 mg/100 g [51]. Nevertheless, using the proposed extraction parameters can result in a significant enhancement of up to 1083.46% AAC in CM extract. Therefore, with such high AAC, CM fruit extracts could find a plethora of applications in medical science.

3.3.4. Polyphenolic Compounds of the Optimum Extract

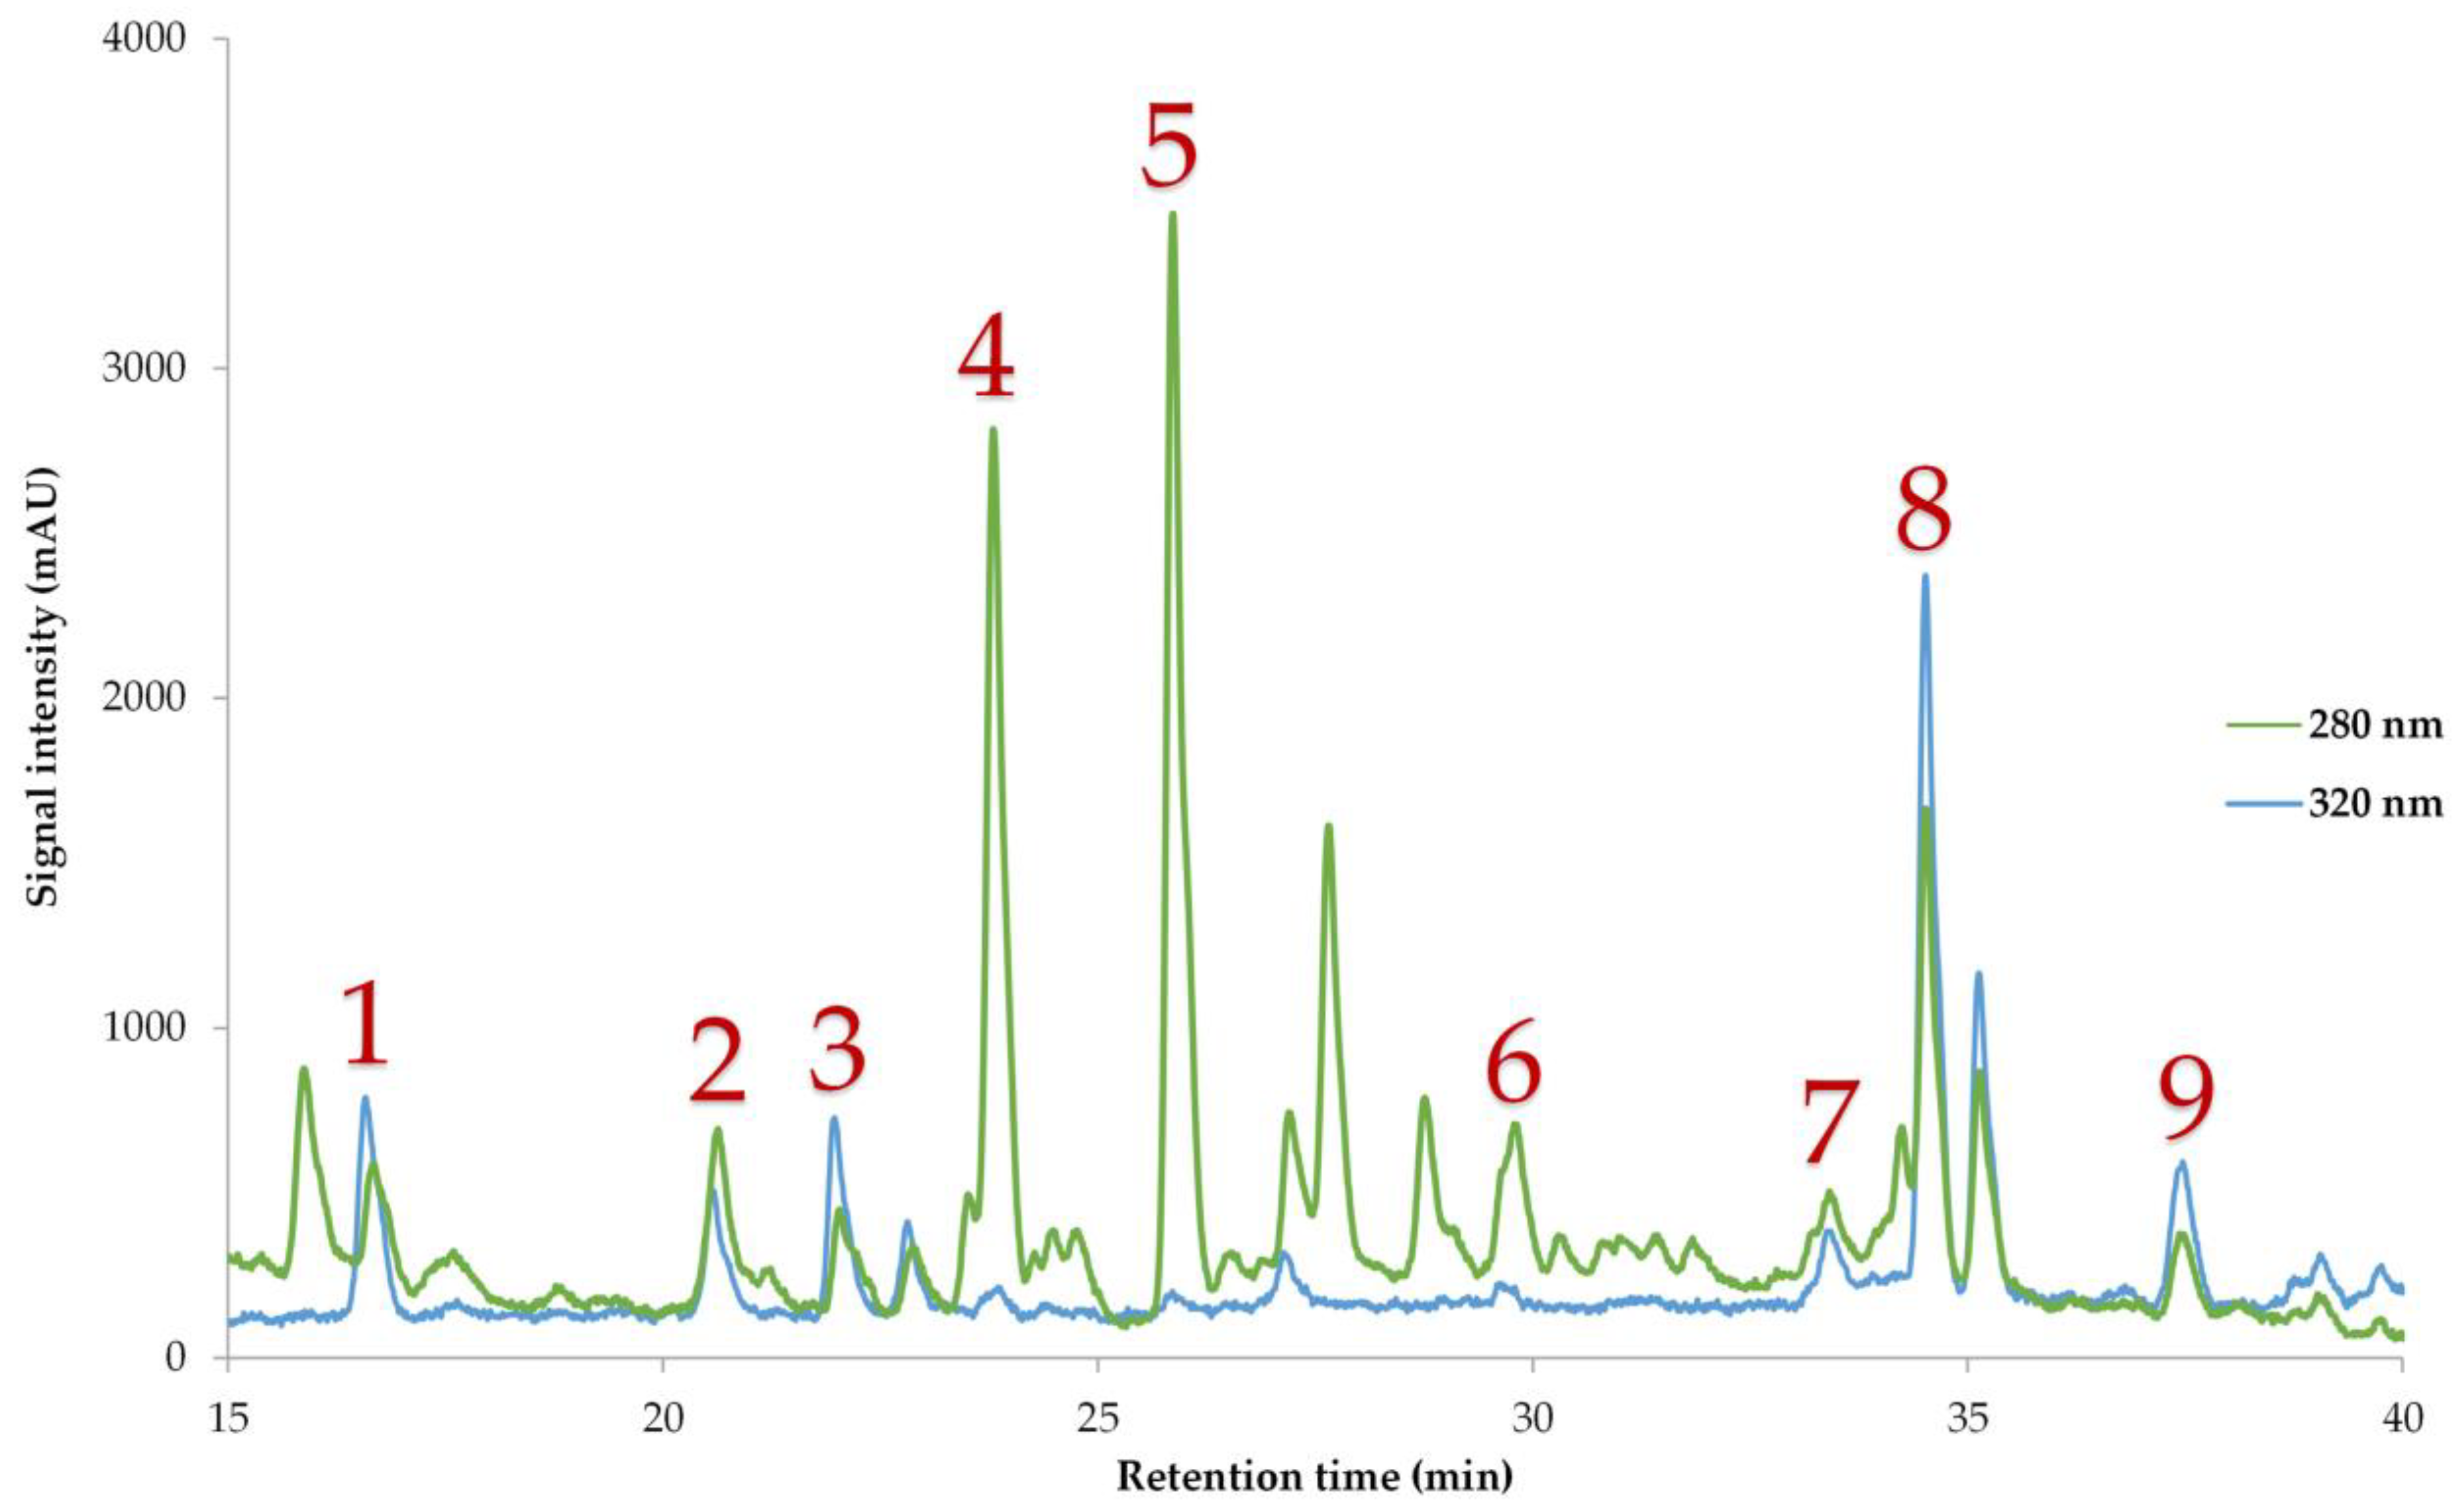
According to the results of previous research, hawthorn is also rich in phenolic acids [50,52]. In previous studies of various Crataegus species, phenolic acids such as chlorogenic [12,53,54], neochlorogenic [55], vanillic [56], ferulic [56,57], and p-coumaric [52,54] have been identified and quantified. Additionally, CM fruit species contain flavonoids such as catechin [52], epicatechin [58], quercetin [59], and kaempferol [59]. The aforementioned data align perfectly with the present results of this study, as shown in Table 5 and Figure 3, where all polyphenolic compounds found in the optimal CM fruit extract are presented, and Table 6 displays the HPLC analysis’s validation parameters. Epicatechin was the main polyphenolic compound, constituting 37.70% of the total polyphenolic compounds identified, followed by vanillic acid (23.21% of the total identified) and quercetin (20.14% of the total identified). Epicatechin exhibits strong antioxidant [60] and anticancer activity, as extracts rich in epicatechin inhibit the proliferation of cancer cells [61,62]. This finding suggests that the optimal CM fruit extract may possess both antioxidant and anticancer properties. According to a previous study by Alirezalu et al. [38], the CM fruit extract contained 0.40 mg/g of chlorogenic acid, a quantity 237.5% lower compared to the present extract. Thus, using the recommended extraction parameters, an extract with the properties of chlorogenic acid, such as anti-inflammatory and antipyretic properties [63,64], will be obtained. Last but not least, Muradoğlu et al. [52] also studied the polyphenolic compounds of various Crataegus species. Regarding CM fruits, the quantity of catechin was 15.6 mg/100 g (0.156 mg/g), and the quantity of ferulic acid was 2.8 mg/100 g (0.028 mg/g), reduced by 675.64% and 1328.57%, respectively, compared to the present CM fruit extract. Taking everything into consideration, it is evident that the optimal extract of CM fruit may be extremely beneficial due to increased amounts of bioactive compounds.

3.4. Principal Component Analysis (PCA) and Multivariate Correlation Analysis (MCA)

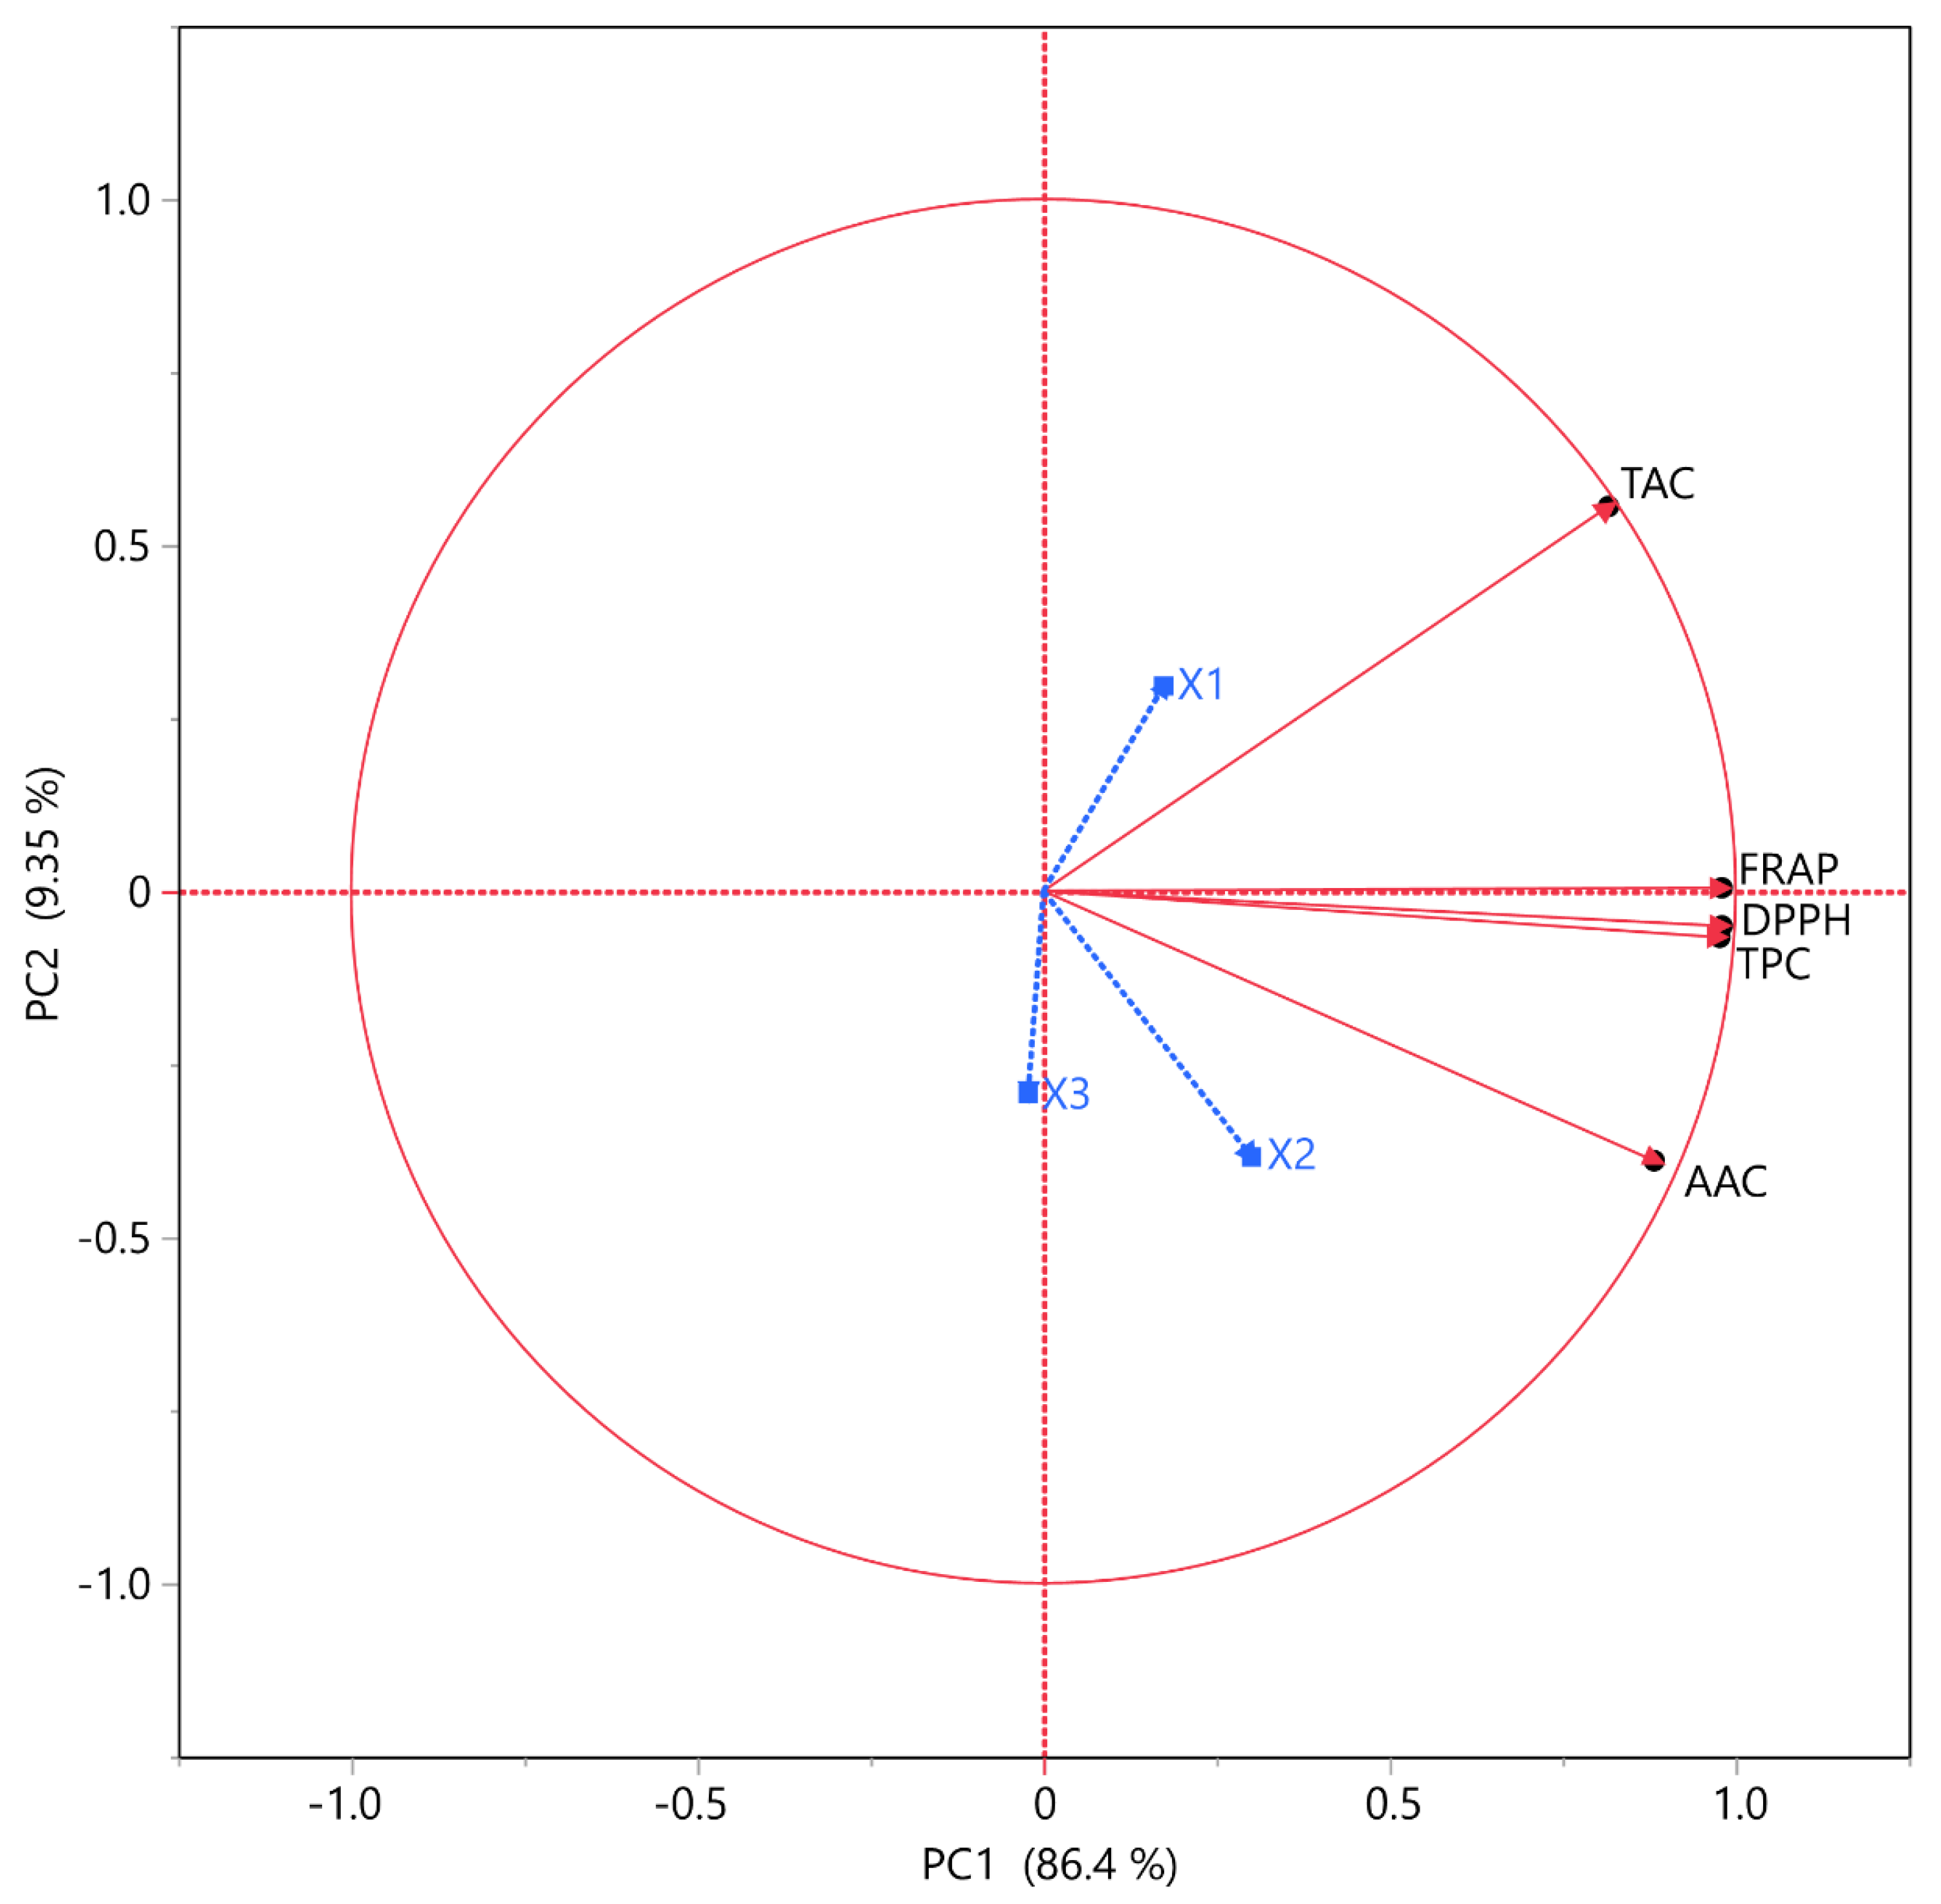
Principal component analysis (PCA) is a crucial statistical technique for reducing dimensionality, as it enables the simplification of intricate data sets while maintaining their fundamental features. By transforming the data onto a new coordinate system, PCA highlights the directions of maximum variance, offering a powerful tool for exploratory data analysis and visualization. Three technical replicates were used in PCA, which helped to ensure that the results were accurate and not just the result of variability in the data. Additionally, by doing this, we made sure that the results were consistent throughout several runs. Figure 4 and Table 7 illustrate the correlation of values between the different bioactive compounds, revealing remarkable results. Figure 4 shows that PC1 explains 86.4% of the variability, showing a positive correlation with all tested variables TPC, TAC, FRAP, DPPH, and AAC and the extraction parameters of extraction temperature (X2) and ethanol solvent concentration (X1). Moreover, it is distinguished that among the extraction factors, the one that mainly influences the increase of all bioactive compounds is X2. In more detail, the maximum temperature used, X2 (80 °C), was the most suitable temperature for all variables tested, as previously mentioned. Furthermore, it is extensively noted that ethanol plays an important role in enhancing the isolation of the bioactive compounds.
Regarding Table 7, it is worth noting that the correlation between the variables is positive and quite high, as the maximum correlation value is 1. The lowest correlation shown is 0.5452 between TAC and ACC. However, most of the bioactive compounds show a strong correlation coefficient, with the maximum being 0.9718, between TPC and the antioxidant activity of the DPPH method. This interesting result is in line with the result that CM fruit extract content has anticancer properties due to its polyphenolic compounds. In particular, as it is known that free radical scavenging is associated with reduced cancer risk [65,66], therefore, due to the high correlation between the two studied constituents, the antioxidant activity of polyphenolic compounds may also be mainly associated with free radical scavenging, reducing cancer risk. A high correlation was observed between TPC and all other bioactive substances, with a value greater than 0.7, and an even more interesting result is the strong correlation coefficient (above 0.95) between the two antioxidant methods. This means that the antioxidants have both the reduction at low pH of the ferric–tripyridyltriazine complex (Fe3+-TPTZ) to a ferric–tripyridyltriazine complex (Fe2+-TPTZ) with a bright blue color and the scavenging of free radicals.

3.5. Partial Least Squares (PLS) Analysis

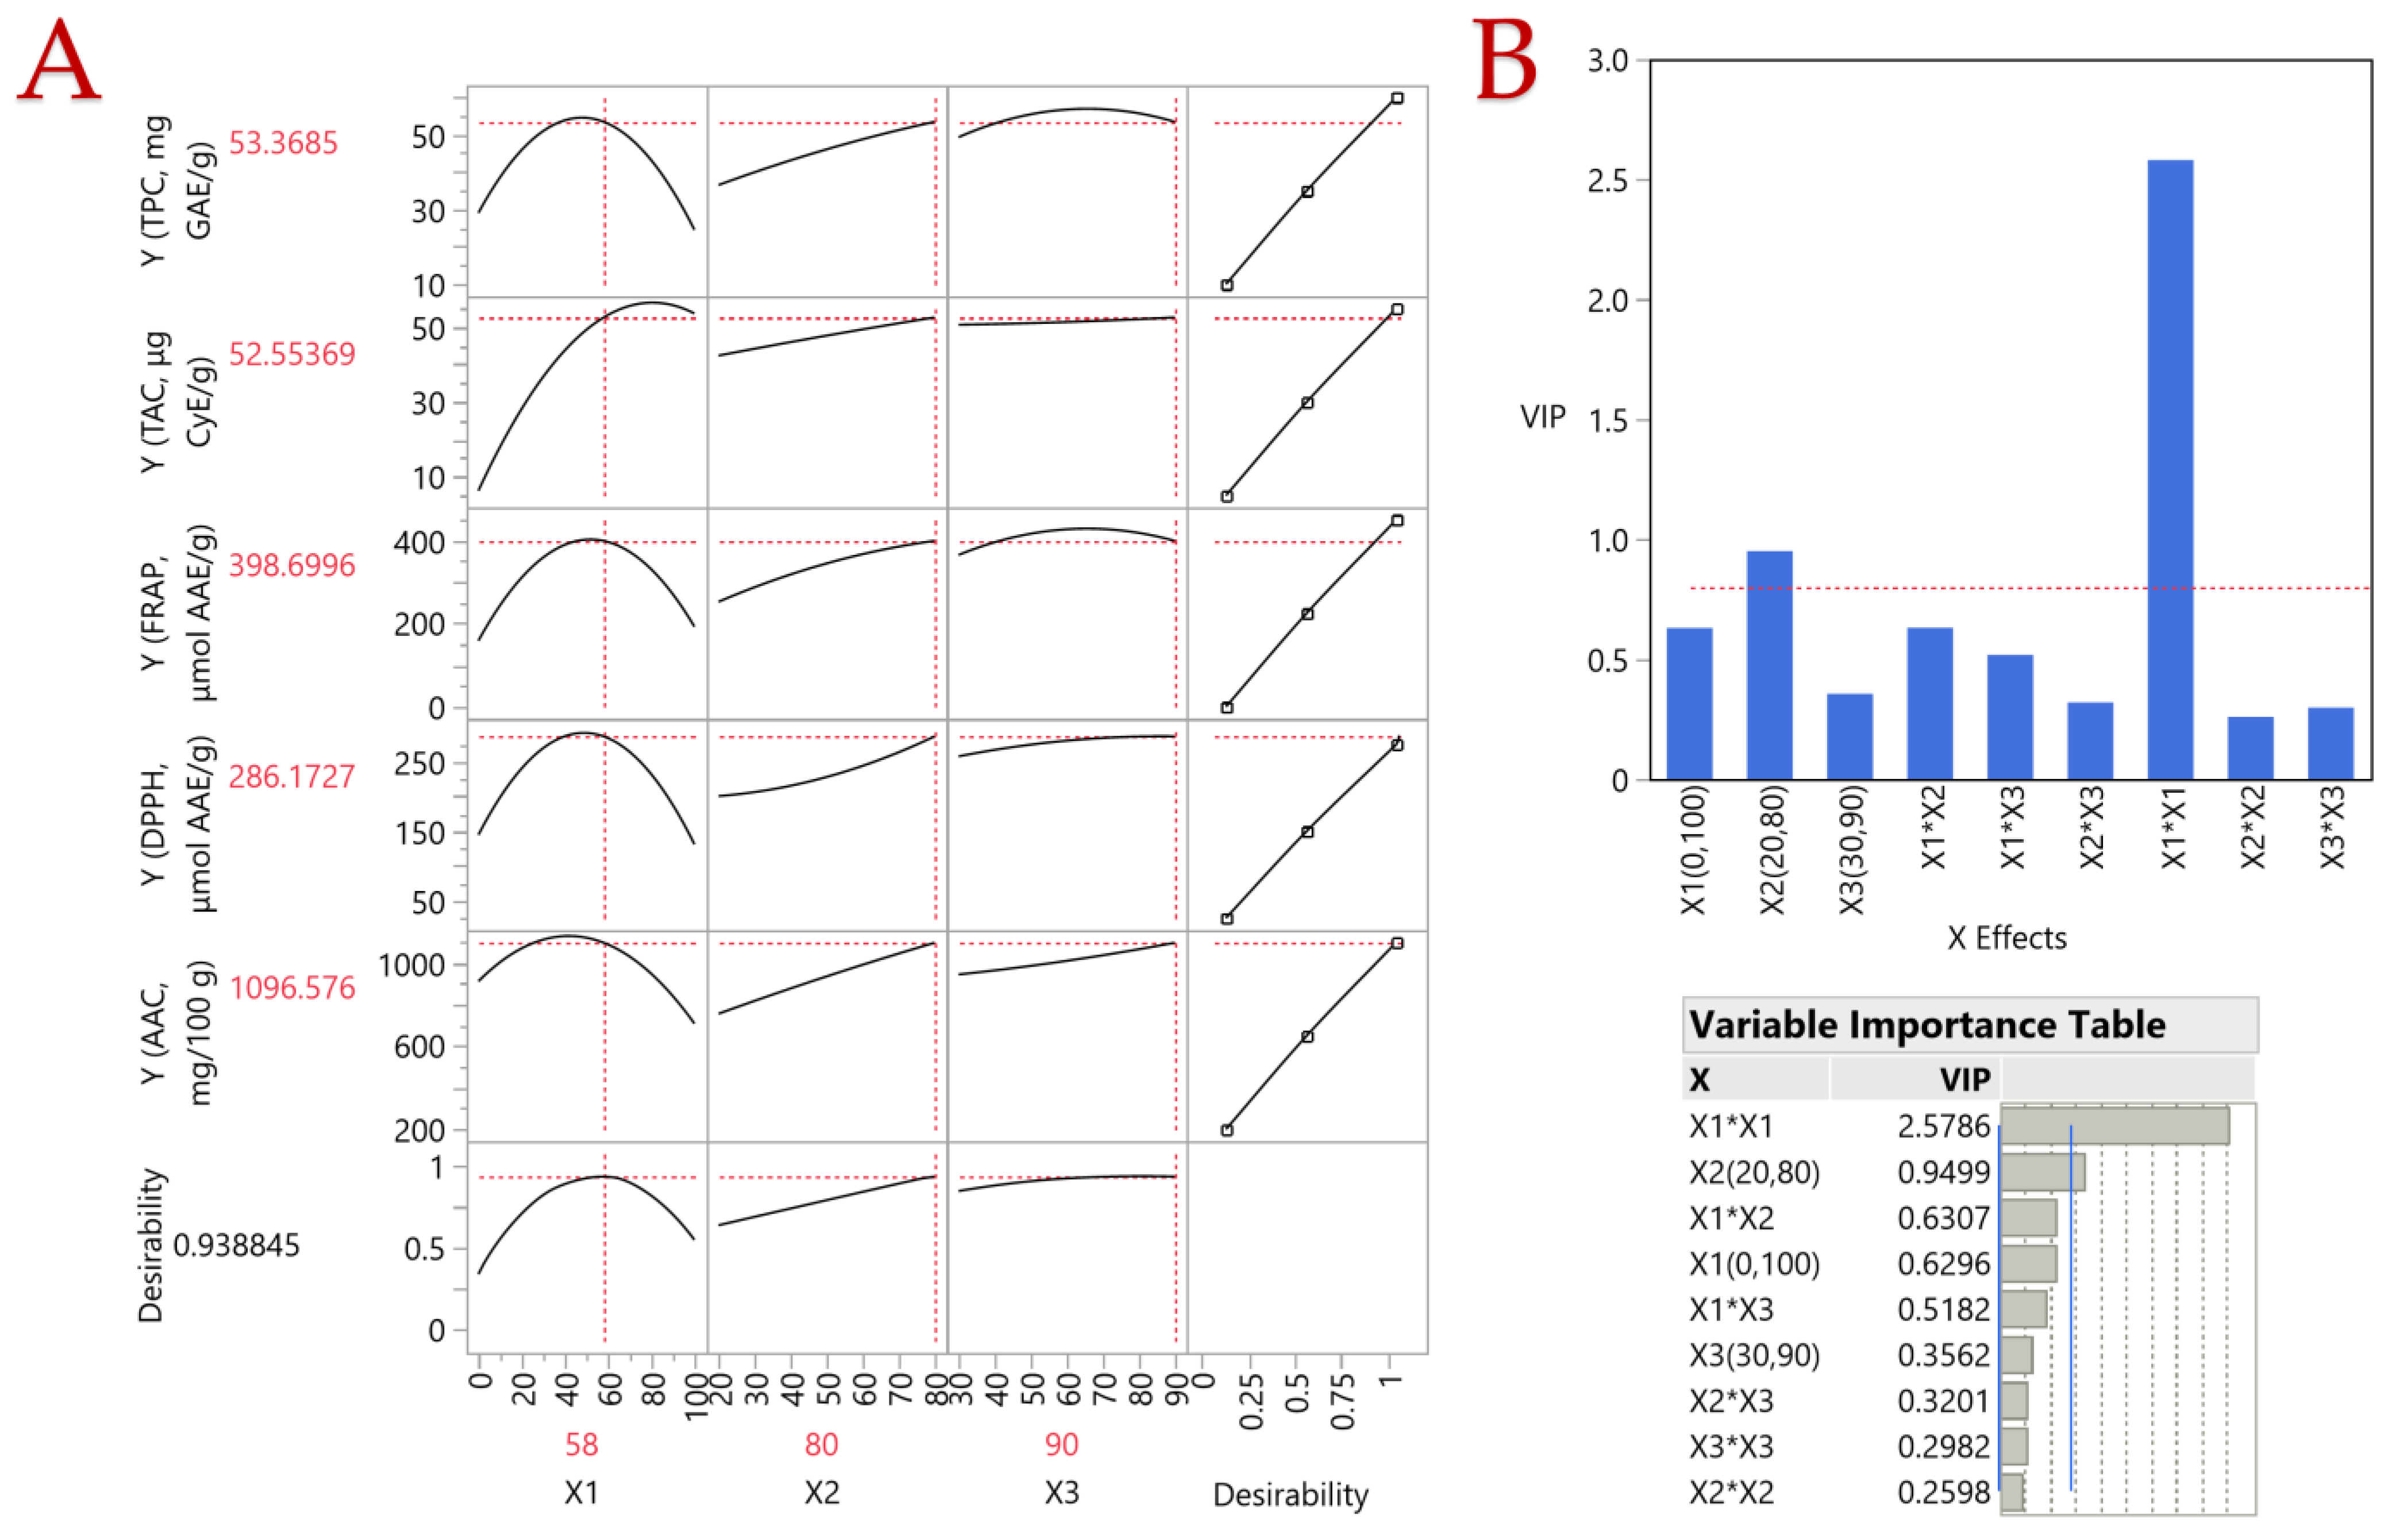
The influence of various extraction condition parameters (X1, X2, and X3) was assessed using a partial least squares (PLS) model, and the correlation loading plot is depicted in Figure 5A. This plot illustrates how extraction conditions affect CM fruit extracts. It was observed that the X1 variable, representing solvent composition, showed a great impact on maximizing responses across most assays, reaching a plateau at 60% v/v ethanol. In terms of the temperature variable (X2), higher levels were found to be optimal, indicating that extraction at 80 °C was preferable. Lastly, regarding the extraction duration parameter (X3), it was noted that higher values correlated with higher responses, leading to the selection of a longer extraction duration (90 min).
According to the findings presented in Figure 5B, the importance of each extraction parameter concerning the levels of various bioactive compounds and antioxidant activity is highlighted. As expected, solvent concentration emerges as a critical factor, with an influence value reaching approximately 2.5, significantly above the limit of importance of 0.8 for each variable. Similarly, extraction temperature also shows a significant influence, with an impact value approaching 1 (0.9499). These results confirm the crucial role of solvent concentration and extraction temperature in enhancing the bioactive composition and antioxidant capacity of the extracts.
The experimental results and the PLS model predictions are in excellent agreement, as evidenced by the high correlation coefficient of 0.9977 and the high determination coefficient (R2) of 0.9955. The p-value of <0.0001 indicates that the deviations between the observed and predicted values are not significant (Table 8).

4. Conclusions

In conclusion, the results of the present study demonstrate the effectiveness of optimized extraction techniques in maximizing the bioactive potential of CM fruit extracts. By carefully adjusting extraction parameters, such as extraction duration (90 min), temperature (80 °C), and ethanol solvent concentration (58%), a significant enhancement of total polyphenol content, total anthocyanin content, and ascorbic acid content was achieved, along with a remarkable increase in in vitro antioxidant activity. The findings of the present experimental study not only highlight the importance of adapted extraction methodology but also underscore the rich amount of beneficial compounds present in CM fruits. The significant improvements observed in bioactive content open the way for the development of strong CM extracts with promising applications in pharmaceuticals, functional foods, and cosmetic formulations. Further research and use of the therapeutic potential of CM fruit extracts hold great promise for addressing health problems and advancing the field of natural product-based treatments.

Supplementary Materials

The following supporting information can be downloaded at https://www.mdpi.com/article/10.3390/horticulturae10060564/s1. Supplementary Material File—Materials and Methods. Figures S1–S5 comprise plots that illustrate the comparison between the actual response and the predicted response for each parameter under examination, accompanied by the desirability functions. Figures S6–S9 present three-dimensional response plots for the remaining responses.

Author Contributions

Conceptualization, T.C., V.A. and S.I.L.; methodology, T.C., V.A. and S.I.L.; software, V.A.; validation, K.K., T.C., V.A., E.B. and S.I.L.; formal analysis, V.A. and D.M.; investigation, D.M., E.B., V.A. and T.C.; resources, A.I.S. and S.I.L.; data curation, V.A. and T.C.; writing—original draft preparation, K.K., T.C. and E.B.; writing—review and editing, T.C., V.A., K.K., E.B., D.M., A.I.S. and S.I.L.; visualization, V.A. and T.C.; supervision, A.I.S. and S.I.L.; project administration, A.I.S. and S.I.L.; funding acquisition, S.I.L. All authors have read and agreed to the published version of the manuscript.

Funding

This research received no external funding.

Data Availability Statement

All related data and methods are presented in this paper. Additional inquiries should be addressed to the corresponding author.

Conflicts of Interest

The authors declare no conflicts of interest.

References

  1. Gundogdu, M.; Ozrenk, K.; Ercisli, S.; Kan, T.; Kodad, O.; Hegedus, A. Organic Acids, Sugars, Vitamin C Content and Some Pomological Characteristics of Eleven Hawthorn Species (Crataegus Spp.) from Turkey. Biol. Res. 2014, 47, 21. [Google Scholar] [CrossRef] [PubMed]
  2. Attard, E.; Attard, H. Hawthorn: Crataegus Oxyacantha, Crataegus Monogyna and Related Species. In Nonvitamin and Nonmineral Nutritional Supplements; Nabavi, S.M., Silva, A.S., Eds.; Elsevier: Amsterdam, The Netherlands, 2019; pp. 289–293. ISBN 978-0-12-812491-8. [Google Scholar]
  3. Martinelli, F.; Perrone, A.; Yousefi, S.; Papini, A.; Castiglione, S.; Guarino, F.; Cicatelli, A.; Aelaei, M.; Arad, N.; Gholami, M.; et al. Botanical, Phytochemical, Anti-Microbial and Pharmaceutical Characteristics of Hawthorn (Crataegus monogyna Jacq.), Rosaceae. Molecules 2021, 26, 7266. [Google Scholar] [CrossRef] [PubMed]
  4. Kashyap, C.P.; Arya, V.; Thakur, N. Ethnomedicinal and Phytopharmacological Potential of Crataegus Oxyacantha Linn—A Review. Asian Pac. J. Trop. Biomed. 2012, 2, 1194–1199. [Google Scholar] [CrossRef]
  5. Benabderrahmane, W.; Lores, M.; Benaissa, O.; Lamas, J.P.; de Miguel, T.; Amrani, A.; Benayache, F.; Benayache, S. Polyphenolic Content and Bioactivities of Crataegus Oxyacantha L. (Rosaceae). Nat. Prod. Res. 2021, 35, 627–632. [Google Scholar] [CrossRef] [PubMed]
  6. Christensen, K.I. Revision of Crataegus Sect. Crataegus and Nothosect. Crataeguineae (Rosaceae-Maloideae) in the Old World. Syst. Bot. Monogr. 1992, 35, 1. [Google Scholar] [CrossRef]
  7. Orhan, I.E. Phytochemical and Pharmacological Activity Profile of Crataegus Oxyacantha L. (Hawthorn)—A Cardiotonic Herb. Curr. Med. Chem. 2019, 25, 4854–4865. [Google Scholar] [CrossRef] [PubMed]
  8. Belkhir, M.; Rebai, O.; Dhaouadi, K.; Congiu, F.; Tuberoso, C.I.G.; Amri, M.; Fattouch, S. Comparative Analysis of Tunisian Wild Crataegus Azarolus (Yellow Azarole) and Crataegus Monogyna (Red Azarole) Leaf, Fruit, and Traditionally Derived Syrup: Phenolic Profiles and Antioxidant and Antimicrobial Activities of the Aqueous-Acetone Extracts. J. Agric. Food Chem. 2013, 61, 130926133925000. [Google Scholar] [CrossRef] [PubMed]
  9. Edwards, J.E.; Brown, P.N.; Talent, N.; Dickinson, T.A.; Shipley, P.R. A review of the chemistry of the genus Crataegus. Phytochemistry 2012, 79, 5–26. [Google Scholar] [CrossRef] [PubMed]
  10. Barros, L.; Carvalho, A.M.; Ferreira, I.C.F.R. Comparing the Composition and Bioactivity of Crataegus Monogyna Flowers and Fruits Used in Folk Medicine. Phytochem. Anal. 2011, 22, 181–188. [Google Scholar] [CrossRef]
  11. Elsadig Karar, M.G.; Kuhnert, N. UPLC-ESI-Q-TOF-MS/MS Characterization of Phenolics from Crataegus Monogyna and Crataegus Laevigata (Hawthorn) Leaves, Fruits and Their Herbal Derived Drops (Crataegutt Tropfen). J. Chem. Biol. Ther. 2016, 1, 2572-0406. [Google Scholar] [CrossRef]
  12. Cui, T.; Li, J.-Z.; Kayahara, H.; Ma, L.; Wu, L.-X.; Nakamura, K. Quantification of the Polyphenols and Triterpene Acids in Chinese Hawthorn Fruit by High-Performance Liquid Chromatography. J. Agric. Food Chem. 2006, 54, 4574–4581. [Google Scholar] [CrossRef] [PubMed]
  13. Rodrigues, S.; Calhelha, R.C.; Barreira, J.C.M.; Dueñas, M.; Carvalho, A.M.; Abreu, R.M.V.; Santos-Buelga, C.; Ferreira, I.C.F.R. Crataegus Monogyna Buds and Fruits Phenolic Extracts: Growth Inhibitory Activity on Human Tumor Cell Lines and Chemical Characterization by HPLC–DAD–ESI/MS. Food Res. Int. 2012, 49, 516–523. [Google Scholar] [CrossRef]
  14. Ljubuncic, P.; Portnaya, I.; Cogan, U.; Azaizeh, H.; Bomzon, A. Antioxidant Activity of Crataegus Aronia Aqueous Extract Used in Traditional Arab Medicine in Israel. J. Ethnopharmacol. 2005, 101, 153–161. [Google Scholar] [CrossRef] [PubMed]
  15. Akila, M.; Devaraj, H. Synergistic Effect of Tincture of Crataegus and Mangifera Indica L. Extract on Hyperlipidemic and Antioxidant Status in Atherogenic Rats. Vascul. Pharmacol. 2008, 49, 173–177. [Google Scholar] [CrossRef] [PubMed]
  16. Kumar, S.V.; Kumar, S.P.; Rupesh, D.; Nitin, K. Effects of Methanolic Extract of Crataegus Oxyacantha on Blood Homeostasis in Rat. J. Chem. Pharm. Res. 2011, 3, 675–684. [Google Scholar]
  17. Tadić, V.M.; Dobrić, S.; Marković, G.M.; Dordević, S.M.; Arsić, I.A.; Menković, N.R.; Stević, T. Anti-Inflammatory, Gastroprotective, Free-Radical-Scavenging, and Antimicrobial Activities of Hawthorn Berries Ethanol Extract. J. Agric. Food Chem. 2008, 56, 7700–7709. [Google Scholar] [CrossRef] [PubMed]
  18. Zick, S.M.; Gillespie, B.; Aaronson, K.D. The Effect of Crataegus Oxycantha Special Extract WS 1442 on Clinical Progression in Patients with Mild to Moderate Symptoms of Heart Failure. Eur. J. Heart Fail. 2008, 10, 587–593. [Google Scholar] [CrossRef] [PubMed]
  19. Degenring, F.H.; Suter, A.; Weber, M.; Saller, R. A Randomised Double Blind Placebo Controlled Clinical Trial of a Standardised Extract of Fresh Crataegus Berries (Crataegisan) in the Treatment of Patients with Congestive Heart Failure NYHA II. Phytomedicine 2003, 10, 363–369. [Google Scholar] [CrossRef] [PubMed]
  20. Hanus, M.; Lafon, J.; Mathieu, M. Double-Blind, Randomised, Placebo-Controlled Study to Evaluate the Efficacy and Safety of a Fixed Combination Containing Two Plant Extracts (Crataegus Oxyacantha and Eschscholtzia Californica) and Magnesium in Mild-to-Moderate Anxiety Disorders. Curr. Med. Res. Opin. 2004, 20, 63–71. [Google Scholar] [CrossRef]
  21. Jayalakshmi, R.; Thirupurasundari, C.J.; Devaraj, S.N. Pretreatment with Alcoholic Extract of Crataegus Oxycantha (AEC) Activates Mitochondrial Protection during Isoproterenol—Induced Myocardial Infarction in Rats. Mol. Cell. Biochem. 2006, 292, 59–67. [Google Scholar] [CrossRef]
  22. Pittler, M.H.; Schmidt, K.; Ernst, E. Hawthorn Extract for Treating Chronic Heart Failure: Meta-Analysis of Randomized Trials. Am. J. Med. 2003, 114, 665–674. [Google Scholar] [CrossRef]
  23. Mecheri, A.; Benabderrahmane, W.; Amrani, A.; Boubekri, N.; Benayache, F.; Benayache, S.; Zama, D. Hepatoprotective Effects of Algerian Crataegus Oxyacantha Leaves. Recent Pat. Food. Nutr. Agric. 2019, 10, 70–75. [Google Scholar] [CrossRef]
  24. Jouad, H.; Lemhadri, A.; Maghrani, M.; Burcelin, R.; Eddouks, M. Hawthorn Evokes a Potent Anti-Hyperglycemic Capacity in Streptozotocin-Induced Diabetic Rats. J. Herb. Pharmacother. 2003, 3, 19–29. [Google Scholar] [CrossRef]
  25. Keser, S.; Celik, S.; Turkoglu, S.; Yilmaz, Ö.; Turkoglu, I. The Investigation of Some Bioactive Compounds and Antioxidant Properties of Hawthorn (Crataegus Monogyna Subsp. Monogyna Jacq). J. Intercult. Ethnopharmacol. 2014, 3, 51–55. [Google Scholar] [CrossRef]
  26. Bernatoniene, J.; Masteikova, R.; Majiene, D.; Savickas, A.; Kevelaitis, E.; Bernatoniene, R.; Dvořáčkovâ, K.; Civinskiene, G.; Lekas, R.; Vitkevičius, K.; et al. Free Radical-Scavenging Activities of Crataegus Monogyna Extracts. Medicina (B. Aires) 2008, 44, 706–712. [Google Scholar] [CrossRef]
  27. Lasseigne, F.T.; Blazich, F.A. Crataegus L. In The Woody Plant Seed Manual; Agriculture Handbook 727; Bonner, F.T., Karrfalt, R.P., Eds.; Forest Service: Washington, DC, USA, 2008; pp. 447–456. [Google Scholar]
  28. Athanasiadis, V.; Chatzimitakos, T.; Bozinou, E.; Kotsou, K. Optimization of Extraction Parameters for Enhanced Recovery of Bioactive Compounds from Quince Peels Using Response. Foods 2023, 12, 2099. [Google Scholar] [CrossRef]
  29. Lakka, A.; Grigorakis, S.; Kaltsa, O.; Karageorgou, I.; Batra, G.; Bozinou, E.; Lalas, S.; Makris, D.P. The Effect of Ultrasonication Pretreatment on the Production of Polyphenol-Enriched Extracts from Moringa Oleifera L. (Drumstick Tree) Using a Novel Bio-Based Deep Eutectic Solvent. Appl. Sci. 2020, 10, 220. [Google Scholar] [CrossRef]
  30. Kourelatou, A.; Chatzimitakos, T.; Athanasiadis, V.; Kotsou, K.; Makrygiannis, I.; Bozinou, E.; Lalas, S.I. Seeking Optimal Extraction Method for Augmenting Hibiscus Sabdariffa Bioactive Compounds and Antioxidant Activity. Processes 2024, 12, 581. [Google Scholar] [CrossRef]
  31. Jagota, S.K.; Dani, H.M. A New Colorimetric Technique for the Estimation of Vitamin C Using Folin Phenol Reagent. Anal. Biochem. 1982, 127, 178–182. [Google Scholar] [CrossRef]
  32. Paleologou, I.; Vasiliou, A.; Grigorakis, S.; Makris, D.P. Optimisation of a Green Ultrasound-Assisted Extraction Process for Potato Peel (Solanum Tuberosum) Polyphenols Using Bio-Solvents and Response Surface Methodology. Biomass Convers. Biorefin. 2016, 6, 289–299. [Google Scholar] [CrossRef]
  33. Pham, T.N.; Lam, T.D.; Nguyen, M.T.; Le, X.T.; Vo, D.V.N.; Toan, T.Q.; Vo, T.S. Effect of Various Factors on Extraction Efficiency of Total Anthocyanins from Butterfly Pea (Clitoria Ternatea L. Flowers) in Southern Vietnam. IOP Conf. Ser. Mater. Sci. Eng. 2019, 544, 012013. [Google Scholar] [CrossRef]
  34. Athanasiadis, V.; Chatzimitakos, T.; Bozinou, E.; Kotsou, K.; Palaiogiannis, D.; Lalas, S.I. Maximizing the Extraction of Bioactive Compounds from Diospyros Kaki Peel through the Use of a Pulsed Electric Field and Ultrasound Extraction. Biomass 2023, 3, 422–440. [Google Scholar] [CrossRef]
  35. Wardy, W.; Saalia, F.K.; Steiner-Asiedu, M.; Budu, A.S.; Sefa-Dedeh, S. A Comparison of Some Physical, Chemical and Sensory Attributes of Three Pineapple (Ananas Comosus) Varieties Grown in Ghana. Afr. J. Food Sci. 2009, 3, 22–025. [Google Scholar]
  36. Usman, I.; Hussain, M.; Imran, A.; Afzaal, M.; Saeed, F.; Javed, M.; Afzal, A.; Ashfaq, I.; Al Jbawi, E.; A. Saewan, S. Traditional and Innovative Approaches for the Extraction of Bioactive Compounds. Int. J. Food Prop. 2022, 25, 1215–1233. [Google Scholar] [CrossRef]
  37. Antony, A.; Farid, M. Effect of Temperatures on Polyphenols during Extraction. Appl. Sci. 2022, 12, 2107. [Google Scholar] [CrossRef]
  38. Alirezalu, A.; Ahmadi, N.; Salehi, P.; Sonboli, A.; Alirezalu, K.; Khaneghah, A.M.; Barba, F.J.; Munekata, P.E.S.; Lorenzo, J.M. Physicochemical Characterization, Antioxidant Activity, and Phenolic Compounds of Hawthorn (Crataegus Spp.) Fruits Species for Potential Use in Food Applications. Foods 2020, 9, 436. [Google Scholar] [CrossRef]
  39. Kostić, D.A.; Velicković, J.M.; Mitić, S.S.; Mitic, M.N.; Randelović, S.S. Phenolic Content, and Antioxidant and Antimicrobial Activities of Crataegus oxyacantha L (Rosaceae) Fruit Extract from Southeast Serbia. Trop. J. Pharm. Res. 2012, 11, 117–124. [Google Scholar] [CrossRef]
  40. Khoo, H.E.; Azlan, A.; Tang, S.T.; Lim, S.M. Anthocyanidins and Anthocyanins: Colored Pigments as Food, Pharmaceutical Ingredients, and the Potential Health Benefits. Food Nutr. Res. 2017, 61, 1361779. [Google Scholar] [CrossRef]
  41. Skrovankova, S.; Sumczynski, D.; Mlcek, J.; Jurikova, T.; Sochor, J. Bioactive Compounds and Antioxidant Activity in Different Types of Berries. Int. J. Mol. Sci. 2015, 16, 24673–24706. [Google Scholar] [CrossRef]
  42. Tahirović, A.; Bašić, N. Phenolic Content and Antioxidant Activity of Crataegus monogyna L. Fruit Extracts. Rad. Šumarskog Fak. Univ. Sarajev. 2014, 44, 29–40. [Google Scholar] [CrossRef]
  43. Yalçın Dokumacı, K.; Uslu, N.; Hacıseferoğulları, H.; Örnek, M.N. Determination of Some Physical and Chemical Properties of Common Hawthorn (Crataegus monogyna Jacq. Var. Monogyna). Erwerbs-Obstbau 2021, 63, 99–106. [Google Scholar] [CrossRef]
  44. Tamayo-Vives, C.; García-Herrera, P.; Sánchez-Mata, M.C.; Cámara-Hurtado, R.M.; Pérez-Rodríguez, M.L.; Aceituno, L.; Pardo-de-Santayana, M.; Días, M.I.; Barros, L.; Morales, P. Wild Fruits of Crataegus monogyna Jacq. and Sorbus aria (L.) Crantz: From Traditional Foods to Innovative Sources of Pigments and Antioxidant Ingredients for Food Products. Foods 2023, 12, 2427. [Google Scholar] [CrossRef]
  45. Singh, D.; Kumari, K.; Ahmed, S. Chapter 17—Natural Herbal Products for Cancer Therapy; Jain, B., Pandey, S.B.T.-U.C., Eds.; Academic Press: Cambridge, MA, USA, 2022; pp. 257–268. ISBN 978-0-323-99883-3. [Google Scholar]
  46. Tahirović, A.; Bašić, N.; Hubijar, I.; Šito, S.; Čabaravdić, A. Comparison of Polyphenol Content and Antioxidant Activity of Extracts from Fruits of Two Crataegus Species. Rad. Šumarskog Fak. Univ. Sarajev. 2015, 45, 38–51. [Google Scholar] [CrossRef]
  47. Aune, D.; Giovannucci, E.; Boffetta, P.; Fadnes, L.T.; Keum, N.; Norat, T.; Greenwood, D.C.; Riboli, E.; Vatten, L.J.; Tonstad, S. Fruit and Vegetable Intake and the Risk of Cardiovascular Disease, Total Cancer and All-Cause Mortality—A Systematic Review and Dose-Response Meta-Analysis of Prospective Studies. Int. J. Epidemiol. 2017, 46, 1029–1056. [Google Scholar] [CrossRef]
  48. Aune, D.; Keum, N.; Giovannucci, E.; Fadnes, L.T.; Boffetta, P.; Greenwood, D.C.; Tonstad, S.; Vatten, L.J.; Riboli, E.; Norat, T. Dietary Intake and Blood Concentrations of Antioxidants and the Risk of Cardiovascular Disease, Total Cancer, and All-Cause Mortality: A Systematic Review and Dose-Response Meta-Analysis of Prospective Studies. Am. J. Clin. Nutr. 2018, 108, 1069–1091. [Google Scholar] [CrossRef]
  49. Doseděl, M.; Jirkovský, E.; Macáková, K.; Krčmová, L.K.; Javorská, L.; Pourová, J.; Mercolini, L.; Remião, F.; Nováková, L.; Mladěnka, P. Vitamin C—Sources, Physiological Role, Kinetics, Deficiency, Use, Toxicity, and Determination. Nutrients 2021, 13, 615. [Google Scholar] [CrossRef]
  50. Zhang, J.; Chai, X.; Zhao, F.; Hou, G.; Meng, Q. Food Applications and Potential Health Benefits of Hawthorn. Foods 2022, 11, 2861. [Google Scholar] [CrossRef]
  51. Tahirović, A.; Čopra–Janićijević, A.; Bašić, N.; Klepo, L.; Subašić, M. Determination of Vitamin C in Some Bosnian Crataegus L. Species. Rad. Šumarskog Fak. Univ. Sarajev. 2012, 42, 43–55. [Google Scholar] [CrossRef]
  52. Muradoğlu, F.; Gürsoy, S.; Yıldız, K. Quantification Analysis of Biochemical and Phenolic Composition in Hawthorn (Crataegus Spp.) Fruits. Erwerbs-Obstbau 2019, 61, 189–194. [Google Scholar] [CrossRef]
  53. Yang, B.; Liu, P. Composition and Health Effects of Phenolic Compounds in Hawthorn (Crataegus Spp.) of Different Origins. J. Sci. Food Agric. 2012, 92, 1578–1590. [Google Scholar] [CrossRef]
  54. Bekbolatova, E.; Kukula-Koch, W.; Baj, T.; Stasiak, N.; Ibadullayeva, G.; Koch, W.; Głowniak, K.; Tulemissov, S.; Sakipova, Z.; Boylan, F. Phenolic Composition and Antioxidant Potential of Different Organs of Kazakh Crataegus Almaatensis Pojark: A Comparison with the European Crataegus Oxyacantha L. Flowers. Open Chem. 2018, 16, 415–426. [Google Scholar] [CrossRef]
  55. Wu, X.; Song, M.; Qiu, P.; Li, F.; Wang, M.; Zheng, J.; Wang, Q.; Xu, F.; Xiao, H. A Metabolite of Nobiletin, 4′-Demethylnobiletin and Atorvastatin Synergistically Inhibits Human Colon Cancer Cell Growth by Inducing G0/G1 Cell Cycle Arrest and Apoptosis. Food Funct. 2018, 9, 87–95. [Google Scholar] [CrossRef]
  56. Lou, X.; Yuan, B.; Wang, L.; Xu, H.; Hanna, M.; Yuan, L. Evaluation of Physicochemical Characteristics, Nutritional Composition and Antioxidant Capacity of Chinese Organic Hawthorn Berry (Crataegus Pinnatifida). Int. J. Food Sci. Technol. 2020, 55, 1679–1688. [Google Scholar] [CrossRef]
  57. Issaadi, O.; Fibiani, M.; Picchi, V.; Scalzo, R.L.; Madani, K. Phenolic Composition and Antioxidant Capacity of Hawthorn (Crataegus oxyacantha L.) Flowers and Fruits Grown in Algeria. J. Complement. Integr. Med. 2021, 17, 20180125. [Google Scholar] [CrossRef]
  58. Zhu, R.; Zhang, X.; Wang, Y.; Zhang, L.; Wang, C.; Hu, F.; Ning, C.; Chen, G. Pectin Oligosaccharides from Hawthorn (Crataegus Pinnatifida Bunge. Var. Major): Molecular Characterization and Potential Antiglycation Activities. Food Chem. 2019, 286, 129–135. [Google Scholar] [CrossRef]
  59. Rocchetti, G.; Senizza, B.; Zengin, G.; Mahomodally, M.F.; Senkardes, I.; Lobine, D.; Lucini, L. Untargeted Metabolomic Profiling of Three Crataegus Species (Hawthorn) and Their in Vitro Biological Activities. J. Sci. Food Agric. 2020, 100, 1998–2006. [Google Scholar] [CrossRef]
  60. Sokół-Łętowska, A.; Oszmiański, J.; Wojdyło, A. Antioxidant Activity of the Phenolic Compounds of Hawthorn, Pine and Skullcap. Food Chem. 2007, 103, 853–859. [Google Scholar] [CrossRef]
  61. Abdulkhaleq, L.A.; Assi, M.A.; Noor, M.H.M.; Abdullah, R.; Saad, M.Z.; Taufiq-Yap, Y.H. Therapeutic Uses of Epicatechin in Diabetes and Cancer. Vet. World 2017, 10, 869–872. [Google Scholar] [CrossRef]
  62. Horie, N.; Hirabayashi, N.; Takahashi, Y.; Miyauchi, Y.; Taguchi, H.; Takeishi, K. Synergistic Effect of Green Tea Catechins on Cell Growth and Apoptosis Induction in Gastric Carcinoma Cells. Biol. Pharm. Bull. 2005, 28, 574–579. [Google Scholar] [CrossRef]
  63. Santana-Gálvez, J.; Cisneros-Zevallos, L.; Jacobo-Velázquez, D.A. Chlorogenic Acid: Recent Advances on Its Dual Role as a Food Additive and a Nutraceutical against Metabolic Syndrome. Molecules 2017, 22, 358. [Google Scholar] [CrossRef]
  64. Haider, K.; Haider, M.R.; Neha, K.; Yar, M.S. Free Radical Scavengers: An Overview on Heterocyclic Advances and Medicinal Prospects. Eur. J. Med. Chem. 2020, 204, 112607. [Google Scholar] [CrossRef] [PubMed]
  65. Sainz, R.M.; Lombo, F.; Mayo, J.C. Radical Decisions in Cancer: Redox Control of Cell Growth and Death. Cancers 2012, 4, 442–474. [Google Scholar] [CrossRef] [PubMed]
  66. Wang, X.-Q.; Wang, W.; Peng, M.; Zhang, X.-Z. Free Radicals for Cancer Theranostics. Biomaterials 2021, 266, 120474. [Google Scholar] [CrossRef]
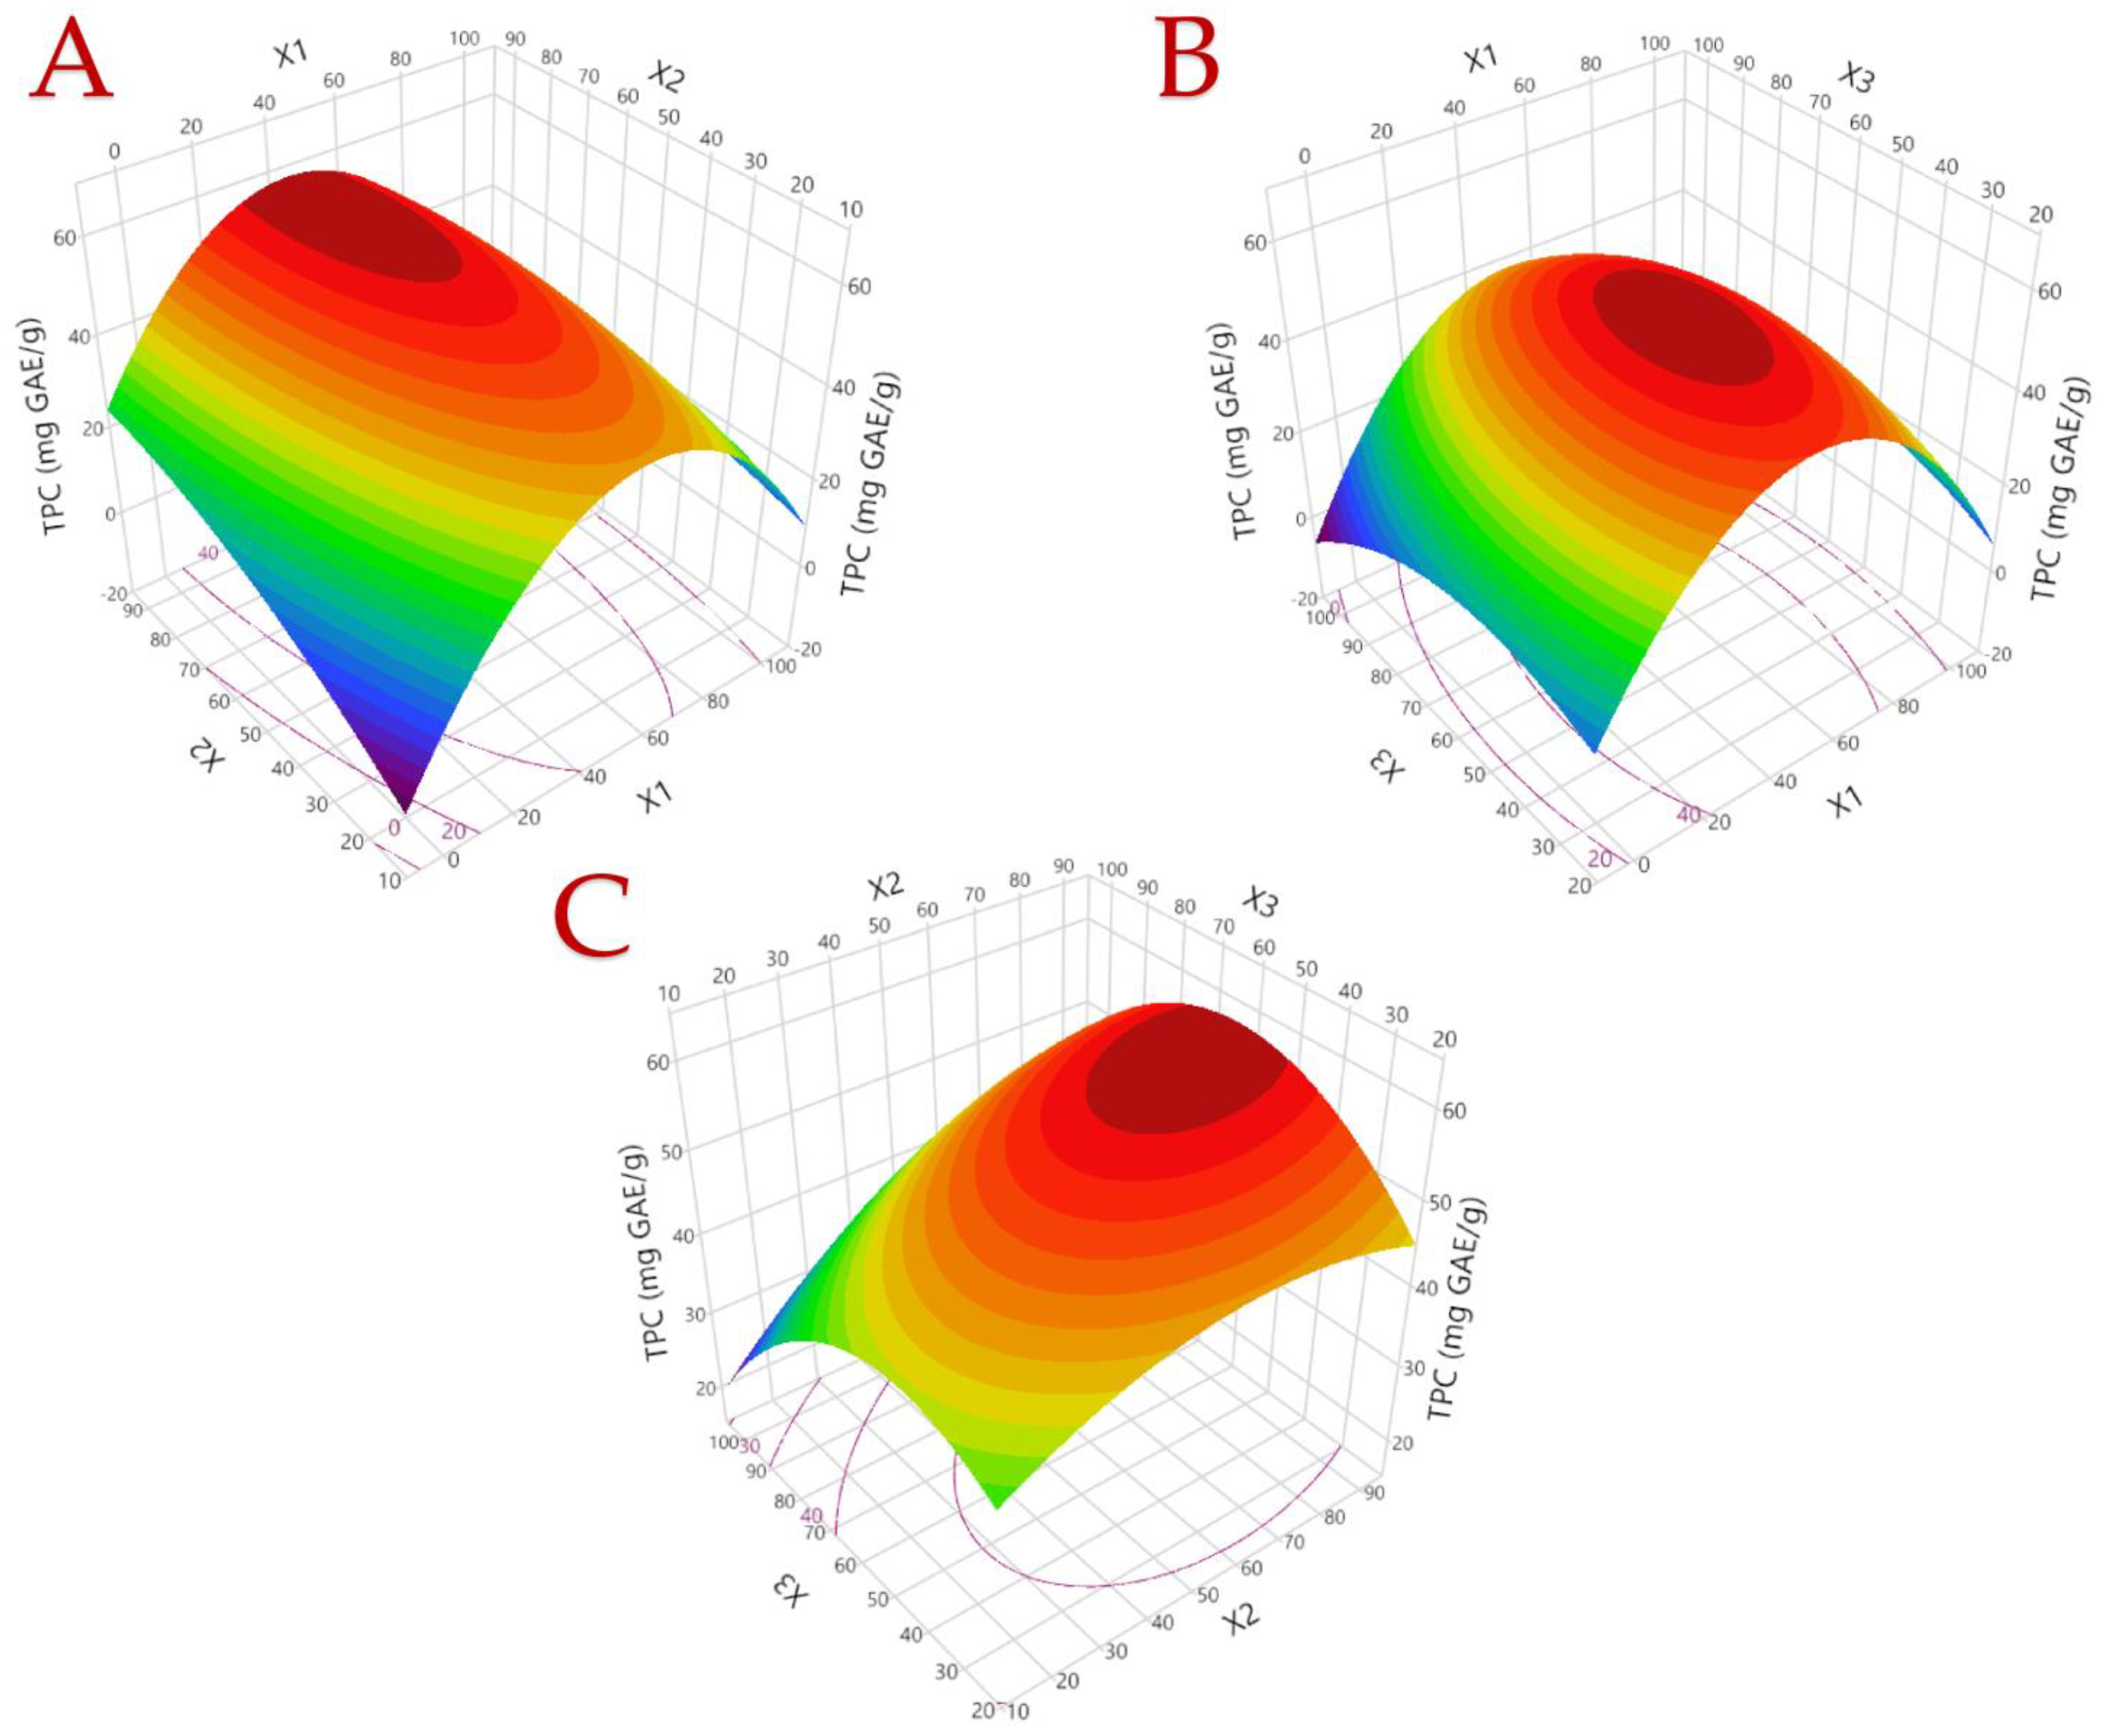
Figure 1. The optimal extraction of Crataegus fruit extracts is shown in 3D graphs that show the impact of the process variables considered in the response (total polyphenol content—TPC, mg GAE/g). Plot (A), covariation of X1 (ethanol concentration; C, % v/v) and X2 (extraction temperature; T, °C); plot (B), covariation of X1 and X3 (extraction time; t, min); plot (C), covariation of X2 and X3.
Horticulturae 10 00564 g001
Figure 2. Pareto plots of transformed estimates for TPC (A), TAC (B), FRAP (C), DPPH (D), and AAC (E) assays. A gold reference line is drawn on the plot to indicate the significance level (p < 0.05). Positive values are shown by blue bars, and negative values are shown by red bars.
Horticulturae 10 00564 g002
Figure 3. Exemplary HPLC chromatogram at 280 and 320 nm of CΜ fruit optimal extract demonstrating polyphenolic compounds that were identified. 1: neochlorogenic acid. 2: catechin. 3: chlorogenic acid; 4: vanillic acid; 5: epicatechin; 6: p-coumaric acid; 7: ferulic acid; 8: quercetin 3-D-galactoside; 9: kaempferol-3-glucoside.
Horticulturae 10 00564 g003
Figure 4. Principal component analysis (PCA) for the measured variables. Each X variable is presented with a blue color.
Horticulturae 10 00564 g004
Figure 5. Partial least squares (PLS) prediction profiler of each variable and desirability function with extrapolation control for the optimization of CΜ fruit extracts are shown in plot (A), while the Variable Importance Plot (VIP) option graph with the VIP values for each predictor variable is shown in plot (B). The VIP scores are also displayed in the VIT. A red dashed line in the plot (or a blue line in the VIT) at 0.8 indicates the significance level of each variable.
Horticulturae 10 00564 g005
Table 1. The actual and coded levels of the independent variables were used to optimize the process.
Independent VariablesCoded UnitsCoded Levels
−101
C (%, v/v)X1050100
T (°C)X2205080
t (min)X3306090
Table 2. Experimental findings for the three independent variables under investigation and the dependent variable’s responses.
Design PointIndependent VariablesResponses
X1 (C, %)X2 (T, °C)X3 (t, min)TPC 1TAC 2FRAP 3DPPH 4AAC 5
10 (50)0 (50)0 (60)55.5949.00415.95235.59854.73
20 (50)0 (50)0 (60)55.2646.79383.68254.80859.77
30 (50)−1 (20)−1 (30)48.5345.91389.45264.50735.72
4−1 (0)0 (50)−1 (30)24.8237.3090.5678.79378.74
51 (100)−1 (20)0 (60)18.4024.17168.7576.24493.46
61 (100)0 (50)−1 (30)24.1230.74193.9077.29590.51
70 (50)1 (80)−1 (30)47.4346.08337.08241.53942.35
80 (50)0 (50)0 (60)54.3649.07401.13259.24932.88
9−1 (0)0 (50)1 (90)15.427.8288.2966.05621.91
101 (100)1 (80)0 (60)30.0645.66240.28126.43665.90
110 (50)−1 (20)1 (90)40.0945.65275.60218.60754.22
121 (100)0 (50)1 (90)21.5538.85152.64106.43702.59
130 (50)1 (80)1 (90)49.8351.83389.63270.261053.28
14−1 (0)−1 (20)0 (60)10.9126.6249.2447.82213.69
15−1 (0)1 (80)0 (60)38.1515.69196.79168.90840.64
1 Total polyphenol content (TPC) in mg GAE/g dw. 2 Total anthocyanin content (TAC) in μg CyE/g dw. 3 Ferric reducing antioxidant power (FRAP) in μmol AAE/g dw. 4 2,2-Diphenyl-1-picrylhydrazyl (DPPH) in μmol AAE/g dw. 5 Ascorbic acid content (AAC) in mg/100 g dw.
Table 3. Mathematical models created using RSM were used to optimize the extraction of CM fruits. The models contained only significant terms.
ResponsesSecond-Order Polynomial Equations (Models)R2
Predicted
R2
Adjusted
p-ValueEq.
TPCY = −3.74 + 1.19X1 + 0.46X2 + 0.48X3 − 0.01X12 − 0.003X22 − 0.006X32 − 0.003X1X2 + 0.001X1X3 + 0.003X2X30.96410.89960.0041(7)
TACY = 57.35 + 0.26X1 − 0.21X2 − 0.44X3 − 0.008X12 − 0.001X22 − 0.001X32 + 0.005X1X2 + 0.006X1X3 + 0.002X2X30.96180.89300.0048(8)
FRAPY = −9.5 + 10.91X1 + 0.14X2 + 3.23X3 − 0.09X12 − 0.01X22 − 0.05X32 − 0.01X1X2 − 0.007X1X3 + 0.05X2X30.98400.95530.0006(9)
DPPHY = 85.31 + 6.47X1 − 1.02X2 + 0.2X3 − 0.06X12 + 0.01X22 − 0.01X32 − 0.01X1X2 + 0.01X1X3 + 0.02X2X30.96750.90900.0033(10)
AACY = −76.96 + 18.63X1 + 9.41X2 + 1.23X3 − 0.13X12 − 0.02X22 + 0.005X32 − 0.08X1X2 − 0.02X1X3 + 0.03X2X30.96430.90020.0041(11)
Table 4. Maximum predicted responses and optimum extraction conditions for the dependent variables.
ResponsesOptimal Conditions
Maximum Predicted ResponseC (%, v/v)T (°C)t (min)
TPC (mg GAE/g dw)58.21 ± 8.07458060
TAC (μg CyE/g dw)55.47 ± 9.28758085
FRAP (μmol AAE/g dw)430.19 ± 44.46508070
DPPH (μmol AAE/g dw)292.72 ± 46.39508080
AAC (mg/100 g dw)1115.15 ± 148.12408087
Table 5. Polyphenolic compounds under optimal extraction conditions (X1: 58, X2: 80, and X3: 90).
Polyphenolic CompoundOptimal Extract (mg/g dw)
Neochlorogenic acid1.41 ± 0.04
Catechin1.21 ± 0.04
Chlorogenic acid1.35 ± 0.07
Vanillic acid7.19 ± 0.47
Epicatechin11.68 ± 0.34
p-Coumaric acid0.73 ± 0.04
Ferulic acid0.4 ± 0.01
Quercetin 3-D-galactoside6.24 ± 0.38
Kaempferol-3-glucoside0.77 ± 0.03
Total identified30.98 ± 1.42
Table 6. Validation parameters of HPLC analysis under optimal extraction conditions (X1: 58, X2: 80, and X3: 90).
Polyphenolic CompoundRetention Time (min)Absorbance
Maximum (nm)
EquationR2
Neochlorogenic acid16.576324y = 28,213.51x + 551.720.9987
Catechin20.977278y = 11,920.79x − 128.190.9973
Chlorogenic acid21.965325y = 50,320.40x − 23,038.360.9943
Vanillic acid24.041270y = 20,000x + 12240.9939
Epicatechin25.921278y = 142,099x + 4705.940.9999
p-Coumaric acid30.002309y = 120,568.59x + 1059.0430.9998
Ferulic acid33.931322y = 108,553.73x − 25,916.430.9992
Quercetin-3-D-galactoside34.998257y = 41,489.69x − 35,577.550.9934
Kaempferol-3-glucoside38.468265y = 50,916.85x − 42,398.830.9962
Table 7. Multivariate correlation analysis of measured variables.
ResponsesTPCTACFRAPDPPHAAC
TPC-0.73740.96120.97180.8468
TAC -0.78420.75480.5452
FRAP -0.95440.8370
DPPH -0.8529
AAC -
Table 8. Maximum desirability for all variables using the partial least squares (PLS) prediction profiler under the optimal extraction conditions (X1: 58, X2: 80, and X3: 90).
VariablesPLS Model ValuesExperimental Values
TPC (mg GAE/g dw)53.3745.9 ± 1.04
TAC (μg CyE/g dw)52.5553.62 ± 6.8
FRAP (μmol AAE/g dw)398.7360.7 ± 14.71
DPPH (μmol AAE/g dw)286.17291.67 ± 10.81
AAC (mg/100 g dw)1096.58912.65 ± 8.72
Disclaimer/Publisher’s Note: The statements, opinions and data contained in all publications are solely those of the individual author(s) and contributor(s) and not of MDPI and/or the editor(s). MDPI and/or the editor(s) disclaim responsibility for any injury to people or property resulting from any ideas, methods, instructions or products referred to in the content.