Abstract
The present study was carried out to evaluate and characterize, for the first time, the genetic potential of a collection of onion (Allium cepa L.) local accessions from the arid region of southern Tunisia. The genetic diversity among 135 onion individuals, belonging to 23 accessions, was evaluated using microsatellite (SSR) markers and phenotypic information. A total of 35 alleles were generated with 11 SSRs. The polymorphic information content (PIC) value ranged from 0.08 to 0.95, with an average PIC of 0.43. The expected heterozygosity averaged 0.37, and the observed heterozygosity averaged 0.42. The analysis of molecular variance (AMOVA) revealed that 79% of genetic variation existed within individuals. Structure and cluster analysis grouped the accessions into two major clusters: landraces and pre-breeding lines. For the phenotypic traits evaluated, field trials were conducted in two different environments. Significant differences among accessions were shown, and for most traits, there was also a significant environmental effect and a significant interaction between environment and accession. Great variability was found for all the traits that could be exploited to create new varieties of onion adapted to local conditions by selecting appropriate parents in hybridization breeding.
1. Introduction
Onion (Allium cepa L.) is a diploid (2n = 2x = 16) bulb crop that belongs to the Alliaceae family. It is grown worldwide; hence, onion ranks second as the principal vegetable crop after tomatoes, with an annual production of 100 million tons of dry bulbs [1]. The onion bulb is highly nutritious and rich in flavonoids, such as quercetin, anthocyanins, fructo-oligosaccharides, and organosulphur compounds [2]. Additionally, onions are specifically rich in two chemical groups that have benefits for human health: flavonoids and alkenyl-cysteine sulfoxides (ACSO) [3], which provide nutritional benefits and health-promoting properties for human health such as anti-allergic effects [4], anti-cancerous activity [2], cardiovascular support [5], and antiplatelet actions [6].
The long history of onion cultivation and its ability to adapt to different environments have resulted in onions exhibiting great variation in bulb characteristics such as color, shape, size, flavor, and biochemical composition [6]. To characterize the wide genetic diversity of onion genetic resources and thus be able to select the best parents to develop new onion hybrids, breeders traditionally used morphological or biochemical markers. However, these markers are limited in number and are influenced by the environment, agronomic practices, and variable expressivity [7]. In this regard, molecular markers have helped to overcome those problems and stand out due to their robustness, high polymorphism potential, and stability to environmental changes. These markers allow the assessment of genetic diversity based on various parameters, such as allele richness and heterozygosity. Co-dominant simple sequence repeat (SSR) or microsatellite markers are among the most common genetic markers used for the assessment of genetic diversity in vegetable collections [8,9,10]. SSR markers, developed from genomic regions and expressed sequence tag (EST)-SSR markers, which represent coding regions of the genome, have been useful tools for the characterization of genetic diversity in onion pre-breeding programs [11,12,13,14]. Nevertheless, the combination of both morphological traits as well as molecular markers is the best approach to exploring genetic diversity as they can provide complementary information, which has already been shown in several plant species [8,15,16,17,18,19].
The diversity of Tunisian onion germplasm has scarcely been explored, and only a few studies have been reported regarding the biochemical characterization of some onion landraces [20]. The importance of Tunisian genetic resources as a valuable genetic reservoir was demonstrated in several crops [21,22,23,24,25]. Therefore, both the conservation and characterization of these materials are challenges to maintaining and protecting biodiversity. Landraces are a very important source of genetic diversity, constituting an essential genetic resource for plant breeders [22,26,27,28]. They contain genes that have been selected by farmers or by nature based on their adaptation, productivity, or resistance to different stresses [22,27]. These genes constitute an important gene pool to promote the breeding of new cultivars suitable for low-input conditions. Therefore, the conservation of onion landraces is crucial to maintaining the extant natural genetic diversity of the Allium species, and their characterization will facilitate the selection of landraces with relevant traits for cultivation in sustainable agri-food systems.
In this sense, to preserve Tunisian genetic resources, collections of open-pollinated onion landraces were conducted in the southern region of the country, an area of traditional cultivation in the arid zone, for their conservation and valorization [20]. In order to give a sustainable output to these landraces, previous work of characterization, selection, and improvement of this collected material is necessary. Thus, in the present study, the genetic diversity and structure of a Tunisian onion collection have been assessed using SSR molecular markers and phenotypic traits, revealing the genetic diversity available. Characterization of the genetic variability will be a first step towards understanding the diversity pattern of the onion landraces in Tunisia and the selection of appropriate parents in future breeding studies.
2. Materials and Methods
2.1. Plant Material
A collection of 23 onion accessions was used in this study (Table 1, Figure 1). Among these accessions, 19 were landraces collected from Tunisian farmers in the south of the country during 2015–2017, and four were pre-breeding lines selected from accessions of the UK Vegetable Genebank as having a good aptitude for postharvest conservation by Dr. Rafika Sta-Baba at the Regional Research Centre on Horticulture and Organic Agriculture (CRRHAB, Chott-Mariem, Tunisia). Most of these accessions have been previously characterized by using physico-chemical traits [20].

Table 1.
Onion (Allium cepa L.) accessions used in the study.
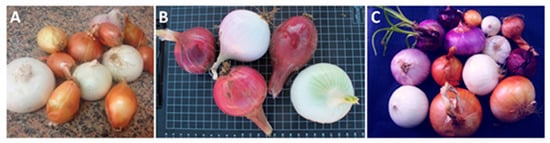
Figure 1.
Diversity of the onion bulb color and shape wise of some accessions used in this study. (A) The pre-breeding lines Acce-10, Acce-15, Acce-16, and Acce-17; (B) Local onion landraces; Acce-7, Acce-8, and Acce-19 with red color, Acce-6 and Acc-11 with white color; (C) Overview of the diversity observed in the landraces collected from the Arid region of Tunisia.
2.2. DNA Extraction and SSR Genotyping
Fresh young leaves (0.05 g) from 30–45-day-old seedlings from onion accessions were used for the extraction of genomic DNA using a modified CTAB method [29]. The purity and quantity of DNA were evaluated using a NanoDropTM ND-10000 spectrophotometer (Thermo Fisher Scientific, Wilmington, DE, USA). DNA working dilutions (10 ng/μL) were prepared and stored at −20 °C until PCR analysis. Five to seven individuals per accession were randomly sampled for molecular characterization except for Acce-19, Acce-20, Acce-21, Acce-22, and Acce-23, of which only three individuals were used since they did not germinate well.
A set of 11 EST-SSR markers, previously proven to be highly performant for genetic onion characterization [12,30], was used to assess the genetic diversity among accessions in our collection. PCR amplification reactions were carried out according to Mallor et al. [12]: a total volume of 20 µL contained 12.5 ng genomic DNA, 1 × reaction buffer (20 mM Tris-HCl pH 8.4 + 50 mM KCl), 2 mM MgCl2, 65 µM of each dNTP (Invitrogen, Carlsbad, CA, USA), 0.2 U of Taq DNA polymerase (Invitrogen), 0.0625 µM forward primer contain an M13 tail (18-bp) at its 5′ end, 0.25 µM of each reverse, and labeled M13-forward primer (5′-CACGACGTTGTAAAACGAC-3′). The four fluorescent dyes used were 6-FAM, VIC, PET, or NED (Applied Biosystems, Foster City, CA, USA). Conditions of the amplification reactions were: 94 °C (5 min)/4 cycles of 94 °C (30 s), 62 °C (45 s with each cycle and the annealing temperature decreasing 1 °C), and 72 °C (45)/followed by 35 cycles of 94 °C (30 s), 58 °C (45 s), 72 °C (45 s), and a final extension step at 72 °C for 10 min. Amplified fragments were separated by automatic capillary electrophoresis on an ABI 3130XL Genetic Analyzer (Applied Biosystems, Foster City, CA, USA). The raw data produced was analyzed using Peak Scanner software (Applied Biosystems), and fragment size was scored in base pairs (bp).
2.3. Molecular Data Analysis
Microsatellite fragments were scored as the presence (1) versus absence (0) of a specific allele, and the data were transformed into a biallelic matrix using allele size. For EST-SSR data, the genetic indices, such as the number of alleles per locus (N), the major allele frequency (MAF), the number of genotypes per locus (G), heterozygosity observed (Ho), heterozygosity expected (He), Shannon’s information index (I), fixation index (F = He − Ho/He), and the inbreeding coefficient, were performed using GenAlEx software version 6.5 [31,32]. The informativeness of the SSR markers was measured by the polymorphism information content (PIC), which was calculated as follows [33]: PIC = 1 − (∑Pi2), where Pi is the frequency of the ith allele in the set of onion accessions.
The software NTSYSpc v.2.1 [34] was used to estimate the genetic distances between accessions based on the Simple Matching (SM) coefficient. The resulting matrix served as input data for the cluster analysis using an unweighted pair-group method of averages (UPGMA) to generate a dendrogram. Moreover, analysis of the molecular variance (AMOVA) was used to partition the genetic variation into inter- and intra-gene pool diversities in the onion collection using GenAlEx program version 6.5 with 1000 permutations.
To provide the most reliable grouping of the onion accessions, the data were processed using the STRUCTURE program version 2.3.4 [35]. The number of sup-populations was estimated by 20 independent runs for each K (from 1 to 20) applying a Bayesian method, 100,000 burn-in periods and 100,000 Markov Chain Monte Carlo (MCMC) repetitions under the admixture model and independent allele frequencies among populations. The means of the log-likelihood estimates for each K were calculated. The most likely K value was determined by implementing the ΔK method, described by Evanno et al. [36], using the web-based program STRUCTURE HARVESTER [37].
2.4. Phenotypic Evaluation
Phenotypic differences among the accessions were also determined. For that, 19 accessions (from Acce-1 to Acce-19) were grown in two different regions: Gabes; an oasis region (Latitude 33°53′29″ N, Longitude 9°47′46″ E and Altitude 64 m) in the arid environment of south Tunisia; and Sahline station, Monastir (Latitude 35°45′ N, Longitude 10°48′ W and Altitude 10 m) near the coast, in the Centre-east Tunisia of semi-arid climate.
Sowing of the onion seeds started in mid-October under normal daylight greenhouse conditions. Later, the onion seedlings were transplanted to the field in mid-January, and the harvest took place from May to August. Onions were lifted by hand when 75% of the foliage on each plot had collapsed. The experimental design was a randomized complete block design with three replications. The agricultural practices (irrigation, fertilization, and maintenance) were the same for all the plots in the same location and were according to the crop husbandry practices of Tunisian farmers, which were as follows: irrigation was applied twice a week until bulbing began, then reduced to once a week until maturity; during cultivation, mineral fertilizers (85 kg ha−1 Ammonite, 70 kg P2O5 ha−1, 130 kg KNO3) were applied; and weeds were removed manually every two weeks.
At harvest, the following measurements were recorded on 10 random bulbs per accession and each location: diameter (cm) in two directions using a caliper; the fresh weight (g) of the bulbs; scales number; and thickness of neck (cm). Bulb color and shape were determined visually according to the International Union for the Protection of New Varieties of Plants (UPOV) descriptors. A sample of 100 g of each bulb was dried in a convection oven at 80 °C for at least 48 h until a constant weight was reached, and dry weight (g) and dry matter content (%) were determined as the ratio between dry weight and fresh weight.
2.5. Phenotypic Data Analyses
All quantitative traits were subjected to analysis of variance (ANOVA) using the generalized linear model (GLM) implemented in IBM SPSS Statistics, version 20.0 (IBM Corp., Armonk, NY, USA) to determine the differences among the studied accessions. Means were compared using Tukey’s test at the 0.05 level of significance. A two-factorial linear model was used to determine the effects of genotype (G), environment (E), and their interaction (G × E) on trait performance. Pearson correlation analysis was also carried out to estimate the relationship between all phenotypic traits using SPSS v20.0. Besides, the phenotypic, genotypic, and environmental variances, heritability, and coefficient of variation were estimated by using the following equations [38]:
where GMS is the genotypic mean square, EMS is the error mean square, and R is the number of replications.
Genotypic variance: σ2g = (GMS − EMS)/R,
Environmental variance: σ2e = EMS,
Phenotypic variance: σ2p = σ2g + σ2e,
Broad-sense heritability estimates: H2 = σ2g/σ2p × 100,
Genotypic coefficient of variation: GCV = √σ2g/X̅ × 100,
Phenotypic coefficient of variation: PCV = √σ2p/X̅ × 100,
The expected genetic advance (GA) was calculated as suggested by Johnson et al. [39,40]. GA = k.H2.P, where k = 2.06 at 5% selection intensity or k = 1.76 at 10% selection intensity, and P is the phenotypic standard deviation of the trait.
To measure the goodness of fit for the phenotypic and molecular analyses, cophenetic correlation coefficient values between the dendrogram and the original distance matrix were estimated from the phenotypic and SSR markers using a Mantel test procedure [41]. The correlation between phenotypic traits and SSR markers was also tested using the same procedure.
3. Results
3.1. SSR Analysis
The set of 11 selected SSRs revealed that all markers were polymorphic and informative for describing the genotypic variation of 23 onion accessions, except ACM124 (which was monomorphic) (Table 2). Three markers (ACM045, ACM134, and ACM187) were dinucleotide SSRs, five were trinucleotides (ACM004, ACM006, ACL101, ACM146, ACM119) and three were tetranucleotides. The amplicon size of loci across onion accessions varied from 194 (ACM134) to 299 bp (ACM235). A total of 35 alleles were amplified, with an average of 3.5 alleles per locus. The EST-SSR markers ACM235, ACM146, and AMCT119 detected the lowest number of 2 alleles, whereas ACM006, ACM045, and ACM187 displayed the highest number of 5 alleles. The major allele frequency ranged from 0.15 (ACM134) to 0.89 (ACM235) (Table 2). Three specific alleles were detected: allele 211 (ACM006), allele 229 (ACM235), and allele 259 (ACM187), being specific to Acce-1, Acce-2, and Acce-13, respectively (Table S2).
Table 2.
Characteristics of the 11 SSR markers used for the genetic diversity analysis of onion accessions.
The polymorphism information content (PIC) was used to estimate the discriminatory power of loci. The PIC value of the 10 EST-SSRs ranged from 0.08 (ACM235) to 0.95 (ACM134), with an average of 0.43. Two EST-SSRs (ACM045 and ACM134) showed the highest PIC values, showing a PIC value > 0.8, making them the best markers for examining the genetic diversity among individuals and for genetic mapping.
3.2. Genetic Diversity
The observed heterozygosity (Ho) ranged between 0.10 (ACM045), and 0.87 (ACM146) with an average of 0.42 being higher than expected heterozygosity (He = 0.37). The high level of heterozygosity within accessions is confirmed by a negative inbreeding coefficient (Fis), with a mean value of −0.06. Shannon’s Information Index (I) was between 0.35 (ACM134) and 0.84 (ACM138), with an average of 0.59 (Table 3).
Table 3.
Genetic features of the polymorphic SSRs used for the assessment of genetic diversity in 23 onion accessions.
Cluster analysis revealed that the 23 accessions were assorted into two major groups (Figure 2). Cluster I (CL1) was the largest, comprising the 19 accessions of landraces collected from local farmers in South Tunisia. The second cluster (CL2) was formed by the four pre-breeding lines selected during several years at the CRRHAB and which have an exotic origin.
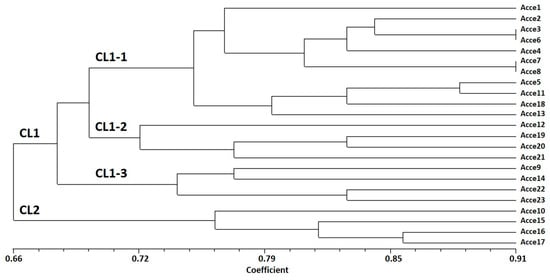
Figure 2.
Dendrogram of the Tunisian onion accessions studied by EST-SSR markers, based on UPGMA analysis using the simple matching coefficient.
CL1 was further subdivided into three sub-clusters (CL1-1, CL1-2, and CL1-3), which were not completely according to their geographical site of collection. CL1-1 contained 11 accessions characterized by a red bulb color for the majority of the accessions, except for Acce-1, Acce-5, Acce-6, and Acce-11, which have white bulb colors, respectively. CL1-2 grouped 4 accessions, characterized mostly by circular bulb shapes, and CL1-3 grouped 4 accessions collected from Gabes-Oasis, which have a different microclimate from the collection site.
3.3. Population Structure
For population genetic structure analysis, the Bayesian clustering model was performed using genotyping data generated according to the 10 polymorphic EST-SSR markers. According to the clustering model, an Evanno test was performed and yielded K = 2 as the highest log-likelihood, suggesting the existence of two major groups (subpopulations) in the collection (Figure 3a,b), as previously revealed by the molecular cluster analysis.
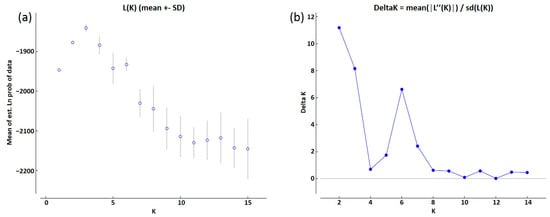
Figure 3.
Estimation of the optimum number of clusters for onion accessions according to Evanno’s method. (a) Log-likelihood (LnP(D)) for each K value; (b) ΔK for each K value.
Accessions were assigned to a group when they showed a membership higher than 0.7 in that particular group. Hence, at K = 2, 46 individuals (34%) were clustered in subpopulation I, whereas subpopulation II consisted of 37 individuals (27%), showing that they were strongly assigned to each subpopulation. The remaining individuals (39%) with membership lower than 0.7 revealed an admixture structure (Figure 4).
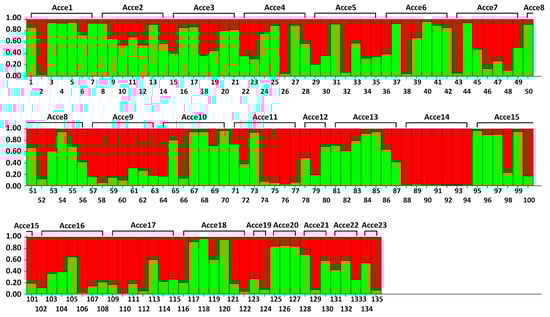
Figure 4.
Population structure of 135 onion individuals (belonging to 23 accessions). The corresponding membership probability is presented on the vertical axis. Vertical bars represent each individual analyzed in this study. Red color is allocated to population 1 and green color is allocated to population 2.
The 19 collected Tunisian onion landraces were divided into five groups according to the sampling locations (Tozeur, Kebili, Gafsa, Gabes, and Sidi Bouzid) (Figure 5). For each group, the mean of the membership coefficient (Q) of the two subpopulations, detected by structure analysis, was calculated. Subpopulation 1 (in green) was more abundant in onion samples collected in Gafsa, Sidi Bouzid (both > 60%), and Kebili (nearly 60%). The genetic structure of the samples collected in the Tozeur and Gabes locations is almost equally distributed between the two subpopulations.
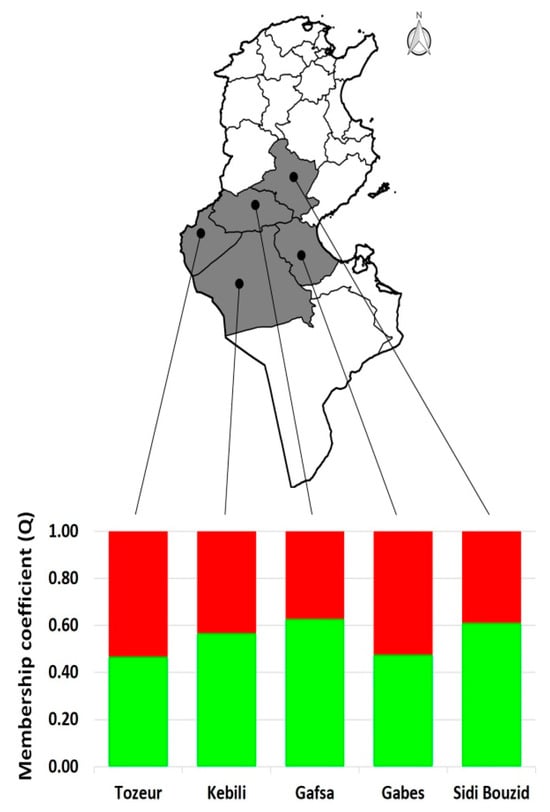
Figure 5.
Tunisia map with the population structure found in the five sampled areas. The membership coefficient (Q) mean of the local onion landraces is split according to each sampled location.
3.4. AMOVA Analysis
Analysis of molecular variance (AMOVA) showed a high proportion of variation within populations (79%), whereas there was 21% genetic variation among populations (Table 4). Genetic differentiation (FST) among the populations ranged from 0.063 to 0.398 (Supplementary Table S1), with the highest (FST = 0.398) being observed between the landraces Acce-12 and Acce-14 and the lowest (FST = 0.063) between the pre-breeding line Acce-16 and the landrace Acce-18.
Table 4.
Analysis of molecular variance of onion accessions.
3.5. Phenotypic Diversity
Significant differences (p < 0.05) were observed among accessions for all the evaluated traits: bulb diameter (4.8–9.5 cm), fresh weight (57.7–409.6 g), DMC (6.8–13.5%), number of scales (6.7–13.0), and neck thickness (0.14–2.33) (Supplementary Tables S3 and S4). The evaluated phenotypic traits varied according to the accessions and the location (Table 5).
Table 5.
Morphological and quality features of the onion accessions by region.
The response of the accessions for all the phenotypic traits evaluated differs significantly between environments, and the two-way ANOVA revealed a G × E effect (Table 6).
Table 6.
Analysis of variance for effects of the onion accession (G), region of evaluation (E), and their interaction (G × E) on the different morphological and quality features.
The results of phenotypic, genotypic, and environmental variances, as well as phenotypic and genotypic coefficients of variation for location 1 and location 2 (Table 7) showed, for the two locations, that the PCV values exceeded the GCV values and the estimated heritability was high for all traits. An estimate of heritability is essential for applying an optimum breeding strategy. The genetic advance was the highest for fresh weight.
Table 7.
Estimates of genetic parameters (variance components, genetic variation, heritability, and genetic advance) for quantitative traits in onion bulbs were evaluated at Location 1 (Gabes Oasis) and Location 2 (Sahline Station).
3.6. Phenotypic Correlation
A highly positive correlation occurred between the onion bulb diameter (BD) and fresh weight (FW) (r = 0.874 **) and between the neck thickness (NT) and fresh weight (FW) (0.811 **). Moderately positive correlations occurred between the scale number and the fresh weight (r = 0.477 **) and the bulb diameter (r = 0.460 **). The dry matter content (DMC) was strongly correlated with onion fresh weight (FW) (r = 0.731 **) and BD (r = 0.782 **) and moderately correlated with neck thickness (NT) (r = 0.458 *) and scale number (SN) (r = 0.511 *).
3.7. Genotypic and Phenotypic Correlation
The cophenetic correlation coefficient value between the dendrogram and the original distance matrix estimated from the phenotypic and SSR markers was rmorph = 0.83 and rSSR = 0.34, respectively, indicating a good fit for both data. A negative and non-significant correlation between phenotypic traits and molecular markers (r = −0.12, p = 0.10) was found, confirming the discrepancy between morphological variation and genetic polymorphism.
4. Discussion
Landraces are a valuable source of genes of interest, in particular genes for disease resistance, adaptation to abiotic stresses, and quality. The genetic diversity that landraces exhibit is very high due to factors such as the biotic and abiotic stresses to which they have been subjected or some practices exercised by farmers that have favored the maintenance and increase of this variability. Thus, for suitable exploitation and valorization of this material in breeding programs to increase production, disease resistance, or crop quality, evaluation and characterization are necessary. Our study represents the first report on the analysis of the genetic diversity of a group of Tunisian Allium cepa landraces using microsatellite markers and phenotypic traits to facilitate its use in onion breeding programs.
In A. cepa, SSR markers have been developed from genomic regions [14] and expressed sequence tag (EST) [42], and they have been proven to be reproducible for cultivar discrimination and mapping [43,44,45]. The EST-SSR markers used in our study have been a useful tool in distinguishing all onion landraces, showing a wide genetic diversity of the landraces from the arid region of Tunisia. A total of 35 alleles were generated with 11 EST-SSRs, of which 10 were polymorphic. The percentage of polymorphic loci was 90.91%, which was slightly lower than the 94.2% observed by Rivera et al. [11] but higher than those reported in other onion collections from Brazil, India, or Spain evaluated with a comparable set of markers [12,46,47], although this could be due to the volume, type, and origin of the used accessions.
The PIC values oscillated between 0.17 and 0.95. This was higher than that observed for tropical Indian onions (0.0–0.77) [46], but comparable to that reported in the collection of Spanish landraces (0.0–0.89) [12]. The PIC value gives information on the relative ability of the marker to detect genetic variability between accessions. Most of the EST-SSR markers used in this study revealed a value of 0.43, which represented a moderate discriminatory power, similar to that reported by Raj et al. [15] in a collection of 20 onion genotypes, including released varieties and landraces. It should be noted that two molecular markers, ACM045 and ACM134, had PIC values > 0.9, which were superior to those found (0.69 and 0.72, respectively) in a previous diversity study of 85 onion landraces from Spain [12].
The number of alleles in our onion collection ranged from 2 to 5, with an average of 3.5 alleles per locus, slightly lower than the 3.9 alleles reported in the Spanish onion collection [12]. The observed heterozygosity was higher (Ho = 0.42) than the expected heterozygosity (He = 0.37), which revealed an excess of heterozygosity and indicated a high genetic diversity, as confirmed by the negative value of the fixation index (Fis = −0.06). Indeed, the degree of diversity, expressed as the frequency of heterozygotes, found in our onion accessions was comparable to that reported in tropical Brazilian onions [47] and agreed with the one observed by Simó et al. [48] in Spanish accessions. Besides, the pairwise FST comparisons showed that the highest (FST = 0.398) was observed between the landraces Acce-12 and Acce-14 and the lowest (FST = 0.063) between the pre-breeding line Acce-16 and the landrace Acce-18. If FST is small, it means that allele frequencies within each population are very similar; if it is large, it means that allele frequencies are very different. A low level of genetic differentiation among onions may be caused by high gene flow, and a high degree of gene flow can increase genetic diversity [48]. The presence of specific alleles, detected in three onion landraces (Acce-1, Acce-2, and Acce-13) in our study, might be of adaptive significance, and hence capture and preservation of these specific alleles and genotypes is an important objective of any conservation strategy [12,49].
STRUCTURE and SM tree analyses based on EST-SSR markers showed that landraces and pre-breeding lines were separated into two different clusters based on the accession type and did not reveal any specific features based on bulb shape or dry matter content. All landraces from the arid region of southern Tunisia were grouped in the CL1 cluster, whereas pre-breeding lines were clustered together in CL2. Additionally, it should be noted that some landraces from the same geographical locations as Gabes Oasis were closely sub-grouped in CL1-3, suggesting that these landraces probably have a common genetic base.
The results of the AMOVA revealed that most of the variation could be attributed to the differences within populations (79%). Although high variation within populations is commonly expected for collections of open-pollinated onions, the results obtained are in contrast with those found by Brahimi et al. [16], who reported that most of the marker variation was due to the differences among onion populations in Morroco (58%). However, Kumar et al. [50] reported, in garlic genetic diversity, that 84% of the variation was attributed to intra-population and only 16% to variation among populations.
Regarding the phenotypic traits evaluated, field trials were conducted in two different environments. The phenotypic characterization showed significant differences among accessions, and for most traits, there was also a significant environmental effect and a significant interaction between environment and accession (G × E). The strong influence of the environment on phenotype was also reported by Brahimi et al. [16].
The quality of an onion bulb is determined by color (anthocyanin and flavonoid content), firmness, number of scales, number of growing points, neck thickness, total soluble solids (TSS), pungency, and antioxidants [51]. It has been observed that dry matter (DMC), TSS, and pungency are positively correlated and show moderate to high heritability, which allows simultaneous improvement through selection for these traits [51]. In our study, significant differences in DMC contents were especially observed among the studied onion accessions. DMC ranged from a minimum of 6.88% to a maximum of 13.50% in Location-1 and between 8.43% and 12.95% in Location-2; these values are in accordance with those reported previously (7.26–12.93%) by Sharma et al. [52]. DMC, consisting mostly of fiber, starch, and sugars [53], is an important quality factor commonly estimated indirectly as TSS by a refractometer. DMC determines, in part, the storage life, pungency, and firmness [54]. DMC and TSS may be indicators of good storage [53]. Indeed, many authors affirmed that the length of a healthy storage period was correlated with bulb dry matter content. Onion bulbs with high dry matter content are more suitable for long-term storage and tend to contain higher concentrations of fructans [53,54].
We reported herein that PCV values were slightly higher than the GCV values, demonstrating an environmental influence on the evaluated traits. Similar results have been reported [55,56], showing that the genetic coefficient of variation together with heritability estimates would give the best indication of the amount of advance to be expected from selection. Indeed, an estimate of heritability is essential for applying an optimum breeding strategy. Dabholkar [57] reported that heritability estimates are classified as low (below 30%), medium (31–60%), and high (above 60%). In the present study, most of the traits had high heritability (ranging between 48% and 85.4% in Location-1 and between 97.06 and 99.95% in Location-2) with moderate-to-high genetic advance (GA). Thus, the selection of individuals showing interesting characteristics could be possible in the studied material.
The genetic advance was the highest for fresh weight, and the high heritability reflected the predominance of additive gene action for the expression of this trait. Therefore, selection based on this trait could predict the performance of the progenies. High heritability estimates and high genetic advance are usually more helpful in predicting gain under selection than heritability estimates alone [56]. Therefore, there could be a better chance for improvement of the above trait with the relatively highest value of the genotypic coefficient of variation. Bulb diameter, weight, and shape are the major determinants of onion yield. Khosa et al. [51] reported that moderate to high heritability of shape and low to moderate diameter and weight are responsible for slow progress in increasing bulb yield. However, McCallum [58] stated that further development of F1 hybrids in onion should improve the pace of productivity gains. Large yield improvements have been achieved through heterosis breeding since the discovery of cytoplasmic-genic male sterility (CMS) [59]. This great variability in all the traits is important to exploit to create new varieties of onion adapted to local conditions. Indeed, the genetic coefficient of variation, together with heritability estimates, showed the advance to be expected from selection in this material.
A comparison of the phenotypic and molecular data in our study demonstrated the discordance between the two data sets, revealed by the negative correlation exhibited by the Mantel test. Inconsistences between phenotypic and genotypic data were also reported in other vegetable species [8,17,19]. Molecular analysis is independent of environmental effects and can provide additional and precise information for (i) the assessment of genetic diversity within and among landraces; (ii) the population structure; (iii) the level of fixation or heterozygosis; (iv) the establishment of genetic profiles, avoiding redundancy and allowing improved management of global resources [28,60]. However, both types of markers are complementary and important for increasing the precision and efficiency of breeding new, potentially valuable cultivars by accelerating the selection process, helping to determine the level of variation, and selecting parental lines in breeding programs. Undoubtedly, the combination of both morphological and molecular approaches will result in more reliable and accurate conclusions than any singular characterization [8,18,19].
Given the genetic diversity of the Tunisian germplasm from the arid region, it would also be worth screening this material for resistance against the main pathogens affecting this crop. The phenotypic and molecular analyses performed in this study provide valuable information for increasing germplasm use and onion breeding programs.
5. Conclusions
This study added further information about the intra- and inter-variation among local onion accessions in the Arid region of Tunisia, showing the great diversity in this germplasm, mostly attributed to the differences within populations. Both molecular and morphological features have been useful, showing different clusters based on the accession type (pre-breeding or local) and significant differences among accessions for bulb diameter, fresh weight, DMC content, number of scales, and neck thickness, possibly resulting from their adaptation and the selection they have been subjected to by farmers. The findings of the present study will facilitate the selection process and can be used for the conservation and management of onion genetic resources for further breeding programs. Landraces with agronomical performance and private alleles can potentially constitute a valuable gene pool for onion breeding.
Supplementary Materials
The following supporting information can be downloaded at: https://www.mdpi.com/article/10.3390/horticulturae9101098/s1, Supplementary file S1 with Tables S1–S4; Table S1: Results of Pairwise Population Fst Analysis; Table S2: Diversity parameters for the different onion accessions; Table S3: Morphological and quality features of the studied onion genotypes, field experiment done at the arid region of South-Tunisia (Gabes oasis); Table S4: Morphological and quality features of the studied onion genotypes, field experiment done at the semi-arid region of Centre-East Tunisia (Sahline station).
Author Contributions
Conceptualization, H.C.-R. and A.G.-C.; methodology, H.C.-R. and A.G.-C.; formal analysis, A.C., H.C.-R., N.M., A.S., O.F. and A.G.-C.; results validation, H.C.-R., A.S. and N.M.; writing—original draft preparation, H.C.-R.; writing—review and editing, H.C.-R., N.M., A.S., A.C., O.F., M.S.B.-K. and A.G.-C. All authors have read and agreed to the published version of the manuscript.
Funding
This research was funded in part by Research laboratory LR21AGR03-Production and Protection for a Sustainable Horticulture, funded by the Ministry of Higher Education and Scientific Research of Tunisia and partially financed by the A11-20R project funded by the Aragon Government and by the AGROALNEXT program supported by MCIN with funding from European Union NextGenerationEU (PRTR-C17.I1).
Data Availability Statement
All data are displayed in the manuscript and Supplementary Files.
Acknowledgments
The authors are thankful to Rafika Sta-Baba for providing seeds of the onion pre-breeding lines and to Mohamed Ferjani for his help in the field experiment at Sahline station. A.C acknowledges a fellowship of two months, provided by the Ministry of Higher Education and Scientific Research of Tunisia (MESRST), for training in CITA-Spain.
Conflicts of Interest
The authors declare no conflict of interest.
References
- FAO; STAT. Food and Agriculture Organization of the United Nations-FAO Statistics Division. 2019. Available online: http://www.fao.org (accessed on 1 June 2023).
- Zhao, X.X.; Linc, F.J.; Li, H.; Li, H.B.; Wu, D.T.; Geng, F.; Ma, W.; Wang, Y.; Miao, B.H.; Gan, R.Y. Recent advances in bioactive compounds, health functions, and safety concerns of onion (Allium cepa L.). Front. Nutr. 2021, 8, 669805. [Google Scholar] [CrossRef]
- Griffiths, G.; Trueman, L.; Crowther, T.; Thomas, B.; Smith, B. Onions—A global benefit to health. Phytother. Res. 2002, 16, 603–615. [Google Scholar] [CrossRef]
- Sato, A.T.; Zhang, L.; Yonekura, H.; Tamura, A. Antiallergic activities of eleven onions (Allium cepa) were attributed to quercetin 4’-glucoside using QuEChERS method and Pearson’s correlation coefficient. J. Funct. Foods 2015, 14, 581–589. [Google Scholar] [CrossRef]
- Wang, C.K. Health benefits of onion bioactives on hypercholesterolemia, cardiovascular diseases, and bone mineral density. Food Front. 2020, 1, 107–108. [Google Scholar] [CrossRef]
- Fayos, O.; Mallor, C.; Garcés-Claver, A. Evolución del conocimiento sobre la pungencia de la cebolla (Allium cepa L.) y del pimiento (Capsicum spp.): Desde sus orígenes hasta el potencial nutracéutico actual. ITEA 2018, 114, 99–118. [Google Scholar]
- Rodriguez, J.M.; Berke, T.; Engle, L.; Nienhuis, J. Variation among and within Capsicum species revealed by RAPD markers. Theor. Appl. Genet. 1999, 99, 147–156. [Google Scholar] [CrossRef]
- Chikh-Rouhou, H.; Mezghani, N.; Mnasri, S.; Mezghani, N.; Garcés-Claver, A. Assessing the genetic diversity and population structure of a Tunisian melon (Cucumis melo L.) collection using phenotypic traits and SSR molecular markers. Agronomy 2021, 11, 1121. [Google Scholar] [CrossRef]
- Luo, C.; Chen, D.; Cheng, X.; Liu, H.; Li, Y.; Huang, C. SSR Analysis of genetic relationship and classification in Chrysanthemum germplasm collection. Hortic. Plant J. 2018, 4, 73–82. [Google Scholar] [CrossRef]
- Song, X.Y.; Zhang, C.Z.; Ying, L.I.; Feng, S.; Yang, Q.; Huang, S. SSR analysis of genetic diversity among 192 diploid potato cultivars. Hortic. Plant J. 2016, 2, 163–171. [Google Scholar] [CrossRef]
- Rivera, A.; Mallor, C.; Garcés-Claver, A.; García-Ulloa, A.; Pomar, F.; Silvar, C. Assessing the genetic diversity in onion (Allium cepa L.) landraces from northwest Spain and comparison with the European variability. N. Z. J. Crop Hortic. Sci. 2016, 44, 103–120. [Google Scholar] [CrossRef]
- Mallor, C.; Arnedo-Andrés, M.S.; Garcés-Claver, A. Assessing the genetic diversity of Spanish Allium cepa landraces for onion breeding using microsatellite markers. Sci. Hortic. 2014, 170, 24–31. [Google Scholar] [CrossRef]
- Baldwin, S.; Pither–Joyce, M.; Wright, K.; Chen, L.; McCallum, J.A. Development of robust genomic simple sequence repeat markers for estimation of genetic diversity within and among bulb onion (Allium cepa L.) populations. Mol. Breed. 2012, 30, 1401–1411. [Google Scholar] [CrossRef]
- Fischer, D.; Bachmann, K. Onion microsatellites for germplasm analysis and their use in assessing intra- and interspecific relatedness within the subgenus Rhizirideum. Theor. Appl. Genet. 2000, 101, 153–164. [Google Scholar] [CrossRef]
- Raj, A.C.; Sharangi, A.B.; Das, A.; Pramanik, K.; Upadhyay, T.K.; Almutairi, M.; Khan, M.I.; Ahmad, I.; Kausar, M.A.; Saeed, M. Assessing the genetic divergence of onion (Allium cepa L.) through morpho-physiological and molecular markers. Sustainability 2022, 14, 1131. [Google Scholar] [CrossRef]
- Brahimi, A.; Landschoot, S.; Bekaert, B.; Hajji, L.; Hajjaj, H.; Audenaert, K.; Haesaert, G.; Mazouz, H. Exploring the genetic and phenotypic diversity within and between onion (Allium cepa L.) ecotypes in Morocco. J. Genet. Eng. Biotechnol. 2022, 20, 96. [Google Scholar] [CrossRef]
- Nkhoma, N.; Shimelis, H.; Laing, M.D.; Shayanowako, A.; Mathew, I. Assessing the genetic diversity of cowpea (Vignaun guiculata L. Walp.) germplasm collections using phenotypic traits and SNP markers. BMC Genet. 2020, 21, 110–126. [Google Scholar] [CrossRef]
- Lyngkhoi, F.; Saini, N.; Gaikwad, A.B.; Thirunavukkarasu, N.; Verma, P.; Silvar, C.; Yadav, S.; Khar, A. Genetic diversity and population structure in onion (Allium cepa L.) accessions based on morphological and molecular approaches. Physiol. Mol. Biol. Plants 2021, 27, 2517–2525. [Google Scholar] [CrossRef]
- Guidoti, D.T.; Gonela, A.; Vidigal, M.C.; Conrado, T.V.; Romani, I. Interrelationship between morphological, agronomic and molecular characteristics in the analysis of common bean genetic diversity. Acta Sci. Agron. 2018, 40, 1–9. [Google Scholar] [CrossRef]
- Chalbi, A.; Chikh-Rouhou, H.; Tlahig, S.; Mallor, C.; Garcés-Claver, A.; Haddad, M.; Sta-Baba, R.; Bel-Kadhi, M.S. Biochemical characterization of local onion genotypes (Allium cepa L.) in the arid regions of Tunisia. Polish J. Environ. Stud. 2023, 32, 15–26. [Google Scholar] [CrossRef]
- Elbekey, M.; Hamza, H.; Neily, M.H.; Djebali, N.; Ferchichi, A. Characterization of watermelon local cultivars from Southern Tunisia using morphological traits and molecular markers. Euphytica 2021, 217, 74. [Google Scholar] [CrossRef]
- Chikh-Rouhou, H.; Gómez-Guillamón, M.L.; Garcés-Claver, A. Melon germplasm from Tunisia with immense breeding value. CGC Rep. 2021, 44, 7–12. [Google Scholar]
- Mohamed, A.; García-Martínez, S.; Loumerem, M.; Carbonell, P.; José-Ruiz, J.; Boubaker, M. Assessment of genetic diversity among local pea (Pisum sativum L.) accessions cultivated in the arid regions of Southern Tunisia using agro-morphological and SSR molecular markers. Genet. Resour. Crop Evol. 2019, 66, 1189–1203. [Google Scholar] [CrossRef]
- Saddoud Debbabi, O.; Rahmani Mnasri, S.; Ben Amor, F.; Ben Naceur, M.; Montemurro, C.; Marilena Miazzi, M. Applications of microsatellite markers for the characterization of olive genetic resources of Tunisia. Genes 2021, 12, 286. [Google Scholar] [CrossRef] [PubMed]
- Robbana, C.; Kehel, Z.; Ben Naceur, M.; Sansaloni, C.; Bassi, F.; Amri, A. Genome-wide genetic diversity and population structure of Tunisian durum wheat landraces based on DArTseq technology. Int. J. Molec. Sci. 2019, 20, 1352. [Google Scholar] [CrossRef] [PubMed]
- Fergany, M.; Kaur, B.; Monforte, A.J.; Pitrat, M.; Rys, C.; Lecoq, H.; Dhillon, N.P.S.; Dhaliwal, S.S. Variation in melon (Cucumis melo) landrances adapted to the humid tropics of sourthern India. Genet. Resour. Crop Evol. 2011, 58, 225–243. [Google Scholar] [CrossRef]
- Zeven, A.C. Landraces: A review of definitions and classifications. Euphytica 1998, 104, 127–139. [Google Scholar] [CrossRef]
- Sancheza, D.; Ben Sadouna, S.; Mary-Huarda, T.; Allierc, A.; Moreaua, L.; Charcosse, A. Improving the use of plant genetic resources to sustain breeding programs’ efficiency. Proc. Natl. Acad. Sci. USA 2023, 120, e2205780119. [Google Scholar] [CrossRef]
- Arnedo-Andrés, M.S.; Gil-Ortega, R.; Luis-Arteaga, M.; Hormaza, I. Development of RAPD and SCAR markers linked to the Pvr4 locus for resistance to PVY in pepper (Capsicum annuum L.). Theor. Appl. Genet. 2002, 105, 1067–1074. [Google Scholar] [CrossRef]
- McCallum, J.; Thomson, S.; Pitcher-Joyce, M.; Kenel, F.; Clarke, A.; Havey, M.J. Genetic diversity analysis and single nucleotide polymorphism marker development in cultivated bulb onion based on expressed sequence Tag-simple sequence repeats markers. J. Am. Soc. Hortic. Sci. 2008, 113, 810–818. [Google Scholar] [CrossRef]
- Peakall, R.; Smouse, P.E. GenAlEx 6: Genetic analysis in Excel. Population genetic software for teaching and research. Mol. Ecol. Notes 2006, 6, 288–295. [Google Scholar] [CrossRef]
- Peakall, R.; Smouse, P.E. GenAlEx 6.5: Genetic analysis in excel. Population genetic software for teaching and research—An Update. Bioinform. Appl. Note 2012, 28, 2537–2539. [Google Scholar] [CrossRef]
- Weir, B.S. Genetic Data Analysis II: Methods for discrete population genetic data; Sinauer Associates, Inc.: Sunderland, MA, USA, 1996. [Google Scholar]
- Sokal, R.R.; Michener, C.D. A statistical method for evaluating systematic relationships. Univ. Kans. Sci. Bull. 1958, 38, 1409–1438. [Google Scholar]
- Pritchard, J.K.; Stephens, M.; Donnelly, P. Inference of population structure using multilocus genotype data. Genetics 2000, 155, 945–959. [Google Scholar] [CrossRef] [PubMed]
- Evanno, G.; Regnaut, S.; Goudet, J. Detecting the number of clusters of individuals using the software STRUCTURE: A simulation study. Mol. Ecol. 2005, 14, 2611–2620. [Google Scholar] [CrossRef] [PubMed]
- Earl, D.A.; von Holdt, B.M. STRUCTURE HARVESTER: A Website and program for visualizing STRUCTURE output and implementing the evanno method. Conserv. Genet. Resour. 2012, 4, 359–361. [Google Scholar] [CrossRef]
- Sharma, J.P. Principle of Vegetable Breeding; Kalyani Publishers: New Delhi, India, 2009; pp. 60–76. [Google Scholar]
- Johnson, H.W.; Robinson, H.F.; Comstock, R.E. Estimates of genetic and environmental variability in soybeans. J. Agron. 1955, 47, 314–318. [Google Scholar] [CrossRef]
- Johnson, H.W.; Robinson, H.F.; Comstock, R.E. Genotypic and phenotypic correlations in soybeans and their implications in selection. J. Agron. 1955, 47, 477–483. [Google Scholar] [CrossRef]
- Mantel, N.A. The detection of disease clustering and generalized regression approach. Cancer Res. 1967, 27, 209–220. [Google Scholar]
- Kuhl, J.C.; Cheung, F.; Yuan, Q.; Martin, W.; Zewdie, Y.; McCallum, J.; Catanach, A.; Rutherford, P.; Sink, K.C.; Jenderek, M.; et al. A Unique Set of 11,008 Onion expressed sequence tags reveals expressed sequence and genomic differences between the monocot orders Asparagales and Poales. Plant Cell 2004, 16, 114–125. [Google Scholar] [CrossRef]
- Martin, W.J.; McCallum, J.; Shigyo, M.; Jakse, J.; Kuhl, J.C.; Yamane, N.; Pither-Joyce, M.; Gokce, A.F.; Sink, K.C.; Town, C.D.; et al. Genetic mapping of expressed sequences in onion and in silico comparisons with rice show scant colinearity. Mol. Genet. Genom. 2005, 274, 197–204. [Google Scholar] [CrossRef]
- Kisha, T.J.; Cramer, C.S. Determining redundancy of short-day onion accessions in a germplasm collection using microsatellite and targeted region amplified polymorphic markers. J. Am. Soc. Hortic. Sci. 2011, 136, 129–134. [Google Scholar] [CrossRef]
- Ellis, J.R.; Burke, J.M. EST-SSRs as a resource for population genetic analyses. Heredity 2007, 99, 125–132. [Google Scholar] [CrossRef] [PubMed]
- Khar, A.; Lawande, K.E.; Negi, K.S. Microsatellite marker based analysis of genetic diversity in short day tropical Indian onion and cross amplification in related Allium spp. Genet. Resour. Crop Evol. 2011, 58, 741–752. [Google Scholar] [CrossRef]
- Santos, C.A.F.; Oliveira, V.R.; Rodrigues, M.A.; Ribeiro, H.L.C. Molecular characterization of onion cultivars with microsatellite markers. Pesq. Agropec. Bras 2010, 45, 49–55. [Google Scholar] [CrossRef]
- Simó, J.; Pascual, L.; Cañizares, J.; Casañas, F. Spanish onion landraces (Allium cepa L.) as sources of germplasm for breeding calçots: A morphological and molecular survey. Euphytica 2014, 195, 287–300. [Google Scholar] [CrossRef]
- Jayaswall, K.; Bhandawat, A.; Sharma, H.; Yadav, V.K.; Mahajan, V.; Singh, M. Characterization of Allium germplasms for conservation and sustainable management using SSR markers. Indian J. Tradit. Knowl. 2019, 18, 193–199. [Google Scholar]
- Kumar, M.; Sharma, V.; Kumar, V.; Sirohi, U.; Chaudhary, V.; Sharma, S.; Gautam, S.; Naresh, R.K.; Yadav, H.K.; Sharma, S. Genetic diversity and population structure analysis of Indian garlic (Allium sativum L.) collection using SSR markers. Physiol. Mol. Biol. Plants 2019, 25, 377–386. [Google Scholar] [CrossRef]
- Khosa, J.S.; McCallum, J.; Dhatt, A.S.; Macknight, R.C. Enhancing onion breeding using molecular tools. Plant Breed. 2016, 135, 9–20. [Google Scholar] [CrossRef]
- Sharma, K.; Assefa, A.D.; Kim, S.; Ko, E.Y.; Lee, E.T.; Park, S.W. Evaluation of total phenolics, flavonoids and antioxidant activity of 18 Korean onion cultivars: A comparative study. J. Sci. Food Agric. 2014, 94, 1521–1529. [Google Scholar] [CrossRef]
- Sinclair, P.J.; Blakeney, A.B.; Barlow, E. Relationships between bulb dry matter content, soluble solids concentration and non-structural carbohydrate composition in the onion (Allium cepa). J. Sci. Food Agric. 1995, 69, 203–209. [Google Scholar] [CrossRef]
- Mallor, C.; Balcells, M.; Mallor, F.; Sales, E. Genetic variation for bulb size, soluble solids content and pungency in the Spanish sweet onion variety Fuentes de Ebro. Response to selection for low pungency. Plant Breed. 2011, 130, 55–59. [Google Scholar] [CrossRef]
- Manjunathagowda, D.C. Genetic enhancement of onion germplasm through population improvement. Plant Physiol. Rep. 2022, 27, 73–80. [Google Scholar] [CrossRef]
- Dangi, R.; Kumar, A.; Khar, A. Genetic variability, heritability, and diversity analysis studies in short day tropical onion (Allium cepa L.). Indian J. Agric. Sci. 2018, 88, 948–957. [Google Scholar] [CrossRef]
- Dabholkar, A.R. Element of Biometrical Genetics; Concept Publishing Company: New Delhi, India, 1992; p. 431. [Google Scholar]
- McCallum, J. Onion. In Genome Mapping and Molecular Breeding in Plants; Kole, C., Ed.; Springer: Berlin/Heidelberg, Germany; New York, NY, USA, 2007; Volume 5, pp. 31–342. [Google Scholar]
- Jones, H.A.; Emsweller, S.L. A male sterile onion. Proc. Am. Soc. Hortic. Sci. 1936, 34, 582–585. [Google Scholar]
- Albrecht, E.; Zhang, D.; Mays, A.D.; Saftner, R.A.; Stommel, J.R. Genetic diversity in Capsicum baccatum is significantly influenced by its ecogeographical distribution. BMC Genet. 2012, 13, 68–83. [Google Scholar] [CrossRef] [PubMed]
Disclaimer/Publisher’s Note: The statements, opinions and data contained in all publications are solely those of the individual author(s) and contributor(s) and not of MDPI and/or the editor(s). MDPI and/or the editor(s) disclaim responsibility for any injury to people or property resulting from any ideas, methods, instructions or products referred to in the content. |
© 2023 by the authors. Licensee MDPI, Basel, Switzerland. This article is an open access article distributed under the terms and conditions of the Creative Commons Attribution (CC BY) license (https://creativecommons.org/licenses/by/4.0/).