1. Introduction
Production using soilless culture and protected environments, such as plastic tunnels and greenhouses, is an increasing trend for all berry crops [
1,
2]. The soilless “long-cane” production of raspberry and blackberry originated decades ago in The Netherlands, the U.K., and Belgium but has since been adopted in other European countries as well as in Africa, Southeast Asia, North and South America, and Australia [
3,
4,
5,
6,
7,
8]. The term “long-cane” is derived from how these crops are grown and trellised in soilless cultivation [
3,
4,
5]. Blackberry and raspberry have a perennial root system producing biennial stems called “canes”; in the first year, these canes grow vegetatively (and are called “primocanes”), and in the second year, after dormancy, these canes (now called “floricanes”) produce flowers and fruit before senescing [
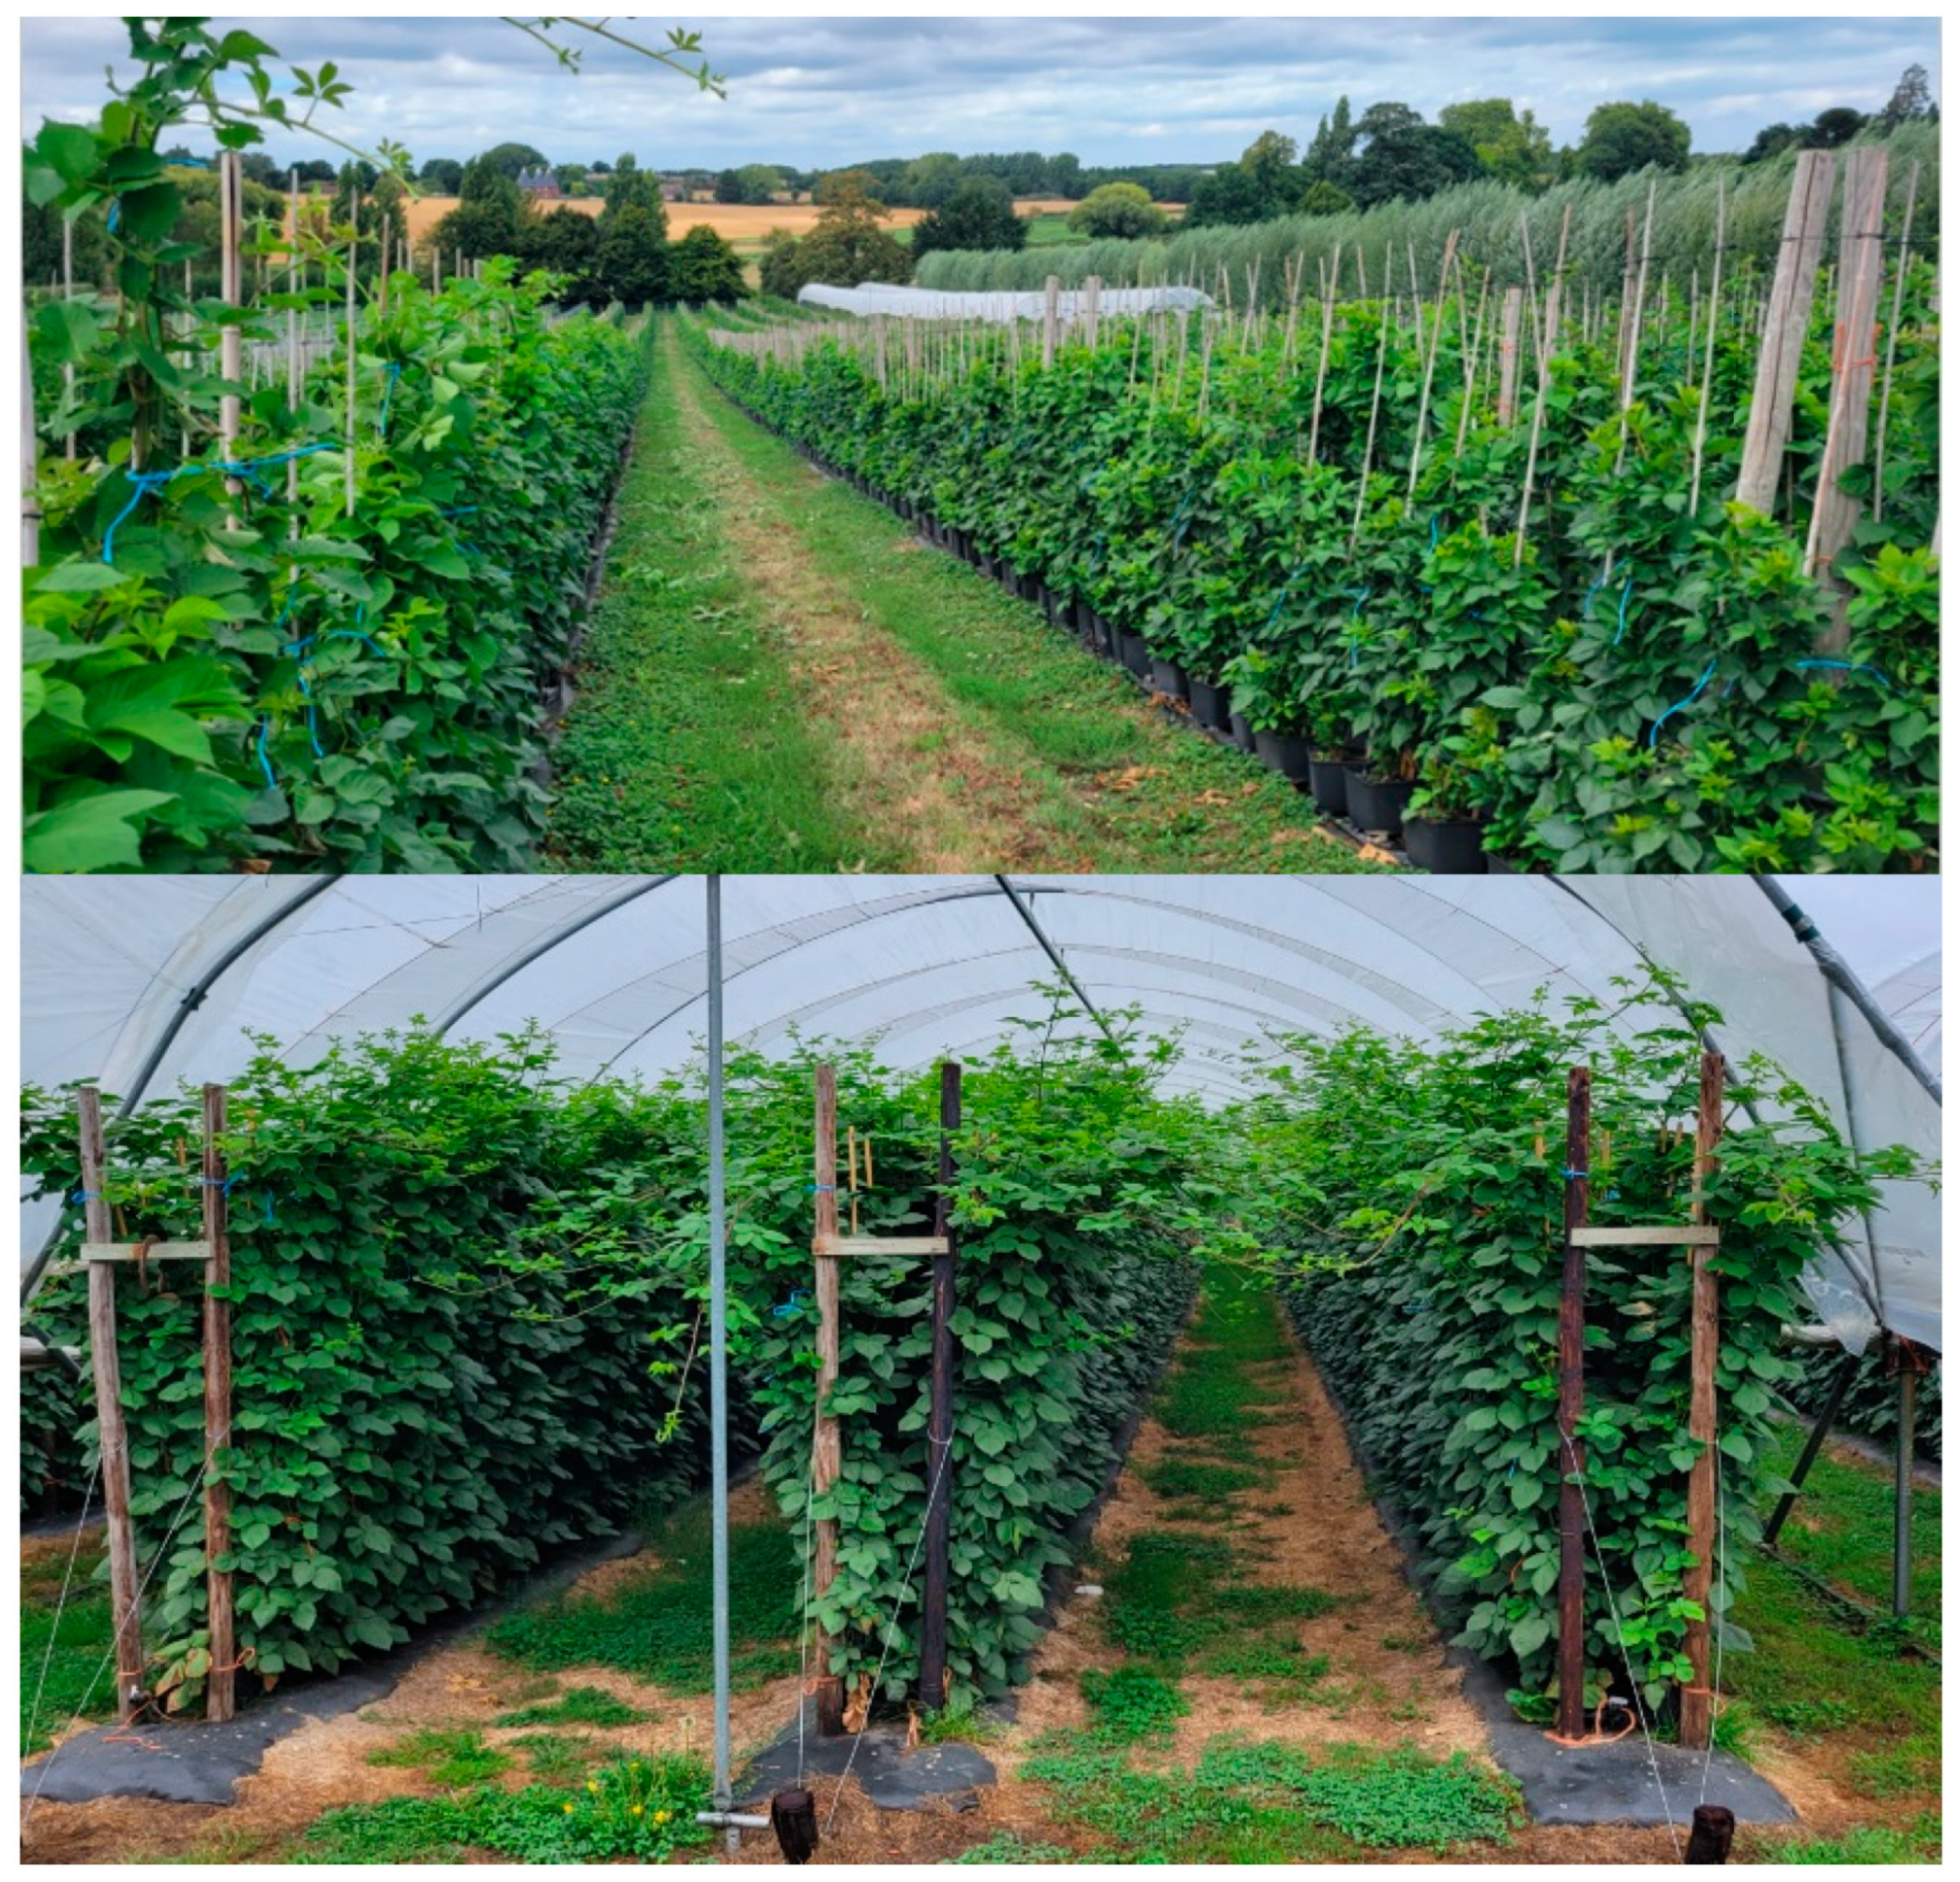
8]. The long-cane process involves growing vegetative primocanes (~2 m height), usually outdoors during the summer of year 1, allowing the plants to initiate flower bud development in the fall, followed by transferring the plants into cold storage (−1.5 to 4 °C) to satisfy chilling requirements and dormancy, and finally transferring the dormant plants into plastic tunnels or greenhouses to force flowering and fruit development in year 2, as shown in
Figure 1 [
9,
10,
11]. Plants are grown completely in soilless substrates and containers with cultural practices more like those for greenhouse hydroponics than traditional field-based production [
7,
12]. Varying the length of cold storage and the environmental conditions during forcing, particularly air temperature, can be manipulated as a strategy for scheduling crops so that they finish (i.e., harvest) during important and off-season market weeks [
12,
13,
14,
15].
Scheduling crops requires the ability to predict the amount of time needed for production, which involves identifying how quickly plants progress (i.e., the rate of progress) towards desired stages of plant development [
16,
17]. The time needed to reach an important developmental stage, for example, the number of days to flowering or fruiting (DTF), is converted to a rate by calculating the reciprocal of the DTF (e.g., 1/DTF). The influence of environmental factors, like temperature and light, on plant development rates can be quantified using mathematical functions [
17]. These types of models can be used as decision-support tools, for example, for long-cane blackberry and raspberry, allowing growers to select the date at which dormant long-canes should be forced in a greenhouse or high tunnel and manipulate the production temperatures to schedule crops’ off-season harvesting.
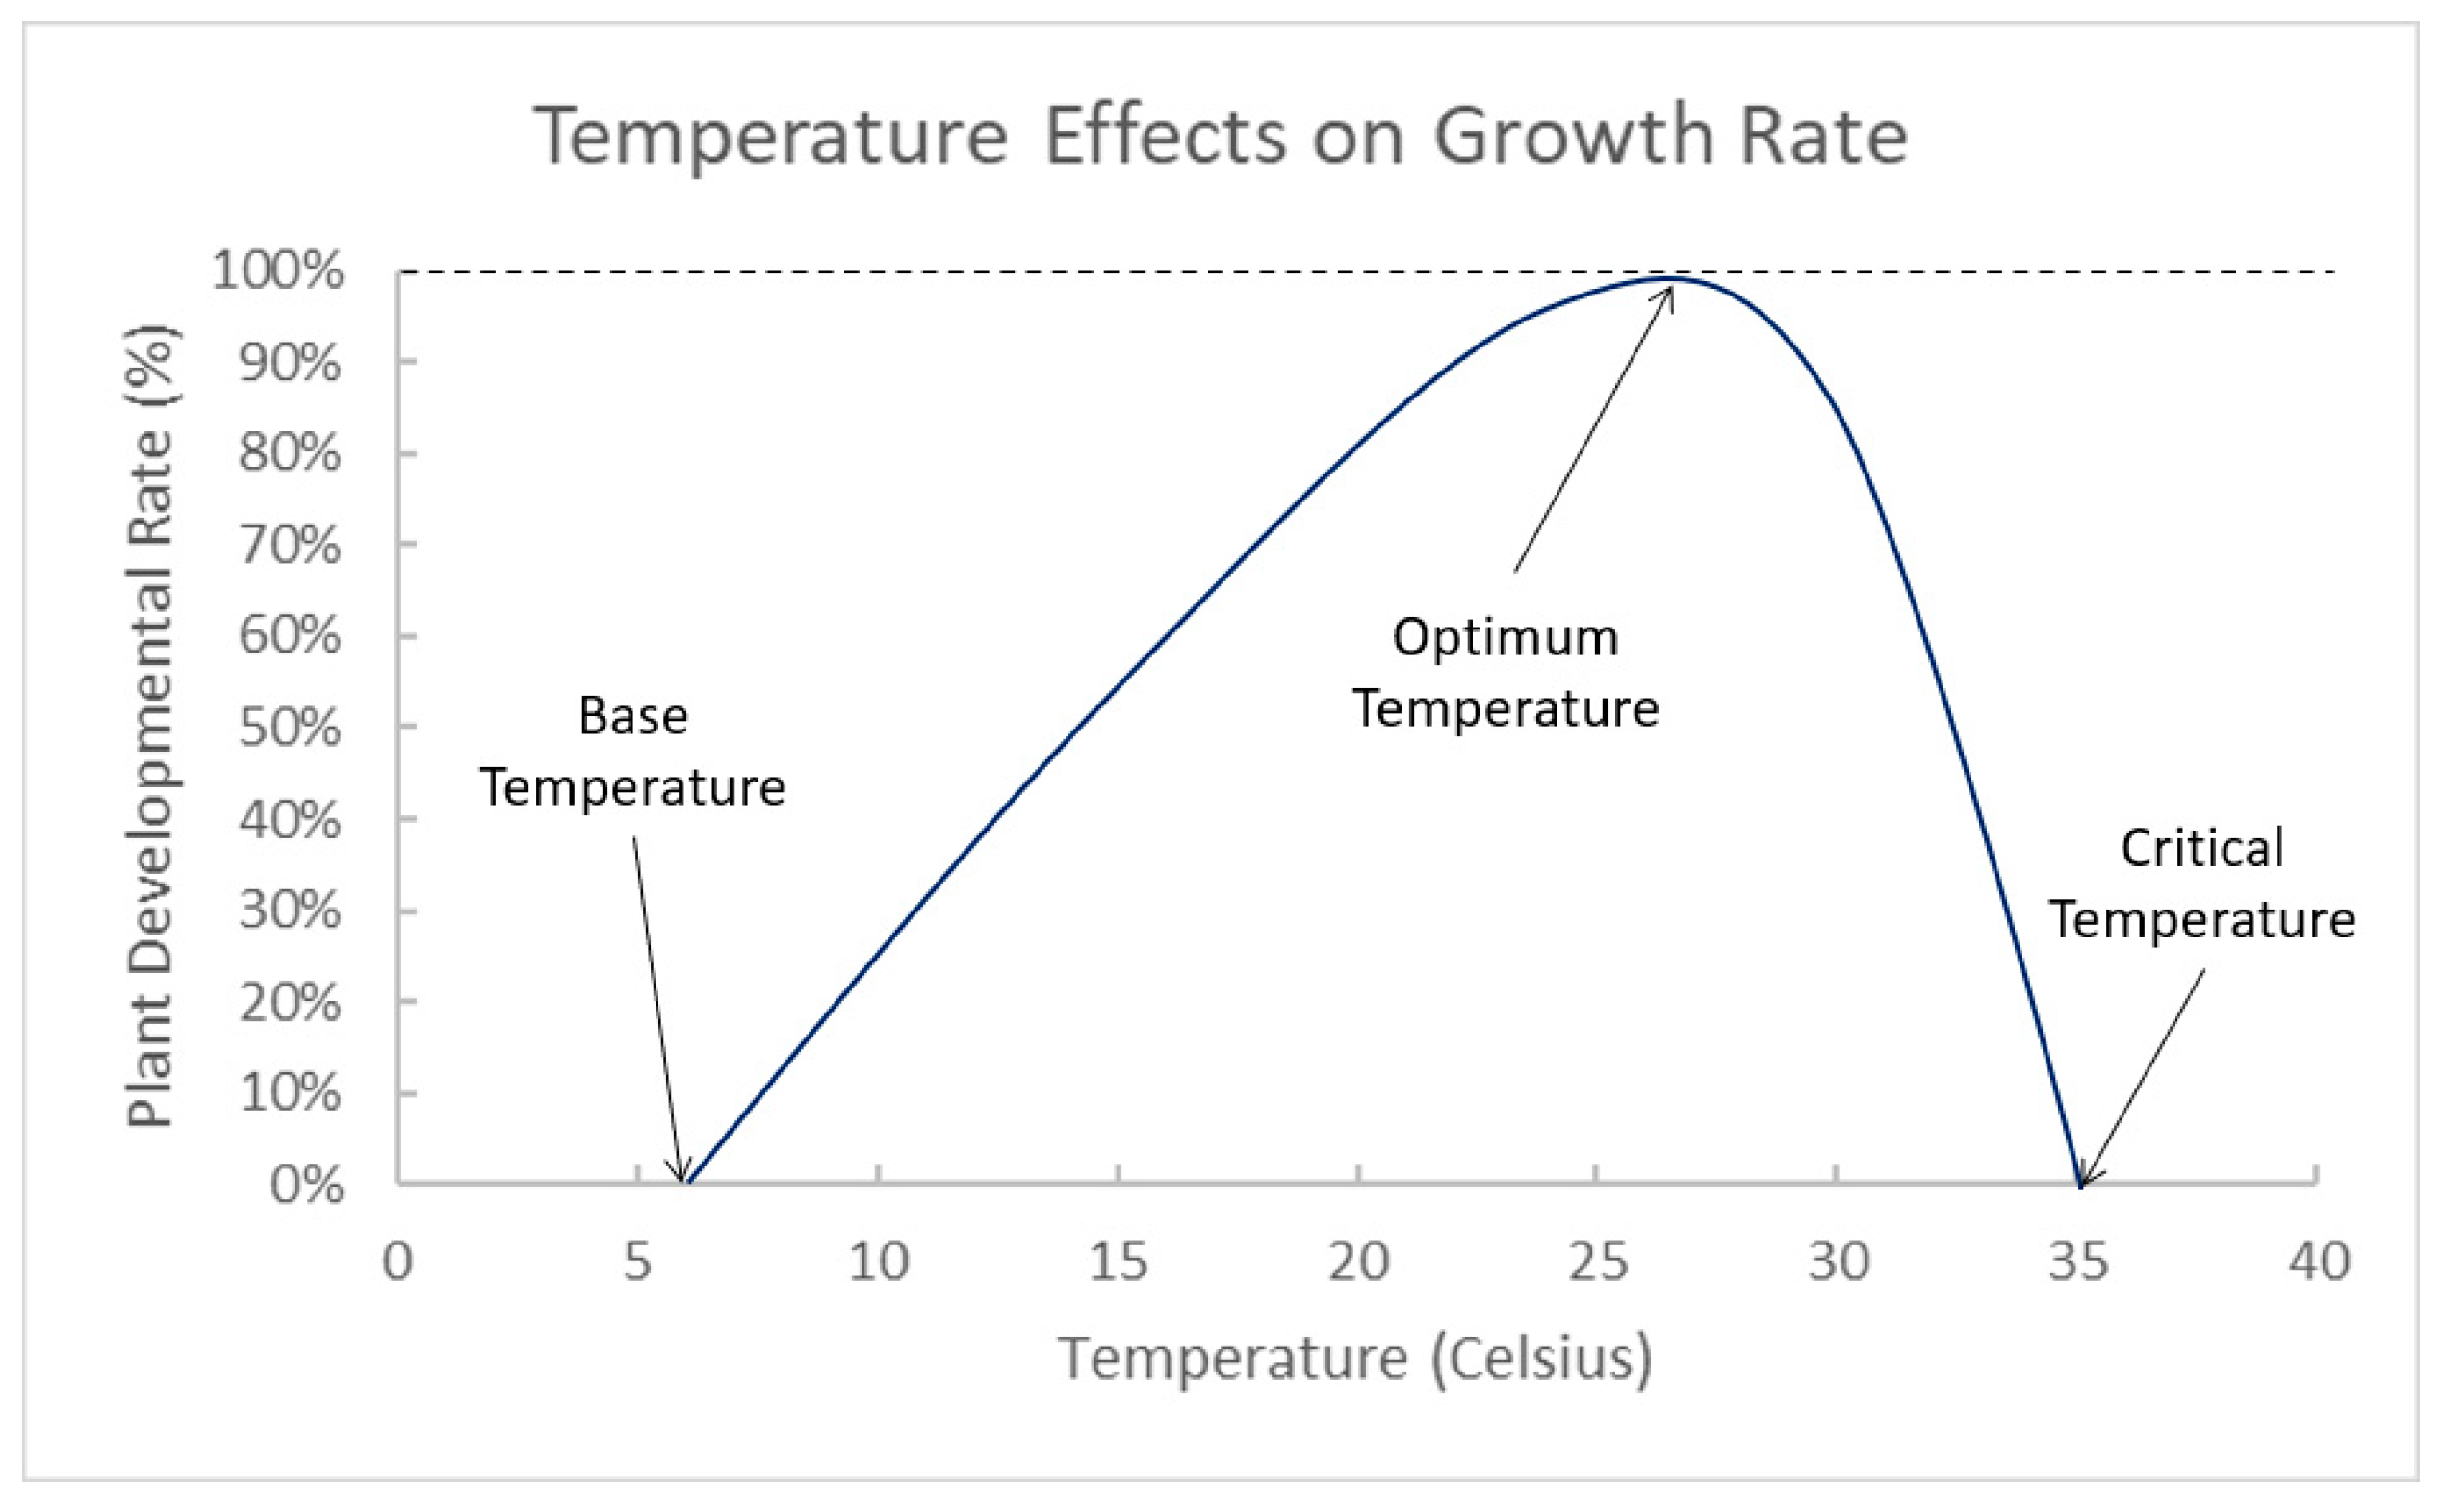
The rate of progress towards a development event, such as flowering or fruiting, is mostly a function of average daily temperature (or ADT) [
18,
19], as shown in
Figure 2. Plant development rates increase from zero to a maximum value when the ADT increases from a base temperature to an optimum temperature for plant growth, respectively [
20,
21,
22]. The optimum temperature is the point where the rate of plant development is the highest, after which plant development rates decrease as the ADT exceeds the optimum temperature, and the critical temperature is where plant development ceases because of heat stress. Models describing plant development rates as a function of ADT have been developed for many species grown in soilless substrates and protected environments and allow users to predict the time needed for crop production based on anticipated temperatures [
16,
17]. Measuring ADT over time is also used to calculate the accumulation of heat units (e.g., thermal time or degree days or hours), wherein heat units are commonly used to estimate the developmental stage or forecast the date at which a plant will reach a predetermined developmental stage, for many field-grown specialty crops, including blackberry [
18]. Heat units, particularly degree days, are often calculated from ADT measurements; therefore, it is important to note that the effects of ADT on heat unit accumulation and the rate of plant development are interrelated, i.e., these are not separate processes.
There are very few published studies on modeling temperature effects on growth and plant development rates for blackberry. Black et al. [
18] modeled heat unit accumulation for the purpose of predicting bloom dates in field-grown
Rubus crops and reported base, optimum, and critical temperature parameters using several linear and curvilinear models. However, these authors did not include the model equations, making it difficult to reproduce or expand upon their results. To the best of our knowledge, Dickson et al. [
23] was the first to attempt modeling temperature effects on plant development rates for long-cane blackberry; however, this work is still in the early stages, and more investigation is needed to develop useful models for commercial practice.
Modeling the relationship between the rate of plant development and ADT would assist long-cane blackberry growers in predicting crop timing and in making scheduling decisions. In this study, the first objective was to quantify temperature effects on the rate of progress towards flowering and fruiting for four blackberry cultivars grown as long-canes. The second objective was to develop simple models predicting the time from forcing dormant plants to the appearance of the first open flowers and ripe fruit as a function of ADT. The models were developed using data from a greenhouse and high-tunnel experiment, with long-cane blackberries and temperature parameters derived from a blackberry heat unit study [
18].
2. Materials and Methods
The blackberry cultivars ‘Loch Ness’, ‘Osage’, ‘Ponca’, and ‘Prime-Ark® 45’ were grown using long-cane techniques and supplied by Nourse Farms (Whately, MA, USA). This process involved starting long-cane plants for each cultivar from tissue culture liners and growing the canes outdoors in 5 L containers with coconut coir substrate during summer and fall of 2020. In late fall, dormant plants were transferred to a −1.5 °C cold storage facility after they had been subjected to ~200 natural chilling hours and were shipped frozen to the experiment locations at the University of Arkansas in early spring of 2021.
Dormant long-cane plants were shipped to a polycarbonate controlled-environment greenhouse (GH) at the University of Arkansas in Fayetteville, AR (36.100173, −94.170697), on 12 March 2021 and to an unheated plastic-covered high tunnel (HT) at the University of Arkansas Fruit Research Station in Clarksville, AR, USA (35.533430, −93.403465), on 21 January 2021. Dormant plants were immediately transplanted into 10 L containers (Plantlogic®, Zapopan, Mexico) with a sphagnum peat- and bark-based substrate (BM7; Berger, Saint-Modeste, QC, USA). At both locations, containers were center-spaced at 70 cm in trellised rows, and rows were spaced 2 m apart. Budbreak and development of flowers and fruit occurred under natural lighting and within a natural photoperiod.
Plants were fertilized at each irrigation event using drip emitters (with 1 emitter per plant) and a commercial 15.0N-2.2P-12.5K (ICL Specialty Fertilizers, Dublin, OH, USA) water-soluble fertilizer mixed at 200 mg∙L−1 N in the irrigation water. The irrigation system was manually adjusted daily to supply each plant with 1.5 to 3.0 L of fertilizer solution per day depending on root zone moisture and weather conditions and to maintain a leaching fraction of approximately 20%. Fertilizer concentration and nitrogen form were adjusted as needed to maintain a target substrate pH between 5.4 and 6.0 and electrical conductivity (EC) between 1.5 and 2.5 mS·cm−1.
The average daily temperature (ADT), daily minimum and maximum temperatures, and daily light integral (DLI) at the GH and HT locations were measured using WatchDog 2400 Mini Stations (Spectrum Technologies, Aurora, IL, USA) placed just above the plant canopy. ADT refers to the daily 24 h temperature average, which has been shown to be highly correlated with plant development rates [
16,
17,
20,
24,
25,
26,
27].
For the GH location, the ADT and daily minimum and maximum temperatures over the duration of the project were (average ± standard deviation) 23.0 ± 3.3 °C, 18.1 ± 2.6 °C, and 29.5 ± 3.6 °C, respectively. Daily temperature values ranged from 15.6 to 29.9 °C for ADT, 12.2 to 23.1 °C for daily minimum temperature, and 17.8 to 29.9 °C for daily maximum temperature. Average DLI was 19.1 ± 8.2 mol·m−2·d−1 of photosynthetically active radiation (PAR), and daily values ranged from 3.2 to 32.6 mol·m−2·d−1 of PAR.
For the HT location, the ADT and daily minimum and maximum temperatures over the duration of the project were 18.7 ± 6.8 °C, 11.6 ± 7.4 °C, and 30.1 ± 7.2 °C, respectively. Daily temperature values ranged from 2.8 to 30.0 °C for ADT, −5.0 to 24.4 °C for daily minimum temperature, and 5.0 to 43.3 °C for daily maximum temperature. Average DLI was 19.7 ± 11.4 mol·m−2·d−1 of photosynthetically active radiation (PAR), and daily values ranged from 0.9 to 43.3 mol·m−2·d−1 of PAR.
Data collected for each long-cane plant consisted of measurements of the time (in days, d) to reach a development stage corresponding to the appearance of the first open flower and first ripe fruit from transplant (12 March 2021 and 21 January 2021 for GH and HT, respectively). The development rate was calculated as the reciprocal of days to first open flower and ripe fruit per plant (e.g., 1/d). ADT values tended to increase as ambient outdoor temperature increased over time at both GH and HT locations. Daily ADT values were averaged from the time the plants were removed from cold storage and placed in the GH or HT until the point at which the first open flower and first ripe fruit appeared for each plant to characterize the average ADT experienced by plants up until those developmental stages. Each long-cane blackberry plant was considered one observational unit, and there were four and six observational units per cultivar at the GH and HT locations (a total of ten observational units per cultivar), respectively.
Model development: Biological rate (R) responses to temperature often follow an asymmetric, peak-shaped curve [
20] like that shown in
Figure 1. The authors of this study mathematically described the relationship between ADT and the rate of progress towards the appearance of the first open flower and ripe fruit for long-cane blackberry following a modified version of a function from the work of Landsberg [
21] and Reed et al. [
22]:
where
and
The parameters T
opt, T
crit, T
base, and R
min have biological meaning, and the B value defines the skew. T
base and T
crit are the base and critical temperatures below and above T
opt, respectively, where R equals zero. R
min is the minimum value estimated for R above zero. It should be noted that for T < T
base, R will become negative, and for T > T
crit, Equation (1) cannot be calculated unless B is an integer [
21].
Since T
opt was not observed for any cultivar in the experiment, it was not possible to estimate T
opt and T
crit using Equation (1). Therefore, the temperature parameters (T
opt, T
crit, and T
base) used in Equations (1)–(3) were derived from a
Rubus sp. heat unit modeling study conducted by Black et al. [
18], where heat unit accumulation at the first-open-flower stage was measured for >100 blackberry genotypes grown over several years and at field sites in various geographical locations across the U.S. In this study, the best-fitting heat unit model (
R2 = 0.815) indicated T
base and T
opt values of 6 and 25 °C, respectively. The same authors estimated a T
crit of 35 °C for blackberry grown in soilless container substrates based on a separate growth chamber study.
For each cultivar, separate model equations were developed to predict the rate of progress towards the appearance of the first flower and fruit based on the flowering and fruiting data collected, temperature parameter estimates from the heat unit modeling study [T
base = 6 °C, T
opt = 25 °C, T
crit = 35 °C; reference [
18]], and Equation (1). Nonlinear regression (PROC NLIN procedure in SAS 9.4, (SAS Institute, Cary, NC, USA)) was used to generate estimates for R
min for each equation. The model accuracy for an Equation was evaluated by comparing the predicted to observed time (d) to first flower and fruit for each cultivar as well as by determining kurtosis and skew. Other temperature-based modeling studies have used similar forms of analysis for crops grown in soilless culture and greenhouse environments [
24,
25,
26].
3. Results and Discussion
The ADTs upon the appearance of the first flower and ripe fruit were similar between cultivars but differed by location (
Table 1). The average ADTs across cultivars for the GH and HT locations were 19.9 and 12.3 °C at the first-flower stage and 20.8 and 14.5 °C at the first-fruit stage, respectively. Overall, the GH provided a more protected and heated environment with warmer temperatures compared to the HT, for which the temperatures were lower (
Table 1, see temperature data in the
Section 2).
At both the GH and HT locations, the time to first flower tended to be earlier for ‘Osage’ and ‘Prime-Ark
® 45′, whereas flowering occurred later for ‘Loch Ness’ and ‘Ponca’ (
Table 1). Similar trends were observed between cultivars for the time to first ripe fruit (
Table 1). There was an 11- and 28-day spread in time to flowering between cultivars in the GH and HT, respectively, and an 11- and 15-day spread in time to fruiting between cultivars in the GH and HT, respectively (
Table 1). In other words, the difference in time to flowering/fruiting between cultivars was greater when the plants were grown at lower temperatures (in the HT), whereas the crop times between cultivars were more similar when grown at higher temperatures (in the GH). Overall, flowering and fruiting in the HT required nearly double the amount of time required in the GH, a result of lower daily air temperatures and a lower ADT in the HT. The same trends were observed for the rate of progress towards flowering and fruiting (1/d,
Table 1).
Dickson et al. [
23] reported results like those shown in
Table 1 for the long-cane blackberry cultivars ‘Natchez’, ‘Ouachita’, ‘Prime-Ark
® Freedom’, and ‘Prime-Ark
® Traveler’ grown under different air temperature conditions. Averaged across cultivars, the plants in that study, forced at approximately 20 °C and 13 °C, developed flowers in 32 d and 63 d and developed ripe fruit in 76 d and 116 d, respectively. As shown in
Table 1, the forcing of long canes at lower temperatures in Dickson et al.’s [
23] study resulted in greater differences between cultivars in terms of time to flowering/fruiting, whereas the cultivar crop times were more similar at higher temperatures.
Table 2 shows the estimated parameters A, B, and R
min for each cultivar for the first-flower and first-fruit models developed using Equation (1). All parameters are typically cultivar-specific; however, B is constant in this study since the same T
base, T
opt, and T
crit values derived from Black et al. [
18] were assumed constant across cultivars (see
Section 2).
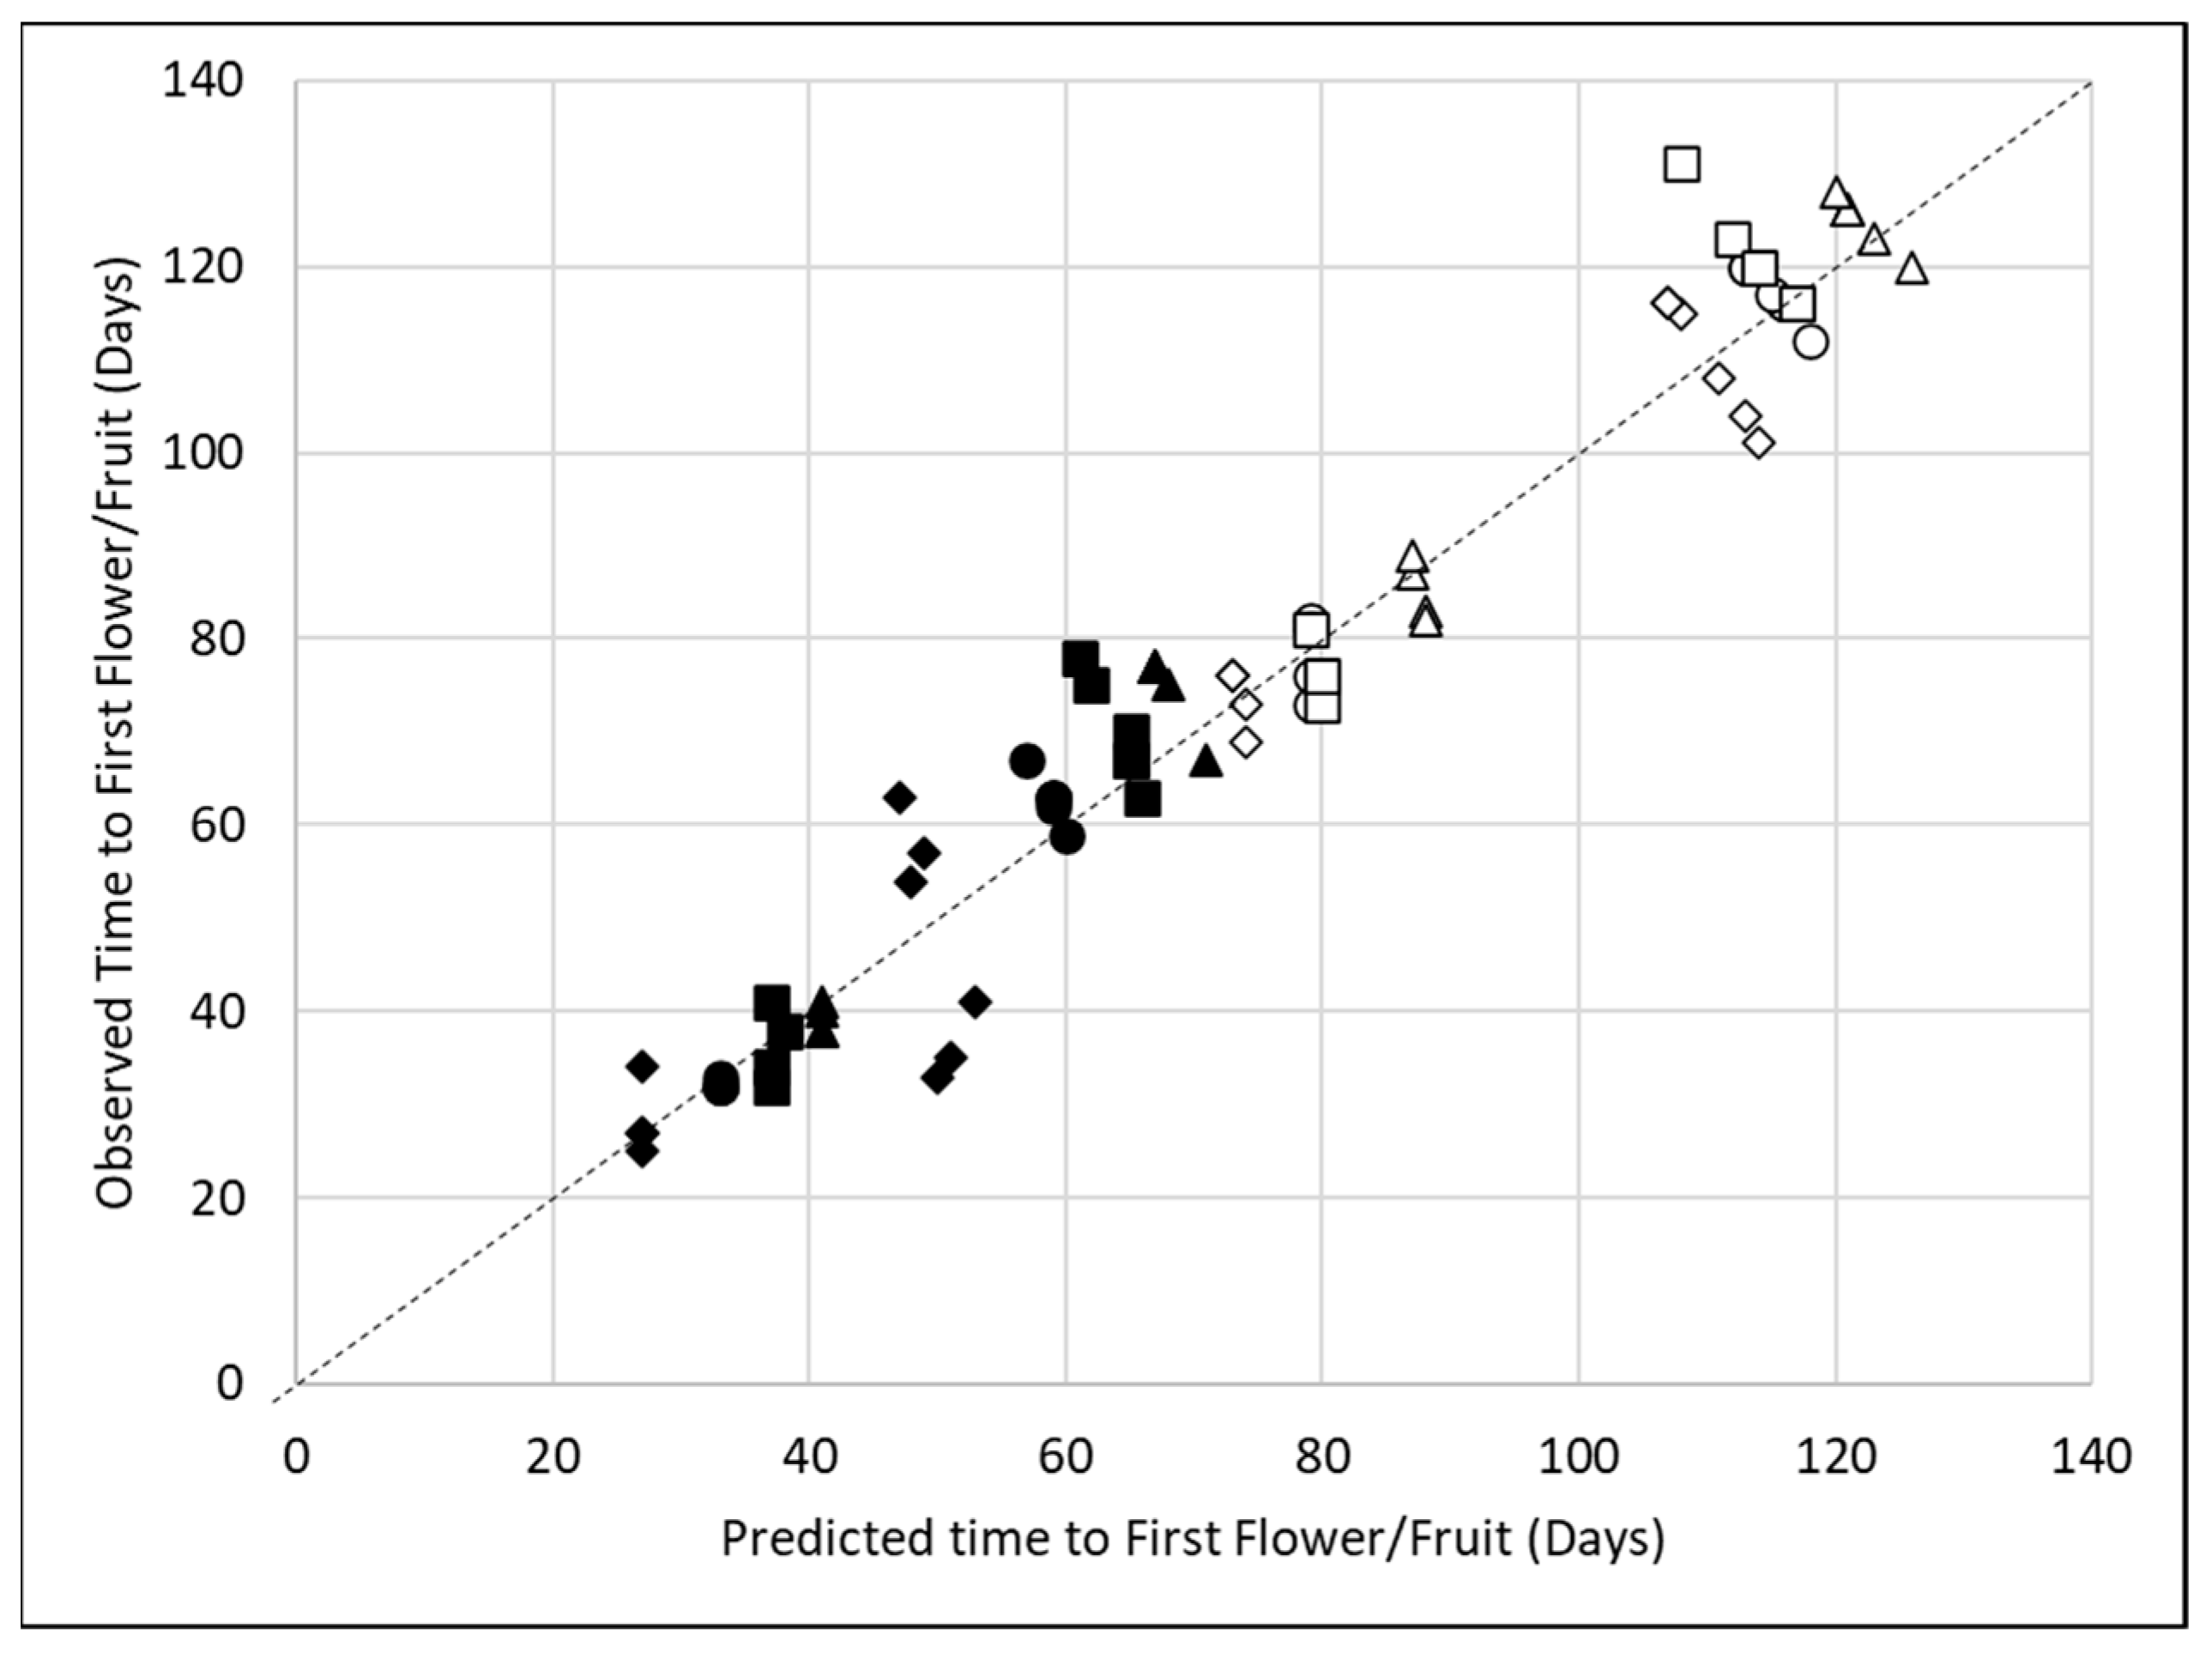
Figure 3 plots the model-predicted number of days (
x-axis) against the observed days to flowering and fruiting (
y-axis) for individual observational units and shows an approximate goodness of fit across models developed for cultivars using Equation (1). The data in
Figure 3 were also analyzed using linear regression, wherein the regression equation had an adjusted-
r2 value of 0.952 and indicated a near 1:1 positive relationship between the predicted and observed values [regression equation, observed days = predicted days × 1.02 ± 0.05 − 0.03 ± 4.19, (±95% confidence intervals)]. The strong relationship in
Figure 3 suggests temperature had the main influence on time to flowering/fruiting for these blackberry cultivars,
Since only ADT was included in Equation (1) and the effects of other environmental factors (e.g., light, humidity, and carbon dioxide) were not included, the main and often dominant effects of temperature on crop timing seen in this study were consistent with those reported by Dickson et al. [
23] for long-cane blackberry as well as those from previous modeling studies concerning other species [
16,
17,
20].
The accuracy of the flowering models in describing the data sets within ±7
d ranged from 60% to 90% for the actual flowering data across cultivars, and the accuracy of the fruiting models ranged from 60% to 100% for the actual fruiting data (
Table 3). The models were consistently most accurate for ‘Osage’, least accurate for ‘Prime-Ark
® 45′, and intermediately accurate for ‘Loch Ness’ and ‘Ponca’ (
Table 3). The flowering and fruiting models had average ±7 d accuracies of 70% and 83%, respectively, which were lower than the values of 80% and 85% (for ±7 d accuracy) reported by Dickson et al. [
23] for ‘Natchez’, ‘Ouachita’, ‘Prime-Ark
® Freedom’, and ‘Prime-Ark
® Traveler’. Model accuracy was also evaluated as the predicted minus the observed days to flowering and fruiting for each cultivar and observational unit, the results of which are summarized in
Table 3. The average predicted minus observed days ranged from 0
d (for the fruit model for ‘Prime-Ark
® 45′) to −4 d (for the flower model for ‘Loch Ness’), and overall, the models tended to slightly underestimate the crop time by 2 d (
Table 3).
Overall, the data in
Figure 3 and
Table 3 highlight some of the variability and lack of precision for the first-flower and -ripe-fruit models developed across cultivars. The ±1 standard deviations ranged from 3 d (for the flower model, ‘Osage’) to 10 d (for the flower model, ‘Prime-Ark
® 45′), indicating the inconsistency across observational units. The Kurtosis and skew values in
Table 3 suggest the variability in the predicted minus observed days to flowering/fruiting was not normally distributed for all cultivars. For example, only the first-flower models for ‘Osage’ and ‘Ponca’ and first-fruit model for ‘Ponca’ had positive kurtosis values indicating an approximately normal peak-shaped distribution (
Table 3). The skew values were within the range of −0.5 to 0.5, indicating an approximately symmetrical distribution for most models (
Table 3), except for the flower models for ‘Osage’ (−1.15) and ‘Ponca’ (−0.99) and the fruiting model for ‘Ponca’ (−1.29), wherein the negative skew values indicated these models over-predicted the time to flowering/fruiting for most observational units.
The techniques used in this research to model temperature effects on crop timing serve as a good starting point; however, further improvements of the models’ accuracy are needed prior to using them to make predictions in commercial blackberry long-cane production. The relatively low model accuracy observed was partially a result of the variability in the time to flowering/fruiting between plants (observational units) in both GH/HT locations (
Table 1,
Figure 3). The authors believe that much of this variability resulted from differences in individual plant quality, non-uniform budbreak and pollination, variations in microclimate, and other factors linked with source–sink relationships between leaves and developing fruit. These variables can be better controlled by selecting for more uniform plants meeting the commercial specifications for long-cane production, improving climate control, and measuring temperature in the microclimates around developing flowers and fruit. In addition, the T
base, T
opt, and T
crit parameters are likely cultivar-specific but are not known for the cultivars used in this study, so they were selected from the previous blackberry heat-unit study conducted by Black et al. [
18]. More effort is needed to determine accurate T
base, T
opt, and T
crit parameters for these cultivars, which would likely increase model accuracy substantially. Other factors such as photosynthetic light, which was measured in this study using daily light integral (DLI, see
Section 2) values, can influence plant development rates [
16], especially at sub-optimal levels. The daily DLI values tended to increase as the daily ADT values increased over time during the study, and this process occurs naturally during the transition from the late winter/early spring (when this study was initiated) to the summer. Overall, the inclusion of DLI values along with ADT may also improve model accuracy in future research.
In some scenarios, using ADT may over-simplify the relationship between temperature and plant development. For example, extreme heat or frost events may cause significant and lasting delays in development and may not be well-reflected by ADT, particularly if these events are infrequent, and therefore have little weight when determining the average ADT over time. The models developed in this research would be most accurate in predicting the time to first flower and fruit in environments where the ADT is relatively stable over time and where daily temperature highs and lows are mostly within the Tbase (6 °C) and Tcrit (35 °C) range used in Equation (1). These types of environments may include greenhouses and tunnels with adequate climate control and the capacity to protect crops from extreme weather events.
To improve model accuracy, future studies should focus on ensuring that long-cane plants are at a uniform stage of development at the point of forcing, increasing cultivar sample sizes and temperature levels, and ensuring that evaluated temperature levels are below and above T
opt to allow for more accurate estimates of T
base, T
opt, T
crit, and R
min. Although temperature is used as the main environmental parameter in other similar modeling and crop-scheduling studies, for example, degree-day or heat-unit studies on blackberry [
18], and studies concerning greenhouse container crops [
24,
25,
26], including other parameters such as light levels may improve accuracy. In addition to modeling the time to first flower and fruit, modeling the effects of temperature and light on the time to first marketable yield, harvested yields over time, and total harvest duration would also be practical for growers and useful for planning harvest labor.
This was a first attempt at developing flowering/fruiting models for long-cane blackberry, with the intention that these models can be improved upon in later studies and incorporated into crop scheduling and decision support tools for growers. The methods used are not crop-specific and can be adapted for other berry crops grown in similar production systems. For example, growers can estimate daily or weekly air temperatures over time for their location—either via experience, measurements collected on-site, or accessing local historical climate data—and use the model equations developed to simulate the anticipated date of flowering and harvest and the effects of changing temperature over time on harvest date and compare production times between cultivars. Similar models have been developed and used in this way by commercial greenhouse growers to schedule crops [
16,
27].


