Article

Evolution of the Volatile Organic Compounds, Phenols and Antioxidant Capacity during Fruit Ripening and Development of Rubus ulmifolius Schott Fruits

by
Ricardo I. Castro
1,
Carlos Vásquez-Rojas
2,
Mariona Gil I Cortiella
3,
Carolina Parra-Palma
2,
Patricio Ramos
4,5,* and
Luis Morales-Quintana
2,*
1
Multidisciplinary Agroindustry Research Laboratory, Instituto de Ciencias Químicas Aplicadas, Facultad de Construcción y Medio Ambiente, Universidad Autónoma de Chile, Cinco Pte. N°1670 Cinco Pte. N°1670, Talca 3467987, Chile
2
Multidisciplinary Agroindustry Research Laboratory, Instituto de Ciencias Biomédicas, Facultad Ciencias de la Salud, Universidad Autónoma de Chile, Cinco Pte. N°1670 Cinco Pte. N°1670, Talca 3467987, Chile
3
Multidisciplinary Agroindustry Research Laboratory, Instituto de Ciencias Químicas Aplicadas, Facultad de Ingeniería, Universidad Autónoma de Chile, Av. Pedro de Valdivia 425, Santiago 7500912, Chile
4
Centro de Investigación de Estudios Avanzados del Maule (CIEAM), Vicerrectoría de Investigación y Postgrado, Universidad Católica del Maule, Av San Miguel 3605, Talca 3400000, Chile
5
Plant Microorganism Interaction Laboratory, Centro del Secano, Facultad de Ciencias Agrarias y Forestales, Universidad Católica del Maule, Av San Miguel 3605, Talca 3400000, Chile
*
Authors to whom correspondence should be addressed.
Horticulturae 2023, 9(1), 13; https://doi.org/10.3390/horticulturae9010013
Submission received: 21 November 2022 / Revised: 17 December 2022 / Accepted: 17 December 2022 / Published: 21 December 2022
(This article belongs to the Special Issue Determinants of Fruit Development and Ripening)

Abstract

:
Nowadays, a growing interest in consumers’ fruit with a high content of health-promoting compounds has been observed. In this sense, wild berries have received special attention based on their high accumulation of phenolic compounds, as well as their characteristic and pleasant aroma. In this work, we characterize the color development, antioxidant capacity, phenolic contents, and volatile profile of Rubus ulmifolius Schott fruit at different ripening stages during two seasons on the same orchard. Four stages were established based on the color parameter, which was consistent with changes in the weight and size of the fruit. In addition, total phenolic and flavonoid content showed a decrease during the fruit ripening, in contrast with the total anthocyanins content that increased at the final stages of ripening. In addition, the antioxidant capacity was evaluated through two approaches: FRAP and DPPH, which consistently displayed higher levels at the final stages in the two different seasons. Finally, the VOCs analysis showed an active synthesis of volatile compounds during the late stage of ripening, with alcohols being the most abundant compounds for each ripening stage. These results allow us to propose a classification of different ripening stages of the wild blackberry to have a better knowledge of this interesting fruit with higher healthy- and nutraceutical compounds.

1. Introduction

Rubus ulmifolius Schott is a European and North American native perennial-shrub. Nonetheless, their growth is observed in many areas around the globe, including regions in Latin America, such as Brazil and Chile, among others [1]. This species produces edible blackberry fruits, whose main features are the aggregate type, their globose form and at the end of ripening, an acidulated flavor, and black coloration [2,3,4]. In the markets, blackberries are consumed mainly as fresh fruit or as processed products, such as jam, wine, tea, ice cream, desserts, and bakery products [5,6]. In the last decades, the global consumption of berries and berries-based products has increased noticeably for their potential human health benefits [7,8,9]. Until now, it has been well-described that berries are abundant in polyphenolic compounds, which are widely recognized for exhibiting antioxidant and anti-inflammatory properties [9,10,11]. Likewise, the impact and importance of the ripening process on the physicochemical characteristics, nutritional, and bioactive composition, and the antioxidant properties of harvested berry fruits is well described [12,13,14,15,16,17]. Previous studies showed that, during ripening, anthocyanin pigments, antioxidant capacity, total soluble solids, and sugars tend to increase. Conversely, titratable acidity and pH tend to decrease, as long as for non-anthocyanin phenolics and minerals a specific trend was not found.
In addition, little is known about the nutritional attributes, polyphenolic compounds, and antioxidant capacity at different ripening stages of the fruits in R. ulmifolius. In general, the berries of the genus Rubus have been highlighted as an important source of bioactive and health-promoting constituents [16]. To date, different studies have been published on the topic [10,16,18,19], and all of these studies were carried out with fruits grown outside of the Americas. In this line, Schulz et al., (2015) [16] described the chemical composition, phenolic compounds, and antioxidant capacity in the last two stages of ripening. Now, we have expanded the description to include the previous stages of fruit ripening. Thereby, the information about the chemical and bioactive composition of R. ulmifolius opens the gates for investigating the differences with other berries to encourage its cultivation in South American countries. Thus, this study aimed to propose the classification of the different developmental and ripening stages of wild blackberry (R. ulmifolius) fruits. To do so, we studied the color, antioxidant capacity, phenolic contents, and volatile organic compounds (VOCs) of the berries. A better understanding of the developmental and ripening stages of R. ulmifolius Schott will enable us to identify the best stage for nutritional and bioactive uses.

2. Material and Methods

2.1. Fruit Samples

Fruits from R. ulmifolius Schott were harvested from shrubs grown in an orchard in San Rafael, Maule Region, Chile (latitude 35°19′00″ S; longitude 71°32′00″ W). The harvested fruits were immediately transported under cold conditions in containers with dry ice, keeping the fruit between 4 to 8 °C until their arrival at the laboratory (Multidisciplinary Agroindustry Research Laboratory) in the U. Autónoma de Chile, at a distance of about 15 km from the harvest site. The fruits were preliminary classified into four different developmental stages according to weight and fruit color (Figure 1 and Figure S1). The different stages were named: large green fruit (LG); turning fruit (T); 50% black fruit (50%R); and ripe fruit (R). A total of 50–80 fruits were collected from each developmental stage in two growing seasons (during the summer of 2019 and 2020). The fruits of the four ripening stages were collected from 20 different plants (five or six berries of each stage per plant were obtained). Each fruit was frozen in liquid nitrogen and stored at 80 °C until further use.

2.2. Physiological Parameters Determination

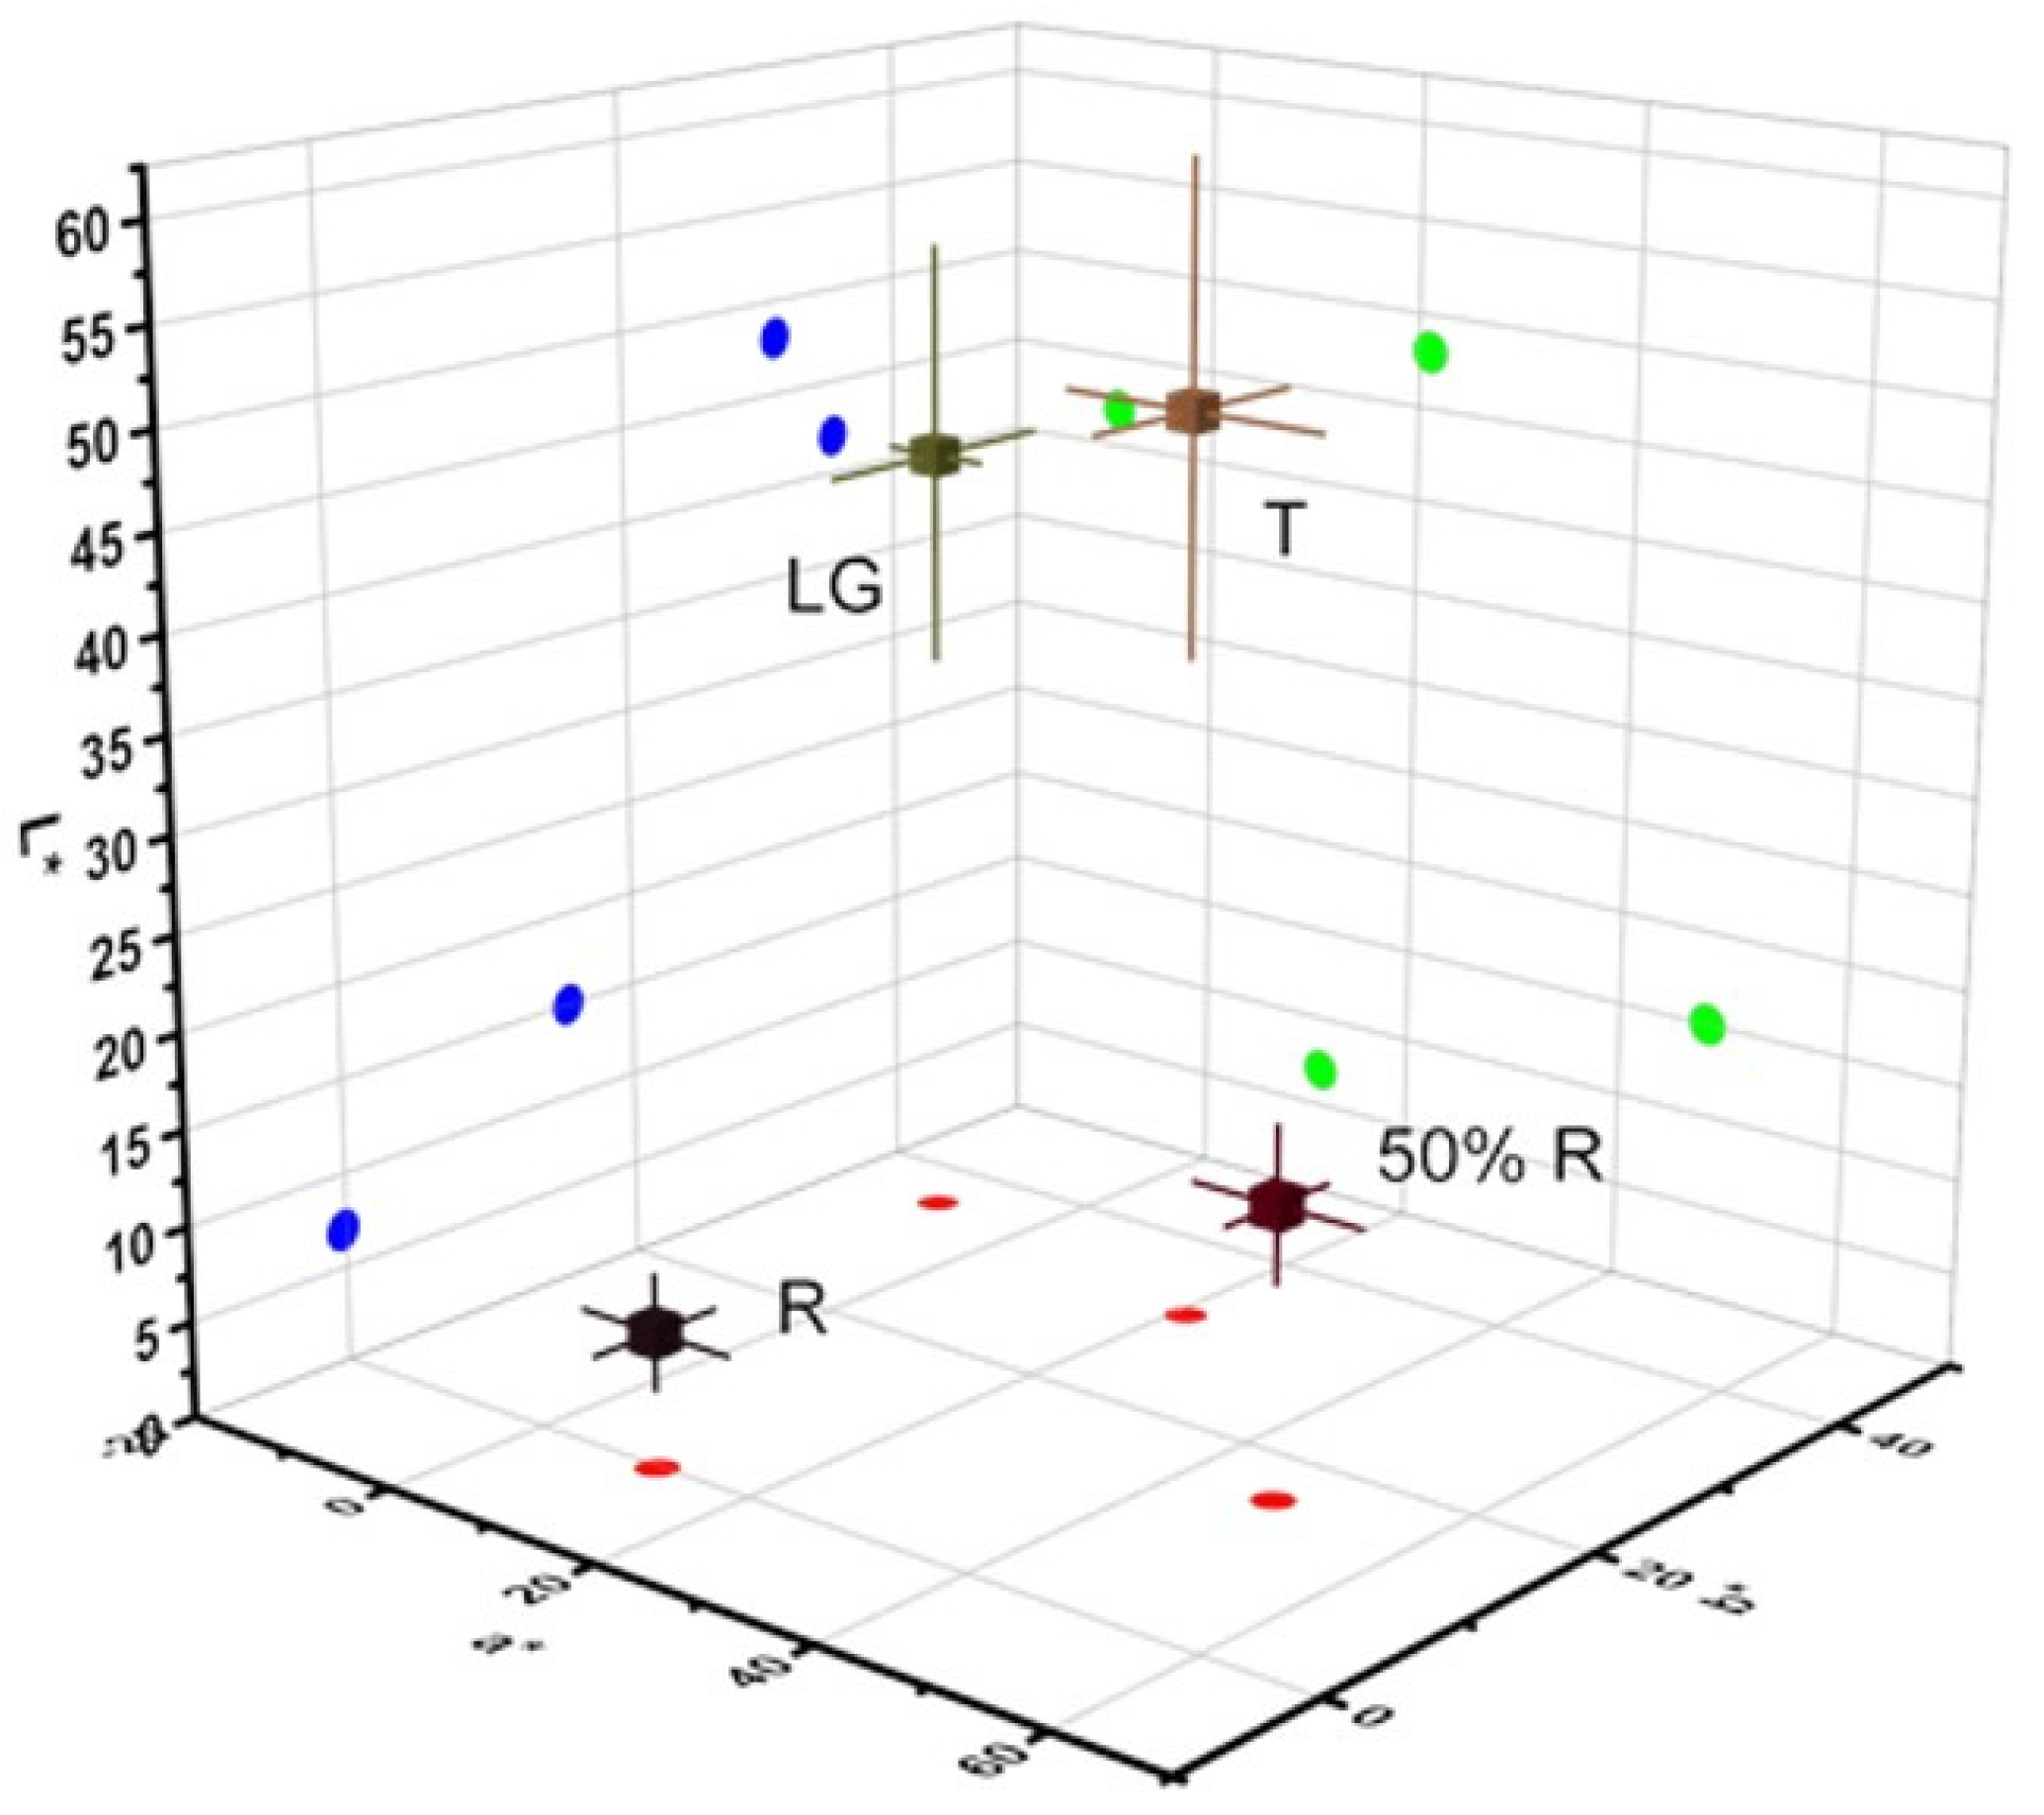
Twenty fruits from four development stages without external damage were examined for skin fruit color. The surface color of the different fruits was characterized (six replicates on three different fruit regions) using a Nix Pro 2 Color Sensor (Nix Sensor Ltd., Hamilton, ON, Canada) and expressed in terms of the Hunter scale (L*, a*, b*). The schematic representation of the CIELAB color system was obtained by a Nix Color converter (https://www.nixsensor.com/free-color-converter/ accessed on 25 January 2022). Color changes were expressed as ΔE* according to the following formula (see Equation (1)):
Δ E * = (   Δ L * 2 + Δ a * 2 + Δ b * 2   ) 1 / 2
where ΔL*, Δa*, and Δb* represent the differences between the initial and final values of L*, a*, and b*, respectively, and the determination of color change (Table 1).
Additionally, berry weight (g) and size (length at the equatorial area, expressed as mm) were analyzed. The pH, soluble solid content (SSC), and titratable acidity (TA) were measured in the juice from 2 g of frozen tissue from each replicate. The tissue was ground with liquid nitrogen, homogenized in 5 mL distilled water, and filtered through miracloth. The pH was measured using a pH meter (model pH 20, HANNA Instruments, Woonsocket, RI, USA). The SSC was determined using a hand-held temperature-compensated refractometer (Atago, Tokyo, Japan) and expressed as °Brix. TA was determined by diluting the remaining juice in distilled water (1/10, v/v) and titrating an aliquot of 13 mL with 20 mM NaOH to pH 8.2 with a digital burette (Jencons, London, UK), and it was expressed as g of citric acid per 100 g of fresh weight (FW). The results of the TA and SSC were expressed as the SSC/TA ratio, according to Ramos et al., (2018) [21].

2.3. Total Antioxidant Capacity

To determine the antioxidant capacity, methanol extracts were tested for their radical scavenging ability based on a 1,1-diphenyl-2-picrylhydrazyl (DPPH) discoloration assay [22] with the modification described to Castro et al. (2018) [23]. The reaction mixtures were in triplicate and were measured at 517 nm in an Infinite® 200 PRO NanoQuant spectrophotometer (BioTek Instruments, Inc., Winooski, VT, USA). The scavenging of the DPPH radical was evaluated by a comparison with a negative control group (DPPH with methanol).
Additionally, the ferric-reducing antioxidant power (FRAP) analysis was performed according to Benzie and Strain (1996) [24] and modified by Castro et al., (2018) [23].

2.4. Phenolic Composition

Three independent extractions from 10 g of the complete fruit tissue were carried out for blackberry fruit from each stage. The obtained extracts were used to determine the total phenolic content (using the Folin–Ciocalteu reagent and expressed as gallic acid equivalents), anthocyanin content (using a pH differential method and expressed as cyanidin-3-O-glucoside equivalents), and flavonoids content (using the aluminum chloride method, which quantifies flavonols and flavones, and expressed as quercetin equivalents), according to the methodology described in Parra-Palma et al., (2020) [25].

2.5. Volatile Organic Compounds (VOCs) of R. ulmifolius Schott Fruits

The volatile compound profiles of three different ripening stages (LG, 50%R, and R samples) of R. ulmifolius Schott fruit were analyzed in triplicate according to [25,26,27] with some modifications using a pool of fruits corresponding to a mixture of both seasons. Around 3 g of berries (20–23 fruits for LG stage, 5–7 fruits for 50%R stage, and 3 fruits for R stage) were placed in a 50 mL centrifuge tube, besides 5 mL of ultrapure water and 10 μL of 4-methyl-2-pentanol (0.75 mg·L−1) were employed as internal standard. The mixture was crushed by using an Ultra-Turrax™ homogenizer for 2 min. The homogenate was placed in a 20 mL glass vial capped with a septum and subjected to an incubation process for 20 min at 45 °C with agitation at 500 rpm, carried out in an MPS Autosampler (Gerstel, Palo Alto, CA, USA). Then, the selected SPME fiber (2 cm 50/30 μm Carboxen/Divinylbenzene/Polydimethylsiloxane (Supelco, Bellefonte, PA, USA)) was placed into the headspace of the vial for 40 min. Afterward, the desorption was carried out in the injector in the splitless mode for 3 min, with a transfer line temperature of 280 °C. The gas chromatography analysis was carried out in a 7890B Agilent GC system coupled to an Agilent 5977 quadrupole inert mass spectrometer (Agilent Technologies, Palo Alto, CA, USA), equipped with a DB Wax capillary column (60 m × 0.25 mm, and 0.25 μm film thickness) (J&W Scientific, Folsom, CA, USA) and using helium as the carrier gas (flow rate 1 mL·min−1). All data were recorded and processed by using the MS ChemStation software (Agilent Technologies, Palo Alto, CA, USA). The identification of the compounds was carried out by employing authentic standards when available, as well as by comparing the mass spectra obtained from each molecule with the reference spectra of the NIST 98 software library, and with the data from the literature. The results were expressed as the relative area of the target ion of each compound respecting the area of the target ion of the 4-methyl-2-pentanol (internal standard).

2.6. Statistical Analysis

For the statistical analysis, one-way ANOVA was used. The normality of the data was confirmed before the ANOVA test. Tukey’s HSD multiple comparisons analysis was performed to evaluate significant differences between treatments. All analyses were performed using GraphPad Prism 8 (GraphPad Software Inc., San Diego, CA, USA).

3. Results

3.1. Fruit Development Parameters

Given that the developmental and ripe stages of blackberry fruit have not been previously described, four developmental and ripening stages were established according to the fruit weight and the color of the fruits (Figure 1 and Figure S1). Stages LG and T corresponded to unripe and hard fruit; stages 50%R and R corresponded to color-breaker and ripening fruit, respectively (Figure 1), this characteristic being consistent in the two seasons analyzed (see Figure 1 and Figure S1).
Firstly, the change in color using the CIELAB color system were analyzed, the lightness (L*), redness (a*), and yellowness (b*) of four different wild blackberry fruit stages in the two seasons (Table 2 and Figure 2) were determined according to Parra-Palma et al. [25]. During ripening, color changes were measured for berries at different ripening stages, however between the different seasons in the same stage, no statistical differences are observed (Table 2). The results show that there are color differences throughout the ripening stages, and these changes are consistent with a decrease in chlorophyll and an increase in anthocyanins [21]. The berry is an aggregate of small drupelets in the blackberry fruits that changes color from green to black during ripening (Table 2). In this form, differences in fruit color during the development and ripening of blackberry fruits were characterized by a decrease of L* and b* coordinates along with an increase of the a* value among LG, T, and 50%R stages, followed by a decrease between 50%R and R. The major differences between the stages were observed in the 50%R stage, which can be explained by the bicolor peel of the fruit (including red and yellow parts) (Table 2).
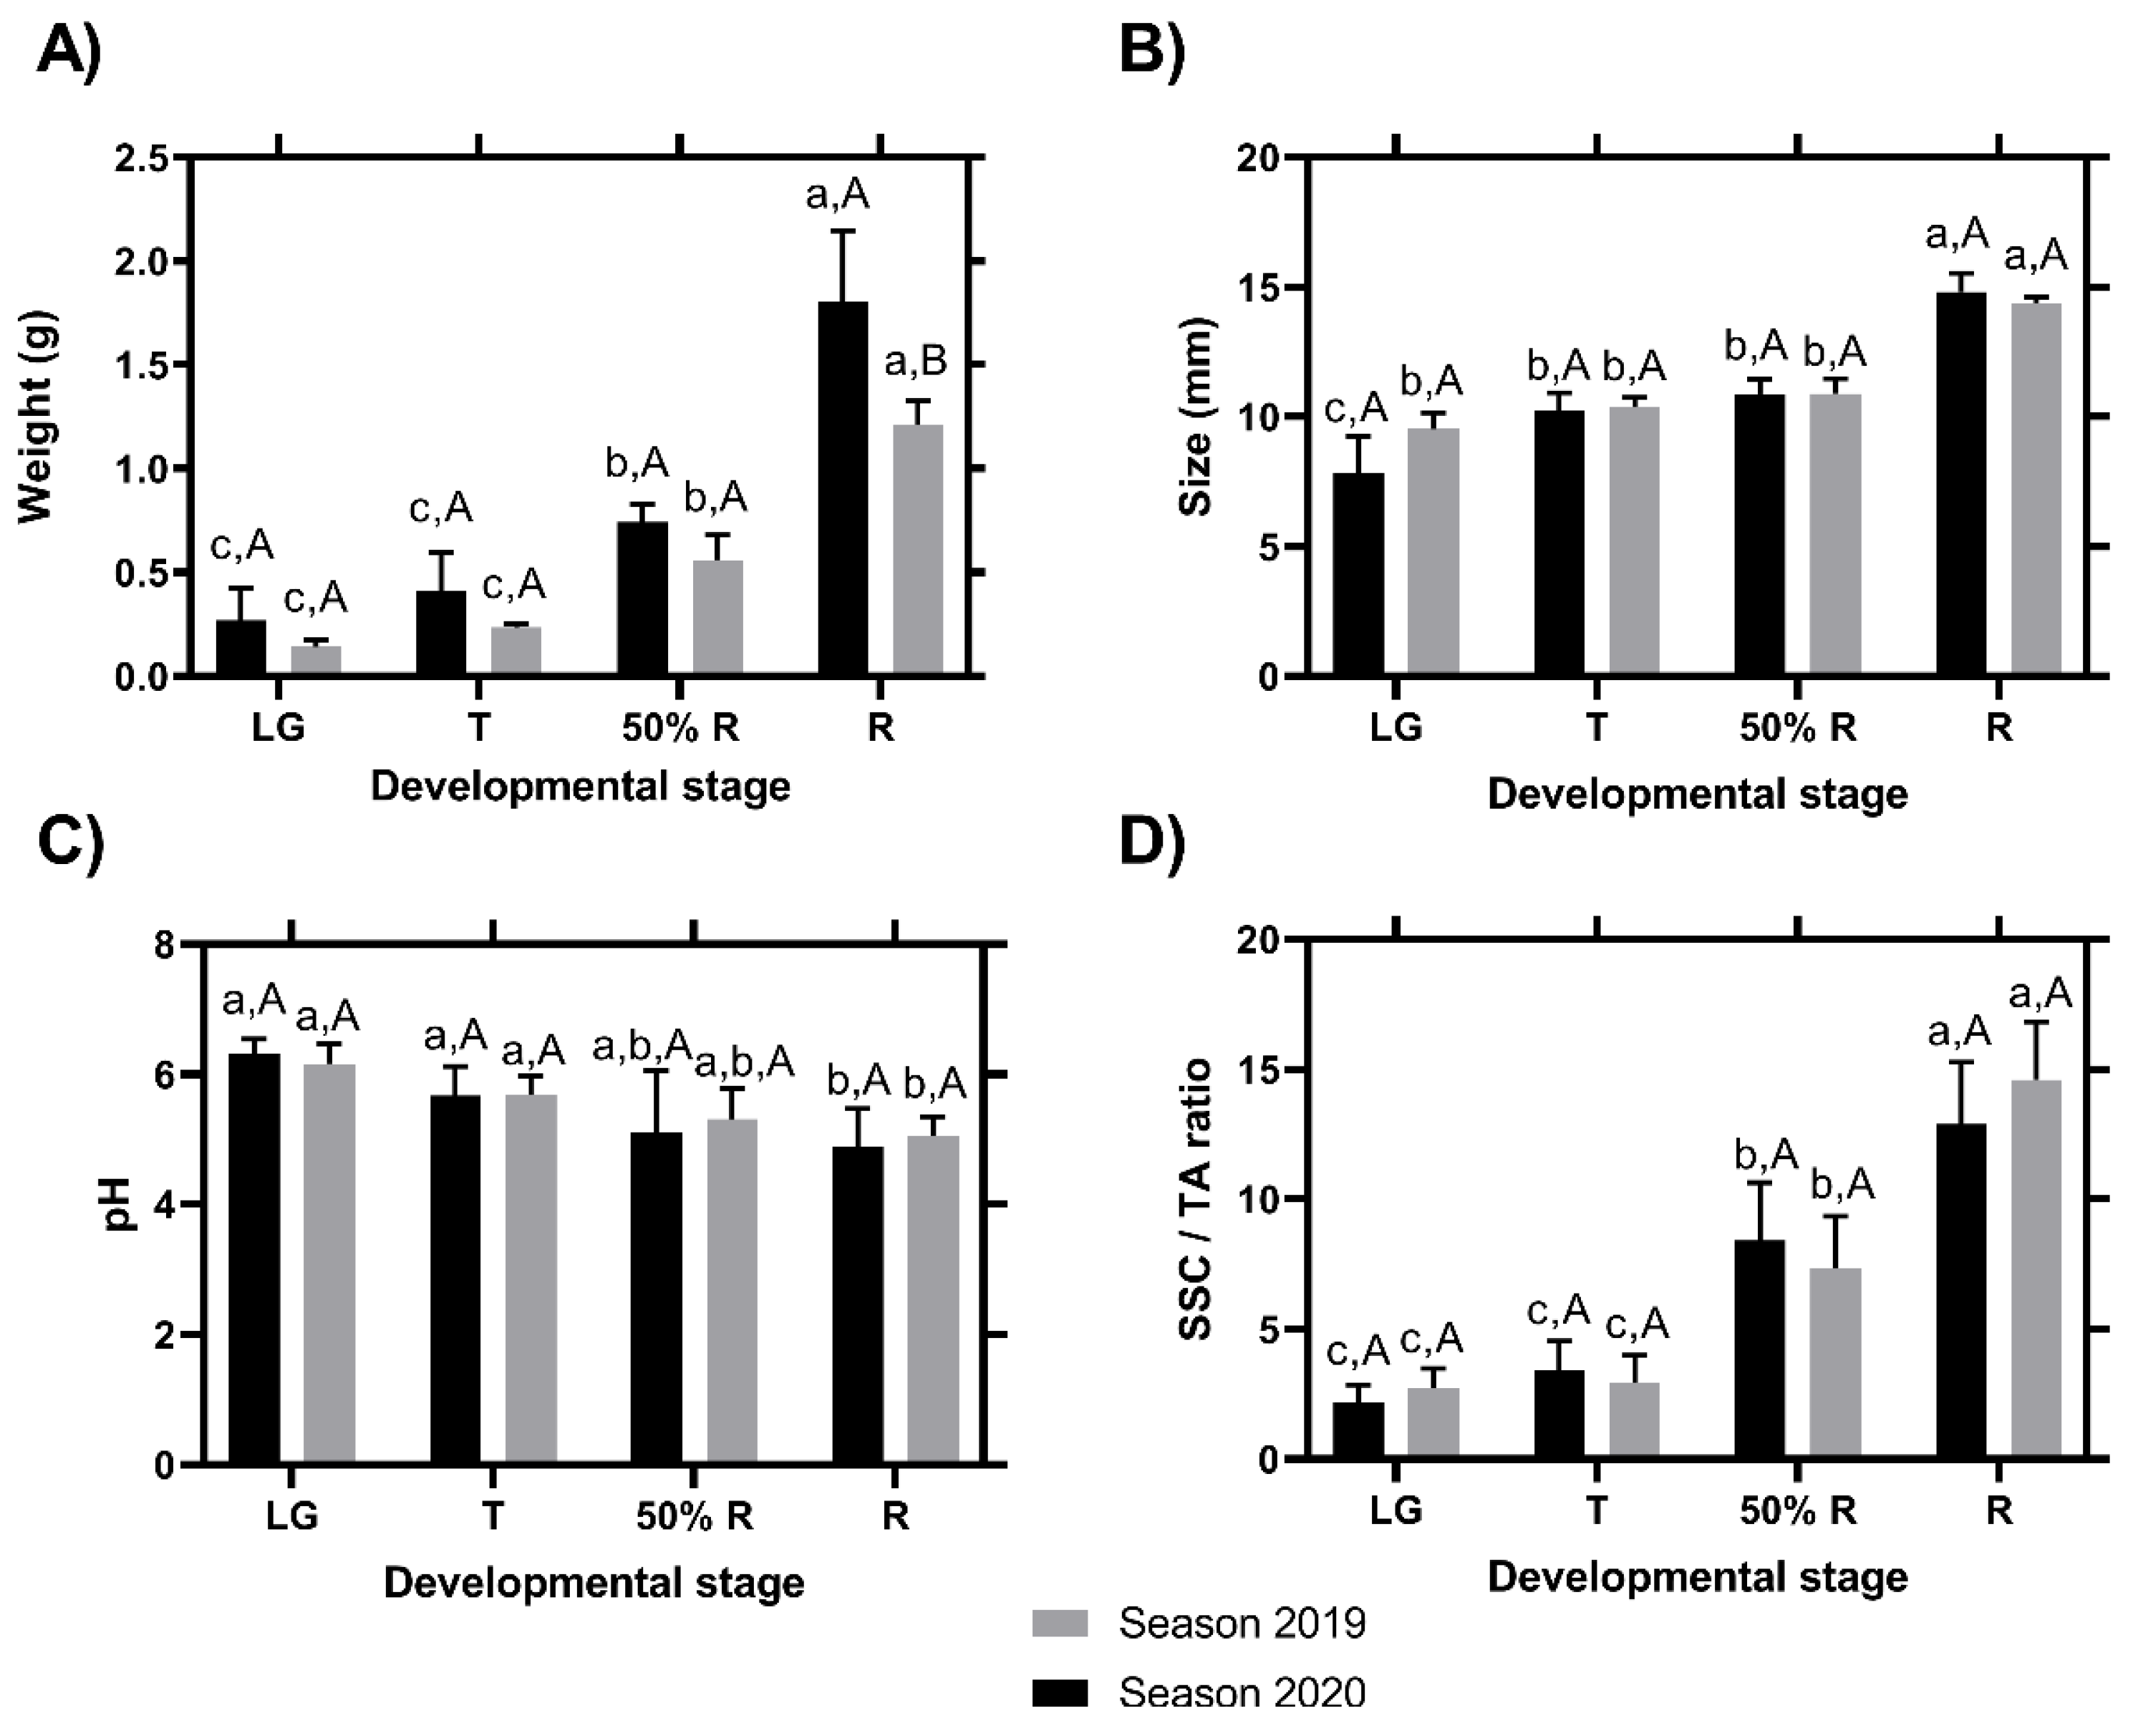
Regarding the fruit weight, the results showed a constant increase between the different ripening stages, without differences between the two seasons in the three first development stages; however, in the ripe stage, the fruit of the season 2020 were larger than those of the 2019 season (Figure 3A). The size of the fruits in each stage was evaluated at the equatorial area and showed significant differences between R and LG stages in the two seasons, and significant differences between LG and T stages only in the 2020 season (Figure 3B, lower letters). However, between the seasons, it was not possible to find differences within each ripening stage (Figure 3B, capital letters). pH values showed a decrease during fruit development in the two seasons (Figure 3C). Concerning SSC/TA, the values showed an increase during the change of the fruit development stages (specifically T stage) with respect to the ripening stages (specifically 50%R stage) (Figure 3D), in both seasons.

3.2. Phenolic Composition

Phenolic content from blackberry fruits was determined at the four stages of development for two contiguous seasons. The highest total phenolic content was found in the LG stage, while the R stage showed the lowest phenolic content independent of the season evaluated (Figure 4A). According to this result, for the colorless flavonoids (mainly flavonols and flavones), the content was highest at the LG stage in the two seasons (Figure 4B). Interestingly, no differences were found in the flavonoid content of fruit between the two latest developmental stages (50%R and R stages) in the season of the 2020, while in the season 2019, significant differences were found between 50%R and R stages (Figure 4B). Anthocyanins were not detected in LG samples in any of the two seasons, but a significant increase of these compounds was observed throughout maturity, reaching the maximum anthocyanin content at the R stage (Figure 4C).

3.3. Antioxidant Capacity

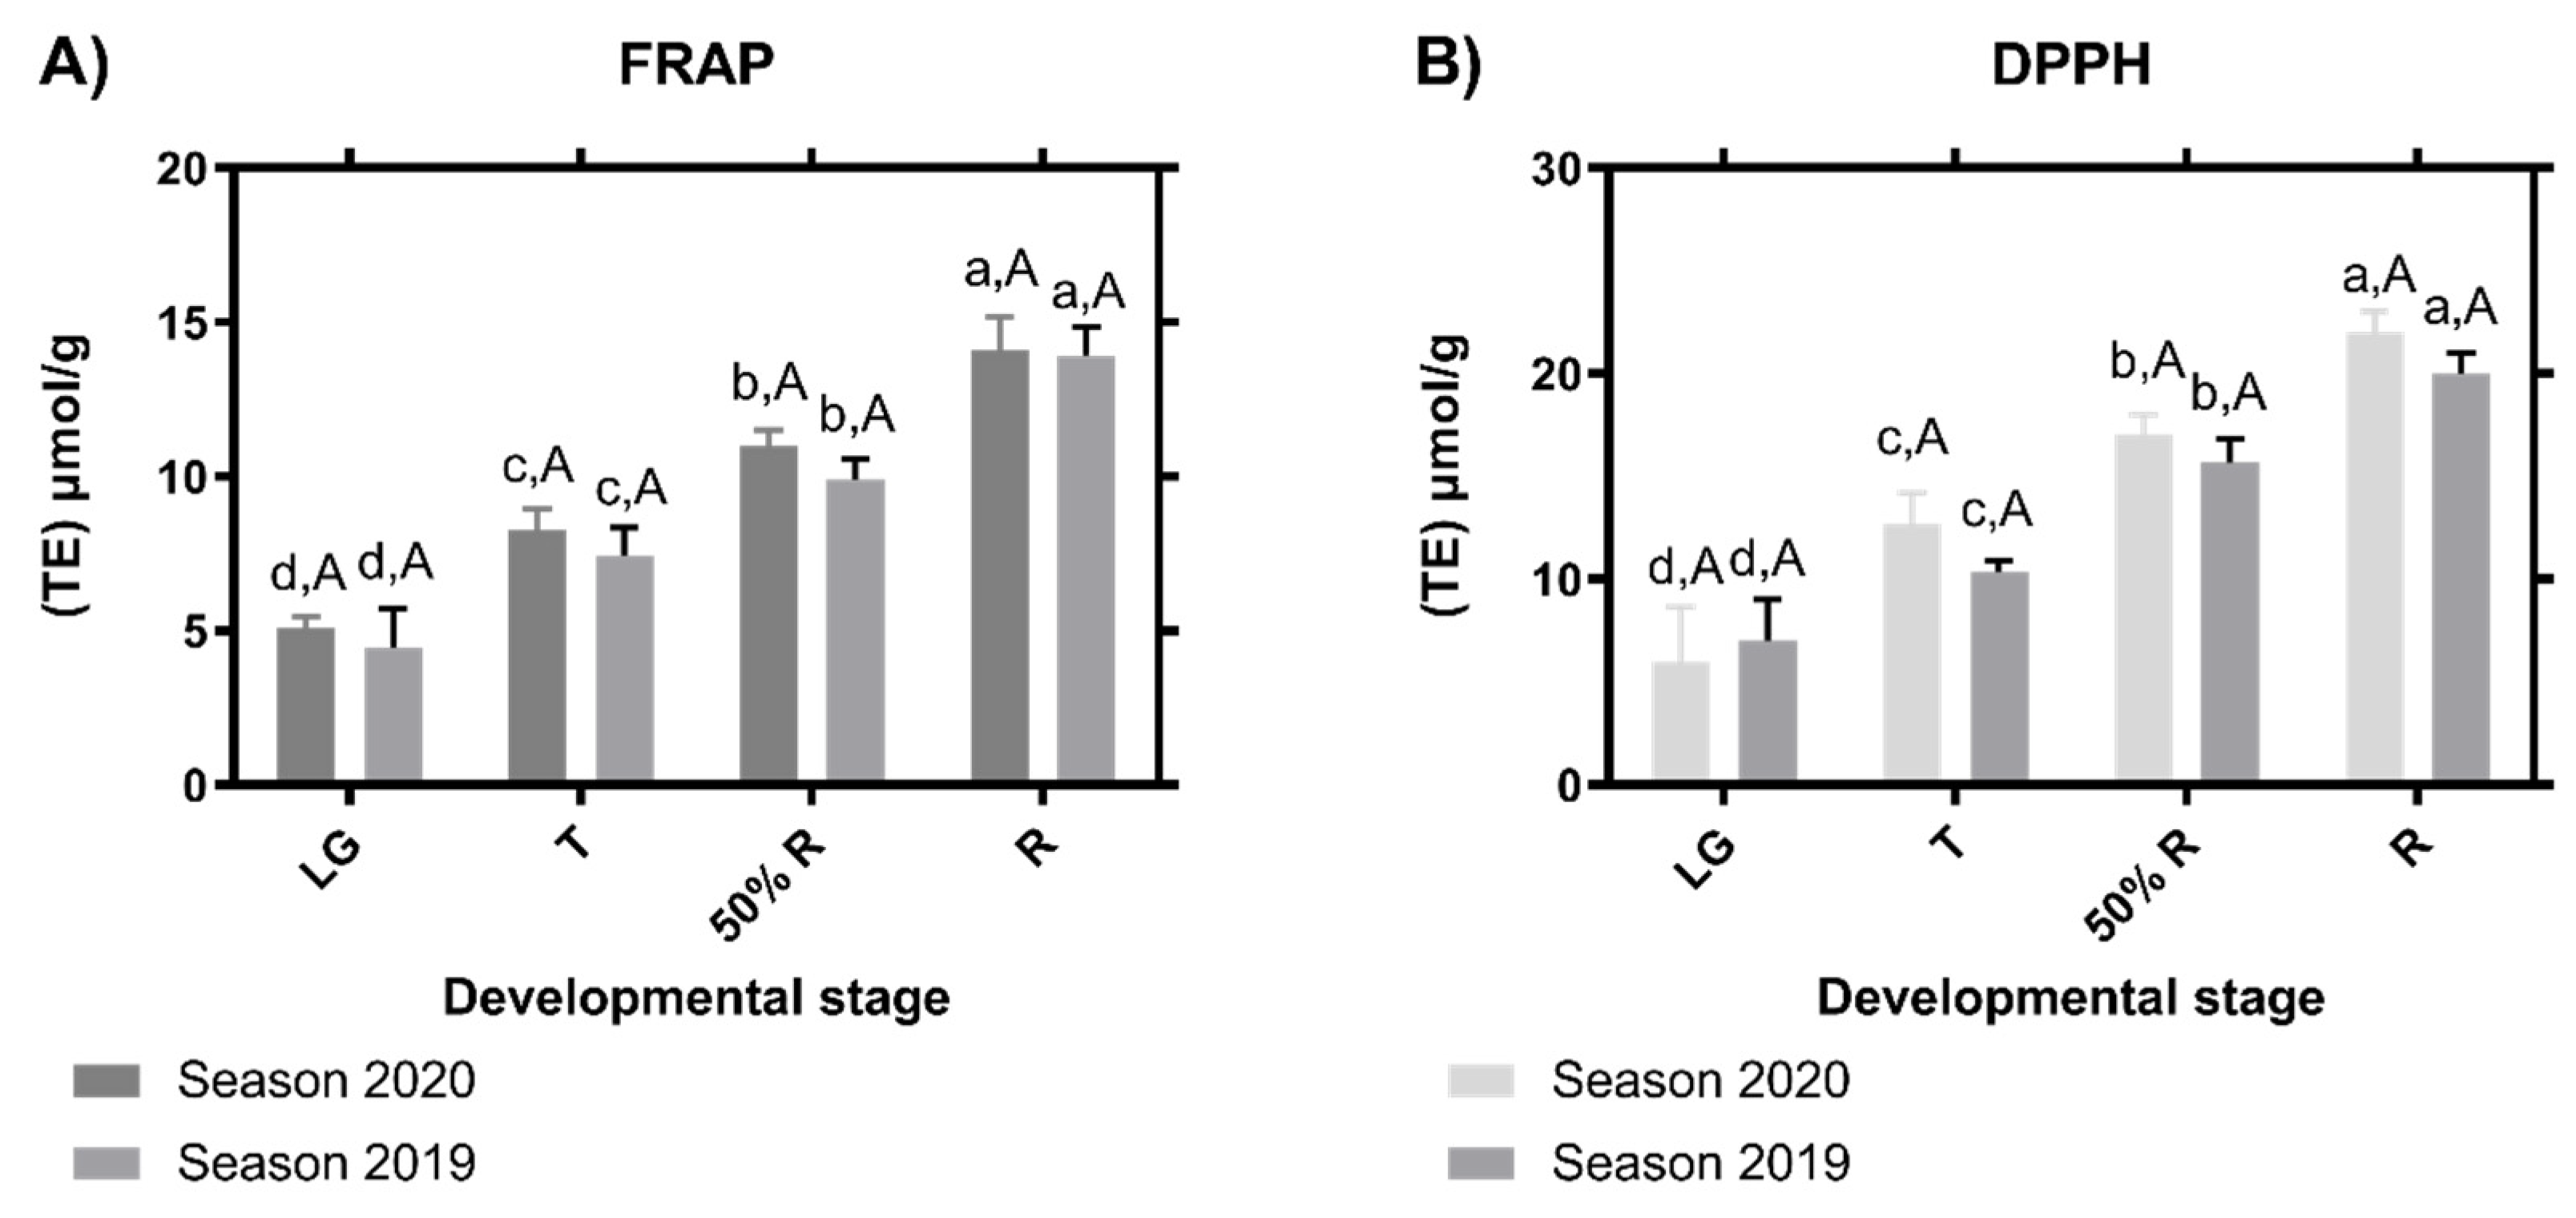
The antioxidant capacity of the different ripening stages was determined using two different approaches: the free radical scavenging assay (DPPH) and the ferric reducing antioxidant power (FRAP) (Figure 5). Regardless of the employed method, the antioxidant capacity increases through fruit development, being the R stage, which displays the highest antioxidant capacity for the two seasons evaluated (Figure 5).

3.4. Determination of VOCs of R. ulmifolius Schott Fruits

The volatile compounds profiles of blackberries at LG, 50%R, and R ripening stages were determined from a mix of both seasons at each stage by HS-SPME-GS-MS. A total of 33 different volatile compounds were identified (Table S1), among them: nine aliphatic alcohols, three branched alcohols, six aldehydes, two ketones, six terpenoid compounds (including β-myricene, D-limonene, β-linalool, L-α-terpineol, sulcatol, and sulcatone), four compounds containing a benzene-ring (including methoxyphenyl oxime, methyl salicylate, benzyl alcohol, and phenylethyl alcohol), besides ethyl octanoate (an ester), 2-methylbutanoic acid (a carboxylic acid), and 2-ethylfuran (a cyclic ether). The volatile compounds analyzed were grouped as follows (Table 3): aliphatic alcohols, branched alcohols, aldehydes, ketones, terpenoids, and benzenoids, related to their biosynthetic pathways in plants, summarized below. Briefly, the aliphatic alcohols, aldehydes, ketones, acids, and esters are biosynthesized through the oxidation pathway of fatty acids. The branched alcohols came from the amino acid degradation pathways, as occurs with the benzenoid compounds. Finally, the terpene compounds are biosynthesized from carbohydrates through the terpenoid pathway (Schwab, Davidovich-Rikanati and Lewinsohn, 2008).
When the results are expressed as relative areas (R.A.) per g of berry, the samples from the LG stage contain the highest amount of benzenoids, aldehydes, and alcohols, when compared with the 50%R and R stages. For terpenoid compounds and ketones, in contrast, the amount of LG samples did not differ statistically from the R-stage samples. Such a decrease in the main volatile contents throughout ripening is related to a dilution effect due to the increasing volume of the blackberries that occurs within the same period. By contrast, when the results are expressed as per berry basis, the highest amount of terpenoids, aldehydes, ketones, and aliphatic alcohols is observed for samples at the R stage, while no statistical differences were found for benzenoids and branched alcohols among the ripening stages. Such results seem to indicate that the terpenoid pathway, as well as the oxidation pathway of fatty acids (where aliphatic compounds came from), is active during the late stages of ripening. In contrast, it seems that the degradation of amino acids pathways (where the benzenoid compounds and branched alcohols came from) are poorly active at the end of the ripening process.
Given that aliphatic alcohols, aldehydes, and ketones showed statistical differences during ripening, a deeper analysis of the results was performed according to their backbone, as shown in Figure 6. The compounds accounting for five carbon atoms decrease throughout ripening, both when analyzed on a per gram and per berry basis, which seems to indicate that C5 compounds are degraded or employed as precursors for building more complex molecules and that this phenomenon is more intense than its biosynthesis. In contrast, C6 and C7 compounds decrease during the early stages of maturation when analyzed on a per g basis, probably due to the dilution provoked by the size increase of fruits. However, when the same C6 and C7 compounds are analyzed per berry, the ripe berries (R stage) showed the highest contents, which indicates that their biosynthesis is active during the late stage of ripening. Finally, C8 compounds showed higher variability, and no statistical trend was observed throughout maturation.
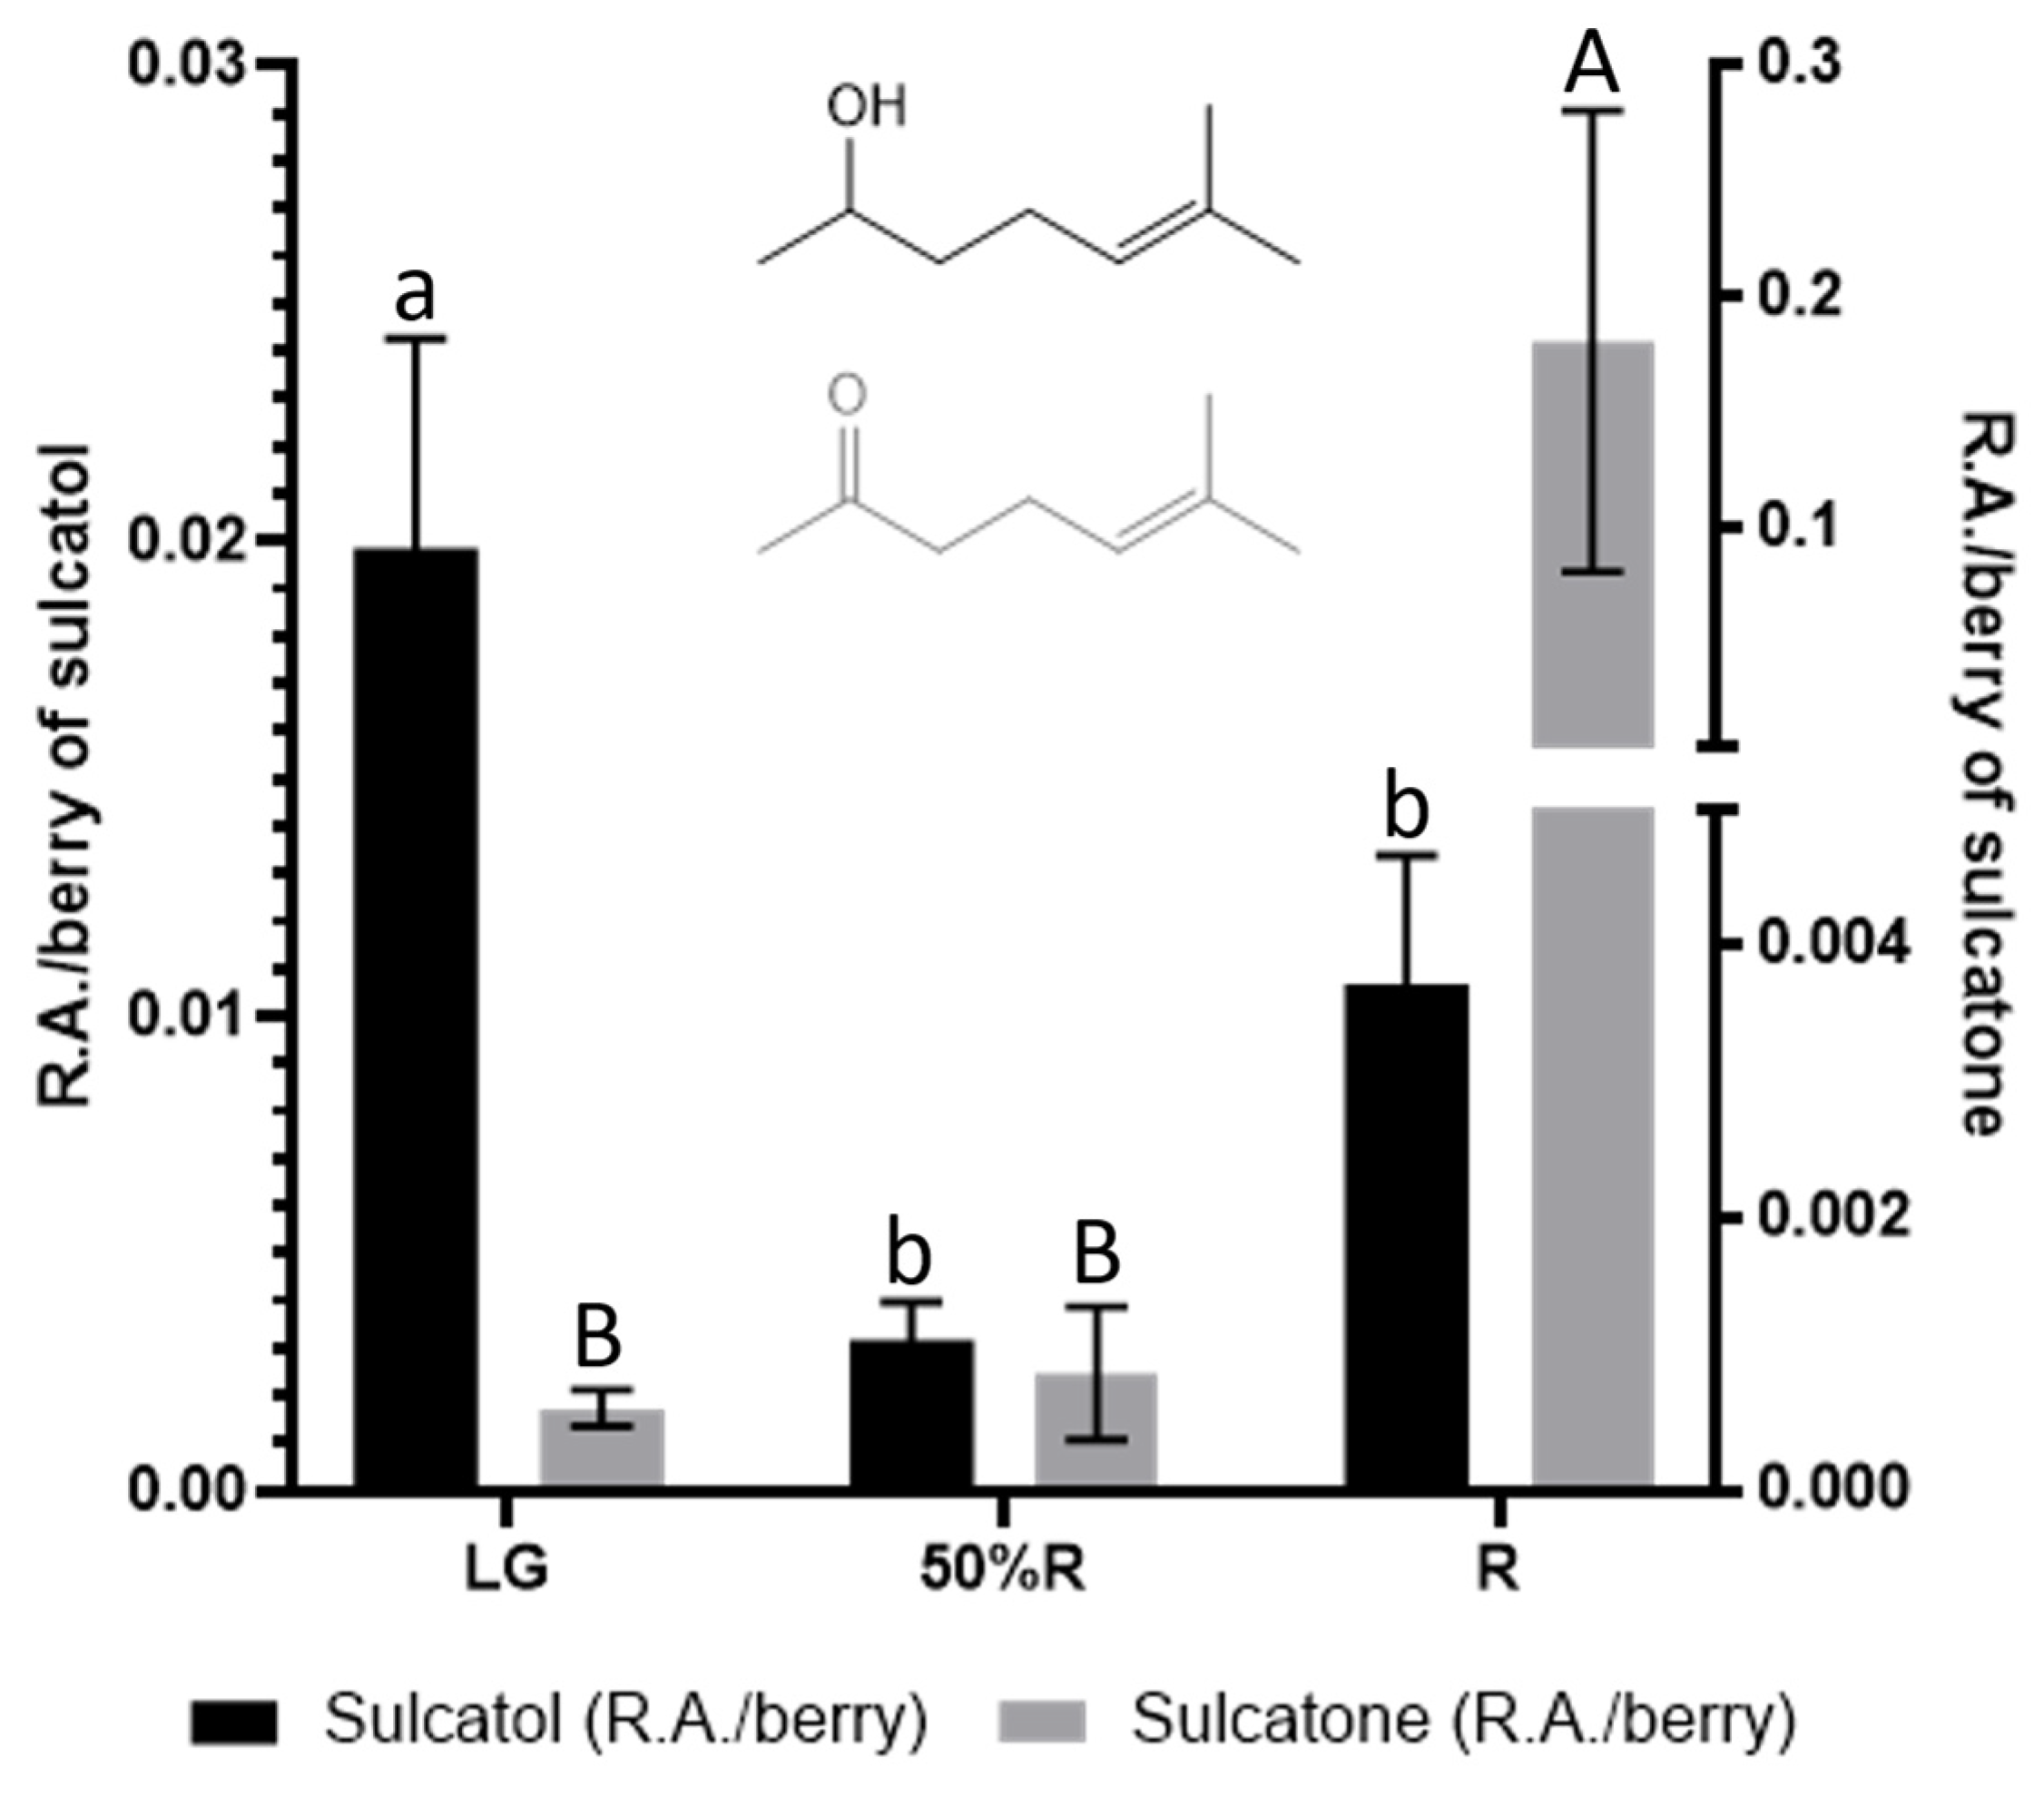
Regarding volatile compounds, the evolution of sulcatol and sulcatone throughout blackberry maturity is also interesting. Such compounds can be found in all eukaryotes, and they have been described as insect and animal pheromones. Sulcatol and sulcatone have been described as insect attractors in grain cultivars (Liu et al., 2008). The interconversion between both compounds is catalyzed by sulcatone reductase, with the involvement of NADH/NAD+. As shown in Figure 7, a huge increase of sulcatone occurs during the last stage of ripening, while sulcatol contents are higher for unripe blackberries.

4. Discussion

During the last years, an increasing interest has grown from consumers concerning food safety and quality, demanding more natural and healthy food products [28,29]. In this regard, a growing interest has been observed in wild berries species that, in many cases, are considered as invader species. Based on this and given that these species do not need specific cultivation conditions, they can be considered a good resource for food and nutraceutical companies [30,31]. Thus, wild blackberry (R. ulmifolius) could be a great candidate for this purpose. However, the fruit’s developmental process has not been previously described. For this reason, we have described for the first time a classification of four different stages of development and ripening in wild blackberry fruit (Figure 1). In this sense, it is possible to observe how the fruit’s physiological parameters change during the different stages (Figure 1), showing important variations in weight (Figure 3A), size (Figure 3B), and skin fruit color (Table 2). Color is a very important parameter in the food industry, and the visual aspect of fruit is an important factor for consumer acceptance. The wild blackberry fruits in the R stage display similar color values to those previously described at ripeness [30,32]. L* is the coordinate that represents lightness, ranging from white (100) to black (0). For wild blackberry fruits, the values of the L* showed changes from 42 to 7.3 from the LG stage to R stage (Table 2). This value is closer to the black range compared to the values described by da Silva et al., (2019) [30] that showed values of 19.7 at the L* coordinate. Concerning a*, the value represents the chromatic axis from green (−) to red (+), which, in this case, shows negative values in the LG stage and small positive values in the R stage (Table 2). Unfortunately, the color values of the developmental stages before the R stage cannot be compared with other studies because, almost to our knowledge, these analyses were not performed by other authors.
Concerning the chemical composition, several studies analyzed different aspects of phenolic content, nutrient, and aroma profiles in blackberry [11] flowers [33], and fruits [18], but none of them provide a detailed classification of different fruit ripening stages of R. ulmifolius. For this reason, we describe a dynamic performance of the total phenols (Figure 4A) and total flavonoids (Figure 4B), including flavonols and flavones. The profile of the total phenols and flavonoids showed a decreasing trend throughout fruit ripening, showing the highest content fruits from the LG stage. However, no differences were found in the flavonoid content of fruit between the two latest developmental stages (50%R and R stages) in the season of 2020, while in the season of 2019, significant differences were founded between 50%R and R stages (Figure 4B). Interestingly, Parra-Palma et al., 2020 [25] showed that total phenols decrease in a directly proportional way with the firmness, while it shows a statistically inverse relationship with respect to the weight of the fruit as it matures, this was described in four different strawberry cultivars. Therefore, these data are in line with what was previously described by the authors. Additionally, despite this difference between the two seasons, the tendency for these compounds to decrease as the fruit matures remains a characteristic of the fruit, which is not new, since it has been previously described for other fruits [25,34].
Additionally, the antioxidant capacity of the different developmental stages of wild blackberries was determined by the ferric reducing antioxidant power (FRAP) and the free radical scavenging assay (DPPH) (Figure 5). Both methods were related to the Trolox equivalent (TE), and, depending on the method used, differences in the values were observed; however, both methods showed a similar trend, being fruits at the R stage that display the highest antioxidant capacity (Figure 5). In this context, the chemical composition, antioxidant, and health promoting constituents of Rubus berries are previously described in the ripe stage of R. ulmifolius [10,16,34,35,36,37,38] or in the late ripening stages [38]. Regarding the R. ulmifolius leaves, Tabarki et al., (2017) [39] found kaempferol-3-O-rutinoside and naringenin as dominant phenolic compounds, while Ali et al., (2017) [40] related flavonoids, tannins, alkaloids, and steroids in R. ulmifolius aerial parts.
Finally, the volatile compounds profile of Rubus ulmifolius Schott fruits accounts mainly for branched and aliphatic alcohols, aliphatic carbonyl compounds (aldehydes and ketones), terpenoid compounds, and benzenoid compounds. In general terms, the content of volatile compounds per gram of tissue decreases dramatically during the first stages of ripening, probably due to the increase in berry size that dilutes the solutes. In contrast, the content of volatile compounds per berry increases towards the end of ripening, which indicates an active biosynthesis of a volatile nature within this period (Table 3).

5. Conclusions

In this work, we characterized four different stages of wild blackberry (R. ulmifolius) that showed a constant increase in size and weight. Total phenols and flavonoids showed a decreasing trend during maturation, while antioxidant capacity and anthocyanin content increased throughout ripening. Finally, an active synthesis of volatile compounds was observed for the late stages of ripening for Rubus ulmifolius Schott fruits, although the dilution was due to the increase of berry size when the results are expressed on a per gram of tissue basis.

Supplementary Materials

The following supporting information can be downloaded at: https://www.mdpi.com/article/10.3390/horticulturae9010013/s1. Figure S1: Different ripening stages of R. ulmifolius Schott fruits; Table S1: Volatile compounds content (expressed in relative area) from three different R. ulmifolius Schott fruits stages.

Author Contributions

P.R., M.G.I.C. and L.M.-Q. designed the experiments; R.I.C., P.R., C.P.-P., M.G.I.C. and L.M.-Q. performed the experiments; P.R., C.V.-R., M.G.I.C. and L.M.-Q. analyzed the data; C.V.-R. and L.M.-Q. wrote the first manuscript version; R.I.C., P.R., M.G.I.C. and L.M.-Q. reviewed the manuscript. All authors have read and agreed to the published version of the manuscript.

Funding

The Agencia Nacional de Investigación y Desarrollo (ANID, Chile) [grants REDES #190093 to LM-Q; FONDECYT #1220782 to LM-Q; REDES #190078 to PR; FONDECYT #1211057 to PR; ANILLO #ATE220014 to LM-Q, PR, and MG; and FONDEQUIP #EQM130129] supported the work. The funders had no role in study design, data collection and analysis, decision to publish, or preparation of the manuscript.

Acknowledgments

The authors acknowledge Jaime Andres Parra for their support in harvesting the fruits and allowing access to the orchard.

Conflicts of Interest

The authors declare no conflict of interest.

References

  1. Martins, A.; Barros, L.; Carvalho, A.M.; Santos-Buelga, C.; Fernandes, I.P.; Barreiro, F.; Ferreira, I.C.F.R. Phenolic extracts of Rubus ulmifolius Schott flowers: Characterization, microencapsulation and incorporation into yogurts as nutraceutical sources. Food Funct. 2014, 5, 1091–1100. [Google Scholar] [CrossRef] [PubMed]
  2. Lorenzi, H.; Bacher, L.; Lacerda, M.; Sartori, S. Frutas Brasileiras e Exóticas Cultivadas; Instituto Plantarum de Estudos da Flora: São Paulo, Brazil, 2006; p. 672. [Google Scholar]
  3. D’Agostino, M.F.; Sanz, J.; Sanz, M.L.; Giuffrè, A.M.; Sicari, V.; Soria, A.C. Optimization of a Solid-Phase Microextraction method for the Gas Chromatography–Mass Spectrometry analysis of blackberry (Rubus ulmifolius Schott) fruit volatiles. Food Chem. 2015, 178, 10–17. [Google Scholar] [CrossRef] [PubMed] [Green Version]
  4. Oszmiański, J.; Nowicka, P.; Teleszko, M.; Wojdyło, A.; Cebulak, T.; Oklejewicz, K. Analysis of Phenolic Compounds and Antioxidant Activity in Wild Blackberry Fruits. Int. J. Mol. Sci. 2015, 16, 14540–14553. [Google Scholar] [CrossRef] [PubMed] [Green Version]
  5. Bowen-Forbes, C.S.; Zhang, Y.; Nair, M.G. Anthocyanin content, antioxidant, anti-inflammatory and anticancer properties of blackberry and raspberry fruits. J. Food Compost. Anal. 2010, 23, 554–560. [Google Scholar] [CrossRef]
  6. Zia-Ul-Haq, M.; Riaz, M.; De Feo, V.; Jaafar, H.Z.E.; Moga, M. Rubus fruticosus L.: Constituents, Biological Activities and Health Related Uses. Molecules 2014, 19, 10998–11029. [Google Scholar] [CrossRef] [PubMed] [Green Version]
  7. Nile, S.H.; Park, S.W. Edible berries: Bioactive components and their effect on human health. Nutrition 2014, 30, 134–144. [Google Scholar] [CrossRef]
  8. Padmanabhan, P.; Correa-Betanzo, J.; Paliyath, G. Berries and Related Fruits. In Encyclopedia of Food and Health; Caballero, B., Finglas, P.M., Toldrá, F., Eds.; Academic Press: Cambridge, MA, USA; Oxford, UK, 2016; pp. 364–371. [Google Scholar]
  9. Castro, R.I.; Ramos, P.; Parra-Palma, C.; Morales-Quintana, L. Ugni molinae fruit as a source of bioactive compounds with good quality traits. BioMed Res. Int. 2021, 2021, 6683877. [Google Scholar] [CrossRef]
  10. Ahmad, M.; Masood, S.; Sultana, S.; Ben Hadda, T.; Bader, A.; Zafar, M. Report: Antioxidant and nutraceutical value of wild medicinal Rubus berries. Pak. J. Pharm. Sci. 2015, 28, 241–247. [Google Scholar]
  11. Van de Velde, F.; Pirovani, M.E.; Drago, S.R. Bioaccessibility analysis of an- thocyanins and ellagitannins from blackberry at simulated gastrointestinal and co-lonic levels. J. Food Compos. Anal. 2018, 72, 22–31. [Google Scholar] [CrossRef] [Green Version]
  12. Tosun, I.; Ustun, N.S.; Tekguler, B. Physical and chemical changes during ripening of blackberry fruits. J. Sci. Agric. 2008, 65, 87–90. [Google Scholar] [CrossRef]
  13. Acosta-Montoya, Ó.; Vaillant, F.; Cozzano, S.; Mertz, C.; Pérez, A.M.; Castro, M.V. Phenolic content and antioxidant capacity of tropical highland blackberry (Rubus adenotrichus Schltdl.) during three edible maturity stages. Food Chem. 2010, 119, 1497–1501. [Google Scholar] [CrossRef]
  14. Gordon, A.; Gil Cruz, A.P.; Cabral, L.M.C.; de Freitas, S.C.; Taxi, C.M.A.D.; Donangelo, C.M.; Mattietto, R.D.A.; Friedrich, M.; da Matta, V.M.; Marx, F. Chemical characterization and evaluation of antioxidant properties of Açaí fruits (Euterpe oleraceae Mart.) during ripening. Food Chem. 2012, 133, 256–263. [Google Scholar] [CrossRef]
  15. Fu, Y.; Zhou, X.; Chen, S.; Sun, Y.; Shen, Y.; Ye, X. Chemical composition and antioxidant activity of Chinese wild raspberry (Rubus hirsutus Thunb.). LWT-Food Sci. Technol. 2015, 60, 1262–1268. [Google Scholar] [CrossRef]
  16. Schulz, M.; Borges, G.D.S.C.; Gonzaga, L.V.; Seraglio, S.K.T.; Olivo, I.S.; Azevedo, M.S.; Nehring, P.; de Gois, J.S.; de Almeida, T.S.; Vitali, L.; et al. Chemical composition, bioactive compounds and antioxidant capacity of juçara fruit (Euterpe edulis Martius) during ripening. Food Res. Int. 2015, 77, 125–131. [Google Scholar] [CrossRef]
  17. Seraglio, S.K.T.; Schulz, M.; Nehring, P.; Della Betta, F.; Valese, A.C.; Daguer, H.; Gonzaga, L.V.; Fett, R.; Costa, A.C.O. Nutritional and bioactive potential of Myrtaceae fruits during ripening. Food Chem. 2018, 239, 649–656. [Google Scholar] [CrossRef]
  18. Ruiz-Rodríguez, B.M.; Sánchez-Moreno, C.; De Ancos, B.; Sánchez-Mata, M.D.C.; Fernández-Ruiz, V.; Cámara, M.; Tardío, J. Wild Arbutus unedo L. and Rubus ulmifolius Schott fruits are underutilized sources of valuable bioactive compounds with antioxidant capacity. Fruits 2014, 69, 435–448. [Google Scholar] [CrossRef] [Green Version]
  19. Hajaji, S.; Jabri, M.-A.; Sifaoui, I.; López-Arencibia, A.; Reyes-Batlle, M.; B’Chir, F.; Valladares, B.; Pinero, J.E.; Lorenzo-Morales, J.; Akkari, H. Amoebicidal, antimicrobial and in vitro ROS scavenging activities of Tunisian Rubus ulmifolius Schott, methanolic extract. Exp. Parasitol. 2017, 183, 224–230. [Google Scholar] [CrossRef]
  20. Hrčková, M.; Koleda, P.; Koleda, P.; Barcík, Š.; Štefková, J. Color Change of Selected Wood Species Affected by Thermal Treatment and Sanding. BioResources 2018, 13, 8956–8975. [Google Scholar] [CrossRef] [Green Version]
  21. Ramos, P.; Parra-Palma, C.; Figueroa, C.R.; Zuñiga, P.E.; Valenzuela-Riffo, F.; Gonzalez, J.; Gaete-Eastman, C.; Morales-Quintana, L. Cell wall-related enzymatic activities and transcriptional profiles in four strawberry (Fragaria x ananassa) cultivars during fruit development and ripening. Sci. Hortic. 2018, 238, 325–332. [Google Scholar] [CrossRef]
  22. Cheel, J.; Theoduloz, C.; Rodriguez, J.; Caligari, P.D.S.; Schmeda-Hirschmann, G. Free radical scavenging activity and phenolic content in achenes and thalamus from Fragaria chiloensis subsp. chiloensis, F. vesca and F. x ananassa cv. Chandler. Food Chem. 2007, 102, 36–44. [Google Scholar] [CrossRef]
  23. Castro, R.; Forero-Doria, O.; Soto-Cerda, L.; Peña-Neira, A.; Guzmán, L. Protective Effect of Pitao (Pitavia punctata (R. & P.) Molina) Polyphenols against the Red Blood Cells Lipoperoxidation and the In Vitro LDL Oxidation. Evidence-Based Complement. Altern. Med. 2018, 2018, 1–9. [Google Scholar]
  24. Benzie, I.F.F.; Strain, J.J. The ferric reducing ability of plasma (FRAP) as a measure of “antioxidant power”: The FRAP assay. Anal. Biochem. 1996, 239, 70–76. [Google Scholar] [CrossRef] [PubMed]
  25. Parra-Palma, C.; Morales-Quintana, L.; Ramos, P. Phenolic Content, Color Development, and Pigment−Related Gene Expression: A Comparative Analysis in Different Cultivars of Strawberry during the Ripening Process. Agronomy 2020, 10, 588. [Google Scholar] [CrossRef] [Green Version]
  26. Schwab, W.; Davidovich-Rikanati, R.; Lewinsohn, E. Biosynthesis of plant-derived flavor compounds. Plant J. 2008, 54, 712–732. [Google Scholar] [CrossRef] [PubMed]
  27. Liu, Y.; Wang, W.-L.; Guo, G.-X.; Ji, X.-L. Volatile emission in wheat and parasitism by Aphidius avenae after exogenous application of salivary enzymes of salivary enzymes of Sitobion avenae. Entomol. Exp. Appl. 2009, 130, 215–221. [Google Scholar] [CrossRef]
  28. Asioli, D.; Aschemann-Witzel, J.; Caputo, V.; Vecchio, R.; Annunziata, A.; Næs, T.; Varela, P. Making sense of the “clean label” trends: A review of consumer food choice behavior and discussion of industry implications. Food Res. Int. 2017, 99, 58–71. [Google Scholar] [CrossRef]
  29. Moscato, E.M.; Machin, J.E. Mother natural: Motivations and associations for consuming natural foods. Appetite 2018, 121, 18–28. [Google Scholar] [CrossRef]
  30. da Silva, L.P.; Pereira, E.; Pires, T.C.; Alves, M.J.; Pereira, O.R.; Barros, L.; Ferreira, I.C. Rubus ulmifolius Schott fruits: A detailed study of its nutritional, chemical and bioactive properties. Food Res. Int. 2019, 119, 34–43. [Google Scholar] [CrossRef] [Green Version]
  31. Pinela, J.; Carvalho, A.M.; Ferreira, I.C.F.R. Wild edible plants: Nutritional and toxicological characteristics, retrieval strategies and importance for today’s society. Food Chem. Toxicol. 2017, 110, 165–188. [Google Scholar] [CrossRef] [Green Version]
  32. Kaume, L.; Howard, L.R.; Devareddy, L. The Blackberry Fruit: A Review on Its Composition and Chemistry, Metabolism and Bioavailability, and Health Benefits. J. Agric. Food Chem. 2011, 60, 5716–5727. [Google Scholar] [CrossRef]
  33. Barros, L.; Oliveira, S.; Carvalho, A.M.; Ferreira, I.C. In vitro antioxidant properties and characterization in nutrients and phytochemicals of six medicinal plants from the Portuguese folk medicine. Ind. Crop. Prod. 2010, 32, 572–579. [Google Scholar] [CrossRef]
  34. Schulz, M.; Seraglio, S.K.T.; Della Betta, F.; Nehring, P.; Valese, A.C.; Daguer, H.; Gonzaga, L.V.; Costa, A.C.O.; Fett, R. Blackberry (Rubus ulmifolius Schott): Chemical composition, phenolic compounds and antioxidant capacity in two edible stages. Food Res. Int. 2019, 122, 627–634. [Google Scholar] [CrossRef]
  35. Turkben, C.; Sarıburun, E.; Demir, C.; Uylaşer, V.; Sariburun, E. Effect of Freezing and Frozen Storage on Phenolic Compounds of Raspberry and Blackberry Cultivars. Food Anal. Methods 2010, 3, 144–153. [Google Scholar] [CrossRef]
  36. de Souza, V.R.; Pereira, P.A.P.; da Silva, T.L.T.; De Oliveira Lima, L.C.; Pio, R.; Queiroz, F. Determination of the bioactive compounds, antioxidant activity and chemical composition of Brazilian blackberry, red raspberry, strawberry, blueberry and sweet cherry fruits. Food Chem. 2014, 156, 362–368. [Google Scholar] [CrossRef] [Green Version]
  37. Badhani, A.; Rawat, S.; Bhatt, I.D.; Rawal, R.S. Variation in Chemical Constituents and Antioxidant Activity in Yellow Himalayan (R ubus ellipticus Smith) and Hill Raspberry (R ubus niveus Thunb.). J. Food Biochem. 2015, 39, 663–672. [Google Scholar] [CrossRef]
  38. Yang, J.W.; Choi, I.S. Comparison of the phenolic composition and antioxidant activity of Korean black raspberry, Bokbunja,(Rubus coreanus Miquel) with those of six other berries. CyTA-J. Food 2017, 15, 110–117. [Google Scholar]
  39. Tabarki, S.; Aouadhi, C.; Mechergui, K.; Hammi, K.M.; Ksouri, R.; Raies, A.; Toumi, L. Comparison of Phytochemical Composition and Biological Activities ofRubus ulmifoliusExtracts Originating from Four Regions of Tunisia. Chem. Biodivers. 2017, 14, e1600168. [Google Scholar] [CrossRef]
  40. Ali, N.; Shaoib, M.; Shah, S.W.A.; Shah, I.; Shuaib, M. Pharmacological profile of the aerial parts of Rubus ulmifolius Schott. BMC Complement. Altern. Med. 2017, 17, 59. [Google Scholar] [CrossRef]
Figure 1. Different ripening stages of R. ulmifolius Schott fruits: large green fruit (LG); turning fruit (T); 50% black fruit (50%R); and ripe black fruit (R). Fruits obtained during the summer of 2019.
Horticulturae 09 00013 g001
Figure 2. Three-dimensional spectrum of CIELab (L*, a* and b*).
Horticulturae 09 00013 g002
Figure 3. Changes in fruit weight (A), size (B), pH (C), and SSC/TA ratio (D) during fruit development and ripening of the blackberry (Rubus ulmifolius Schott) fruit in two different seasons. Different capital letters indicate significant differences between the four development and ripening stages. Different lowercase letters indicate significant differences in each season (2019 and 2020) over four development and ripening stages. Differences between means ± standard errors (SE) were determined by ANOVA and the LSD test (p < 0.05).
Horticulturae 09 00013 g003
Figure 4. Chemical analysis of the stage of blackberry (Rubus ulmifolius Schott) fruit in two different seasons. Total phenols (A), flavonoids (B), and anthocyanins content (C). N.D.—not detected. GAE—gallic acid equivalent; Cy-3-glu–cyanidin-3-O-glucoside; QE—quercetin equivalent. Different capital letters indicate significant differences between the four development and ripening stages. Different lowercase letters indicate significant differences in each season (2019 and 2020) over four development and ripening stages. Differences between means ± standard errors (SE) were determined by ANOVA and the LSD test (p < 0.05).
Horticulturae 09 00013 g004
Figure 5. Antioxidant capacity of different blackberry (Rubus ulmifolius Schott) fruit stages. Free radical scavenging activity by FRAP (A) and DPPH (B) was estimated. Data correspond to mean ± SE of three biological replicates. Different letters indicate significant differences between samples (p ≤ 0.05; ANOVA). TE—Trolox equivalent.
Horticulturae 09 00013 g005
Figure 6. Analysis of volatile aliphatic compounds according to their backbone at stages LG, 50%R, and R. Black bars correspond to the relative areas per g of berry (left axis), and grey bars correspond to the relative areas per berry (right axis). Different letters indicate statistical differences (p < 0.05) among ripening stages.
Horticulturae 09 00013 g006
Figure 7. Sulcatol and sulcatone contents at LG, 50%R, and R ripening stages. Different letters indicate statistical (p < 0.05) differences among ripening stages.
Horticulturae 09 00013 g007
Table 1. Criteria to assess the color change based on Hrčková et al., 2018 [20].
ParameterDescription
∆E < 0.2Invisible changes
0.2 < ∆E < 2Small changes
2 < ∆E < 3Color changes visible by high-quality filter
3 < ∆E < 6Color changes visible by medium-quality filter
6 < ∆E < 12Distinct color changes
∆E > 12A different color
Table 2. Color readings of four stages of blackberry (Rubus ulmifolius Schott) fruit skin.
SeasonStageL*a*b*∆EChange *Representative Color
2019LG40.00 ± 7.82−11.41 ± 4.0136.16 ± 8.03------Horticulturae 09 00013 i001
2020LG43.60 ± 12.94−9.41 ± 4.9034.05 ± 7.80
2019T49.32 ± 13.0420.90 ± 11.6030.05 ± 6.8831.3A different colorHorticulturae 09 00013 i002
2020T47.24 ± 11.4520.69 ± 12.0231.29 ± 7.50
201950%R14.50 ± 3.1045.80 ± 8.5014.20 ± 2.6545.0A different colorHorticulturae 09 00013 i003
202050%R16.00 ± 4.4044.95 ± 6.2213.50 ± 4.30
2019R6.90 ± 3.3511.50 ± 7.10−0.29 ± 4.7640.4A different colorHorticulturae 09 00013 i004
2020R7.70 ± 2.9011.90 ± 6.60−0.70 ± 3.05
Values indicate the mean of fifteen replicates from each season, and the standard deviations are also shown. * Considering changes regarding the previous stage.
Table 3. Volatile compounds profile of blackberries at stages LG, 50%R, and R. Different letters in a row indicate statistical differences (p < 0.05) among ripening stages for the same volatile compound group, according to the Tukey post-hoc test.
Volatile Compounds GroupLG50%RR
Results expressed as R.A. per g of berry
Terpenoids0.189 ± 0.038 A0.011 ± 0.002 B0.169 ± 0.078 A
Benzenoids0.235 ± 0.038 A0.046 ± 0.025 B0.035 ± 0.017 B
Aldehydes1.104 ± 0.067 A0.154 ± 0.031 B0.249 ± 0.089 B
Ketones0.260 ± 0.070 A0.012 ± 0.002 B0.144 ± 0.067 AB
Aliphatic alcohols1.989 ± 0.161 A0.430 ± 0.357 B0.415 ± 0.051 B
Branched alcohols0.038 ± 0.010 A0.004 ± 0.001 B0.003 ± 0.001 B
Results expressed as R.A. per berry
Terpenoids 0.027 ± 0.005 B0.005 ± 0.001 B0.201 ± 0.105 A
Benzenoids0.034 ± 0.006 0.025 ± 0.018 0.041 ± 0.022
Aldehydes0.158 ± 0.016 AB0.082 ± 0.031 B0.296 ± 0.122 A
Ketones0.037 ± 0.009 B0.006 ± 0.001 B0.171 ± 0.089 A
Aliphatic alcohols0.267 ± 0.028 B1.108 ± 0.045 B0.820 ± 0.252 A
Branched alcohols0.002 ± 0.001 0.011 ± 0.001 0.007 ± 0.004
Disclaimer/Publisher’s Note: The statements, opinions and data contained in all publications are solely those of the individual author(s) and contributor(s) and not of MDPI and/or the editor(s). MDPI and/or the editor(s) disclaim responsibility for any injury to people or property resulting from any ideas, methods, instructions or products referred to in the content.