Abstract
Clematis tientaiensis is an ornamental plant with beautiful flowers that belongs to the Ranunculaceae family. C. tientaiensis is endemic to Zhejiang Province in China. Five different colours of the C. tientaiensis flower have been observed, and to explore the reason for this flower colour variation, transcriptome and metabolome sequencing analyses were conducted in this study. The results indicate that 32 metabolites participate in anthocyanin biosynthesis, and that 24 metabolites were differentially accumulated among the five different flower colours. The transcriptome sequencing results enabled the identification of 13,559 differentially expressed genes. Further analysis indicated that cyanidin-3-O-galactosidea and cyanidin-3-O-sophoroside promote anthocyanin accumulation in the flowers of C. tientaiensis, whereas the pelargonidin-3-O-galactoside plays a negative role in anthocyanin synthesis. In addition, a combined transcriptome and metabolome analysis showed that the WDR2 gene plays an important regulatory role in anthocyanin biosynthesis. The results of this study provide a basis for further research into the biosynthesis and regulation of anthocyanins in C. tientaiensis flowers.
1. Introduction
Clematis is known as the “queen” vine plant due to its flower colour and shape variations; it belongs to the Ranunculaceae family [1,2]. Approximately 355 species of Clematis exist worldwide, and 155 species are distributed in China [3]. Among these species, Clematis tientaiensis is endemic to eastern Zhejiang Province (Yandang Mountain and Tiantai Mountain) in China and has high ornamental value with its beautiful flowers. In addition, C. tientaiensis was listed as a key protected wild plant in Zhejiang Province in 2021 [4].
Flower colour is a vital quality characteristic of flowering plants, largely due to the presence of pigment compounds in the chloroplasts or vacuoles in flower tissues [5]. The currently known plant pigments are mainly divided into three categories: flavonoids, carotenoids, and alkaloids [6]. Anthocyanin is a class of flavonoid compounds that is widely found in the roots [7,8], flowers [9], and fruits [10] of plants and results in their different colours. Anthocyanin results in an increase in both absorbance and in a bathochromic shift of the visible absorption maximum of the latter and is based mainly on hydrogen bond formation between the carbonyl group of the anthocyanin anhydrobase and aromatic hydroxyl groups of the complex-forming flavonoids [11]. In ornamental plants with anthocyanin as the main pigment, which mainly determines the flower colour, different anthocyanins are responsible for presenting different colours: pelargonine can yield colours ranging from orange to red, cyanidin can cause colours ranging from pink to fuchsia, and delphinidin can produce colours ranging from purple to blue [12,13].
In general, anthocyanins are closely related to the expression of structural genes and transcription factors [14]. In the initial stage of anthocyanin synthesis, the CHS protein catalyses the production of p-coumaroyl-CoA into chalcone, which is then transformed into naringenin by the CHI protein. Then, naringenin is catalysed by the F3H protein, which adds a hydroxyl group at position 3 to generate dihydrokaempferol (DHK). DHK is catalysed to produce dihydroquercetin (DHQ) and dihydromyricetin (DHM) by the F3′H and F3′5′H proteins, respectively. Then, the synthesis of anthocyanin glycosides is divides into three branches: DHK is catalysed to protopelargonin aglycone, DHQ is catalysed to leucocyanidin, and DHM is catalysed to leucodelphindin [15]. Mutation of the CHS gene in the flowers of the summer pansy changes the flower colours from the original blue to white and grey [16]. Mutations in the F3H gene prevent the conversion of flavanones to dihydroflavonols. Mutations in the F3H gene locus in petunia and antirrhinum produce white flowers [17]. The inhibition of F3H gene expression in carnation with an antisense RNA yields a series of plants with lighter or even colourless flowers from the original orange varieties [18]. The F3′H and F3′5′H genes play important roles in the synthesis of cyanidin and delphinidin, respectively, which exert important effects on the type and content of anthocyanins. The petals of morning glory usually accumulate cyanidin, and the flowers are generally purple-red in colour. Mutation of the F3′H gene induces the flowers to turn red and causes the accumulation of pelargonin in the petals [19,20]. In Petunia hybrida, insertion of the F3′5′H gene into the transposon results in a change in flower colour [21].
In our previous work, C. tientaiensis varieties presented five different flower colours. Each flower colour trait was stable under three consecutive flowering cycles. This phenomenon not only provides important Clematis flower colour germplasm resources, but also provides ideal materials for studying the colour variation mechanism in C. tientaiensis. To explore this flower colour variation, we used the C. tientaiensis plants of five different flower colours to conduct transcriptome and metabolome sequencing. These results of this sequencing reveal new insights into the role of metabolites and genes in modulating the flower colour of C. tientaiensis.
2. Materials and Method
2.1. Plant Materials
The flowers of C. tientaiensis used in this study were provided by the Zhejiang Institute of Subtropical Crops, Wenzhou, Zhejiang Province, China. These species were preserved in the National Clematis Germplasm Resource Center, Wenzhou, Zhejiang Province, China (C. tientaiensis voucher code: W-2017–12). Five flower colours of C. tientaiensis, namely, white (TTCB), lilac and white (TTJD), purple and white (TTJ), dark purple alternate (TTJZ), and dark purple (TTSZ) (Figure 1), were selected to explore the colour variations related to anthocyanin metabolic content. Fresh flowers of C. tientaiensis were collected, stored in liquid nitrogen, and then immediately stored at −80 °C.

Figure 1.
Five C. tientaiensis varieties with different flower colours. (a) White (TTCB) flowers; (b) lilac and white (TTJD) flowers; (c) purple and white (TTJ) flowers; (d) dark purple alternate (TTJZ) flowers; (e) dark purple (TTSZ) flowers.
2.2. Metabolite Extraction
Liquid chromatography/tandem mass spectrometry (LC‒MS/MS) was performed to detect compounds with high polarity and poor thermal stability and to accurately quantify the substances. The samples were treated using the following steps: the samples were vacuum freeze-dried and then ground (30 Hz, 5 min) to a powder using a ball mill, and 50 mg of powder was weighed, dissolved in 500 μL of extraction solution (50% aqueous methanol solution containing 0.1% hydrochloric acid), vortexed for 5 min, ultrasonicated for 5 min, and centrifuged for 3 min at 12,000 r/min and 4 °C. The supernatant was collected, and the process was repeated 1 time. The supernatant samples were combined, filtered through a microporous filter film (pore size of 0.22 μm), and stored in a sample bottle for LC‒MS/MS analysis [22].
2.3. Metabolome Analysis
Significantly regulated metabolites between groups were determined by VIP ≥ 0, and absolute Log2FC (fold change) ≥ 1.0. VIP values were extracted from the orthogonal projections to latent structures discriminant analysis (OPLS-DA) result, which also contained score plots and permutation plots, and were generated using the R package MetaboAnalystR. The data were log-transformed (log2) and mean-centered before OPLS-DA. To avoid overfitting, a permutation test (200 permutations) was performed [23]. ChemStation (version E.02.02.1431, Agilent, CA, USA) software and ChromaTOF software (version 4.34, LECO, St Joseph, MI, USA) were used to analyse the processed data [24], and the Fiehn or National Institute of Standard and Technology (NIST) database was used to annotate the metabolites [25]. Unsupervised principal component analysis (PCA) was performed by the statistics function prcomp within R (www.r-project.org, accessed on 1 March 2022) [26]. The data were unit-variance-scaled before unsupervised PCA. Differentially accumulated metabolites were identified by the fold change, which represents the ratio of expression amount between two samples (groups), and the p value was calculated by the t test. The metabolites with fold change ≥ 2 and fold change ≤ 0.5 were selected as the final differentially accumulated metabolites [27]. A Venn diagram and a heatmap were generated using the Lianchuan Bio Cloud Platform (https://www.lc-bio.cn/overview, accessed on 22 March 2022) with the default model.
2.4. Full-Length Sequencing and Analysis
Total RNA of the mixed flower sample was extracted by Tiangen Kit (Beijing, China) according to its manufacturer’s instructions. The degradation and quality of total RNA were analysed by separation on a 1% agarose gel and by using a Nanodrop spectrophotometer (IMPLEN, CA, USA), respectively. The Iso-Seq library was prepared according to the isoform sequencing protocol (Iso-Seq) using the Clontech SMARTer PCR cDNA Synthesis Kit and the BluePippin Size Selection System protocol, as described by Pacific Biosciences (PN 100-092-800-03). SMRTlink (an official PacBio software package) was used to process the original data. First, the subread sequences were obtained, and the subreads were calibrated to obtain the annular circular sequence (CCS) that contained 5′ and 3′ end primers and poly (A) tails. Then, the hierarchical N * log (n) algorithm was used to cluster the full-length sequences; finally, the resulting full-length sequences were polished to obtain a high-quality consensus for subsequent sequence analysis. The second-generation data were used to calibrate the polished consensus sequences, and then Cluster Database at High Identity with Tolerance (CD-HIT) software was used to remove redundancy. Unmapped transcripts and novel gene transcript functions were annotated based on the following databases: NR (NCBI nonredundant protein sequences); NT (NCBI nonredundant nucleotide sequences); Pfam (Protein family); KOG/COG (Clusters of Orthologous Groups of proteins); Swiss-Prot (a manually annotated and reviewed protein sequence database); KO (Kyoto Encyclopedia of Genes and Genomes (KEGG) Ortholog database); GO (Gene Ontology). We used Basic Local Alignment Search Tool (BLAST) software and set the e-value to ‘1e-10’ in the NT database analysis. We then used the Diamond BLASTX search tool and set the e-value to ‘1e-10’ in the NR KOG Swiss-Prot KEGG databases’ analysis. We used the Hmmscan software in the Pfam database analysis.
2.5. Transcriptome Data Analysis
Total RNA of each flower sample was extracted according to the protocol (Tiangen, Beijing, China), and degradation and quality were analysed by separation on a 1% agarose gel and using a Nanodrop spectrophotometer (IMPLEN, CA, USA), respectively. The first strand of cDNA was synthesised in the M-MuLV reverse transcriptase system using fragmented mRNA as a template and random oligonucleotides as primers. Then, the RNA strand was decomposed by RNaseH, and the second strand of cDNA was synthesised using deoxynucleoside triphosphates (dNTPs) as raw material in the DNA polymerase I system. After terminal repair, an A-tail was added to the purified double stranded cDNA, and sequencing joints were connected. cDNA of approximately 250–300 bp was screened with AMPure XP beads for PCR amplification. PCR products were purified again with AMPure XP beads to ultimately obtain the library. The database building kit was the NEBNext® Ultra™ RNA Library Prep Kit for Illumina® [28]. Raw data from sequencing included a small number of reads with sequencing connectors or with low sequencing quality, as shown in the figure below. Then, we mapped the read counts onto the transcriptome we assembled with PacBio. We used those reads for CCS error correction. The DESeq2 R package was used to identify the differentially expressed genes with specific parameters [29]. The differentially expressed metabolites were identified by the fold change, which represents the ratio of the expression amount between two samples (groups), and the p-value was calculated by the t test. The metabolites with fold change ≥ 2 and fold change ≤ 0.5 were selected as final differential metabolites.
2.6. Integrated Transcriptome and Metabolome Analysis
The Lianchuan Bio Cloud Platform (https://www.lc-bio.cn/overview, accessed on 22 March 2022) was used to analyse Spearman’s correlations in the dataset of differentially accumulated metabolites and DEGs in flowers of different colours. Spearman’s correlation coefficient |r| > 0.9 and a significant p-value < 0.01 were considered to indicate a strong correlation between the differentially expressed metabolites and DEGs. In addition, a clustering correlation heatmap was drawn with signs, and a correlation network was constructed.
2.7. Quantitative Real-Time PCR (qRT‒PCR)
qRT‒PCR was performed on the selected candidate genes to identify their expression levels in flowers of different colours. Specific primers for the 8 selected genes were designed by the Oligo 7 and are listed in Table 1, while the GAPDH gene in C. tientaiensis was used as the reference gene. The PCR cycling was denatured using a program of 95 °C for 10 min, 40 cycles of 95 °C for 15 s, and 60 °C for 60 s. The reactions were repeated three times in all experiments, and the 2−ΔΔCt method was used to calculate the relative changes in the gene expression levels.

Table 1.
Primers for qRT‒PCR.
3. Results
3.1. Metabolite Data Analysis
Thirty-two metabolites were detected in flowers of different colours in this study. Among the metabolites were seven flavonols, seven cyanidins, four delphinidins, four pelargonidins, three petunidins, five malvdins, one procyanidin, and one peonidin, respectively (Table S1). For these metabolites, principal component analysis (PCA) accurately grouped all samples into distinct clusters, which reflected the obvious differences between the differently coloured flowers. The results showed that TTCB had obvious differences from flowers of other colours (Figure 2).
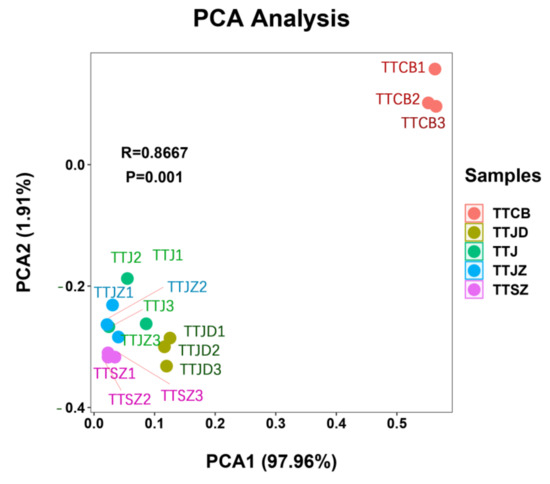
Figure 2.
Plots of principal component analysis (PCA) of flower of different colours.
The Venn diagram of the five groups indicated that 16 compounds were expressed in each group of flowers with a different colour (Figure 3a). Then, a heatmap of the coexpressed metabolites was constructed. The results indicated that the five cyanidin numbers (cya-3,5,3′-O-triglucoside, cya-3,5-O-diglucoside, cya-3-O-galactoside, cya-3-O-rutinoside-5-O-glucoside, cya-3-O-sophoroside) were most highly expressed in the dark purple flowers (TTSZ) (Figure 3b).
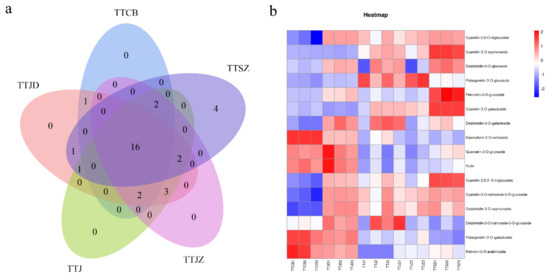
Figure 3.
Analysis of the metabolome results. (a) Venn diagram of metabolite expression in different coloured flower samples. Different groups are represented by different colours. (b) Heatmap of coexpressed metabolites in flower samples of different colour; the numbers are Z-score values of FPKM.
3.2. Differentially Accumulated Metabolite Analysis
In this study, 24 differentially accumulated metabolites were identified through the fold change, and further analysis was conducted. Comparison of the metabolites among the 10 groups indicated that there were no differentially accumulated metabolites between TTJ and TTJZ, while the greatest levels of increased/decreased metabolites were observed in TTCB compared with TTSZ (Figure 4a). TTCB was a white flower, which was set as the reference group. Then, a Venn diagram of differentially accumulated metabolites among the four groups (TTCB compared with TTJD, TTCB compared with TTJ, TTCB compared with TTJZ, and TTCB compared with TTSZ) was constructed. The results indicated that six differentially accumulated metabolites (cyanidin-3,5,3′-O-triglucoside, cyanidin-3,5-O-diglucoside, cyanidin-3-O-rutinoside-5-O-glucoside, delphinidin-3-O-galactoside, delphinidin-3-O-sophoroside, and kaempferol-3-O-rutinoside) were accumulated in all compared groups. In addition, seven differentially accumulated metabolites (afzelin, dihydrokaempferol, quercetin-3-O-glucoside, rutin, malvidin-3-O-arabinoside, pelargonidin-3-O-galactoside, pelargonidin-3-O-glucoside) were expressed in all the compared groups except in the comparison between TTCB and TTJD (Figure 4b). It is worth noting that procyanidin B2 accumulated differently only in TTCB compared with TTSZ. The heatmap of differentially accumulated metabolites showed that metabolites such as the cya-3,5,3′-O-triglucoside, cya-3,5-O-diglucoside, and malvidin-3-O-arabinoside (Figure 4c) present the opposite expression trend between TTCB and TTSZ.
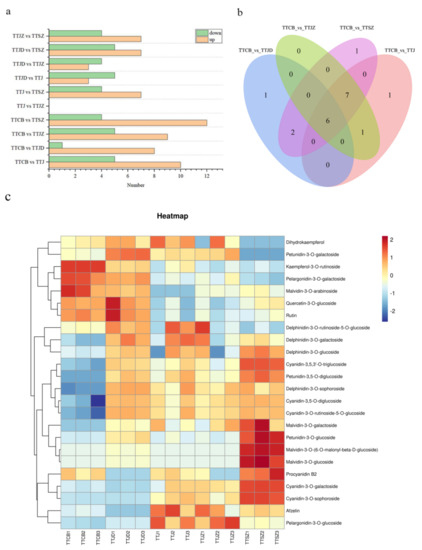
Figure 4.
Analysis of the differentially accumulated metabolites. (a) Comparison of the metabolite profiles among different flower colours. The metabolites with increased levels are presented in red, and the metabolites with decreased levels are presented in black. (b) Venn diagram of differentially accumulated metabolites. (c) Heatmap of differentially accumulated metabolites.
3.3. Full Transcriptome Sequencing Result Analysis
A total of 822,866 circular consensus sequences (CCSs) were obtained by PacBio Iso-Seq, containing 72.47% (596,333) of the FLNC sequences (average length of 1524 bp) (Table 2). Notably, 84.56 G clean reads were obtained from the 15 samples through RNA-seq, and the GC content distribution was 44.22 to 44.98.

Table 2.
Full length RNA-seq results.
3.4. Differentially Expressed Gene Analysis
The total amount of raw data in 15 flower samples produced by Illumina sequencing was 90.01 G, and the filtered clean data were 84.56 Gb. The error rate was less than 0.03%, while the GC content was between 44.22% and 44.98%.
DESeq2 was used to analyse differentially expressed genes (DEGs). The number of DEGs in the C. tientaiensis flowers was statistically analysed, and a Venn diagram was constructed. A total of 13,559 DEGs were detected in the 10 comparison groups. The results of the DEG analysis indicated the largest number of DEGs between TTJD and TTSZ (4025 upregulated and 4655 downregulated DEGs), followed by the comparison between TTCB and TTSZ (3772 upregulated and 4395 downregulated DEGs). In addition, the lowest number of DEGs was observed between TTJ and TTJZ (80 upregulated and 202 downregulated DEGs) (Figure 5a). In addition, a heatmap of some DEGs (structural genes in anthocyanin biosynthesis and transcription factor genes that compose the MBW complex) was constructed (Figure 5b). The results showed that gene expression was divided into two groups: TTCB and TTJ clustered into one group, while other flower colour samples clustered into another group. For further analyses, GO terms on specific DEGs were built, and the result indicated that most genes had molecular function (Figure 5c).
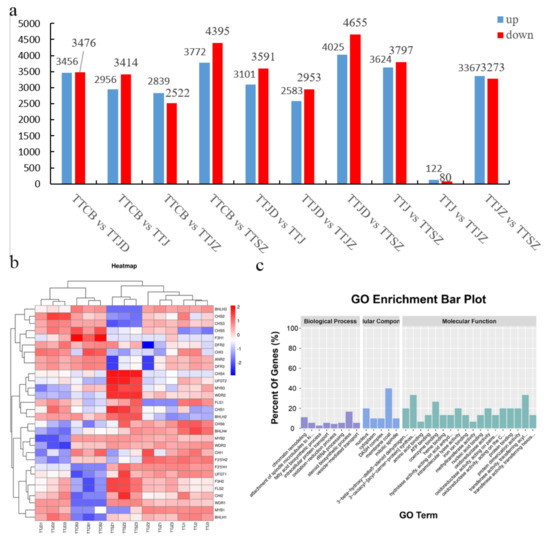
Figure 5.
DEG analysis of flowers of different colours in C. tientaiensis. (a) The number of DEGs identified in every comparison group. The blue/red bars represent the numbers of up/downregulated genes. (b) Heatmap of DEGs of flowers of different colours in C. tientaiensis. (c) GO term of specific DEGs.
3.5. Quantitative Real-Time PCR (qRT‒PCR) Validation of Select Genes Related to Anthocyanin Biosynthesis
Eight unigenes were selected for qRT‒PCR to identify the reliability of the RNA-seq data, including structural genes and transcription factor genes. The results showed a similar expression pattern of the FPKM level to those genes obtained in the RNA-seq data (Figure 6), indicating that the RNA-seq analysis results were reliable, which would be helpful for further study of anthocyanin biosynthesis among differently coloured flowers of C. tientaiensis.
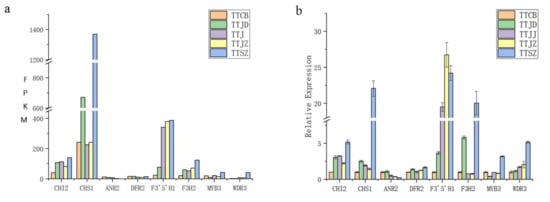
Figure 6.
qRT‒PCR identification of selected genes related to anthocyanin biosynthesis. (a) Expression levels of 8 unigenes based on the FPKM level. (b) Relative expression levels of 8 unigenes determined using qRT‒PCR. The error bars represent the standard deviations from three replicates.
3.6. Integrated Analysis of the Transcriptome and Metabolome
A correlation analysis was performed to further assess the relationship between anthocyanin genes and differentially accumulated metabolites. The results of transcriptome and metabolome sequencing indicated substantial differences in flower colour between white and dark purple flowers. The combined analysis results indicated that cyanidin-3-O-galactoside, cyanidin-3-O-sophoroside, and pelargonidin-3-O-galactoside had significant correlations with the WDR2 gene. Among them, cyanidi-3-O-galactoside and cyanidin-3-O-sophoroside were not only coexpressed in all samples, but were also differentially accumulated metabolites that had a positive significant correlation with the WDR2 gene. In addition, pelargonidin-3-O-galactoside had a significant negative correlation with the WDR2 gene (Figure 7).
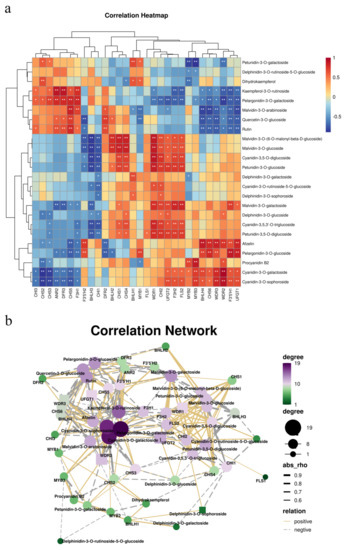
Figure 7.
Correlation analysis of the genes related to anthocyanin and differentially accumulated metabolites. (a) Heatmap of metabolite abundance according to hierarchical clustering analysis. *: p < 0.05, **: p < 0.01. (b) The results of the correlation analysis between anthocyanin genes and differentially expressed metabolites.
3.7. Expression of Genes Related to the Anthocyanin Biosynthesis Pathway
In the first stage of anthocyanin synthesis, most of the CHS genes were expressed at lower levels in white flowers than in flowers of other colours. The expression of F3H genes in dark purple flowers was lower than that in other flower colours. In the second stage, the FLS genes showed different expression patterns, which warrants future study. In the third stage, ANR genes showed lower expression levels only in the TTJZ and TTSZ samples (Figure 8).
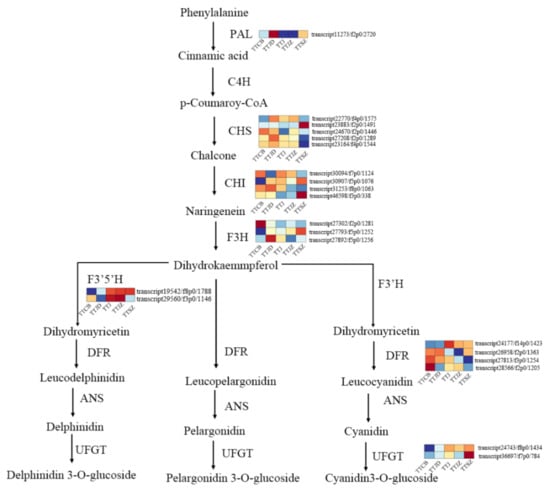
Figure 8.
Expression of genes in the anthocyanin biosynthesis pathway. The expression of related genes in the RNA-seq data (FPKM) is represented by the rectangle. The high/low expression levels are represented by red/blue, respectively.
4. Discussion
4.1. Impact of Metabolites on Anthocyanin Biosynthesis
Flowers are the most vital attribute of horticultural flowering plants [30]. Environmental and gene regulation, which are composite biological processes, are the main factors that regulate the colouration of flowers [31,32]. With rapid advances in molecular methods, gene regulation has been identified in many plants [33,34]. Previous studies have shown that flavonoids have a variety of physiological functions, including in the colouration of flowers, in signalling during nodulation, and in auxin transport [35,36]. Anthocyanins are flavonoids [37] that play vital roles in the formation of flower colour [38].
C. tientaiensis, which has large and colourful flowers, was listed as a key protected wild plant in Zhejiang Province in 2021. The pattern of variation in anthocyanin contents and the accompanying flower colouration in C. tientaiensis were analysed in this study. The metabolites appeared to be more active in the TTSZ sample, which contained the highest number of differentially accumulated metabolites. In this study, cyanidin-3-O-galactoside and cyanidin-3-O-sophoside, which are specialised pigments leading to a dark purple colour, were found at the highest expression levels in dark purple flowers [39]. In addition, malvidin-3-O-(6-O-malonyl-beta-D-glucoside) and malvidin-3-O-glucoside were only expressed in the TTJD and TTSZ samples, and the highest expression levels were observed in TTSZ. The flower colour changed from white to lilac and white, and two malvidins began to appear. This result indicated that malvidin-3-O-(6-O-malonyl-beta-D-glucoside) and malvidin-3-O-glucoside may promote the accumulation of the purple pigment in flowers [40]. Furthermore, the contents of flavonoids such as kaempferol-3-O-rutinoside and rutin gradually decrease as the flowers become more purple.
4.2. Integrated Transcriptome and Metabolome Analysis
In recent years, metabolite mechanisms and associated genetic mechanisms have been examined to analyse the relationship between key genes and metabolites in biosynthetic pathways in many plants, such as Solanum tuberosum [41], Muscari [42], Osmanthus fragrans [43], and Brassica oleracea L. [44]. In previous studies, the genes controlling the natural variation in flower colour have been analysed and identified in Glycine max [45], Torenia [46], and many other plants. Studies have shown that some genes function specifically to affect anthocyanin synthesis, and these include structural genes involved in anthocyanin synthesis and transcription factors. The DEGs identified in this study also included structural genes (CHI, FLS, ANR, CHS, DFR, F3’5’H1, and UFGT) and transcription factors (MYB, WD40, and BHLH). These genes may help researchers further understand anthocyanin synthesis in C. tientaiensis.
The results of the present study indicated that the WDR2 gene had a significant positive correlation (p < 0.01) with cyanidin-3-O-galactoside and cyanidin-3-O-sophoroside. The WD40 transcription factor family is a superfamily present in all eukaryotes and is involved in a group of multiple protein complexes that regulate growth, development, and abiotic stress. The MYB-bHLH-WD40 (MBW) complex regulates and catalyses the biosynthesis of plant anthocyanidins, which play an important role in the transcriptional regulation of anthocyanin metabolic pathways in plants. According to previous studies, the WD40 transcription factor is involved in anthocyanin biosynthesis in plants [47]. Due to its stable expression, the WD40 transcription factor is a very important participant in anthocyanin biosynthesis and usually acts as an activator of transcription to regulate anthocyanin pigment accumulation. A WD40 protein in apples (MdTTG1) interacts with bHLH, which promotes the accumulation of anthocyanins [48]. A WD40 repeat protein from Medicago truncatula is needed for tissue-specific anthocyanin and proanthocyanidin biosynthesis [49]. In this study, the WDR2 gene had the lowest expression level in the TTCB and TTJD samples, was increased in the TTJ and TTJZ samples, and peaked in the TTSZ samples. This phenomenon indicated that the WDR2 gene had a positive correlation with anthocyanin pigment accumulation.
5. Conclusions
In this study, RNA-seq and metabolome sequencing were performed to elucidate the differential regulation of anthocyanin biosynthesis in five differently coloured flowers (TTCB, TTJD, TTJ, TTJZ, and TTSZ) of C. tientaiensis. A total of 13,559 DEGs and 24 differentially accumulated metabolites were identified from the 10 comparisons. Four malvidins (malvidin-3-O-galactoside, malvidin-3-O-(6-O-malonyl-beta-D-glucoside), malvidin-3-O-glucoside, and malvidin-3-O-sophoroside) may promote anthocyanin accumulation in the flowers of C. tientaiensis. In addition, the CHI2 gene plays a positive regulatory role in the anthocyanin synthesis process, while the BHLH3 gene plays a negative regulatory role. The study also provides reliable data on anthocyanin biosynthesis during flower colouration in C. tientaiensis.
Supplementary Materials
The following supporting information can be downloaded at: https://www.mdpi.com/article/10.3390/horticulturae9010014/s1.
Author Contributions
Data curation, X.Z. and Q.H.; funding acquisition, R.Q.; investigation, X.M.; project administration, J.Z.; writing—original draft, R.Q.; writing—review and editing, Y.Y. All authors have read and agreed to the published version of the manuscript.
Funding
This research was supported by Zhejiang Provincial Natural Science Foundation of China under Grant No. LY19C150002; Zhejiang Province Rare and Endangered Wild Animals and Plants Rescue and Protection Action Project -Rescue, protection and artificial breeding of Clematis tientaiensis; Zhejiang Science and Technology Major Program on Agricultural New Variety Breeding under Grant No. 2021C02071-6; Zhejiang Provincial Scientific and Technological Cooperation Project under Grant No. 2021SNLF021; Wenzhou Major Scientific and Technological Innovation Projects under Grant No. ZS2020002.
Data Availability Statement
The data were uploaded to the NCBI database (https://www.ncbi.nlm.nih.gov/Traces/study/?acc=PRJNA843088). The data that support the findings of this study are available from the corresponding author upon reasonable request.
Conflicts of Interest
The authors declare that they have no competing interests.
References
- Wang, W.; Li, L. Clematis L.—New classification system. J. Syst. Evol. 2005, 43, 431–488. [Google Scholar]
- Liu, Z.; Shao, W.; Shen, Y. Characterization of new microsatellite markers based on the transcriptome sequencing of Clematis finetiana. Hereditas 2018, 155, 23. [Google Scholar] [CrossRef] [PubMed]
- Huang, W. Research progress of Clematis L. plant. Chin. Tradit. Herb. Drugs 2002, 33, 285–288. [Google Scholar]
- Liu, H.; Hu, Q.; Zhang, H.; Qian, R.; Zhang, X.; Zheng, J. The endangered causes and protection countermeasures of Clematis tientaiensis and Clematis lanuginosa. Zhejiang Agric. Sci. 2022, 63, 3. [Google Scholar]
- Nishihara, M.; Nakatsuka, T. Genetic engineering of flavonoid pigments to modify flower color in floricultural plants. Biotechnol. Lett. 2011, 33, 433–441. [Google Scholar] [CrossRef]
- Tanaka, Y.; Tsu, D.; Kusumi, T. Metabolic engineering tomodify flower color. Plant. Cell Physiol. 1998, 39, 11. [Google Scholar] [CrossRef]
- Jaakola, L.; Maatta, K.; Pirttila, A. Expression of genes involved in anthocyanin biosynthesis in relation to anthocyanin, proanthocyanin, and flavonol levels during bilberry fruit development. Plant Physiol. 2002, 130, 729–739. [Google Scholar] [CrossRef]
- Thakur, M.; Nozzolillo, C. Anthocyanin pigmentation in roots of impatiens species. Rev. Can. Bot. 1978, 56, 2898–2903. [Google Scholar] [CrossRef]
- Forkmann, G.; Martens, S. Metabolic engineering and applications of flavonoids. Curr. Opin. Biotechnol. 2001, 12, 155–160. [Google Scholar] [CrossRef]
- Castellarin, D.; Gambetta, G.; Wada, H. Fruit ripening in vitis vinifera: Spatiotemporal relationships among turgor, sugar accumulation, and anthocyanin biosynthesis. J. Exp. Bot. 2011, 62, 4345–4354. [Google Scholar] [CrossRef]
- Chen, L.; Hrazdina, G. Structural aspects of anthocyanin-flavonoid complex formation and its role in plant color. Phytochemistry 1981, 20, 297–303. [Google Scholar] [CrossRef]
- Tanaka, Y.; Sasaki, N.; Ohmiya, A. Biosynthesis of plant pigments: Anthocyanins, betalains and carotenoids. Plant J. 2008, 54, 733–749. [Google Scholar] [CrossRef]
- Seeram, N.; Schutzki, R.; Chandra, A. Characterization, quantification, and bioactivities of anthocyanins in Cornus species. J. Agric. Food. Chem. 2002, 50, 2519–2523. [Google Scholar] [CrossRef]
- Ferreira, V.; Castro, I.; Carrasco, D. Genetics and expression of anthocyanin pathway genes in the major skin-pigmented Portuguese cultivar ‘Vinho’ developing berries. Sci. Hortic. 2019, 244, 88–93. [Google Scholar] [CrossRef]
- Pervaiz, T.; Songtao, J.; Faghihi, F. Naturally occurring anthocyanin, structure, functions and biosynthetic pathway in fruit plants. J. Plant Biochem. Physiol. 2017, 5, 2. [Google Scholar] [CrossRef]
- Han, Y.; Shi, W.; Guo, C. Characteristics of chitin synthase (CHS) gene and its function in polyspermy blocking in the blood clam Tegillarca granosa. J. Mollus. Stud. 2016, 4, 4. [Google Scholar]
- Montserrat, A. Nucleotide Sequence variation at two genes of the phenylpropanoid pathway, the FAH1 and F3H Genes, in Arabidopsis thaliana. Mol. Biol. Evol. 2001, 1, 1–9. [Google Scholar]
- Zuker, A.; Tzfira, T.; Ben-Meir, H. Modification of flower color and fragrance by antisense suppression of the flavanone 3-hydroxylase gene. Mol. Breed. 2002, 9, 33–41. [Google Scholar] [CrossRef]
- Zhang, Y.; Cheng, Y.; Xu, S. Tree peony variegated flowers show a small insertion in the F3’H gene of the acyanic flower parts. BMC Plant Biol. 2020, 20, 211. [Google Scholar] [CrossRef]
- Atsushi, H.; Yasumasa, M.; Jeong-Doo. Spontaneous Mutations of the flavonoid 3′-hydroxylase gene conferring reddish flowers in the three morning glory species. Plant Cell Physiol. 2003, 10, 990–1001. [Google Scholar]
- Mori, S.; Kobayashi, H.; Hoshi, Y. Heterologous expression of the flavonoid 3’,5’-hydroxylase gene of Vinca major alters flower color in transgenic Petunia hybrida. Plant Cell Rep. 2004, 22, 415–421. [Google Scholar] [CrossRef] [PubMed]
- Yu, M.; Salvador, L.A.; Sy, S.K.; Tang, Y.; Singh, R.S.; Chen, Q.Y.; Liu, Y.; Hong, J.; Derendorf, H.; Luesch, H. Largazole pharmacokinetics in rats by LC-MS/MS. Mar. Drugs 2014, 12, 1623–1640. [Google Scholar] [CrossRef] [PubMed]
- Mohamed, A.; Farag, A.; Porzel. Comparative metabolite profiling and fingerprinting of medicinal licorice roots using a multiplex approach of GC–MS, LC–MS and 1D NMR techniques. Phytochemistry 2012, 76, 60–72. [Google Scholar]
- Gorman, M.; Ball, T. Practice Summary: ChemStation Embarks on a New Approach to Customer Delivery. Interfaces 2015, 45, 567–571. [Google Scholar] [CrossRef]
- Geigenberger, P.; Tiessen, A.; Meurer, J. Use of non-aqueous fractionation and metabolomics to study chloroplast function in Arabidopsis. Methods Mol. Biol. 2011, 775, 135–160. [Google Scholar]
- Yang, J.; Yang, J. Why can LDA be performed in PCA transformed space. Pattern Recognit. 2003, 36, 563–566. [Google Scholar] [CrossRef]
- Shoval, O.; Goentoro, L.; Hart, Y.; Mayo, A.; Sontag, E.; Alon, U. Fold-change detection and scalar symmetry of sensory input fields. Proc. Natl. Acad. Sci. USA 2010, 107, 15995–16000. [Google Scholar] [CrossRef]
- Mortazavi, A.; Williams, B.; Mccue, K. Mapping and quantifying mammalian transcriptomes by RNA-Seq. Nat. Methods 2008, 5, 621–628. [Google Scholar] [CrossRef]
- Varet, H.; Brillet-Guéguen, J.; Coppée. SARTools: A DESeq2- and EdgeR-Based R Pipeline for comprehensive differential analysis of RNA-Seq Data. PLoS ONE 2016, 11, 1–12. [Google Scholar] [CrossRef]
- Coen, E.; Carpenter, R. The Metamorphosis of flowers. Plant. Cell. 1993, 5, 1175–1181. [Google Scholar] [CrossRef]
- Ausin, I.; Alonso-Blanco, C.; Martinez-Zapater, J. Environmental regulation of flowering. Int. J. Dev. Bio. 2004, 49, 689–705. [Google Scholar] [CrossRef]
- Coen, E.; Meyerowitz, E. The War of the whorls: Genetic interactions controlling flower development. Nature 1991, 353, 31–37. [Google Scholar] [CrossRef]
- Nahvi, A.; Sudarsan, N.; Ebert, M. Genetic control by a metabolite binding mRNA. Chem. Biol. 2002, 9, 1043–1049. [Google Scholar] [CrossRef]
- Trapnell, C.; Hendrickson, D.; Sauvageau, M. Differential analysis of gene regulation at transcript resolution with RNA-seq. Nat. Biotechnol. 2013, 31, 46. [Google Scholar] [CrossRef]
- Nijveldt, R.; Els, V.; Ec, V. Flavonoids: A review of probable mechanisms of action and potential applications. Am. J. Clin. Nutr. 2001, 4, 418–425. [Google Scholar] [CrossRef]
- Treutter, D. Significance of flavonoids in plant resistance: A review. Environ. Chem. Lett. 2006, 4, 147. [Google Scholar] [CrossRef]
- Williams, C.; Grayer, R. Anthocyanins and other flavonoids. Nat. Prod. Rep. 2004, 21, 539–573. [Google Scholar] [CrossRef]
- Jackson, D.; Roberts, K.; Martin, C. Temporal and spatial control of expression of anthocyanin biosynthetic genes in developing flowers of Antirrhinum majus. Plant J. 2010, 2, 425–434. [Google Scholar] [CrossRef]
- Lehtonen, H.; Rantala, M.; Suomela, J. Urinary excretion of the main anthocyanin in Lingonberry (Vaccinium vitis-idaea), cyanidin 3-O-galactoside, and itis Metabolites. J. Agric. Food. Chem. 2009, 57, 4447–4451. [Google Scholar] [CrossRef]
- Bub, A.; Watzl, B.; Heeb. Malvidin-3-glucoside bioavailability in humans after ingestion of red wine, dealcoholized red wine and red grape juice. Eur. J. Nutr. 2001, 40, 113–120. [Google Scholar] [CrossRef]
- Stushnoff, C.; Ducreux, L.; Hancock, R. Flavonoid profiling and transcriptome analysis reveals new gene-metabolite correlations in tubers of Solanum tuberosum L. J. Exp. Bot. 2010, 61, 4. [Google Scholar] [CrossRef] [PubMed]
- Lou, Q.; Liu, Y.; Qi, Y. Transcriptome sequencing and metabolite analysis reveals the role of delphinidin metabolism in flower colour in grape hyacinth. J. Exp. Bot. 2014, 12, 3157–3164. [Google Scholar] [CrossRef] [PubMed]
- Chen, X.; Yang, X.; Xie, J. Biochemical and comparative transcriptome analyses reveal key genes involved in major metabolic regulation related to colored leaf formation in osmanthus fragrans ‘yinbi shuanghui’ during development. Biomolecules 2020, 10, 4. [Google Scholar] [CrossRef] [PubMed]
- Chen, D.; Yang, Y.; Niu, G. Metabolic and RNA sequencing analysis of cauliflower curds with different types of pigmentation. AoB Plants 2022, 14, 2. [Google Scholar] [CrossRef]
- Yang, K.; Jeong, N.; Moon, J. Genetic analysis of genes controlling natural variation of seed coat and flower colors in soybean. J. Hered. 2010, 1, 757. [Google Scholar] [CrossRef]
- Suzuki, K.; Xue, H.; Tanaka, Y. Flower color modifications of Torenia hybrida by cosuppression of anthocyanin biosynthesis genes. Mol. Breed. 2000, 6, 239–246. [Google Scholar] [CrossRef]
- Liu, X.; Chao, F.; Zhang, M. The MrWD40-1 Gene of Chinese Bayberry (Myrica rubra) Interacts with MYB and bHLH to enhance anthocyanin accumulation. Plant Mol. Biol. Rep. 2013, 31, 1474–1484. [Google Scholar] [CrossRef]
- An, X.; Tian, Y.; Chen, K.; Wang, X.; Hao, Y. The apple WD40 protein MdTTG1 interacts with bHLH but not MYB proteins to regulate anthocyanin accumulation. J. Plant Physiol. 2012, 169, 710–717. [Google Scholar] [CrossRef]
- Pang, Y.; Wenger, J.; Saathoff, K. A WD40 repeat protein from Medicago truncatula is necessary for tissue-specific anthocyanin and proanthocyanidin biosynthesis but not for trichome development. Plant Physiol. 2009, 151, 1114–1129. [Google Scholar] [CrossRef]
Disclaimer/Publisher’s Note: The statements, opinions and data contained in all publications are solely those of the individual author(s) and contributor(s) and not of MDPI and/or the editor(s). MDPI and/or the editor(s) disclaim responsibility for any injury to people or property resulting from any ideas, methods, instructions or products referred to in the content. |
© 2022 by the authors. Licensee MDPI, Basel, Switzerland. This article is an open access article distributed under the terms and conditions of the Creative Commons Attribution (CC BY) license (https://creativecommons.org/licenses/by/4.0/).