Abstract
Clematis is a perennial ornamental vine known as the “Vine Queen” for its gorgeous floral color and rich flower shape. Clematis tientaiensis, an endangered plant, is a key protected wild plant and a rare breeding parent of Clematis because of its extremely high ornamental value. Light environment is one of the important environmental factors affecting the space distribution and the size of C. tientaiensis population. One-year-old homogenous and healthy potted C. tientaiensis plants were grown under four different light intensities (T1: 1800 ± 30/0 µmol m−2 s−1; T2: 1500 ± 30/0 µmol m−2 s−1; T3: 1200 ± 30/0 µmol m−2 s−1; T4: 900 ± 30/0 µmol m−2 s−1). This study analyzed the potential adaptive mechanism of C. tientaiensis in response to irradiance by investigating the photosynthesis, rapid light curve, chloroplast ultrastructure, Rubisco activase enzyme (RAC), Rubisco enzyme, amino acids, and gene expression under four irradiance treatments. High light caused the leaves chlorosis and yellowing, reduced the net photosynthetic rate (Pn), stomatal conductance (Gs), RAC and Rubisco enzyme activity; the quantum yield of unregulated energy dissipation [Y(NO)], and increased the content of eight amino acids content. The expression of psbA, psbB, psbC, and Psb(OEC) were down-regulated with decreasing irradiance. The results showed that C. tientaiensis plants grown under T1 (1800 ± 30 µmol m−2 s−1) irradiance were in danger of absorbing more light energy than they could use for photosynthesis, while they exhibited good adaptability to the T3 (1200 ± 30 µmol m−2 s−1) irradiance, and the PSII reaction center and Rubisco and RCA enzymes could be the key points in response to high light stress, which also emphasized the importance of appropriate light management practices for promoting the growth and population expansion of C. tientaiensis.
1. Introduction
Clematis, a perennial woody or herbaceous vine belonging to the Ranunculaceae family, has been widely used for its medicinal value since ancient times in China [1]. In recent years, it is famous for its diverse flower types, rich color and many species and its common uses include ground cultivation, pot planting and vertical wall greening in landscape gardening [2], therefore which is known as “the queen of vines” [3]. There are about 300 species of Clematis in the world, and 147 species of wild Clematis in China, accounting for about half of the world’s total, is the country with the most abundant plant resources of this genus.
Clematis tientaiensis is endemic to Zhejiang Province and a key protected wild plant in Zhejiang Province. It is a rare breeding parent of Clematis because of its grandiflora, large amount of flowers, rich variation in color and medicinal value. However, the distribution of C. tientaiensis is narrow and the natural regeneration is difficult. It is only scattered in the hillside forest margins and shrubs in southeastern Zhejiang Province (Figure 1). Moreover, environmental change and multifarious artificial activities also change and degrade habitats of C. tientaiensis, greatly limit population expansion of C. tientaiensis, and eventually lead to endangered.
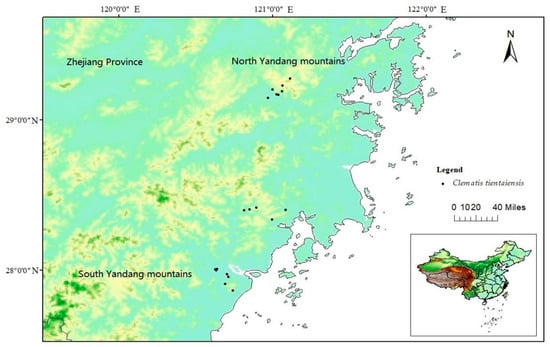
Figure 1.
The field distribution site of C. tientaiensis population.
Light environment is one of the important environmental factors affecting the space distribution and the contraction and expansion of plant population. It is evident that light contribute to increase in plant species richness within productive sites like tropical rainforests, combined with a greater range of light intensities and spectra [4]. The same mechanism may also apply in subtropical area. There is also mounting evidence that light disrupt local adaptation in plants, such as wild Arabidopsis [5,6]. Light environment is impacting the size of Clametis habitat through plant injury and death from extreme intense light, such as Clametis crassifolia [7,8]. Therefore, in order to explore the optimum light conditions for the growth of C. tientaiensis and expand the its wild population, it is necessary to elucidate the adaptability of C. tientaiensis to high light condition. This information will contribute to the population expansion and cultivation management of C. tientaiensis.
Light intensity is one of the most important factors affecting plant photosynthesis. Plant growth depends on photosynthesis [9]. It is the only photochemical process that known to efficiently store the energy of visible light in the form of energy of chemical compounds [10]. Plants absorb and capture light energy using chlorophyll and convert water, carbon dioxide, and other small amounts of inorganic salts into carbohydrates, amino acids, and other organic molecules [11]. Nearly allorganisms on Earth use these molecules as sources of “energy” in the process of growth. Tang et al. [12] reported Torreya grandis seedlings grown under full sunlight had lower net photosynthetic rate and photosynthetic electron transport rate than leaves of plants grown in low light intensity, leading to reduced growth in T. grandis. Similarly, exposure of bayberry tree to a high irradiance (1300 µmol m−2 s−1) can cause a depression of photosynthesis and photosystem II efficiency [13]. However, Schumann et al. [14] reported that plants under high light or sunlight exhibited a loosening, or vertical unstacking of thylakoid and reduced grana stacking but higher energy dissipation capacity (estimated from NPQ) than leaves of plants grown under low sunlight (or shade), such as Monstera [15], Spinach [16].
The absorption and utilization of light energy is closely related to the state of photosynthetic apparatus in plants. The photosystemsII is the primary site where photosynthesis takes place, and is therefore of great significance to the utilization of light energy and maintaining the stability of photosynthesis [17]. Earlier studies have shown that high light or sunlight can damage the activity of the photosynthetic apparatus, resulting in photoinhibition or even photodamage to PSII [18,19]. This destructive effect may be due to damage to the plastoquinone binding protein, which is generally considered to be the D1 protein on the PSII complex. The damage to D1 protein will disrupt the charge separation between the PSII reaction center P680 and pheophytin a, thereby interrupting the electron transfer of PSII, and thus resulted in oxygen free radical excessive production [20]. These hydroxyl free radicals destroy the composition of the oxygen-evolving complex (OEC) and impede its turnover [18], ultimately inhibit plant growth. The Rubisco enzyme, which is reported has the function of protecting plants against various environmental stresses, such as high light [21,22]. Fukayama et al. [23] found that the decline in photosynthetic capacity during flag leaf senescence after the heading of rice was closely related to the decrease in Rubisco enzyme and RCA. Rubisco in plants must be activated by RCA to exhibit its carboxylation and oxygenation activity, that is, the activity of Rubisco in plants depends on its activation by Rubisco activase [24,25,26].
In recent years, researches on C. tientaiensis mainly focus on flower color mechanism [27], nitrogen nutrition [28] and medicinal ingredients [29], whereas studies on its adaptability to light intensity have not been reported. In this study, with the aim of exploring the potential adaptive mechanism of C. tientaiensis reponse to high light condition and providing a information of population expansion and cultivation management, the chloroplast ultrastructure, Rubisco activity, chlorophyll fluorescence parameters, and related gene expression levels in the leaves of C. tientaiensis were analyzed in response to different light intensity stress, which provided a further theoretical basis and scientific basis for the cultivation, management, and photoadaptive study of C. tientaiensis.
2. Materials and Methods
2.1. Plant Materials and Growth Conditions
In late May 2020, a pot experiment was established at Zhejiang Institute of Subtropical Crops, Zhejiang Province, China (N28°23′, E120°72′). One-year-old homogenous and healthy C. tientaiensis plants were grown in an artificial incubator (MC1000, Snijders, The Netherlands) under a 16/8-h light/dark cycle at 30 ± 2 °C 60% relative humidity during the day, 20 ± 2 °C at night, and 65% humidity for 30 days. Photosynthetically active radiation (PAR) of 1800 ± 30/0 µmol m−2 s−1, day/night was provided as the T1 treatment; PAR of 1500 ± 30/0 µmol m−2 s−1 day/night was provided as the T2 treatment; PAR of 1200 ± 30/0 µmol m−2 s−1 day/night was provided as the T3 treatment; and PAR of 900 ± 30/0 µmol m−2 s−1 day/night was provided as the T4 treatment. The irradiance was measured using a Digital Lux Meter (TES-1339R, Taiwan). Ten replications per treatment and 3 plants per replication, 30 pots per treatment in total. All pots were irrigated daily to keep plants well-watered (75% soil moisture content). After treatments, materials for the measurements of the photosynthetic rate, RAC, Rubisco activity, chlorophyll content, chlorophyll fluorescence, chloroplast ultrastructure, superoxide anion production rate (O2−·), and peroxide (H2O2) content were collected from the leaves in each treatment, cleaned, and immediately frozen in liquid nitrogen and stored at −80 °C for the analysis of amino acid and gene expression. Experimental treatments were repeated three times.
2.2. Chlorophyll Content Analysis
Leaves were collected for determination of chlorophyll content (Chl a and Chl b). Chlorophyll contents (Chl a and Chl b) were measured by the acetone extraction method as described by Lichtenthaler with an ultraviolet spectrophotometer (Shimadzu UV-2550, Kyoto, Japan) and expressed as mg g–1 fresh weight (FW) [30].
2.3. Photosynthetic Parameters and Chlorophyll Fluorescence Parameters Measurements
Healthy and fully-developed leaves (subleathery, ovate-lanceolate, bottle-green) were selected for the determination of the net photosynthetic rate (Pn, µmol m−2 s−1), stomatal conductance (Gs, µmol mol−1), intercellular carbon dioxide concentration (Ci, µmol/(H2O m2 s)), and transpiration rate (Tr, mmol m−2 s−1). Measurements were taken with an LI-6400 XT portable photosynthesis system (LI-COR Inc., Lincoln, USA). The measurements were carried out from 9:30 to 11:00 a.m. on sunny days at 1200 µmol m−2 s−1 PAR white light, 400 µmol of CO2 mol−1 (CO2 of dry air), 55% relative humidity and temperature 28–32 °C [31].
Chlorophyll fluorescence parameters was measured as the method described by Hendrickson et al. 2004 using a portable Dual PAM-100 Fluorometer (WALZ, Germany). Leaves were dark-adapted for 20 min and then the fast light curve were measured at 0, 10, 18, 36, 94, 172, 214, 330, 501, 759, 923, 1178, 1455 µmol m−2 s−1 PAR. The calculation formula is as follows: Y(II) = (F’m − Ft)/F’m (Genty et al., 1989); Y(NO) = Ft/Fm; Y(NPQ) = (Ft/F’m) − (Ft/Fm) [32], Y(II) + Y(NPQ) + Y(NO) = 1. where: Y(II) is the actual photochemical quantum efficiency of PSII; Y(NO) is the fluorescence and light-independent fundamental heat dissipation quantum efficiency in PSII; Y(NPQ) is the heat dissipation quantum efficiency regulated by ΔpH and lutein in PSII.
2.4. Rubisco Activase Enzyme (RAC) and Rubisco Enzyme Activity Analysis
The Rubisco carboxylase activity was measured using the method described by Tsuyoshi et al. [33]. In short, 0.5 g of fresh leaves was weighed, liquid nitrogen was added to grind, and 4 mL of extraction solution was added (50 mmol·L−1 Tris-HCl, 0.01% (v/v) TritonX-100, 1 mmol·L−1 EDTA, 10 mmol·L−1 DTT, 10 mmol·L−1 MgCl2, pH 7.6). The sample was then centrifuged at 4 °C 15000 g for 15 min and the supernatant was saved. One milliliter supernatant was mixed with NADH (5 mM, 0.1 mL), ATP (50 mM, 0.1 mL), NaHCO3 (0.2 mol·L−1, 0.1 mL), reaction medium (0.7 mL, 100 mm−1 Tris-HCl, containing 12 mmol·L−1 MgCl2, 0.4 mmol·L−1 EDTA·Na2, pH 7.6), creatine phosphokinase, glyceraldehyde phosphate dehydrogenase, and glycerate phosphokinase (160 U·mL−1, 0.5 mL), and 0.15 mL of distilled water. Then the mixture was poured into a cuvette, and the absorbance was measured every 30 s for 3 min. The enzyme activity was calculated based on the absolute value of the decrease in absorbance of OD340 nm per minute. The activity was expressed as mmol·g−1·min−1. The activity of RCA was measured using the method described in the instruction manual of the GENED Bradford Protein Concentration Quantitative Kit GMS30030.1 (Jiancheng Co., Ltd., Nanjing, China).
2.5. H2O2 Content and O2−· Production Rate Analysis
For the analysis of the H2O2 content and O2−· production rate analysis, 0.5 g leaf samples were homogenized with 8 mL potassium phosphate buffer (50 mM, pH 7.4) and then centrifuged at 8000× g, 4 °C for 15 min. One milliliter of supernatant was mixed with 0.9 mL potassium phosphate buffer (50 mM, pH 7.4) and 0.1 mL hydroxylamine hydrochloride (10 mM). The mixture was incubated at 25 °C for 30 min. Then, 1 mL incubation solution was added to the same volume of 3-aminobenzenesulfonic acid (17 mM) and 1-naphthylamine (7 mM), and then incubated at 25 °C for 20 min. The absorbance was measured at 530 nm. The O2−· production rate was expressed as µM min−1 mg−1 FW using the method described by Wang and Luo [34]. The H2O2 content was measured following the method described by Patterson et al. [35] and expressed as mMg−1 FW.
2.6. Chloroplast Ultrastructure Analysis
The chloroplast ultrastructure was observed using a transmission electron microscope (H7650, Hitachi., Tokyo, Japan) as described by Deng et al. [36]. The fresh leaves were diced and immediately fixed in glutaraldehyde (2.5% (v/v), 0.1 M phosphate buffer, pH 7.2) for 24 h. The leaf samples were then rinsed through a series of elutions, immersed in osmium acid (1% (v/v)) for post-fixation, and embedded in resin for ultrathin sectioning.
2.7. Amino Acid Content Analysis
Leaf samples were weighed, and then 1 mL methanol was added to 1 g of leaves, homogenized in an ultrasonic instrument, and centrifuged at 4 °C 10,000× g for 15 min. The supernatant was transferred to heat-resistant tubes and diluted 10 times. One hundred microliters of supernatant and the same standard solution (100 ppb) were mixed; the mixture was filtered and then injected into an Acquity UPLC system (Waters., Manchester, UK) for analysis. The sample injection volume was 5 µL. The MS analysis was performed by a spectrometer (4000 mass., AB., FL, USA) equipped with an ESI source in the positive-ion mode working in the multiple reaction monitoring mode [37] and the various amino acid content were calculated and expressed as µg g−1 FW.
2.8. Related Gene Expression Analysis
Total RNA was isolated from Clematis leaves using an RNeasy column (Qiagen, CA, USA), and qRT-PCR experiments were conducted using Real Master Mix (SYBR Green) (Roche Applied Science, Mannheim, Germany). The genes were the same as those reported previously [7]. The primers used for real-time PCR are listed in Table 1.

Table 1.
Primers information for the quantification of gene expression by qRT-PCR.
2.9. Data Analysis
Statistical analysis was conducted using a one-way analysis of variance (ANOVA) with SPSS software version 22.0 (SPSS, Chicago, IL, USA). Duncan’s multiple range test was used to detect differences between means.
3. Results
3.1. Leaf Morphology Response to Different Levels of Irradiance
The leaf morphology of C. tientaiensis grown under different levels of irradiance for one month are shown in Figure 2. The light intensity had a significant effect on the leaf growth of C. tientaiensis. The high irradiance caused the leaves to turn yellow, while the decreasing irradiance resulted in a gradual increase in leaf area. The quantitative analysis of leaf area is shown in Table 2. The leaf area of C. tientaiensis increased with the increase of irrrandice, and the leaf area of C. tientaiensis grown under T4 was approximately 3.89 times of that grown under T1 irradiance.
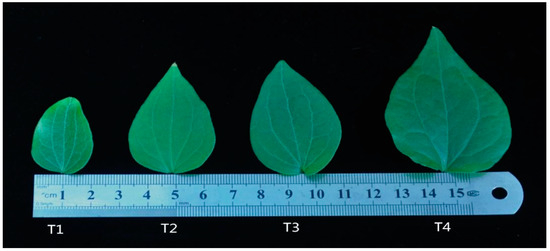
Figure 2.
Effect of different irradiance levels on the phenotype of the leaves of C. tientaiensis. A steel ruler indicates the scale, four different levels of Irradiance incuding T1 (1800 ± 30/0 µmol m−2 s−1), T2 (1500 ± 30/0 µmol m−2 s−1), T3 (1200 ± 30/0 µmol m−2 s−1) and T4 (900 ± 30/0 µmol m−2 s−1).

Table 2.
Quantitative analysis of leaf area of C. tientaiensis grown under different irradiance levels. The values presented are the means ± SE (n = 10 plants). Different lowercase letters indicate significant differences based on one-way ANOVA followed by Duncan’s multiple comparisons (p ≤ 0.05).
3.2. Chlorophyll Content Response to Different Levels of Irradiance
The decreasing light intensity caused an obvious increase in the Chla, Chlb, and carotenoid contents of C. tientaiensis leaves (Figure 3). The Chla content of C. tientaiensis leaves under the T4 irradiance treatment was approximately 1.5 times as much as that under T1 light intensity. The Chlb content increased by 74% (p < 0.05), 131.6% (p < 0.05), and 175.1% (p < 0.05) under T2, T3 and T4 irradiance, respectively, compared with under T1 light intensity.
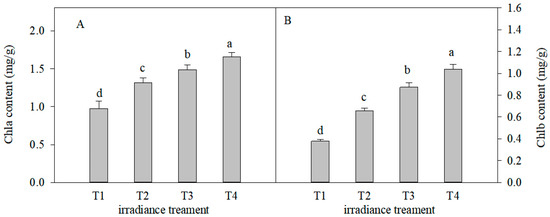
Figure 3.
Effects of chlorophyll a (Chla) (A) and chlorophyll b (Chlb) (B) in C. tientaiensis subjected to different irradiance levels, including T1 (1800 ± 30/0 µmol m−2 s−1), T2 (1500 ± 30/0 µmol m−2 s−1), T3 (1200 ± 30/0 µmol m−2 s−1) and T4 (900 ± 30/0 µmol m−2 s−1). The values presented are the means ± SE (n = 10 plants). Different lowercase letters (a–d) indicate significant differences based on one-way ANOVA followed by Duncan’s multiple comparisons (p ≤ 0.05). Please refer to the attached Table S1 for specific data.
3.3. Responses of Photosynthetic Parameters and Chlorophyll Fluorescence Parameters to Different Levels of Irradiance
The variation trend in the gas exchange parameters of C. tientaiensis under the four light-intensity treatments is presented in Figure 4. The Pn increased at first and then decreased with the decreasing irradiance. The Pn of C. tientaiensis under T3 irradiance was higher than that under other light-intensity treatments (p < 0.05). However, there was no significant difference in the Pn of C. tientaiensis between T1 and T4 treatments. Irradiance affected the Gs and Tr of C. tientaiensis prominently, and the Gs and Tr increased firstly and then decreased with the decrease of the light intensity. The Ci values of C. tientaiensis under the T1 and T3 treatments were higher than those under other irradiance levels, while there was no significant difference between them. The effect of irradiance on chlorophyll fluorescence parameters in C. tientaiensis is shown in Figure 5. The figure focuses on observing the area of Y(II), Y(NPQ) and Y(NO). Y(II) + Y(NPQ) + Y(NO) = 1, where: Y(II) is the actual photochemical quantum efficiency of PSII; Y(NO) is the fluorescence and light-independent fundamental heat dissipation quantum efficiency in PSII; Y(NPQ) is the heat dissipation quantum efficiency regulated by ΔpH and lutein in PSII.The Y(NO) significantly descended with declining light intensity from T1 (1800 ± 30 µmol m−2 s−1) to T3 (1200 ± 30 µmol m−2 s−1) in C. tientaiensis, which was highest under T1 treatments among all irradiance treatments. Y(II) of C. tientaiensis under T3 treatments was higher than other irradiance treatments. However, there was no significant difference in Y(II) and Y(NPQ) of C. tientaiensis between T1 and T2 irradiance treatments.
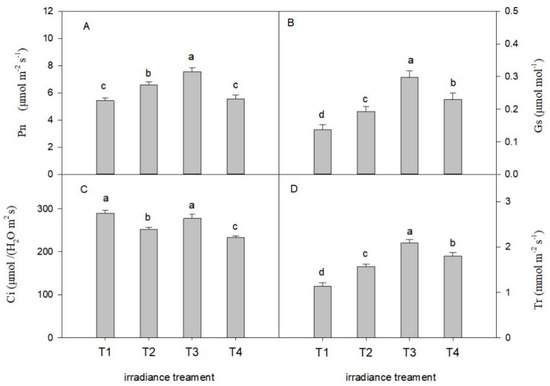
Figure 4.
Photosynthetic parameters of C. tientaiensis subjected to four different irradiance levels, including T1 (1800 ± 30/0 µmol m−2 s−1), T2 (1500 ± 30/0 µmol m−2 s−1), T3 (1200 ± 30/0 µmol m−2 s−1) and T4 (900 ± 30/0 µmol m−2 s−1). (A) Net photosynthetic rate (Pn); (B) Stomatal conductance (Gs); (C) Intercellular CO2 concentration (Ci); (D) Transpiration rate (TR). measuring irradiance: 1200 µmol m−2 s−1 PAR. The values presented are the means ± SE (n = 10 plants). Different lowercase letters (a–d) indicate significant differences based on one-way ANOVA followed by Duncan’s multiple comparisons (p ≤ 0.05). Please refer to the attached Table S2 for specific data.
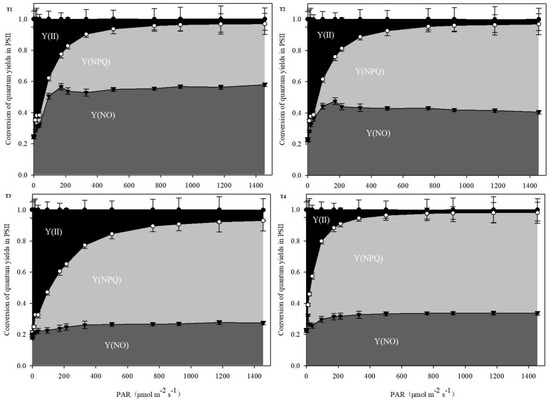
Figure 5.
Estimated fraction of Y(II), Y(NPQ), and Y(NO) of C. tientaiensis under four levels of irradiance with increasing photosynthetic active radiation (PAR). T1 (1800 ± 30/0 µmol m−2 s−1), T2 (1500 ± 30/0 µmol m−2 s−1), T3 (1200 ± 30/0 µmol m−2 s−1) and T4 (900 ± 30/0 µmol m−2 s−1).
3.4. RAC and Rubisco Activity Response to Different Levels of Irradiance
Light intensity had an observable impact on the RAC and Rubisco activity of C. tientaiensis (Figure 6). The RAC increased by 28.04% (p < 0.05), 68.2% (p < 0.05), and 26.2% (p < 0.05) under T2, T3, and T4 light intensity, respectively, compared with that under T1 irradiance. The Rubisco activity increased by 12.8% (p < 0.05), 33.5% (p < 0.05), and 13.4% (p < 0.05) under the T2, T3, and T4 treatments, respectively, compared with that under T1 irradiance. Furthermore, there was no significant difference in the RAC and Rubisco activity of C. tientaiensis between T2 and T4 irradiance treatments.
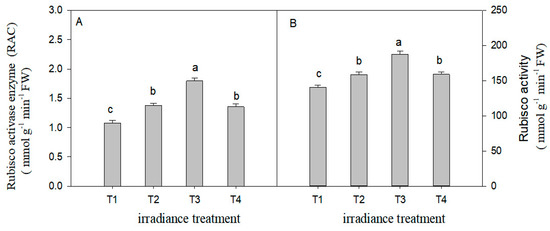
Figure 6.
The Rubisco activase enzyme (RAC) (A) and Rubisco enzyme activity (B) of C. tientaiensis subjected to different levels, irradiance including T1 (1800 ± 30/0 µmol m−2 s−1), T2 (1500 ± 30/0 µmol m−2 s−1), T3 (1200 ± 30/0 µmol m−2 s−1) and T4 (900 ± 30/0 µmol m−2 s−1). The values presented are the means ± SE (n = 10 plants). Different lowercase letters (a–d) indicate significant differences based on one-way ANOVA followed by Duncan’s multiple comparisons (p ≤ 0.05). Please refer to the attached Table S3 for specific data.
3.5. H2O2 Content and O2−· Production Rate Response to Different Irradiance Levels
The variation tendency in H2O2 content and O2−· production rate of C. tientaiensis are shown in Figure 7. Compared with the T1 irradiance, the H2O2 content decreased by 32.05% (p < 0.05), 49.5% (p < 0.05), and 38.7% (p < 0.05) under the T2, T3, and T4 treatments, respectively. A similar trend was also observed in the O2−· production rate of C. tientaiensis.
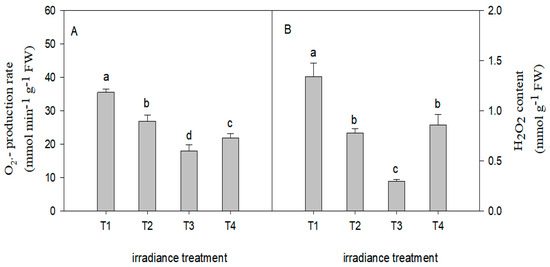
Figure 7.
The O2−· production rate (A) and H2O2 content (B) of C. tientaiensis subjected to different irradiance levels, including T1 (1800 ± 30/0 µmol m−2 s−1), T2 (1500 ± 30/0 µmol m−2 s−1), T3 (1200 ± 30/0 µmol m−2 s−1) and T4 (900 ± 30/0 µmol m−2 s−1). The values presented are the means ± SE (n = 10 plants). Different lowercase letters (a–d) indicate significant differences based on one-way ANOVA followed by Duncan’s multiple comparisons (p ≤ 0.05). Please refer to the attached Table S4 for specific data.
3.6. Chloroplast Ultrastructure Response to Different Irradiance Levels
Chloroplast ultrastructure was significantly influenced by light intensity (Figure 8). The chloroplasts of C. tientaiensis grown under T1 irradiance showed the swelling, distortion, and stacking structure disorder grana lamellae. The C. tientaiensis grown under T2 and T3 irradiance had grana that contained an increased number of legible thylakoid membranes than plants grown under T1 treatments. Additionally, clear starch granules and osmiophilic globules were observed in C. tientaiensis under different light intensities.
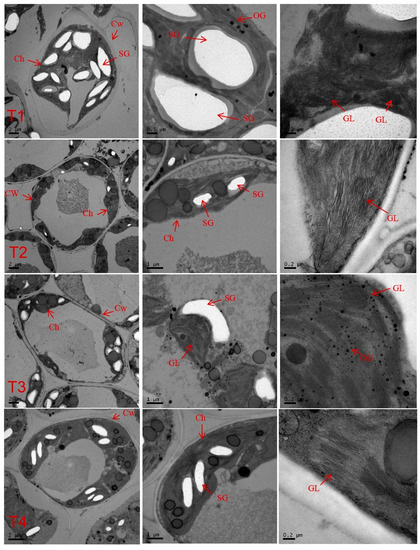
Figure 8.
Effects of different irradiance levels on the chloroplast ultrastructure of C. tientaiensis. T1 (1800 ± 30/0 µmol m−2 s−1), T2 (1500 ± 30/0 µmol m−2 s−1), T3 (1200 ± 30/0 µmol m−2 s−1) and T4 (900 ± 30/0 µmol m−2 s−1). (n = 10 plants) Ch, chloroplast; CW, cell wall; SG, starch grains; OG, osmiophilic granule; GL, grana lamella.
3.7. Amino Acid Content Response to Different Irradiance Levels
The variation in amino acid content of C. tientaiensis under different light-intensity treatments is shown in Table 3. Alanine, aminobutyric acid, proline, glutamine, and lysine significantly decreased in C. tientaiensis under the T2, T3, and T4 treatments compared with the T1 treatment. Tyrosine was only detected in C. tientaiensis under the T1 treatment, and glycine was only detected under the T1, T2, and T3 treatments. Valine, asparagine, aspartic acid, glutamic acid, and tryptophan were upregulated in C. tientaiensis with the decrease in irradiance. Leucine and phenylalanine content in C. tientaiensis under T3 light intensity were higher than under other treatments.

Table 3.
Amino acid contents of C. tientaiensis grown under different light intensity treatments.
3.8. Related Gene Expression Response to Different Irradiance Levels
The expression levels of psbA, psbB, psbC and Psb (OEC) in C. tientaiensis under different irradiance treatments are shown in Figure 9. The expression levels of psbA psbB, psbC, and Psb (OEC) genes were significantly affected by irradiance. The expression levels of psbA, psbB, psbC, and Psb (OEC) genes in C. tientaiensis exhibited significant down-regulation and were remarkably lower (>2.0-fold) with the decreasing irradiance.
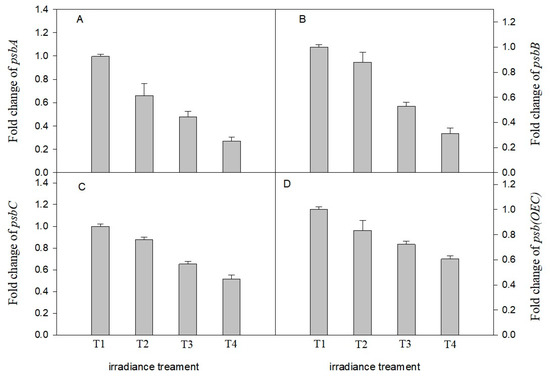
Figure 9.
Effects of different irradiance levels on gene expression of psbA (A), psbB (B), psbC (C) and psb(OCE) (D) in C. tientaiensis leaves. Irradiance levels including T1 (1800 ± 30/0 µmol m−2 s−1), T2 (1500 ± 30/0 µmol m−2 s−1), T3 (1200 ± 30/0 µmol m−2 s−1) and T4 (900 ± 30/0 µmol m−2 s−1). Bars indicate SE (n = 3). Please refer to the attached Table S5 for specific data.
4. Discussion
It is well kown that light in an envionment variable affecting the spatial distribution, biomass and diversity of terrestrial animals and plants [38]. Plants often needs to deal with a fast-fluctuating and highly unpredictable light intensity covering several orders of magnitude under most natural conditions, and thus photosynthetic apparatus in plants frequently face either highly effective absorption and utilization light energy to photosynthesis under low light conditions, or powerful dissipation the light energy absorbed in high light environments while cannot be utilized in photosynthesis [15]. In the current study, the high light (T1, 1800 ± 30 µmol m−2 s−1) caused leaf tine fading and yellowing of C. tientaiensis (Figure 2), however, healthier and larger leaves were observed from C. tientaiensis plants grown under other irradiance treatments (Figure 2). Similar results were reported in C. crassifolia [7], Clematis cadmia [7], and Torreya grandis [12]. C. tientaiensis plants enhance the absorption of light energy through increasing leaf area under low light conditions to maintain the photosynthesis of plants, and ultimately ensure continued growth. These results show the typical and common characteristics of plants grown under high light in comparison with those under low light (or shade).
Plant photosynthesis takes place mainly in chloroplasts. Accordingly, the structure and location of chloroplasts within the leaves can optimize the capture of light energy [38]. Chlorophyll, acting as energetic antenna, absorb light energy and transfer electron excitation states towards photochemical reaction centers [39]. In this study, a significant increase in chlorophyll content was observed in C. tientaiensis with the decreasing irradiance (Figure 3). These findings indicate that C. tientaiensis plants absorbed more light energy than was used in photosynthesis under T1 (1800 ± 30 µmol m−2 s−1) irradiance, and excess light energy destroyed the synthesis of chlorophyll in plants and accelerated the degradation of chlorophyll [40]. In the present study, the swollen and deformed chloroplasts and irregular shapes of the grana with fractured grana lamella and a disordered thylakoid membrane were observed under T1 (1800 ± 30 µmol m−2 s−1) irradiance (Figure 8). This suggested that chloroplasts subjected to excess light energy changed the structure of the thylakoid membrane. These changes included the reduction of thylakoid stacking and the decomposition of the thylakoid membrane [41]. High light damages chloroplasts because the excess light energy produces fluxes of dioxygen and excess electrons, resulting in the over-reduction of the electron transport chain, which causes the increase and formation of reactive oxygen species (ROS) [42]. Thus, high-light-driven photosynthetic processes are the main contributors to chloroplastic ROS production in plants [42]. Consequently, a higher H2O2 content and O2−· production rate of C. tientaiensis under T1 (1800 ± 30 µmol m−2 s−1) irradiance were found in the current study (Figure 7). Consistent results have been reported in Camptotheca acuminata [41] and cucumber [43]. Excessive ROS destroy cell membrane structure of C. tientaiensis, resulting in membrane lipid peroxidation, and thereby lead to membrane dysfunction and increased cell osmotic pressure, finally impaired cell function [42]. The absorption and utilization of light energy directly affects the photosynthetic efficiency of plants. In this study, the Pn, Gs, and Tr increased firstly and then decreased with the decreasing light intensity, and the Pn, Gs, and Tr of C. tientaiensis under T1 (1800 ± 30 µmol m−2 s−1) irradiance was lower than that under other treatments (Figure 4). Similar results were found in C. acuminata [41] and Anoectochilus plantlets [44], suggesting that C. tientaiensis grown under T1 (1800 ± 30 µmol m−2 s−1) irradiance absorbed excessive light energy, and excess energy caused photooxidative stress and damaged the photosynthetic sensitive sites, ultimately reducing the Pn and efficiency of photosynthesis. The higher Ci of C. tientaiensis under T1 irradiance also supported this point.
The PSII reaction center is a key site for light reactions and is one of the most sensitive and vulnerable among the many reaction sites of photosynthesis [20]. The quantum yield of unregulated energy dissipation [Y(NO)] represents the ratio of basic heat dissipation of fluorescence and light-independent, which is an important indicator of photodamage [45]. If Y(NO) is high, it indicates that the incident light may exceed the acceptable level of plants and suffer from photodamage. Compared with C. tientaiensis under T1 irradiance treatment, the C. tientaiensis performed higher Y(II) and lower Y(NO) under T3 irradiance treatment (Figure 5), which indicated that excessive light energy produced by C. tientaiensis under T1 (1800 ± 30 µmol m−2 s−1) irradiance caused the light injury of PSII, and the deactivated reaction center further caused the degradation and destruction of structural proteins, thereby intercepted the PSII electron transport, and finally reduced the photosynthetic efficiency [46]. Consistent results have been found in cotton [47], and grape [48]. The degressive Y(NPQ) suggested that the protective ability of plants to PSII reaction center began to decline, especially the Y(NPQ) under T1(1800 ± 30 µmol m−2 s−1) which could better explain the protective mechanism of plants to deal with excess light energy.
PSII, a multi-subunit protein complex, is composed of more than 25 subunits. The D1 protein encoded by psbA stabilizes the structure of PSII through binding some cofactors and is closely related to photosynthetic electron transport [49]. The PSII electron donor OEC, encoded by psb(OEC), is one of the major damage sites under environmental stress [50]. In addition, psbB and psbC are involved in coding the protein subunits at the PSII reaction center [51]. In the study, the expression of psbA, psbB, psbC and psb(OEC) were down-regulated in C. tientaiensis with the decreasing irradiance from T1 (1800 ± 30 µmol m−2 s−1) to T4 (900 ± 30 µmol m−2 s−1) (Figure 9). The results showed that C. tientaiensis rapidly responded to light intensity and the timely synthesis of D1 protein and subunits to accelerate PSII repair and improve photosynthetic efficiency. In addition, the changes in expression levels of psbA, psbB, psbC and psb(OEC) also indicated that C. tientaiensis could accelerate the repair of the PSII reaction center through promoting the synthesis of PSII protein subunits, therey alleviate the damage of PSII reaction center caused by excess light energy, and therefore maintain normal photosynthesis [52].
The photosynthetic rates of plants are usually restricted by Rubisco activity. RCA is the key enzyme that regulates Rubisco activity [53]. The present study showed that the Rubisco activity and RCA of C. tientaiensis under T1 (1800 ± 30 µmol m−2 s−1) irradiance were lower than under other treatments, while the highest values of Rubisco activity and RCA were found under T3 (1200 ± 30 µmol m−2 s−1) irradiance (Figure 6). These findings indicated that the decrease of Pn under high light (1800 ± 30 µmol m−2 s−1) was closely related to the inhibition of Rubisco activity and RCA activity by high light. High light (1800 ± 30 µmol m−2 s−1) stress not only directly inhibited Rubisco activity, but also indirectly reduced Rubisco activity by restraining RCA activity [54].
Amino acids are a vital class of physiological active substances that play an important role in protecting plants from all kinds of environmental stress, including photoinhibition and photooxidative stress [55]. Proline and other small molecules synthesized with amino acids as precursors can accumulate under high light stress to maintain cell osmotic pressure [56]. Glycine is a synthetic substrate of glycine betaine that can stabilize the membrane system and protect PSII from peroxidation damage [57,58]. In addition, γ-aminobutyric acid, a nonprotein amino acid, is found in many plants, and can enhance antioxidant enzyme activity to eliminate excess ROS. In the current study, amino acids such as alanine, aminobutyric acid, proline, glutamine, tyrosine, and lysine were significantly higher in C. tientaiensis under the T1 (1800 ± 30 µmol m−2 s−1) treatment than other irradiance treatments, which indicated that alanine, aminobutyric acid, proline, glutamine, tyrosine, and lysine were increased to maintain cell osmotic pressure and relieve peroxidation damage to the PSII reaction center and thylakoid membranes, thereby improving the photosynthetic efficiency and mitigating the damage caused by excess light energy.
5. Conclusions
In conclusion, these results suggest that C. tientaiensis plants grown under T1 (1800 ± 30 µmol m−2 s−1) irradiance are in danger of absorbing more light energy than they can use for photosynthesis. The excess light energy had to be dissipated to avoid photoinhibition and photooxidative damage to the PSII reaction center, chloroplasts, Rubisco and RCA enzymes, photosynthetic process (Pn, Gs, Tr and Ci) and gene expression. This damage eventually appeared as chlorosis, or yellowing of the leaves and reduced Pn, Gs and Tr. In addition, the C. tientaiensis showed good adaptability to the T3 (1200 ± 30 µmol m−2 s−1) irradiance, and the PSII reaction center and Rubisco and RCA enzymes have been the key points in response to high light stress.The results of this study clearly indicate that light intensity is an important factor in affecting the growth and development of C. tientaiensis, either directly or indirectly.This emphasizes the importance of appropriate light management practices for promoting the growth and population expansion of C. tientaiensis. This study also serves as a theoretical basis for research on the photosynthetic response and molecular mechanisms in Clematis under light stress.
Supplementary Materials
The following supporting information can be downloaded at: https://www.mdpi.com/article/10.3390/horticulturae9010118/s1, Table S1: Effects of chlorophyll a (Chla) and chlorophyll b (Chlb) in C. tientaiensis subjected to different irradiance levels. Table S2: Photosynthetic parameters of C. tientaiensis subjected to four different irradiance levels. Table S3: The Rubisco activase enzyme (RAC) and Rubisco enzyme activity of C. tientaiensis subjected to different levels. Table S4: The O2− production rate and H2O2 content of C. tientaiensis subjected to different irradiance levels. Table S5: Effects of different irradiance levels on gene expression in C. tientaiensis leaves.
Author Contributions
Conceptualization, X.M. and J.Z.; methodology, X.M., Q.H. and X.Z.; software, X.M., J.Z. and R.Q.; validation, X.M. and J.Z.; formal analysis, X.M.; investigation, Q.Z., Q.H. and X.Z.; resources, R.Q.; data curation, X.M. and J.Z.; writing—original draft preparation, X.M.; writing—review and editing, X.M.; visualization, J.Z.; supervision, J.Z.; project administration, J.Z.; funding acquisition, J.Z. All authors have read and agreed to the published version of the manuscript.
Funding
This research was funded by the Zhejiang Province Major Scientific and Technological Project for New Variety Breeding of Agriculture in the 14th Five-year plan—Research of New Variety Selection and Breeding Technology in Clematis, the Zhejiang Provincial Key Research and Development Program (2019C02036), the Zhejiang Province Agriculture, Rural Areas and Six Parties Science and Technology Cooperation Plan (2021SNLF021), Zhejiang Science and Technology Major Program on Agricultural New Variety Breeding”(2021C02071-6), the Wenzhou Major Scientific and Technological Innovation Project (ZS2020002), the Zhejiang Province Public Welfare Project (LGN20C150001), the Natural Science Foundation of Zhejiang Province (LY19C150002), and the Zhejiang Rare and Endangered Wild Animals and Plants Rescue and Protection Action Project—In Situ Conservation and Artificial Breeding of Clematis tientaiensis.
Data Availability Statement
Not applicable.
Acknowledgments
We thank LetPub (www.letpub.com, accessed on 20–28 June 2021) for its linguistic assistance during the preparation of this manuscript.
Conflicts of Interest
The authors declare no conflict of interest.
References
- Relf, D.; Appleton, B.L. Selecting Landscape Plants: Ornamental Vines. Environ. Hortic. 2001, 130, 426–608. [Google Scholar]
- Kizu, H.; Tommori, T. Studies on the constituents of Clematis species. V. On the saponins of the root of Clematis chinensis OSBECK.(5). Chem. Pharm. Bull. 1982, 30, 3340–3346. [Google Scholar] [CrossRef]
- Liu, X.B.; Yang, B.X.; Zhang, L.; Lu, Y.Z.; Gong, M.H.; Tian, J.K. An in vivo and in vitro assessment of the anti-inflammatory, antinociceptive, and immunomodulatory activities of Clematis terniflora DC. extract, participation of aurantiamide acetate. J. Ethnopharmacol. 2015, 169, 287–294. [Google Scholar]
- Begon, M.E.; Harpe, J.L.; Townsend, C.R. Ökologie; Spektrum Akademischer Verlag: Berlin/Heidelberg, Germany, 1998; p. 750. [Google Scholar]
- Kubota, S.; Iwasaki, T.; Hanada, K.; Nagano, A.J.; Fujiyama, A.; Toyoda, A.; Sumio, S.; Yutaka, S.; Kouki, H.; Motomi, I.; et al. A genome scan for genes underlying microgeographic-scale local adaptation in a wild Arabidopsis species. PLoS Genet. 2015, 11, e1005361. [Google Scholar]
- McDonough MacKenzie, C.; Primack, R.B.; Miller-Rushing, A.J. Local environment, not local adaptation, drives leaf-out phenology in common gardens along an elevational gradient in Acadia National Park, Maine. Am. J. Bot. 2018, 105, 986–995. [Google Scholar] [CrossRef] [PubMed]
- Ma, X.; Qian, R.; Zhang, X.; Zhang, X.; Hu, Q.; Liu, H.; Zheng, J. Contrasting growth, physiological and gene expression responses of Clematis crassifolia and Clematis cadmia to different irradiance conditions. Sci. Rep. 2019, 9, 17842. [Google Scholar] [CrossRef] [PubMed]
- Zhang, Z.; Chen, Z.; Chen, F.; Xie, W.; Zhang, F.; Li, G. Additional Notes on the Seed Plant Flora of Zhejiang (VII). J. Zhejiang Sci. Technol. 2020, 40, 52–55. (In Chinese) [Google Scholar]
- Lambers, H.; Chapin, F.S.; Pons, T.L. Photosynthesis. In Plant Physiological Ecology; Springer: New York, NY, USA, 2008; Volume 2, pp. 11–99. [Google Scholar]
- Evans, J.R. Improving photosynthesis. Plant Physiol. 2013, 162, 1780–1793. [Google Scholar] [CrossRef]
- Ashraf, M.; Harris, P.J.C. Photosynthesis under stressful environments: An overview. Photosynthetica 2013, 51, 163–190. [Google Scholar] [CrossRef]
- Tang, H.; Hu, Y.Y.; Yu, W.W.; Song, L.L.; Wu, J.S. Growth, photosynthetic and physiological responses of Torreya grandis seedlings to varied light environments. Trees 2015, 29, 1011–1022. [Google Scholar] [CrossRef]
- Guo, W.D.; Guo, Y.P.; Liu, J.R.; Liu, J.R.; Mattson, N. Midday depression of photosynthesis is related with carboxylation efficiency decrease and D1 degradation in bayberry (Myrica rubra) plants. Sci. Hortic. 2009, 123, 188–196. [Google Scholar] [CrossRef]
- Schumann, T.; Paul, S.; Melzer, M.; Dörmann, P.; Jahns, P. Plant growth under natural light conditions provides highly flexible short-term acclimation properties toward high light stress. Front. Plant Sci. 2017, 8, 681. [Google Scholar] [CrossRef] [PubMed]
- Demmig-Adams, B.; Muller, O.; Stewart, J.J.; Cohu, C.M.; Adams, W.W. Chloroplast thylakoid structure in evergreen leaves employing strong thermal energy dissipation. J. Photochem. Photobiol. B. Biol. Off. J. Eur. Soc. Photobiol. 2015, 152 Pt B, 357–366. [Google Scholar] [CrossRef]
- Murakami, S.; Packer, L. Protonation and chloroplast membrane structure. J. Cell Biol. 1970, 47, 332–351. [Google Scholar] [CrossRef] [PubMed]
- Baghel, L.; Kataria, S.; Guruprasad, K.N. Effect of static magnetic field pretreatment on growth, photosynthetic performance and yield of soybean under water stress. Photosynthetica 2018, 56, 718–730. [Google Scholar] [CrossRef]
- Nath, K.; Jajoo, A.; Poudyal, R.S.; Timilsina, R.; Park, Y.S.; Aro, E.M.; Nam, H.G.; Lee, C.H. Towards a critical understanding of the photosystem II repair mechanism and its regulation during stress conditions. FEBS Lett. 2013, 587, 3372–3381. [Google Scholar] [CrossRef] [PubMed]
- Yehezkeli, O.; Tel-Vered, R.; Michaeli, D.; Nechushtai, R.; Willner, I. Photosystem I (PSI)/photosystem II (PSII)-based photo-bioelectrochemical cells revealing directional generation of photocurrents. Small 2013, 9, 2970–2978. [Google Scholar] [CrossRef]
- Huang, L.Y.; Li, Z.Z.; Liu, Q.; Pu, G.B.; Zhang, Y.Q.; Li, J. Research on the adaptive mechanism of photosynthetic apparatus under salt stress: New directions to increase crop yield in saline soils. Ann. Appl. Biol. 2019, 175, 1–17. [Google Scholar] [CrossRef]
- Hussain, S.; Iqbal, N.; Brestic, M.; Raza, M.A.; Pang, T.; Langham, D.R.; Safdar, M.E.; Ahmed, S.; Wen, B.X.; Gao, Y.; et al. Changes in morphology, chlorophyll fluorescence performance and Rubisco activity of soybean in response to foliar application of ionic titanium under normal light and shade environment. Sci. Total Environ. 2019, 658, 626–637. [Google Scholar] [CrossRef]
- Ogbaga, C.C.; Stepien, P.; Athar, H.U.R.; Muhammad, A. Engineering Rubisco activase from thermophilic cyanobacteria into high-temperature sensitive plants. Crit. Rev. Biotechnol. 2018, 38, 559–572. [Google Scholar] [CrossRef]
- Fukayama, H.; Mizumoto, A.; Ueguchi, C.; Katsunuma, J.; Morita, R.; Sasayama, D.; Hatanaka, T.; Azuma, T. Expression level of Rubisco activase negatively correlates with Rubisco content in transgenic rice. Photosynth. Res. 2018, 137, 465–474. [Google Scholar] [CrossRef] [PubMed]
- Wachter, R.M.; Salvucci, M.E.; Carmo-Silva, A.E.; Csengele Barta, C.; Genkov, T.; Spreitzer, R.J. Activation of interspecies-hybrid Rubisco enzymes to assess different models for the Rubisco–Rubisco activase interaction. Photosynth. Res. 2013, 117, 557–566. [Google Scholar] [CrossRef]
- Scafaro, A.P.; Gallé, A.; Van Rie, J.; Elizabete Carmo-Silva, E.; Salvucci, M.E.; Atwell, B.J. Heat tolerance in a wild Oryza species is attributed to maintenance of Rubisco activation by a thermally stable Rubisco activase ortholog. New Phytol. 2016, 211, 899–911. [Google Scholar] [CrossRef] [PubMed]
- Wilson, R.H.; Thieulin-Pardo, G.; Hartl, F.U.; Hayer-Hartl, M. Improved recombinant expression and purification of functional plant Rubisco. FEBS Lett. 2019, 593, 611–621. [Google Scholar] [CrossRef]
- Qian, R.J.; Ye, Y.J.; Hu, Q.D.; Ma, X.H.; Zhang, X.L.; Zheng, J. Metabolomic and Transcriptomic Analyses Reveal New Insights into the Role of Metabolites and Genes in Modulating Flower Colour of Clematis tientaiensis. Horticulturae 2023, 9, 14. [Google Scholar] [CrossRef]
- Ma, X.H.; Hu, Q.D.; Zhang, Y.J.; Qian, R.J.; Zheng, J.; Liu, H.J. Effects of nitrogen form on photosynthetic characteristics and nitrogen metabolism of Clematis. J. Trop. Subtrop. Bot. 2021, 29, 276–284. (In Chinese) [Google Scholar]
- Jiang, M.; Zhou, Y.Q.; Li, R.R. ITS sequence analysis of eight medicinal plants in Clematis, L. Chin. Tradit. Herb. Drugs 2011, 42, 1802–1806. [Google Scholar]
- Lichtenthaler, H.K. Chlorophylls and carotenoids-pigments of photosynthetic biomembranes. Methods Enzymol. 1987, 148, 350–382. [Google Scholar]
- Li, T.T.; Hu, Y.Y.; Du, X.H.; Tang, H.; Shen, C.H.; Wu, J.S. Salicylic acid alleviates the adverse effects of salt stress in Torreya grandis cv. Merrillii seedlings by activating photosynthesis and enhancing antioxidant systems. PLoS ONE 2014, 9, e109492. [Google Scholar] [CrossRef]
- Hendrickson, L.; Furbank, R.T.; Chow, W.S. A simple alternative approach to assessing the fate of absorbed light energy using chlorophyll fluorescence. Photosynth. Res. 2004, 82, 73–81. [Google Scholar] [CrossRef]
- Tsuyoshi, F.; Katsura, I.; Vanda, Q.; Furbank, R.T.; Caemmerer, S.V. Phosphorylation of phosphoenolpyruvate carboxylase is not essential for high photosynthetic rates in the C4 species Flaveriabidentie. Plant Physiol. 2007, 144, 1936–1945. [Google Scholar]
- Wang, A.G.; Luo, G.H. Quantitative relation between the reaction of hydroxylamine and superoxide anion radicals in plants. Plant Physiol. Commun. 1990, 6, 55–57. (In Chinese) [Google Scholar]
- Patterson, B.D.; MacRae, E.A.; Ferguson, I.B. Estimation of hydrogen peroxide in plant extracts usingtitanium(IV). AnalBiochem 1984, 139, 487–492. [Google Scholar]
- Deng, Y.; Sha, Q.; Li, C.; Ye, X.; Tang, R. Differential responses of double petal and multi petal jasmine to shading: II. Morphology, anatomy and physiology. Sci. Hortic. 2012, 144, 19–28. [Google Scholar] [CrossRef]
- Hu, Q.; Qian, R.; Zhang, Y.; Zhang, X.L.; Ma, X.H.; Zheng, J. Physiological and Gene Expression Changes of Clematis crassifolia and Clematis cadmia in Response to Heat Stress. Front. Plant Sci. 2021, 12, 421. [Google Scholar] [CrossRef] [PubMed]
- Wu, B.; Zhou, L.; Qi, S.; Jin, M.L.; Hu, J.; Lu, J.S. Effect of habitat factors on the understory plant diversity of Platycladus orientalis plantations in Beijing mountainous areas based on MaxEnt model. Ecol. Indic. 2021, 129, 107917. [Google Scholar] [CrossRef]
- Cherepanov, D.A.; Shelaev, I.V.; Gostev, F.E.; Aybush, A.V.; Mamedov, M.D.; Shuvalo, V.A.; Semenov, A.Y.; Nadtochenko, V.A. Generation of ion-radical chlorophyll states in the light-harvesting antenna and the reaction center of cyanobacterial photosystem I. Photosynth. Res. 2020, 146, 55–73. [Google Scholar] [CrossRef]
- Son, M.; Pinnola, A.; Gordon, S.C.; Bassi, R.; Schlau-Cohen, G.S. Observation of dissipative chlorophyll-to-carotenoid energy transfer in light-harvesting complex II in membrane nanodiscs. Nat. Commun. 2020, 11, 1295. [Google Scholar] [CrossRef]
- Ma, X.; Song, L.; Yu, W.; Hu, Y.Y.; Liu, Y.; Wu, J.S.; Ying, Y.Q. Growth, physiolog ical, and biochemical responses of Camptotheca acuminata seedlings to different light environments. Front. Plant Sci. 2015, 6, 321. [Google Scholar] [CrossRef]
- Rao, S.D.; Banack, S.A.; Cox, P.A.; Weiss, J.H. BMAA selectively injures motor neurons via AMPA/kainate receptor activation. Exp. Neurol. 2006, 201, 244–252. [Google Scholar] [CrossRef]
- Fan, H.; Guo, S.; Jiao, Y.; Zhang, R.H.; Li, J. Effects of exogenous nitric oxide on growth, active oxygen species metabolism, and photosynthetic characteristics in cucumber seedlings under NaCl stress. Front. Agric. China 2007, 1, 308–314. [Google Scholar] [CrossRef]
- Pandey, D.M.; Yu, K.W.; Wu, R.Z.; Hahn, E.J.; Paek, K.Y. Effects of different irradiance on the photosynthetic process during ex-vitro acclimation of Anoectochilus plantlets. Photosynthetica 2006, 44, 419–424. [Google Scholar] [CrossRef]
- Ralph, P.J.; Gademann, R. Rapid light curves: A powerful tool to assess photosynthetic activity. Aquat. Bot. 2005, 82, 222–237. [Google Scholar] [CrossRef]
- Baker, N.R. Chlorophyll fluorescence: A probe of photosynthesis in vivo. Annu. Rev. Plant Biol. 2008, 59, 89–113. [Google Scholar] [CrossRef] [PubMed]
- Zhang, Y.L.; Feng, G.Y.; Hu, Y.Y.; Yao, Y.D.; Zhang, W.F. Photosynthetic activity and its correlation with matter production in non-foliar green organs of cotton. Acta Agron. Sin. 2010, 36, 701–708. (In Chinese) [Google Scholar] [CrossRef]
- Wang, Z.Z.; Zheng, P.; Meng, J.F.; Xi, Z.M. Effect of exogenous 24-epibrassinolide on chlorophyll fluorescence, leaf surface morphology and cellular ultrastructure of grape seedlings (Vitis vinifera L.) under water stress. Acta Physiol. Plant. 2015, 37, 1729. [Google Scholar] [CrossRef]
- Mulo, P.; Sakurai, I.; Aro, E.M. Strategies for psbA gene expression in cyanobacteria, green algae and higher plants: From transcription to PSII repair. Biochim. Et Biophys. Acta (BBA)-Bioenerg. 2012, 1817, 247–257. [Google Scholar] [CrossRef]
- Jain, A.; Cao, A.; Karthikeyan, A.S.; Baldwin, J.C.; Raghothama, K.G. Phosphate deficiency suppresses expression of light-regulated psbO and psbP genes encoding extrinsic proteins of oxygen-evolving complex of PSII. Curr. Sci. 2005, 89, 1592–1596. [Google Scholar]
- Cameron, K.M.; Carmen Molina, M. Photosystem II gene sequences of psbB and psbC clarify the phylogenetic position of Vanilla (Vanilloideae, Orchidaceae). Cladistics 2006, 22, 239–248. [Google Scholar] [CrossRef]
- Wang, F.; Liu, J.; Chen, M.; Zhou, L.J.; Li, Z.W.; Zhao, Q.; Pan, G.; Zaidi, S.H.R.; Cheng, F.M. Involvement of abscisic acid in PSII photodamage and D1 protein turnover for light-induced premature senescence of rice flag leaves. PLoS ONE 2016, 11, e0161203. [Google Scholar] [CrossRef]
- Campbell, W.J.; Allen, L.H., Jr.; Bowes, G. Effects of CO2 concentration on rubisco activity, amount, and photosynthesis in soybean leaves. Plant Physiol. 1988, 88, 1310–1316. [Google Scholar] [CrossRef]
- Flexas, J.; Ribas-Carbó, M.; Bota, J.; Galmés, J.; Henkle, M.; Martínez-Cañellas, S.; Medrano, H. Decreased Rubisco activity during water stress is not induced by decreased relative water content but related to conditions of low stomatal conductance and chloroplast CO2 concentration. New Phytol. 2006, 172, 73–82. [Google Scholar] [CrossRef] [PubMed]
- Causin, H.F. The central role of amino acids on nitrogen utilization and plant growth. J. Plant Physiol. 1996, 149, 358–362. [Google Scholar]
- Bowlus, R.D.; Somero, G.N. Solute compatibility with enzyme function and structure: Rationales for the selection of osmotic agents and endproducts of anaerobic metabolism in marine invertebrates. J. Exp. Zool. 1979, 208, 137–151. [Google Scholar] [CrossRef] [PubMed]
- Sita, K.; Sehgal, A.; Bhandari, K.; Kumar, J.; Kumar, S.; Singh, S.; Siddique, K.H.; Nayyar, H. Impact of heat stress during seed filling on seed quality and seed yield in lentil (Lens culinaris Medikus) genotypes. J. Sci. Food Agricul. 2018, 98, 5134–5141. [Google Scholar] [CrossRef]
- Alhaithloul, H.A.; Soliman, M.H.; Ameta, K.L.; El-Esawi, M.A.; Elkelish, A. Changes in ecophysiology, osmolytes, and secondary metabolites of the medicinal plants of Mentha piperita and Catharanthus roseus subjected to drought and heat stress. Biomolecules 2020, 10, 43. [Google Scholar] [CrossRef]
Disclaimer/Publisher’s Note: The statements, opinions and data contained in all publications are solely those of the individual author(s) and contributor(s) and not of MDPI and/or the editor(s). MDPI and/or the editor(s) disclaim responsibility for any injury to people or property resulting from any ideas, methods, instructions or products referred to in the content. |
© 2023 by the authors. Licensee MDPI, Basel, Switzerland. This article is an open access article distributed under the terms and conditions of the Creative Commons Attribution (CC BY) license (https://creativecommons.org/licenses/by/4.0/).