Abstract
Nitrogen (N) fertilization has been extensively studied all over the world, not only due to its impact on plant growth and yield, but also on product quality. Olive oil is a natural product highly valued by the markets, due to its role in the Mediterranean diet, but only when its quality is above legally established standards. Thus, it is important to continue to study how cropping practices can impact the quality of olive oil in order to fine-tune the guidelines issued to producers. The objective of the three-year study was to assess the effect of the application of 0, (N0), 40 (N40) and 120 (N120) kg ha−1 of N in a rainfed olive grove on variables associated with fruit biometry and the maturation index, polyphenols in olives and olive oil, the evolution of the quality of the oil over time and sensory analysis. The application of N prolonged the period of coloration, delaying the maturation of the fruits, particularly in the higher doses of N applied. N application changed the phenolic composition and the antioxidant capacity of the fruits and olive oil, but without a clear trend among years. In general, the high N rate negatively affected the quality of the oils, reducing the oxidative stability and bitterness of the oil when compared to N40 treatment; this is due to the lower content of phenolic compounds that have a radical scavenging capacity. Excessive N application (N120) increased the degradation of the oil quality, as it led to an increase in the K232 extinction coefficient. Moderate N rates (N40) seem to be a good compromise to guarantee the quality and stability of the oil, although there was some interference from other uncontrolled environmental variables; these were probably accentuated because the olives came from a rainfed olive grove. The sensory analysis panel detected a defect (winey-vinegary flavour) in the oil from N40 treatment that is difficult to justify and will need more attention in future studies.
1. Introduction
Olive trees usually respond to N fertilization [1,2,3,4,5,6], but require less amounts of this nutrient than other crops, such as maize (Zea mays L.) or potatoes (Solanum tuberosum L.), as nutrient removal by olive trees is low, especially when grown under rainfed conditions [7,8,9,10].
N is an important building block in the chemical structures of proteins, nucleic acids, chlorophylls, phytohormones and secondary metabolites [11,12,13]. A condition of N deficiency can be easily detected by observing the visual symptomatology of the leaves, due to the role of N in the structure of important leaf macromolecules, such as chlorophylls, and the high mobility of the nutrient in the tissues. Under N deficiency, leaves become smaller and yellowish, starting from the oldest ones, shoot growth is reduced, and flowering and fruiting become irregular [14]. Thus, soil with low N availability reduces vegetative growth, flowering, fruit set, and yield [1,15,16]. The decrease in olive yield is primarily due to the reduction in the size of the photosynthetic apparatus and its efficiency, which affects flowering intensity, the number of perfect flowers and fruit set [2,15]. Conditions of excess of N may also negatively affect fruit yield [2,17,18]. Fernández-Escobar et al. [17] reported that N in excess has a similar negative effect on flowers as N deficiency does. They observed a reduction in the longevity of the ovule and in the effective pollination period. N in excess also affects the quality of the fruit and olive oil, due to a reduction in the content of polyphenols [1,2,13,19]. A low phenolic content in olive oil results in a negative impact in its stability, nutritional value, and sensory properties, such as bitterness [18,19,20]. The reduced polyphenol content under high nutrient availability has been explained by the preference of phenylalanine in protein synthesis rather than the synthesis of phenylpropanoids via phenylalanine ammonia-lyase (PAL) [19]. Another reported consequence of the excessive application of N to olive trees was an increase in α-tocopherol; this leads to a pro-oxidative effect in the oil [19]. N fertilization does not seem to affect pigment content and fatty acid composition [18,19]. However, Dag et al. [21] observed a decrease in the ratio of monounsaturated fatty acids (MUFA)/polyunsaturated fatty acids (PUFA) with N application, which suggests that olive oil composition was negatively influenced by the increasing availability of N in the soil.
N management in agro-systems is quite sensitive, both for its positive effects on vegetation and for its potentially negative effects on product quality and ecosystems. In olive trees, like in other crops, it is a nutrient whose dosage is necessarily adjusted to promote tree productivity, without compromising aspects of the quality of the olives and oil, and without causing relevant environmental damage. Thus, the purpose of this study was to assess the effect of significantly different N rates on the quality of olives and oil from a field trial carried out under rainfed conditions.
2. Materials and Methods
2.1. Site Characterization and Experimental Design
The field experiment was carried out from 2017 to 2019 in a rainfed olive orchard located at Macedo de Cavaleiros (northeast of Portugal). The region benefits from a Mediterranean-type climate. The average annual precipitation and temperature are 525 mm and 13.2 °C, respectively. The mean monthly temperature and precipitation, recorded during the experimental period, are presented in Figure 1.
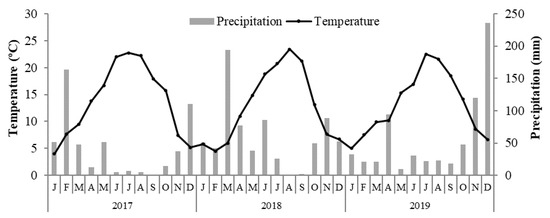
Figure 1.
Average monthly temperature and precipitation during the experimental period (2017–2019).
The soil is a Leptosol derived from schist, the most representative soil type in the region. The texture is loamy sand (soil separates were 77.7% sand, 18.9% silt, and 3.4% clay). From soil samples (0–0.20 m) taken at the beginning of the experiment, the soil was shown to be acidic (pH = 5.9) and low in organic carbon (C) (4.6 g kg−1). Extractable phosphorus (P), potassium (K) and boron (B) were low (48.3 mg kg−1, P2O5), high (81.5 mg kg−1, K2O) and very high (1.89 mg kg−1, B), respectively. Exchangeable calcium (Ca), magnesium (Mg), K, sodium (Na) and acidity were 7.41, 1.01, 0.11, 0.31 and 0.25 cmol kg−1, respectively.
In 2016, when the trial started, the trees (cv. Cobrançosa) were 16 years old and were quite homogeneous in relation to their crown volumes. They were spaced at 7 m × 7 m (~204 trees ha−1), and were subjected every year to a light pruning regime. The farmer managed the weeds by applying glyphosate (N-(phosphonomethyl) glycine, 360 g L−1 of active ingredient), applied at a rate of 3 L ha−1 in early April. No other phytosanitary products were applied during the experimental period.
The experimental design included three treatments, corresponding to three N fertilizer rates, 0 (N0, control), 40 (N40) and 120 (N120) kg ha−1 of N. These fertilization regimes were applied to three groups (three replicates) of three equally sized trees. The fertilizer used was ammonium nitrate 20.5% N (50% NH4+, 50% NO3−). In addition to N fertilizer treatments of the experimental design, all trees received a basal fertilizer application plan with the equivalent of 17.5 kg ha−1 of P (40 kg ha−1, P2O5), 33.2 kg ha−1 of K (40 kg ha−1, K2O), and 2 kg ha−1 of B. The fertilizers used were superphosphate (18% P2O5), potassium chloride (60% K2O) and borax (11% B), respectively. Fertilizers were distributed evenly under the tree canopy every year in the last week of March, as the farmer usually does.
2.2. Fruit Sampling and Oil Extraction
The trees were harvested by December with a handheld knapsack shaker machine, which detaches the olive fruits, and sheets were laid on the floor to recover them. At the harvest, fifty olive fruits per replicate were collected for biometric and maturation index (MI) analyses. Other olives samples were pitted and stored at −80 °C for posterior biochemical analyses. For olive oil extraction, 5 kg of healthy fruits per experimental unit, without any kind of infection or physical damage, were used, as described by Brito et al. [22]. Then, the paste was slowly malaxed at approximately 25 °C for 40 min, centrifuged at 3500× g for 10 min, and the oil collected was placed in dark glass bottles and kept at 4 °C for later analysis.
2.3. Fruit Biometrics and Maturation Index
Fifty randomly selected fruits per replicate were used for the determination of biometric variables, such as pulp, pit fresh weight (FW) and dry weight (DW), and longitudinal and equatorial length. The pulp/pit ratio was estimated as pulp FW/pit FW.
The MI was determined according to El Yamani et al. [23] and varied between 0 and 7. The olives were classified into the following categories: 0, olives with intense green epidermis; 1, olives with yellowish-green epidermis; 2, olives with red spots or areas in less than half of the fruit; 3, olives with red or light violet epidermis over more than half of the fruit; 4, olives with black epidermis and white pulp; 5, olives with black epidermis and less than half purple pulp; 6, olives with black epidermis and more than half purple pulp; and 7, olives with black epidermis and purple pulp. MI was calculated as follows (a to h—number of fruits in each category):
MI = (a × 0 + b × 1+ c × 2 + d × 3 + e × 4+ f × 5 + g × 6 + h × 7)/n
2.4. Extraction and Quantification of Polyphenolic Compounds from Olive and Olive Oil
The process of extracting polyphenolic compounds from fruits and olive oil was adapted from a procedure described by Sousa et al. [24]. Lyophilized olive fruit flesh (300 mg) was dried and mixed with 5 mL MeOH/H2O (50:50, v/v) and incubated for 30 min at room temperature. After centrifugation at 10,000× g for 10 min, the supernatant was removed and reserved in a flask after filtration, and the procedure was repeated three times. The mixture was washed three times with 6 mL of hexane to remove the fat phase, and the organic phase was discarded. Extractions were performed in triplicate. Each extract was introduced into a 25 mL round bottom flask, which was filled up to the mark with MeOH/H2O (50:50, v/v).
For the oil extraction, 2 g of olive oil was mixed with 1 mL of MeOH/H2O (70:30, v/v) and centrifuged for 10 min at 2800× g. The lower phase was carefully removed and reserved in a flask. The procedure was repeated three times, and the extractions were performed in triplicate. Each extract was introduced into a 5 mL round bottom flask, which was filled up to the mark with MeOH/H2O (70:30, v/v).
The obtained extracts were used for the quantification of total phenols, ortho-diphenols, flavonoids and total antioxidant activity, which were performed as described by Brito et al. [22]. Total phenols and ortho-diphenols were expressed as mg of gallic acid equivalents (GAE), and flavonoids were expressed as mg of catechin equivalents (CE) per g of olive flesh DW or kg of olive oil. The total antioxidant activity was expressed as mmol of Trolox Equivalent (TE) per g of olive flesh DW or kg of oil. All measurements were performed in triplicate.
2.5. Free Acidity, Peroxide Value and UV Spectrophotometric Indices
The oil quality variables, free acidity (%), peroxide value (meqO2 kg−1 oil) and extinctions at specified wavelengths (K232, K270 and ΔK), were determined according to the European Community regulation EEC/2568/91 [25]. The first assessment was carried out after three months of storage, since this period is long enough to observe the beginning of the oxidative reactions. Thereafter, in order to evaluate the olive oil stability over time, the olive oil quality indices were re-assessed after 15 months of storage.
The UV-vis absorption spectra of the olive oil samples were performed by using a microplate (SPECTROstar Nano, BMG, Labtech, German) in the range between 300 and 700 nm at room temperature.
2.6. Sensorial Analysis
After six months of storage, a sensorial analysis of the olive oil was performed by a trained sensory panel with previous experience, according to the method for the organoleptic assessment of virgin olive oil [26]. Descriptors were evaluated on a 0—10 intensity scale, with positive attributes such as fruitiness (green or ripe) and negative attributes such as fusty and winey-vinegary.
2.7. Data Analysis
A statistical analysis was performed using the statistical software program SPSS for Windows (v. 20). All data sets satisfied the assumptions of ANOVA, based on the homogeneity of variances and normality. The comparison of the effect of the fertilizer treatments in each year was provided by one-way ANOVA. When significant differences were found (α < 0.05), the means were separated by the multiple range Tukey HSD test (α = 0.05).
3. Results and Discussion
3.1. Maturation Index and Fruit Biometric Variables
Olives from the N0 treatment showed higher MI in two of the three years of the study when compared with the fertilized treatments (Figure 2). The lower MI, in turn, was observed in the N120 treatment, particularly in 2019. In previous studies, it was also observed that N fertilization affected the MI of the olives by extending the coloration period and fruit maturation [1,15,16,27]. In our study, the lower MI observed in N120 plants could be related to the increased fruit yield observed in this treatment, as presented below. Dag et al. [28] also observed that crop load delayed fruit maturation, reducing MI.
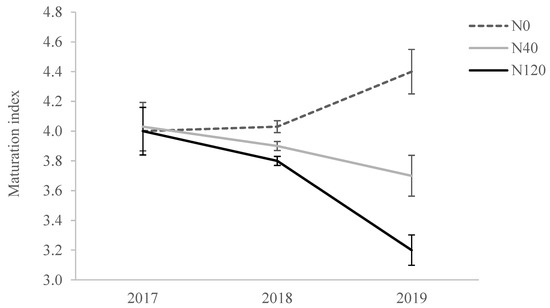
Figure 2.
Maturation index of olives from trees supplied with 0 (N0), 40 (N40) and 120 (N120) kg ha−1 of N in the harvests of 2017, 2018 and 2019.
Olives from the N120 treatment were smaller than those of the control treatment, showing lower fruit FW, pulp FW, equatorial and longitudinal length, pulp/pit ratio and higher pit FW, especially in 2018 and 2019 (Table 1). These results can be justified by the higher crop load obtained in this treatment, since higher yields generally result in smaller fruits. In fact, the accumulated olive yield (77.9 kg tree−1) of N120 trees during the experiment was 105% higher than in N0 plants, being the major difference (233%) obtained in the last harvest. Meanwhile, the biometric values from the N40 treatments tended to appear between those of the N0 and N120 treatments; this was also in association with crop load, as N40 trees presented a mean increment of 79% over N0, with a maximum of 228% in the 2019 harvest. The crop load could compromise the fruit growth through a limitation on photosynthate availability [29]. Martins et al. [30] also reported significant differences between years in fruit size and the maturation index, which they associated with differences in olive yields.

Table 1.
Fruit, pulp and pit fresh weight (FW), longitudinal length, equatorial length and pulp/pit ratio (FW) of olives from olive trees supplied with 0 (N0), 40 (N40) and 120 (N120) kg ha−1 of N in the harvests of 2017, 2018 and 2019.
3.2. Metabolite Concentration in Olives and Oil
The content of total phenols, ortho-diphenols and flavonoids, and the total antioxidant capacity observed in olives and olive oil, are shown in Table 2. The results of the variables in olives varied, often significantly, between treatments over the years, but without a clear trend. In 2017, olives with the N40 treatment showed higher concentrations of total phenols and ortho-diphenols than N120, as well superior antioxidant capacity compared to the other treatments. Meanwhile, in 2018, the lowest total antioxidant capacity was found in N40 fruits, in close association with the inferior concentration of ortho-diphenols. Furthermore, in 2019, N-stressed trees presented fruits with the lowest concentration of total phenols, while N120 fruits showed inferior concentrations of ortho-diphenols and flavonoids, compared to the other treatments. Thus, although it is dependent on the year of study, in general, there tends to be a higher concentration of total phenols in N-fertilized trees, namely in 2019, and especially under N40 dose, as in 2017. The higher concentration of phenolic compounds, usually found in fruits from N-fertilized trees, has been related to the maturation rate of the fruits [31,32]. The application of N delayed the fruit maturation index, and was probably the cause of the higher content of phenolic compounds observed in the fertilized treatments, mainly in 2019. Meanwhile, a tendency for higher ortho-diphenols content was observed in N0 fruits. Several studies indicated that an accumulation of phenolic compounds in olive fruits is associated with stressful conditions [22,33,34,35,36], as well as an increase in antioxidant activity [24,36,37]; this clearly indicates that, in this study, the unfertilized trees were under nutritional stress. The concentration of phenolic compounds is also influenced by environmental conditions and by the olives’ ripening degree [38]. Hence, a decrease in the total phenols was associated with the more advanced stages of olive ripening [39].
Table 2.
Total phenols, ortho-diphenols, flavonoids and total antioxidant capacity on olives and olive oil from olive trees supplied with 0 (N0), 40 (N40) and 120 (N120) kg ha−1 of N in the harvests of 2017, 2018 and 2019.
As reported for olives, a tendency towards a decrease in phenolic compounds, such as total phenols, ortho-diphenols and flavonoids, was observed in olive oil extracted from the fruits of the N120 treatment; however, this drop was not consistent over the years (Table 2). Mineral nutrition can have a marked effect not only on olive tree performance, but also on oil quality [1]. A trend towards a decrease in antioxidant capacity was also observed in the N120 treatment, which can be explained by the content of phenolic compounds. Baiano et al. [40] reported a strong positive correlation between phenolic compounds and antioxidant activity. Phenolic compounds contribute to the colour, flavour, and shelf life, and also contribute to the stability of extra virgin olive oils due to radical scavenging [41]. Therefore, the higher concentration of phenols observed in the oil from the less fertilized treatments may have created greater protection against oxidation.
N40 treatment showed a tendency to increase the production of total phenols, ortho-diphenols and flavonoids, relative to the N120 treatment. The exception was observed in 2017, since N120 oil presented a higher concentration of flavonoids than N0 and, similarly, superior antioxidant activity. The lower phenolic content observed in the oil of the N120 treatment, as in the study of Fernández-Escobar et al. [19], with the application of high N rates, could be explained by the protein competition model [42]; this model postulates a more specific competition between primary and secondary metabolisms. Under high N availability, phenylalanine (a common precursor of proteins and phenols) preferentially flows into protein synthesis, rather than towards the synthesis of phenylpropanoids via phenylalanine ammonia lyase. Consequently, the decrease in polyphenols reduces the oxidative stability of the oil and its bitterness.
The oil from the N0 treatment revealed a tendency to lower the concentrations of secondary metabolites, with the exception of 2018, when the highest content of all the compounds analysed was observed. If the 2017 and 2019 responses may be justified by the protein competition model, as explained above, the results of 2018 are defended by the carbon–nutrient balance [43] hypothesis. Under conditions that present a limited availability of nutrients, as in N0 trees, the plant’s growth will be more reduced than photosynthesis; this results in a higher accumulation of non-structural carbohydrates that can be diverted into an enhanced production of defensive carbon-based metabolites. More likely, this behaviour was stimulated by additional stressful conditions in August and September 2018, resulting from low water availability and high temperatures (Figure 1).
The fact that a clear trend was not observed in the variables evaluated in the fruits and in the oil as a function of the treatments, as well as that there was an interaction recorded between the treatments and the year, clearly shows that variables, other than the N rate, influenced the results. The composition of olive fruits and oil is widely affected by many environmental and agronomic factors that influence yield, including climate, soil, tree density, row orientation, fertilization, pruning, harvesting timing and type, and phytosanitary treatments, among others. However, climate variables are the main suspects, given the impact that precipitation and temperature can have on the metabolism of trees, particularly when they are grown in rainfed conditions.
3.3. Quality of Olive Oil during Storage
The oil quality is usually estimated by the degree of primary oxidation (peroxide index and K232) and secondary oxidation (K270 and ∆K) [40]. The results of the free acidity and oil quality variables are shown in Table 3. Overall, the results tend to show important differences between years. In 2017, all the oils would be classified in the ‘extra virgin’ category, showing low mean values for free acidity (<0.8%), peroxide index (<20 meqO2 kg−1), K270 (<0.22), K232 (<2.5) and ΔK (<0.01) [25]. In 2018 and 2019, a poorer quality of olive oil was observed, mainly associated with the N120 treatment, since this presented a significant increase in K232, above the threshold imposed by the EU regulation. K232 is related to the primary oxidation of the oil [44], and high rates of N seem to have an important role in the degradation of this variable.
Table 3.
Olive oil quality indices from olive of trees supplied with 0 (N0), 40 (N40) and 120 (N120) kg ha−1 of N in the harvests of 2017, 2018 and 2019.
In general, N120 showed lower free acidity, which can be related to the lower MI observed in the fruits of this treatment. The acidity increases with the ripening stage, due to increased lipolytic enzyme activity [45]. Therefore, the lower values observed in the oil of the N120 treatment agreed with those previously reported. The high peroxide index observed in the oil of the N120 treatment in 2018 can also be related to the MI of the olives; this is because the peroxide index tends to decrease during the ripening process due to the decrease in the lipoxygenase activity [46]. Salvador et al. [45] also found lower peroxide indices in oils obtained from olives at higher stages of maturity.
Olive oil quality was re-assessed after 15 months of storage, since it is well known that storage time and conditions can induce changes in olive oil quality [47]. The results are presented in Table 4. The peroxide index of the oil samples decreased from 3 to 15 months of storage in N40 and N120 treatments, averaging 50.1% and 23.9%, respectively. Shendi et al. [48] observed a continuous increment in the peroxide index up to seven months of storage, exceeding the value of 20 meqO2 kg−1. After that time, a decrease was observed, which seems similar to the results found in our study. In contrast, Gambacorta et al. [49] and Baiano et al. [40] observed a constant increase in the peroxide index over 12 months of storage, but the values never exceeded the legal limits set in the EU legislation.
Table 4.
Olive oil quality indices (samples from the harvest of 2018 after 3 and 15 months of storage) from olive trees supplied with 0 (N0), 40 (N40) and 120 (N120) kg ha−1 of N.
Regarding UV absorbance, significant differences between treatments were also observed. K232 and K270 increased significantly after 15 months, mainly in N120 and N0 treatments. Shendi et al. [48] observed an initial decrease in K232 up to 4 months, followed by an increase, reaching the maximum value (K232 = 3.40 ± 0.00) in the seventh month; this is above the threshold of the EU Regulation. Baiano et al. [40] also observed an increase with time in the UV indices, but the values remained within the respective legal limits (K232 ≤ 2.50, K270 ≤ 0.22, ΔK ≤ 0.01) up to 7 years of storage. The oil from the N40 treatment appeared to be more stable than that of the N120 treatment. The reason could be the higher content of total phenols, which increases the antioxidant capacity of the oil, resulting in a lower increase in K232 and K270. Gutiérrez et al. [50] reported that phenols are key components in the stability of the oil since they contribute to approximately 50% of the antioxidant capacity.
The time of storage also changed the absorption spectra of the olive oils from all the treatments (Figure 3). As can be observed from Figure 3, the absorption spectra of olive oils have characteristic features, as presented previously [51]: a complex band with ‘three-peaks’ in the range of 410–490 nm is related to an overlap among carotenoid and chlorophyll absorption signals, and a band around 660–675 nm is associated with chlorophylls and their derivatives. It is also clear that there is large variability among treatments, concerning the fractions of both carotenoid and chlorophyll derivatives fractions, as N40 and N120 oils are richer in pigments compared to N0 oils. The study of these pigments is interesting mainly because of their contribution to the colour and the quality of the oils; this is due to their relationship with fresh, nutritional and antioxidant properties of olive oils [52], thus influencing the oxidative stability of oils. In addition, some of the carotenoids present in olive oil are the precursors of vitamin A; their intake, through nutrition, promotes a reduction in diseases of the skin and eyes, as well as a reduction in cardiovascular problems, such as the oxidation of low-density cholesterol [53]. Another finding still deserves to be highlighted; this is the higher degradation of pigments in N120 oils, relative to N40 oils, being in a close relationship with a higher increase in K232 and K270 during the period of storage.
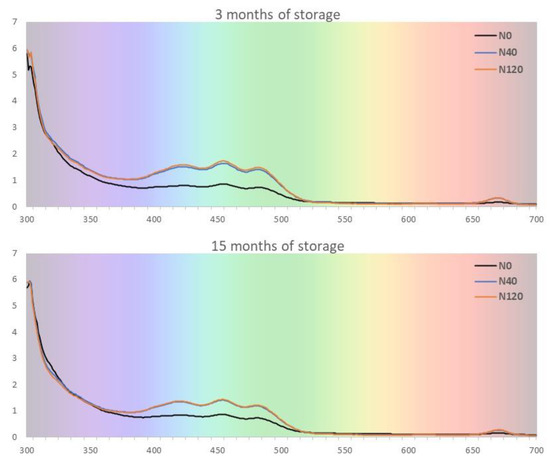
Figure 3.
Absorption spectra from olive oil after 3 and 15 months of storage from olives harvested in 2018 and olive trees supplied with 0 (N0), 40 (N40) and 120 (N120) kg ha−1 of N.
3.4. Sensory Profile of Olive Oil
The panel supporting this study classified the different olive oils in terms of fruitiness, and some negative attributes, such as fusty, winey-vinegary, and others, were detected (Figure 4). Several environmental, agronomical and technological factors could negatively affect the olive oil quality in sensorial terms [39]. Deficient storage conditions of the oil, the inadequate storage of the olives, or oil extracted from damaged or overripe fruits could lead to high acidity, low stability and disagreeable sensorial attributes [29,54]. The leading causes of the degradation of olive oil during storage are oxidation, the occurrence of hydrolysis reactions, and their products [55].
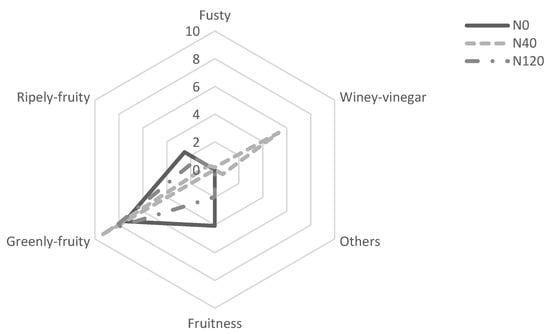
Figure 4.
Sensory profiles of virgin olive oils obtained from olives harvested in 2018 and olive trees supplied with 0 (N0), 40 (N40) and 120 (N120) kg ha−1 of N.
The panels detected defects only in the oil of the N40 treatment, mainly the winey-vinegary flavour. Usually, its flavour results from the aerobic fermentation of the olives during transportation or storage, before olive oil extraction [56,57]. Regarding fruitiness, N40 oil was the least fruity (0), followed by the N120 (1.98) and N0 (4.06). The MI of the olives can explain these results. Fruits from the N40 and N120 treatments showed a lower MI (3.90 and 3.80, respectively), producing a more greenly fruity olive oil. On the contrary, olives from the N0 treatment showed a higher MI (4.03), producing a more ripely fruity oil. The more ripely olive oil from N0 may also have resulted from the lower phenolic content associated with more mature olives, as reported by Briante et al. [32].
4. Conclusions
Nitrogen application reduced the fruit maturation index, particularly when applied at high rates (N120 treatment). N application also reduced the weight and size of the fruits as a result of photosynthate partitioning; this produced an increased number of sink points, since N also increased olive yield. Moderate N rates (N40) produced fruits of higher phenolic content and antioxidant capacity when compared to excessive N rates (N120); however, a significant interaction was found between fertilization treatments and years, showing that environmental variables, such as precipitation and temperature, and agronomic factors that influence crop yield, may also have had a great effect on the results.
High N rates negatively affected the quality of the oil by reducing the phenolic content, oxidative stability and bitterness. The result was attributed to N accumulation in the fruit and to the competition between primary and secondary metabolites. Similarly, the non-application of N (N0) also negatively influenced the olive oil oxidative stability, which probably suggests that other unknown factors, external to fertilization, may be associated. On the contrary, moderate N rates (N40) provided more protection for oil oxidation, due to a higher phenolic content that can act as radical scavenging. High N rates conferred little protection against olive oil degradation over time, as K232 was greatly increased in the N120 treatment. N40 gave a more stable oil than N120, since K232 and K270 increased less over time in the former treatment. However, the oil from the N40 treatment was poorly evaluated by the sensorial panel as it detected the negative attribute winey-vinegary flavour. However, it does not seem to make sense to attribute the result to the N treatment, but rather to some methodological failure associated with the poor transport or storage of the olives or oil.
Author Contributions
Conceptualization, M.Â.R. and C.M.C.; Formal analysis, E.S.; Funding acquisition, M.Â.R. and C.M.C.; Investigation, E.S., A.G., S.M., L.P., L.R., H.F., J.M.-P., M.Â.R. and C.M.C.; Methodology, E.S. and M.Â.R.; Project administration, M.Â.R. and C.M.C.; Resources, C.M.C.; Supervision, J.M.-P., M.Â.R. and C.M.C.; Validation, E.S.; Visualization, E.S.; Writing—original draft, E.S.; Writing—review & editing, A.G., S.M., L.P., L.R., H.F., J.M.-P., M.Â.R. and C.M.C. All authors have read and agreed to the published version of the manuscript.
Funding
Ermelinda Silva acknowledges the financial support provided by national funds through FCT-Portuguese Foundation for Science and Technology (PD/BD/128274/2017), under the Doctoral Programme “Agricultural Production Chains—from fork to farm” (PD/00122/2012) and from the European Social Funds and the Regional Operational Programme Norte 2020. This research was funded by the Operational Group “Novas práticas em olivais de sequeiro: estratégias de mitigação e adaptação às alterações climáticas”, funded by PT2020 and EAFRD (European Agricultural Fund for Rural Development). The authors are grateful to the Foundation for Science and Technology (FCT, Portugal) and FEDER under Programme PT2020 for financial support to CIMO (UIDB/00690/2020) and CITAB (UIDB/04033/2020) and also to AgriFood XXI Project, No. NORTE-01-0145-FEDER-000041, co-financed by the European Regional Development Fund (ERDF) through NORTE 2020 (North Regional Operational Program 2014–2020). Ermelinda Silva also acknowledges the present financial support throughout project NORTE-06-3559-FSE-000103 funded by the Fundo Social Europeu (FSE) and FCT research unit Centre BIO R&D Unit (UIDB/05083/2020).
Institutional Review Board Statement
Not applicable.
Informed Consent Statement
Not applicable.
Data Availability Statement
Not applicable.
Acknowledgments
We thank Eng. Francisco Pavão for providing the panel of tasters that evaluated and provided the sensory analysis of the olive oil.
Conflicts of Interest
The authors declare no conflict of interest.
References
- Erel, R.; Kerem, Z.; Ben-Gal, A.; Dag, A.; Schwartz, A.; Zipori, I.; Basheer, L.; Yermiyahu, U. Olive (Olea europaea L.) Tree Nitrogen Status Is a Key Factor for Olive Oil Quality. J. Agric. Food Chem. 2013, 61, 11261–11272. [Google Scholar] [CrossRef] [PubMed]
- Haberman, A.; Dag, A.; Shtern, N.; Zipori, I.; Erel, R.; Ben-Gal, A.; Yermiyahu, U. Significance of proper nitrogen fertilization for olive productivity in intensive cultivation. Sci. Hortic. 2019, 246, 710–717. [Google Scholar] [CrossRef]
- Rodrigues, M.Â.; Coelho, V.; Arrobas, M.; Gouveia, E.; Raimundo, S.; Correia, C.M.; Bento, A. The effect of nitrogen fertilization on the incidence of olive fruit fly, olive leaf spot and olive anthracnose in two olive cultivars grown in rainfed conditions. Sci. Hortic. 2019, 256, 108658. [Google Scholar] [CrossRef]
- Ferreira, I.Q.; Arrobas, M.; Moutinho-Pereira, J.M.; Correia, C.M.; Rodrigues, M.Â. The effect of nitrogen applications on the growth of young olive trees and nitrogen use efficiency. Turk. J. Agric. For. 2020, 44, 278–289. [Google Scholar] [CrossRef]
- Fernández-Escobar, R.; Antonaya-Baena, F.; Almeida-Lavado, S. Nitrogen Uptake Efficiency of Olive Cultivars. Horticulturae 2021, 7, 136. [Google Scholar] [CrossRef]
- Silva, E.; Arrobas, M.; Gonçalves, A.; Martins, S.; Raimundo, S.; Pinto, L.; Brito, C.; Moutinho-Pereira, J.; Correia, C.M.; Rodrigues, M.Â. A controlled-release fertilizer improved soil fertility but not olive tree performance. Nutr. Cycl. Agroecosystems 2021, 120, 1–15. [Google Scholar] [CrossRef]
- Rodrigues, M.Â.; Ferreira, I.Q.; Claro, A.M.; Arrobas, M. Fertilizer recommendations for olive based upon nutrients removed in crop and pruning. Sci. Hortic. 2012, 142, 205–211. [Google Scholar] [CrossRef]
- Bustan, A.; Avni, A.; Yermiyahu, U.; Ben-Gal, A.; Riov, J.; Erel, R.; Zipori, I.; Dag, A. Interactions between fruit load and macroelement concentrations in fertigated olive (Olea europaea L.) trees under arid saline conditions. Sci. Hortic. 2013, 152, 44–55. [Google Scholar] [CrossRef]
- Fernández-Escobar, R.; Sánchez-Zamora, M.A.; García-Novelo, J.M.; Molina-Soria, C. Nutrient Removal from Olive Trees by Fruit Yield and Pruning. Hortscience 2015, 50, 474. [Google Scholar] [CrossRef]
- Stateras, D.C.; Moustakas, N.K. Seasonal changes of macro- and micro-nutrients concentration in olive leaves. J. Plant Nutr. 2018, 41, 186–196. [Google Scholar] [CrossRef]
- Silva, E.C.; Nogueira, R.J.M.C.; Silva, M.A.; Albuquerque, M.B. Drought Stress and Plant Nutrition. Plant Stress 2011, 1, 32–41. [Google Scholar]
- O’Brien, J.A.; Vega, A.; Bouguyon, E.; Krouk, G.; Gojon, A.; Coruzzi, G.; Gutiérrez, R.A. Nitrate Transport, Sensing, and Responses in Plants. Mol. Plant 2016, 9, 837–856. [Google Scholar] [CrossRef] [PubMed]
- Lyu, Y.; Porat, R.; Yermiyahu, U.; Heler, Y.; Holland, D.; Dag, A. Effects of nitrogen fertilization on pomegranate fruit, aril and juice quality. J. Sci. Food Agric. 2020, 100, 1678–1686. [Google Scholar] [CrossRef]
- Saidana, D.; Braham, M.; Boujnah, D.; Mariem, F.B.; Ammari, S.; El Hadj, S.B. Nutrient Stress, Ecophysiological, and Metabolic Aspects of Olive Tree Cultivars. J. Plant Nutr. 2009, 32, 129–145. [Google Scholar] [CrossRef]
- Erel, R.; Dag, A.; Ben-Gal, A.; Schwartz, A.; Yermiyahu, U. Flowering and Fruit Set of Olive Trees in Response to Nitrogen, Phosphorus, and Potassium. J. Am. Soc. Hortic. Sci. 2008, 133, 639–647. [Google Scholar] [CrossRef]
- Rodrigues, M.Â.; Pavão, F.; Lopes, J.I.; Gomes, V.; Arrobas, M.; Moutinho-Pereira, J.; Ruivo, S.; Cabanas, J.E.; Correia, C.M. Olive Yields and Tree Nutritional Status during a Four-Year Period without Nitrogen and Boron Fertilization. Commun. Soil Sci. Plant Anal. 2011, 42, 803–814. [Google Scholar] [CrossRef]
- Fernandez-Escobar, R.; Ortiz-Urquiza, A.; Prado, M.; Rapoport, H.F. Nitrogen status influence on olive tree flower quality and ovule longevity. Environ. Exp. Bot. 2008, 64, 113–119. [Google Scholar] [CrossRef]
- Centeno, A.; García, J.M.; Gómez-del-Campo, M. Effects of nitrogen fertilization and nitrification inhibitor product on vegetative growth, production and oil quality in ‘Arbequina’ hedgerow and ‘Picual’ vase-trained orchards. J. Grasas Y Aceites 2017, 68, e215. [Google Scholar] [CrossRef]
- Fernández-Escobar, R.; Beltrán, G.; Sánchez-Zamora, M.A.; García-Novelo, J.; Aguilera, M.P.; Uceda, M. Olive Oil Quality Decreases with Nitrogen Over-fertilization. HortScience 2006, 41, 215–219. [Google Scholar] [CrossRef]
- Servili, M.; Selvaggini, R.; Esposto, S.; Taticchi, A.; Montedoro, G.; Morozzi, G. Health and sensory properties of virgin olive oil hydrophilic phenols: Agronomic and technological aspects of production that affect their occurrence in the oil. J. Chromatogr. A 2004, 1054, 113–127. [Google Scholar] [CrossRef]
- Dag, A.; Ben-David, E.; Kerem, Z.; Ben-Gal, A.; Erel, R.; Basheer, L.; Yermiyahu, U. Olive oil composition as a function of nitrogen, phosphorus and potassium plant nutrition. J. Sci. Food Agric. 2009, 89, 1871–1878. [Google Scholar] [CrossRef]
- Brito, C.; Dinis, L.-T.; Silva, E.; Gonçalves, A.; Matos, C.; Rodrigues, M.A.; Moutinho-Pereira, J.; Barros, A.; Correia, C. Kaolin and salicylic acid foliar application modulate yield, quality and phytochemical composition of olive pulp and oil from rainfed trees. Sci. Hortic. 2018, 237, 176–183. [Google Scholar] [CrossRef]
- El Yamani, M.; Sakar, E.H.; Boussakouran, A.; Rharrabti, Y. Influence of ripening index and water regime on the yield and quality of “Moroccan Picholine” virgin olive oil. OCL 2020, 27, 19. [Google Scholar] [CrossRef]
- Sousa, C.; Gouvinhas, I.; Barreira, D.; Carvalho, M.T.; Vilela, A.; Lopes, J.; Martins-Lopes, P.; Barros, A.I. ‘Cobrançosa’ Olive Oil and Drupe: Chemical Composition at Two Ripening Stages. J. Am. Oil Chem. Soc. 2014, 91, 599–611. [Google Scholar] [CrossRef]
- Regulation, E. Commission Implementing Regulation (EU) No 299/2013 amending Regulation (EEC) No 2568/91 on the characteristics of olive oil and olive-residue oil and on the relevant methods of analysis. Off. J. Eur. Union 2013, 28, 3. [Google Scholar]
- IOC. Method for the Organoleptic Assessment of Extra Virgin Olive Oil Applying to Use a Designation of Origin. International Olive Concil Available COI/T.20/Doc. no. 22. Available online: http://www.internationaloliveoil.org (accessed on 3 September 2005).
- Elbadawy, N.; Hegazi, E.; Yehia, T.; Abourayya, M.; Mahmoud, T. Effect of Nitrogen Fertilizer on Yield, Fruit Quality and Oil Content in Manzanillo Olive Trees. J. Arid. Land Stud. 2016, 26, 175–177. [Google Scholar] [CrossRef]
- Dag, A.; Kerem, Z.; Yogev, N.; Zipori, I.; Lavee, S.; Ben-David, E. Influence of time of harvest and maturity index on olive oil yield and quality. Sci. Hortic. 2011, 127, 358–366. [Google Scholar] [CrossRef]
- Fernández, F.J.; Ladux, J.L.; Hammami, S.B.M.; Rapoport, H.F.; Searles, P.S. Fruit, mesocarp, and endocarp responses to crop load and to different estimates of source: Sink ratio in olive (cv. Arauco) at final harvest. Sci. Hortic. 2018, 234, 49–57. [Google Scholar] [CrossRef]
- Martins, S.; Silva, E.; Brito, C.; Martins-Gomes, C.; Gonçalves, A.; Arrobas, M.; Rodrigues, M.Â.; Correia, C.M.; Nunes, F.M. Zeolites and Biochar Modulate Olive Fruit and Oil Polyphenolic Profile. Antioxidants 2022, 11, 1332. [Google Scholar] [CrossRef]
- Gutiérrez, F.; Jímenez, B.; Ruíz, A.; Albi, M.A. Effect of Olive Ripeness on the Oxidative Stability of Virgin Olive Oil Extracted from the Varieties Picual and Hojiblanca and on the Different Components Involved. J. Agric. Food Chem. 1999, 47, 121–127. [Google Scholar] [CrossRef]
- Briante, R.; Patumi, M.; Limongelli, S.; Febbraio, F.; Vaccaro, C.; Di Salle, A.; La Cara, F.; Nucci, R. Changes in phenolic and enzymatic activities content during fruit ripening in two Italian cultivars of Olea europaea L. Plant Sci. 2002, 162, 791–798. [Google Scholar] [CrossRef]
- Gómez-Rico, A.; Fregapane, G.; Salvador, M.D. Effect of cultivar and ripening on minor components in Spanish olive fruits and their corresponding virgin olive oils. Food Res. Int. 2008, 41, 433–440. [Google Scholar] [CrossRef]
- Machado, M.; Felizardo, C.; Fernandes-Silva, A.A.; Nunes, F.M.; Barros, A. Polyphenolic compounds, antioxidant activity and l-phenylalanine ammonia-lyase activity during ripening of olive cv. “Cobrançosa” under different irrigation regimes. Food Res. Int. 2013, 51, 412–421. [Google Scholar] [CrossRef]
- Tekaya, M.; El-Gharbi, S.; Mechri, B.; Chehab, H.; Bchir, A.; Chraief, I.; Ayachi, M.; Boujnah, D.; Attia, F.; Hammami, M. Improving performance of olive trees by the enhancement of key physiological parameters of olive leaves in response to foliar fertilization. Acta Physiol. Plant. 2016, 38, 101. [Google Scholar] [CrossRef]
- Gonçalves, A.; Silva, E.; Brito, C.; Martins, S.; Pinto, L.; Dinis, L.-T.; Luzio, A.; Martins-Gomes, C.; Fernandes-Silva, A.; Ribeiro, C.; et al. Olive tree physiology and chemical composition of fruits are modulated by different deficit irrigation strategies. J. Sci. Food Agric. 2020, 100, 682–694. [Google Scholar] [CrossRef]
- Gouvinhas, I.; Machado, J.; Gomes, S.; Lopes, J.; Martins-Lopes, P.; Barros, A.I.R.N.A. Phenolic Composition and Antioxidant Activity of Monovarietal and Commercial Portuguese Olive Oils. J. Am. Oil Chem. Soc. 2014, 91, 1197–1203. [Google Scholar] [CrossRef]
- Douzane, M.; Mohamed seghir, D.; Meribai, A.; Guezil, A.-H.; Abdi, A.; Tamendjari, A. Physico-chemical and sensory evaluation of virgin olive oils from several Algerian olive-growing regions. OCL 2021, 28, 55. [Google Scholar] [CrossRef]
- El Riachy, M.; Bou-Mitri, C.; Youssef, A.; Andary, R.; Skaff, W. Chemical and Sensorial Characteristics of Olive Oil Produced from the Lebanese Olive Variety ‘Baladi’. Sustainability 2018, 10, 4630. [Google Scholar] [CrossRef]
- Baiano, A.; Terracone, C.; Viggiani, I.; Del Nobile, M.A. Changes produced in extra-virgin olive oils from cv. Coratina during a prolonged storage treatment. Czech J. Food Sci. 2014, 32, 1–9. [Google Scholar] [CrossRef]
- Condelli, N.; Caruso, M.C.; Galgano, F.; Russo, D.; Milella, L.; Favati, F. Prediction of the antioxidant activity of extra virgin olive oils produced in the Mediterranean area. Food Chem. 2015, 177, 233–239. [Google Scholar] [CrossRef]
- Jones, C.G.; Hartley, S.E. A Protein Competition Model of Phenolic Allocation. Oikos 1999, 86, 27–44. [Google Scholar] [CrossRef]
- Bryant, J.P.; Chapin, F.S.; Klein, D.R. Carbon/nutrient balance of boreal plants in relation to vertebrate herbivory. Oikos 1983, 40, 357–368. [Google Scholar] [CrossRef]
- Khaleghi, E.; Arzani, K.; Moallemi, N.; Barzegar, M. The efficacy of kaolin particle film on oil quality indices of olive trees (Olea europaea L.) cv ‘Zard’ grown under warm and semi-arid region of Iran. Food Chem. 2015, 166, 35–41. [Google Scholar] [CrossRef] [PubMed]
- Salvador, M.D.; Aranda, F.; Fregapane, G. Influence of fruit ripening on ‘Cornicabra’ virgin olive oil quality A study of four successive crop seasons. Food Chem. 2001, 73, 45–53. [Google Scholar] [CrossRef]
- Youssef, N.B.; Zarrouk, W.; Carrasco-Pancorbo, A.; Ouni, Y.; Segura-Carretero, A.; Fernández-Gutiérrez, A.; Daoud, D.; Zarrouk, M. Effect of olive ripeness on chemical properties and phenolic composition of chétoui virgin olive oil. J. Sci. Food Agric. 2010, 90, 199–204. [Google Scholar] [CrossRef]
- Jimenez-Lopez, C.; Carpena, M.; Lourenço-Lopes, C.; Gallardo-Gomez, M.; Lorenzo, J.M.; Barba, F.J.; Prieto, M.A.; Simal-Gandara, J. Bioactive Compounds and Quality of Extra Virgin Olive Oil. Foods 2020, 9, 1014. [Google Scholar] [CrossRef]
- Ghanbari Shendi, E.; Sivri Ozay, D.; Ozkaya, M.T.; Ustunel, N.F. Changes occurring in chemical composition and oxidative stability of virgin olive oil during storage. OCL 2018, 25, A602. [Google Scholar] [CrossRef]
- Gambacorta, G.; Faccia, M.; Previtali, M.A.; Pati, S.; Notte, E.L.; Baiano, A. Effects of Olive Maturation and Stoning on Quality Indices and Antioxidant Content of Extra Virgin Oils (cv. Coratina) during Storage. Food Sci. 2010, 75, C229–C235. [Google Scholar] [CrossRef]
- Gutiérrez, F.; Arnaud, T.; Garrido, A. Contribution of polyphenols to the oxidative stability of virgin olive oil. J. Sci. Food Agric. 2001, 81, 1463–1470. [Google Scholar] [CrossRef]
- Borello, E.; Roncucci, D.; Domenici, V. Study of the Evolution of Pigments from Freshly Pressed to ‘On-the-Shelf’ Extra-Virgin Olive Oils by Means of Near-UV Visible Spectroscopy. Foods 2021, 10, 1891. [Google Scholar] [CrossRef]
- Lazzerini, C.; Cifelli, M.; Domenici, V. Pigments in extra virgin olive oils produced in different mediterranean countries in 2014: Near UV-vis spectroscopy versus HPLC-DAD. LWT 2017, 84, 586–594. [Google Scholar] [CrossRef]
- Jaswir, I. Carotenoids: Sources, medicinal properties and their application in food and nutraceutical industry. J. Med. Plant Res. 2011, 5, 7119–7131. [Google Scholar] [CrossRef]
- Cayuela, J.A.; Gómez-Coca, R.B.; Moreda, W.; Pérez-Camino, M.C. Sensory defects of virgin olive oil from a microbiological perspective. Trends Food Sci. Technol. 2015, 43, 227–235. [Google Scholar] [CrossRef]
- Rallo, L.; Díez, C.M.; Morales-Sillero, A.; Miho, H.; Priego-Capote, F.; Rallo, P. Quality of olives: A focus on agricultural preharvest factors. Sci. Hortic. 2018, 233, 491–509. [Google Scholar] [CrossRef]
- Veloso, A.C.A.; Dias, L.G.; Rodrigues, N.; Pereira, J.A.; Peres, A.M. Sensory intensity assessment of olive oils using an electronic tongue. Talanta 2016, 146, 585–593. [Google Scholar] [CrossRef]
- Harzallia, U.; Rodriguesa, N.; Veloso, A.C.A.; Diasa, L.G.; Pereira, J.A.; Oueslati, S.; Peres, A.M. A taste sensor device for unmasking admixing of rancid or winey-vinegary olive oil to extra virgin olive oil. Comput. Electron. Agric. 2018, 144, 222–231. [Google Scholar] [CrossRef]
Disclaimer/Publisher’s Note: The statements, opinions and data contained in all publications are solely those of the individual author(s) and contributor(s) and not of MDPI and/or the editor(s). MDPI and/or the editor(s) disclaim responsibility for any injury to people or property resulting from any ideas, methods, instructions or products referred to in the content. |
© 2023 by the authors. Licensee MDPI, Basel, Switzerland. This article is an open access article distributed under the terms and conditions of the Creative Commons Attribution (CC BY) license (https://creativecommons.org/licenses/by/4.0/).