Article

Irrigation Levels and Fertilization Rates as Pre-Harvest Factors Affecting the Growth and Quality of Hippeastrum

by
Chaiartid Inkham
1,2,3,
Kanokwan Panjama
2,3,4 and
Soraya Ruamrungsri
2,3,4,*
1
Science and Technology Research Institute, Chiang Mai University, Chiang Mai 50200, Thailand
2
H.M. The King’s Initiative Centre for Flower and Fruit Propagation, Chiang Mai University, Chiang Mai 50200, Thailand
3
Economic Flower Crop Research Cluster, Chiang Mai University, Chiang Mai 50200, Thailand
4
Department of Plant and Soil Science, Faculty of Agriculture, Chiang Mai University, Chiang Mai 50200, Thailand
*
Author to whom correspondence should be addressed.
Horticulturae 2022, 8(4), 345; https://doi.org/10.3390/horticulturae8040345
Submission received: 23 February 2022 / Revised: 11 April 2022 / Accepted: 11 April 2022 / Published: 18 April 2022

Abstract

:
Growing Hippeastrum in an open field or a greenhouse requires precision irrigation and fertilizer to promote plant growth and development. Therefore, this research aimed to study the effect of irrigation level combined with fertilization rate on the growth and development of Hippeastrum. Two experiments were carried out to determine the influence of irrigation and fertilizer on the growth, flowering, and bulb quality of Hippeastrum. In the first experiment, bulbs of Hippeastrum ‘Red Lion’ with circumferences of 25 cm were grown in plastic plots using mixed soil as growing media under a 50% shading net. Plants were irrigated daily until drainage and water contained in macropores by gravity action (Field capacity: FC) for 90 days after planting (DAP) and supplied with three different 15N-15P2O5-15K2O fertilization rates, i.e., 0, 2.5, and 5 g per pot. Plant growth and water use efficiency were measured at 45, 60, and 90 DAP. The results showed that plants supplied with 0 g of fertilizer had the lowest plant height and number of leaves per plant at 90 DAP, whereas there was no significant effect of fertilizer rate treatments on flower quality. The water use efficiency, evapotranspiration rate (ET), crop evapotranspiration under standard condition (ETc), crop coefficient (Kc), photosynthetic rate, and stomatal conductance were decreased when plants were supplied with fertilizer at a rate of 0 g per pot at 90 DAP. In the second experiment, plants were irrigated with four levels, i.e., 100, 75, 50, and 25% ETc combined with three fertilization rates, i.e., 0, 2.5, and 5 g per pot. At 180 DAP, the results showed that water deficit treatment (50 and 25% ETc) decreased plant growth and bulb quality. Irrigation with 100% ETc combined with 2.5 or 5 g per pot and irrigation with 75% ETc combined with 5 g per pot were the optimum levels to promote plant growth and bulb quality in Hippeastrum.

1. Introduction

An irrigation system is important to ensure sufficient soil moisture for plant growth and development, especially for the growth and yield of horticultural crops. However, over or insufficient irrigation may bring about the leaching of nutrients and decrease production yield [1,2]. Growing plants under water deficit could reduce the growth and respiration rates and divert a larger percentage of carbohydrates to storage and stomatal closure [3]. Hippeastrum, commonly known as the giant amaryllis, is one of the most important flower bulb crops in the world. Although the scientific name of the genus from South America is Hippeastrum, the common name amaryllis is always used on a commercial scale. The demand for Hippeastrum in Asia has increased sharply in recent years, driven by importation into China, Japan, and South Korea. Hippeastrum bulbs are exported by the Netherlands, South Africa, Japan, Brazil, and the USA [4]. In 2018, about 29 million stems of Hippeastrum were sold as cut flowers in the Royal FloraHolland auction in the Netherlands [5]. In Brazil, bulbs are produced in open fields. However, for cut flower production in the Netherlands, plants are grown in greenhouses using soilless culture. Generally, all bulb production in the Netherlands is carried out in greenhouses, planting starts from October to March, and bulbs are harvested from July to October. The irrigation interruption of Hippeastrum during crop production affected early flowering compared with continuously irrigated plants, sufficient soil moisture content stimulated rapid rooting at the planting stage, and the plants did not require high nutrition in the early stage of growth [6]. Factors such as the limited application of fertilizer reduce the evapotranspiration (ETo) and affected crop evapotranspiration (ETc) under standard conditions. Irrigation and fertilizer management in the greenhouse are very important considerations. The balance of water use and plant nutritional management brings about increasing plant growth, a good yield, and a low cost. The water use efficiency (WUE) and crop coefficient values (Kc) represent the integrated effects of changes in plant growth and development and carbohydrate metabolism in plants. The WUE hypothesis is based on the increment in plant productivity with increasing water use [7]. Therefore, this research aimed to study the effect of water shortage by different watering levels, estimated by crop evapotranspiration (ETc) percentage combined with fertilization rate factors, on growth, quality, and bulb yield in Hippeastrum by two experiments. The first experiment aimed to determine crop water use and growth under different fertilizer rates. The second experiment was carried out to study the effect of irrigation levels at different % ETc combined with fertilizer levels on the growth and development of Hippeastrum at different growth stages.

2. Materials and Methods

2.1. Experiment 1: Effect of Fertilization Rates on Growth and Water Use Efficiency of Hippeastrum

Hippeastrum ‘Red Lion’ bulbs with a 25 cm circumference were kept in a cold room at 5 °C for 2 months before planting in 10-inch diameter and 7.5-inch height plastic pots (0.40 ft3 of dry soil) filled with 400 g of mixed soil per pot (1:1:1:0.1 ratio by volume of rice husk:rice husk charcoal:soil:compost) as the growing media under a 50% shading net in a greenhouse. The average temperature was approximately 25–30 °C, the relative humidity was 80%, and the light intensity was 333.20 µmol m−2 s−1. Plants were well watered daily until the bulb harvest stage.
The experimental design was in a completely randomized design (CRD) with 3 treatments. Fertilizer of the formula 15N:15P2O5:15K2O was supplied to the plants at three different rates (0, 2.5, and 5 g per pot) once a month. The amount of NPK fertilizer that plants received per pot per month in the fertilizing treatment of 2.5 g per pot was 375 N, 82 P, and 156 K mg, respectively (938 N, 205 P, and 389 K mg per Kg substrate). In addition, the amount of NPK fertilizer that plants received per pot per month in the fertilizing treatment of 5 g per pot was 750 N, 164 P, and 311 K mg, respectively (1875 N, 409 P, and 778 K mg per Kg substrate).
Plants were irrigated daily by hand. Plant growth (plant height and the number of leaves per plant) as well as the evapotranspiration rate (ET), crop evapotranspiration (ETc), water use efficiency (WUE), and crop coefficient (Kc) were measured at three different growing stages: (1) the flowering stage (45 DAP), (2) the early vegetative stage (60 DAP), and (3) the late vegetative stage (90 DAP). Flower quality and bulb quality were measured at 45 and 180 DAP, respectively.
The ET, ETc, WUE, and Kc at each growing stage were calculated from:
1.
Evapotranspiration rate (ET)
The evapotranspiration rate was determined daily by measuring the weight loss of the pot plus plant system according to the modified method of Pereira and Kozlowski [8]. The soil was well watered and the soil drying cycle was repeated every day. After the pots were well watered at 10.00 a.m., the pot was weighed as M1. On the next day before rewatering (at 9.00 a.m.), each pot was weighed as M2.
Daily water use = M1 − M2
When
M1 = weight of pots after well watering.
M2 = weight of the pots in the next days before rewatering.
The weight difference is the evapotranspiration rate of plant and surface water, which weighs 1 g for every 1 mL of water.
2.
Crop evapotranspiration (ETc)
The amount of water that plants use each day was calculated to ETc (mm) at each stage of growth as follows:
Crop   Evapotranspiration   ( ETc ) ( mm ) = Daily   water   use   ( mL )   Bush   area   × 1000
Bush area = 0.05069 m2 (calculated from ¶r2, when r of 10 inches pot = 0.127 m).
Water content 1 mm = 1 L per 1 m2.
3.
Water use efficiency (WUE)
Plant WUE of each growing stage refers to the ratio between total dry matter and amount of water used by the plant [9] as follows:
WUE   ( mg   DWmL 1 ) =   ( end   plant   dry   weight     start   plant   dry   weight ) Total   water   used   throughout   each   growing   stage
4
Crop coefficient (Kc)
Calculated from Penman–Monteith equation [10] as follows:
Kc   =   ETc / ETp
ETp   =   Epan   ×   Kp
Therefore, the water coefficient of plants can be calculated from the equation
Kc =   ETc / ( Kp   ×   Epan )
where Kc = water use coefficient in each growing stage;
ETc = the amount of water used each day (mm);
ETp = plant water evapotranspiration potential (value from climatological station);
Kp = evaporation tray coefficient for Type A measuring tray (Thailand = 0.85) [11]
Epan = the amount of water evaporation from the evaporation tray (value from the climatological station).
The Kc of each growing stage was calculated by the sum of daily Kc and then divided by the day number of each growing stage.
The diurnal photosynthesis rate (Pn) and stomatal conductance (Gs) were measured at 90 DAP (during daytime; 06.00 a.m.–06.00 p.m.) by using a portable photosynthesis measuring system incorporating infrared gas analysis (Lcpro+, ADC Bioscience, Hoddesdon, UK) at 90 DAP.

2.2. Experiment 2: Effect of Irrigation Level and Fertilizer Rate on Growth and Yield of Hippeastrum

Hippeastrum ‘Red Lion’ bulbs with circumferences of 25 cm were grown in 10-inch plastic pots using mixed soil as the growing media under the same conditions as in experiment 1. After planting, plants were supplied with two different factors, i.e., factor (1) four levels of irrigation treatment (100, 75, 50, and 25% ETc; daily supply with tap water by hand for 180 days) and factor (2) three levels of fertilization rates (0, 2.5, and 5.0 g per pot, supplied once a month for 6 months by using fertilizer with the formula 15N-15P2O5-15K2O). The experimental design was factorial in a completely randomized design (factorial in CRD) with 4 × 3 factorial combination treatments and 10 replications (pots) per treatment.
Flower quality in terms of flower diameter and flower stalk length were measured at 45 DAP. At 180 days after planting, plant growth in terms of plant height, number of leaves per plant, and number of new shoots per plant were collected. Chlorophyll content (SPAD value) was measured in mature leaves by using a SPAD meter (SPAD-502, Minolta, Japan). Photosynthesis and stomatal conductance were measured by using a portable photosynthesis measuring system incorporating an infrared gas analyzer (Lcpro+, ADC Bioscience, UK), the measurements were carried out at 11:00 a.m., and the evaluation was performed on a clear day without clouds. At the bulb harvest stage (180 DAP), bulb fresh weight and bulb circumference were recorded, and bulb firmness was measured by manually puncturing the bulb surface using a hardness tester (Fruit Hardness Tester, 5 kg, FUJIWARA, Japan).

2.3. Statistical Analysis

All data were subjected to analysis of variance (ANOVA) to differentiate the effects of treatment inputs on physiological responses of Hippeastrum using generalized linear models using the Statistix 8 analytical software package (SXW, Tallahassee, FL, USA). In the case of significant treatment effects, the least significant difference (LSD) test at a significance level of 0.05 was used for mean comparisons.

3. Results

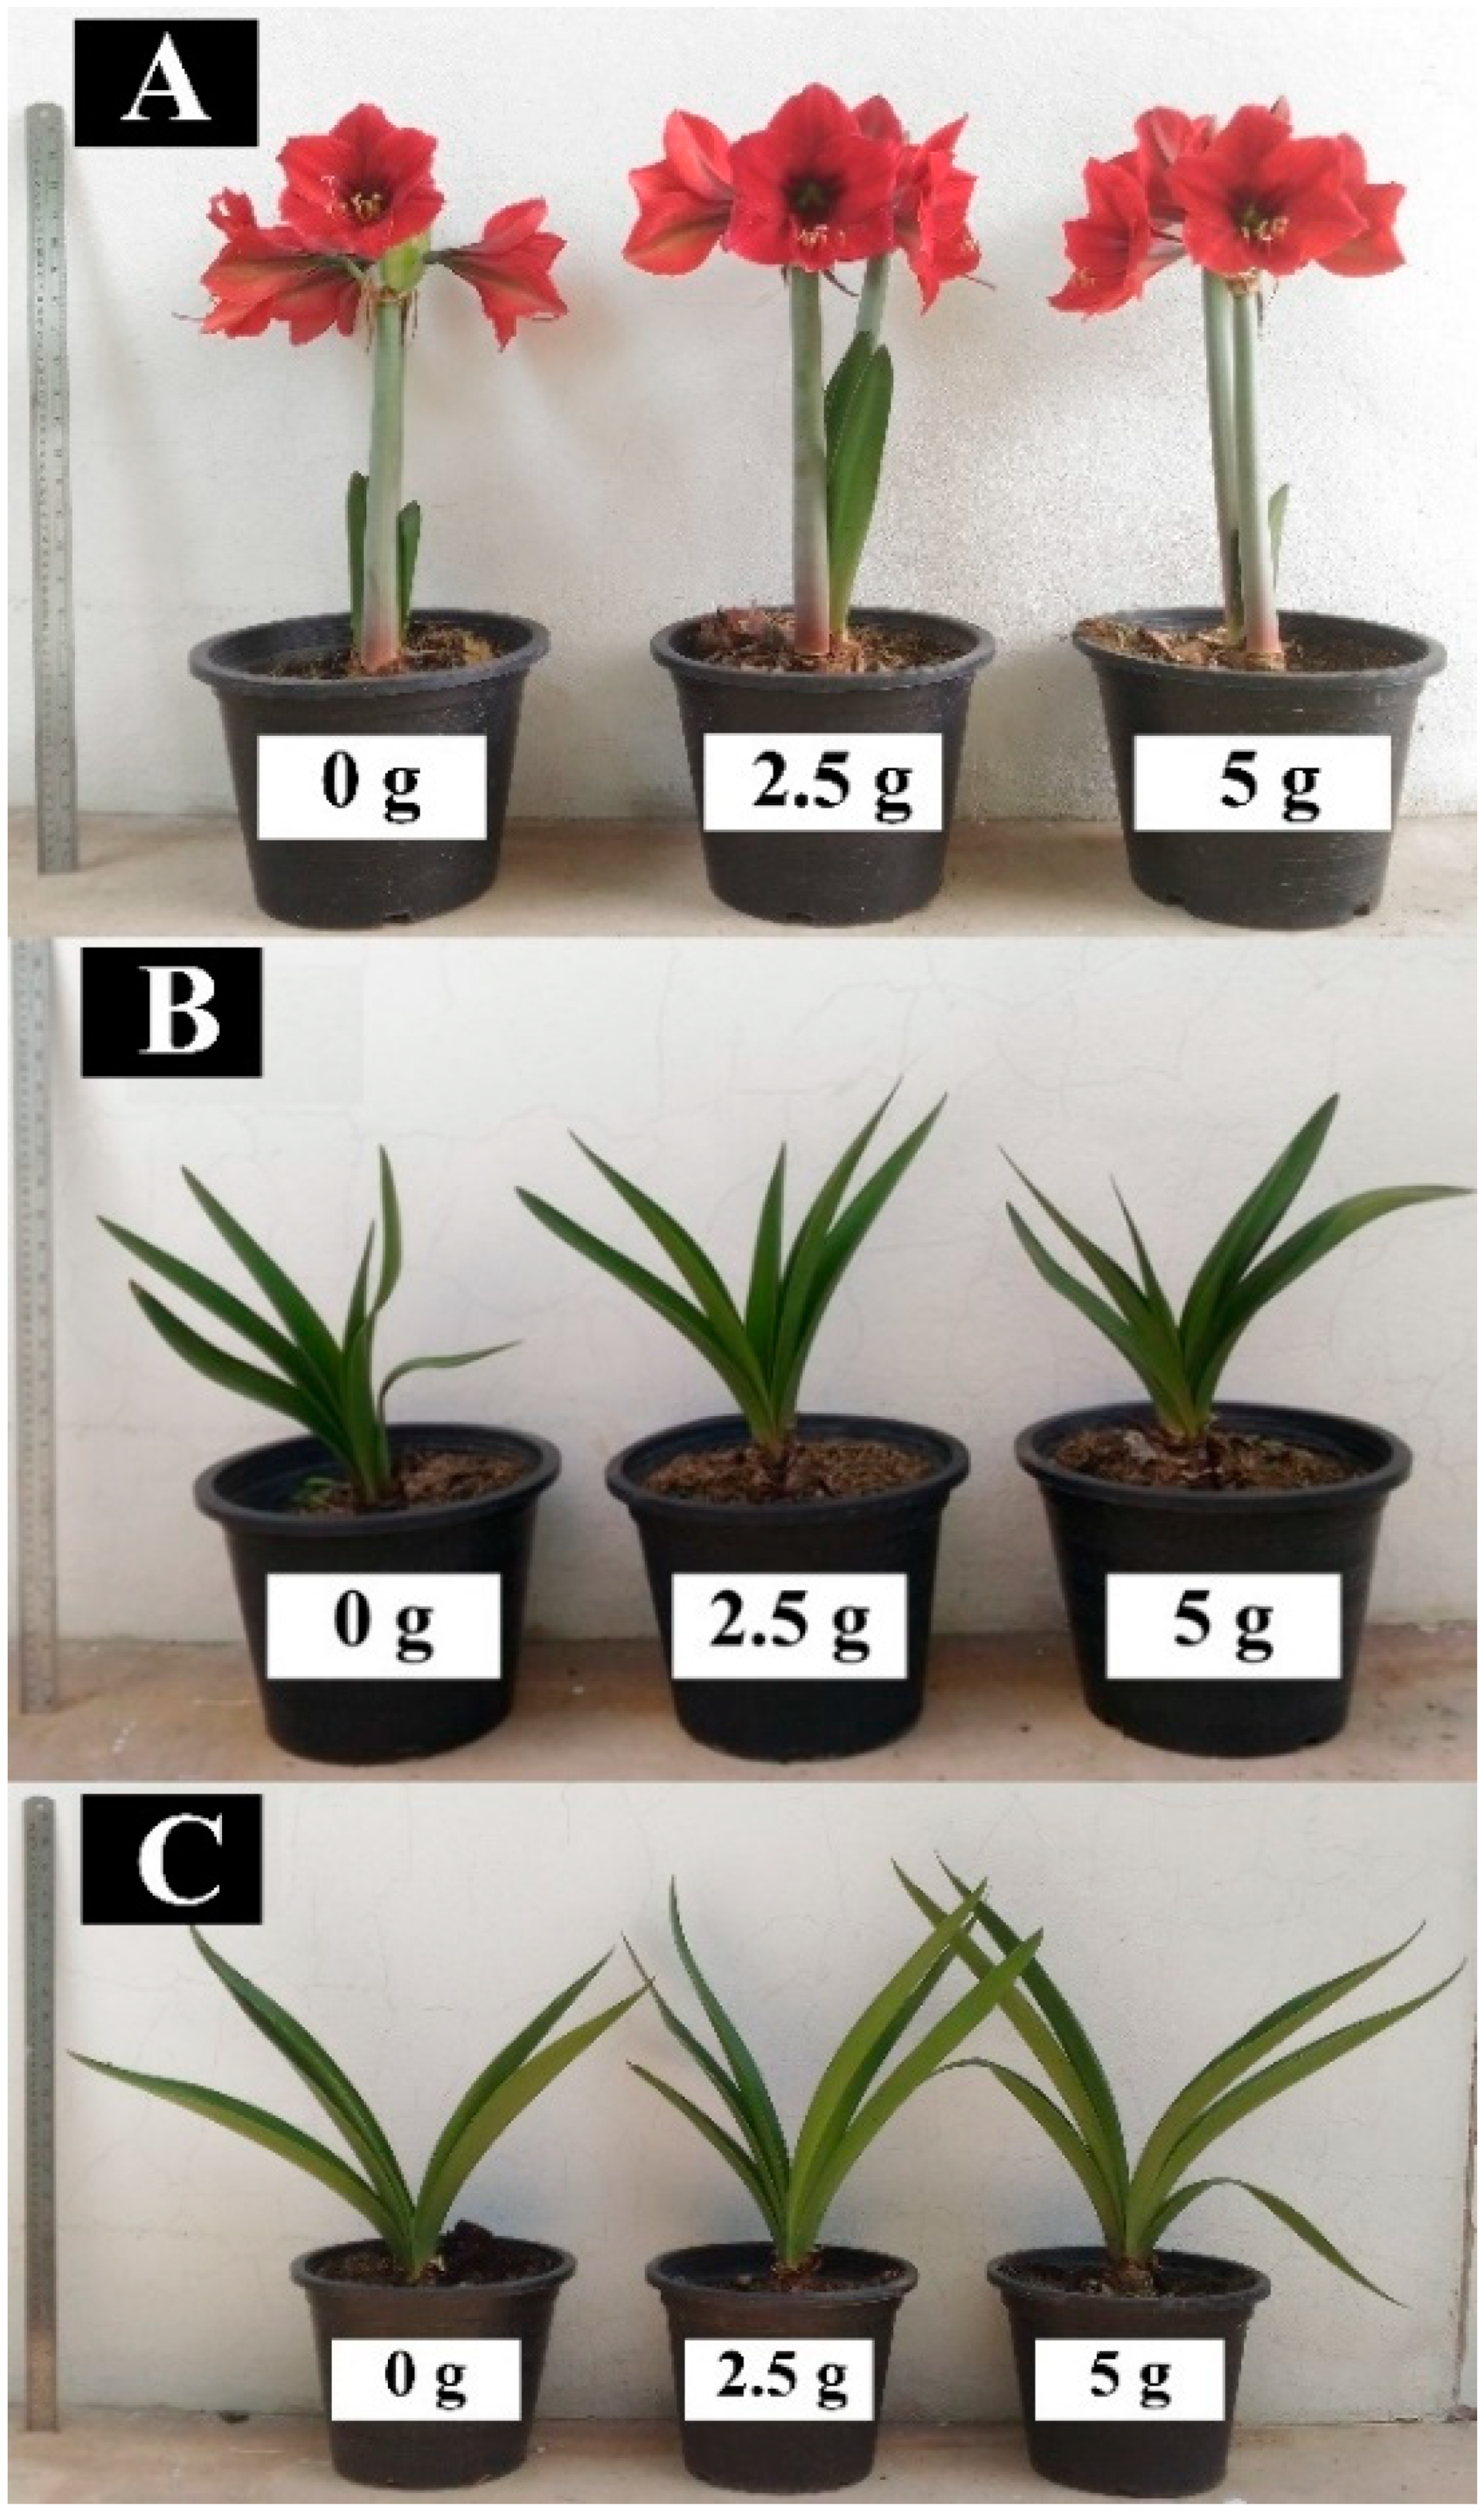
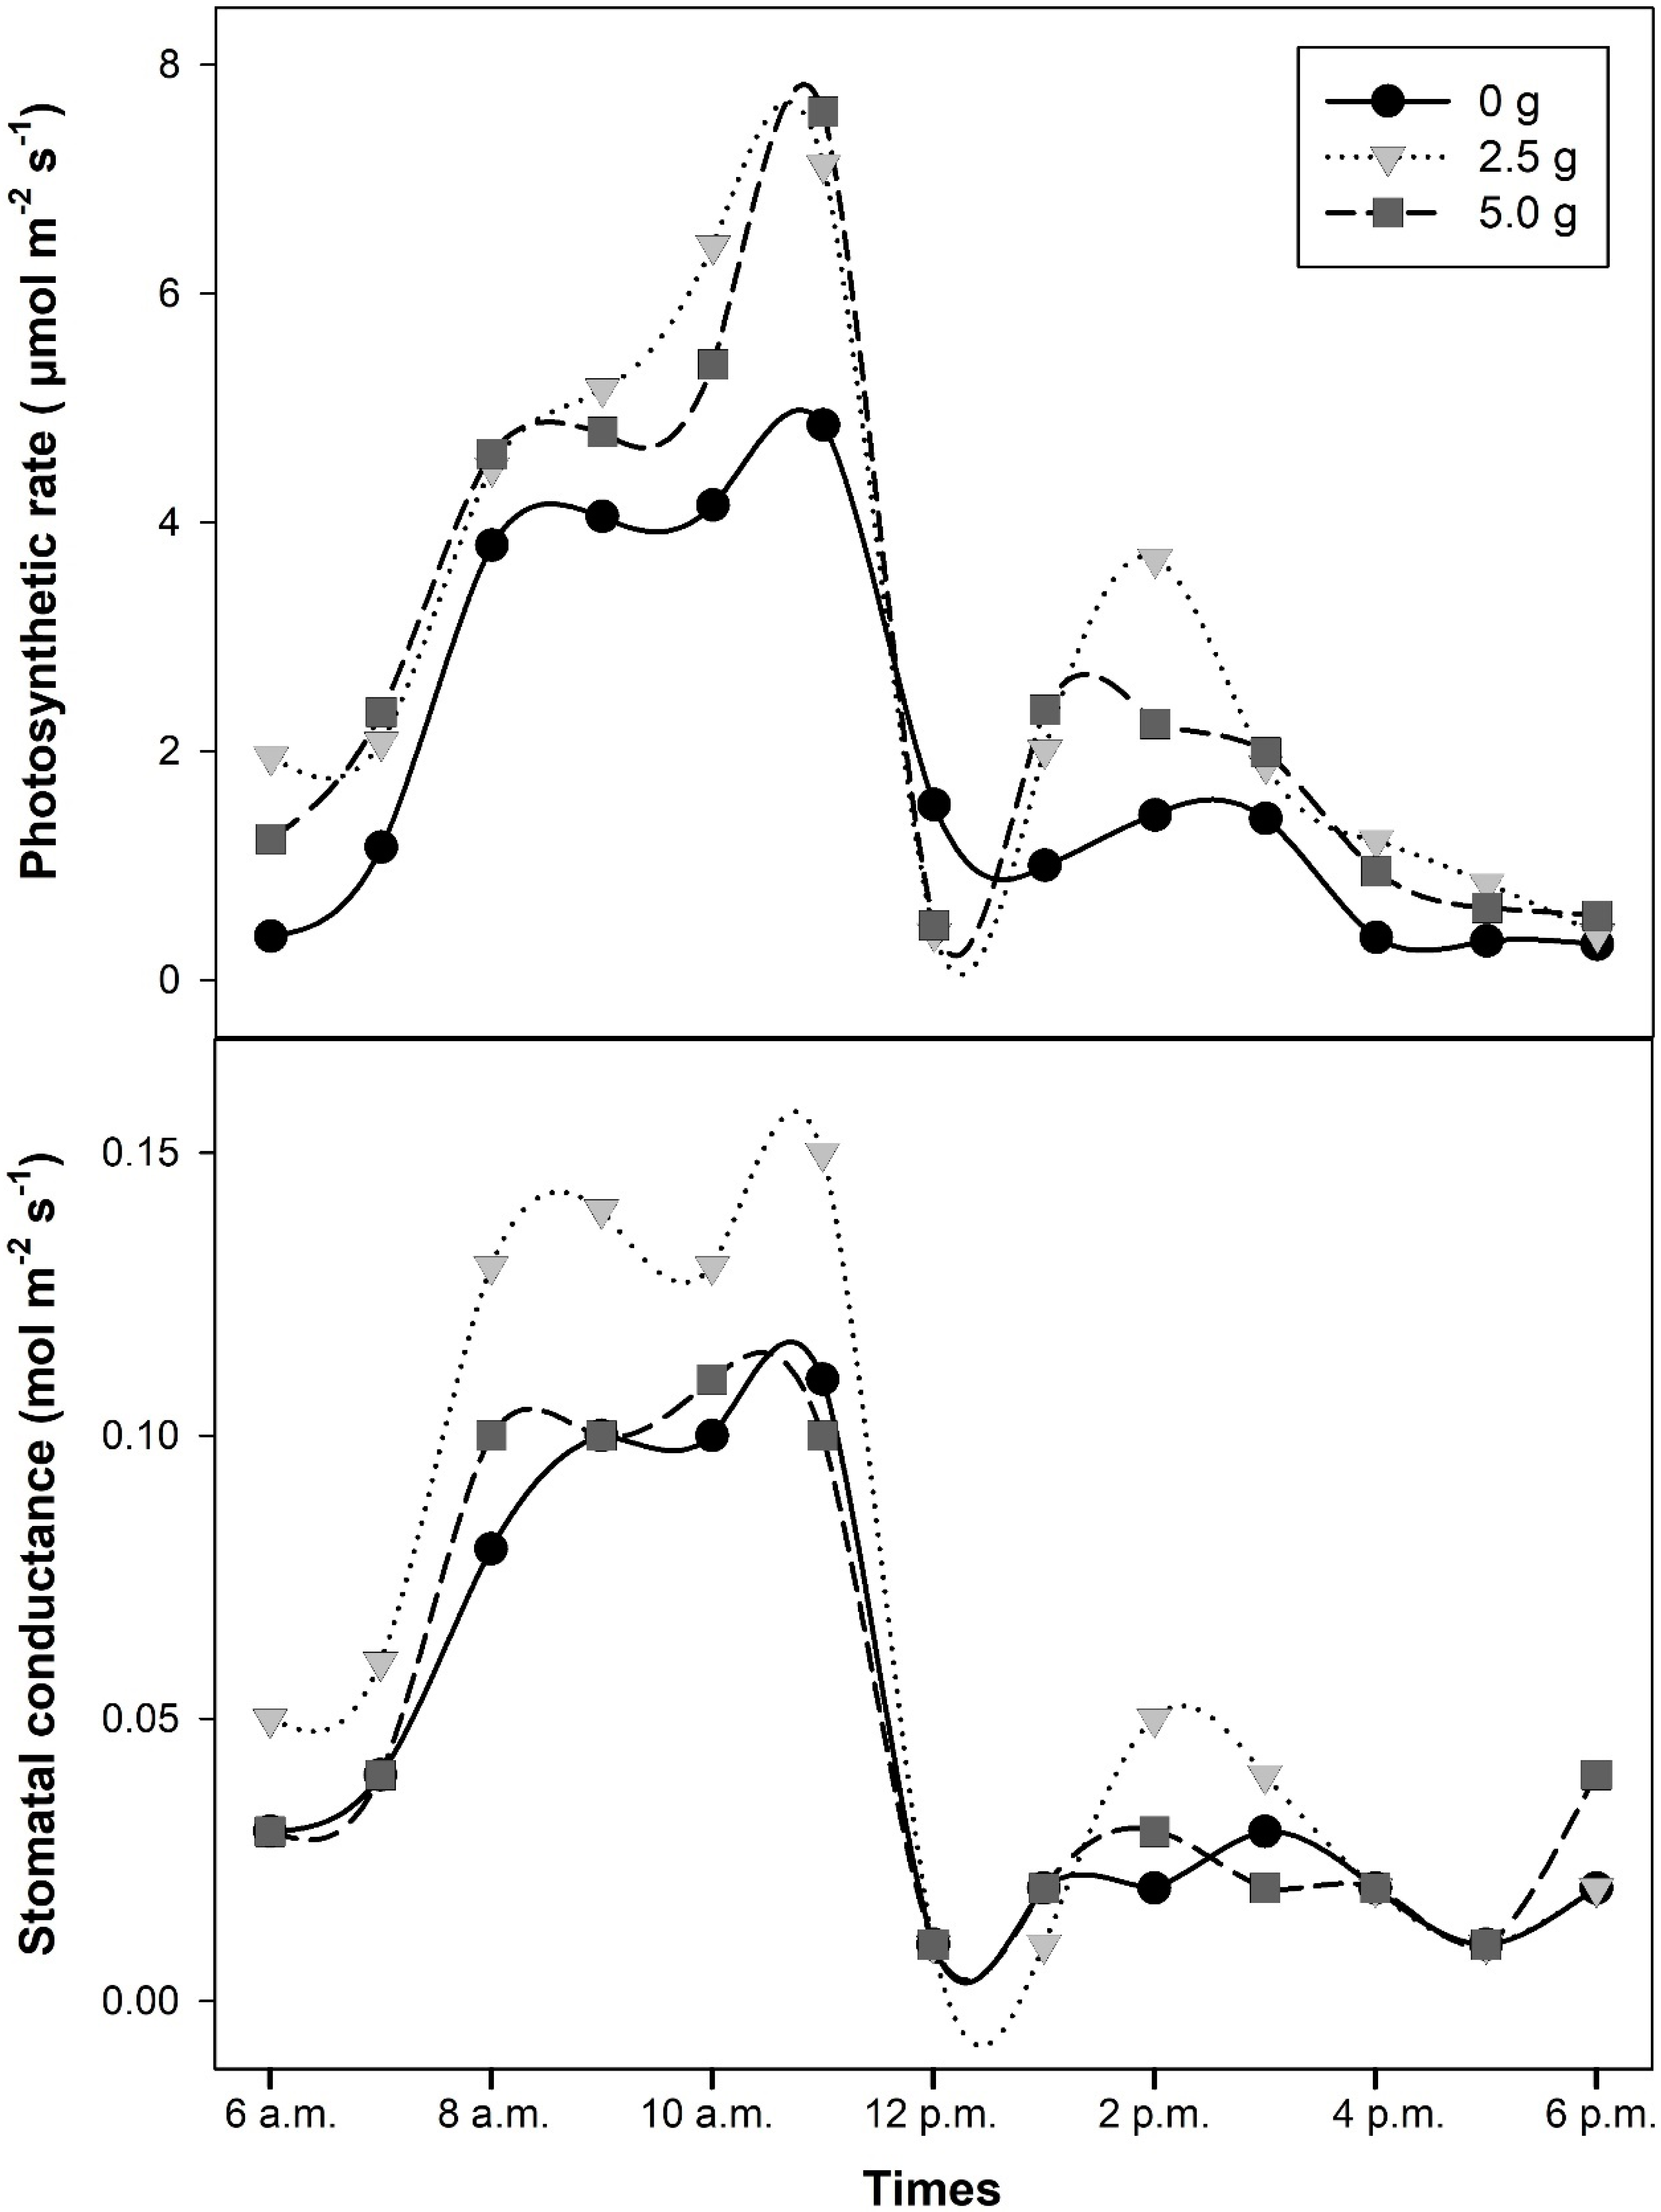
3.1. Experiment 1: Effect of Fertilization Rates on Growth and Water Use Efficiency of Hippeastrum

The effect of fertilization rates on Hippeastrum growth and water use efficiency (WUE) was determined within a one-year growth cycle. The Hippeastrum plant heights were evaluated by measuring the height of the longest leaf at the different growing stages. The results showed plant height was not significantly different between fertilizer rate treatments at 60 DAP; however, plants supplied with 2.5 and 5 g of fertilizer grew taller than plants supplied with no fertilizer supply (Table 1, Figure 1). Similar physiological responses were found in the parameter number of leaves per plant in this experiment (Table 1, Figure 1).
Flower quality (at 45 DAP) was not affected by fertilizer rate treatments. The flower size and flower stalk length of Hippeastrum in this study were in the range of 12.8–13.1 cm and 31.8–32.3 cm, respectively (Figure 1A, Table 2). However, bulb quality (at 180 DAP) showed a dramatic decrease in bulb circumference when no fertilizer was supplied compared with 2.5 and 5.0 g per pot (Table 2, Figure 2). Moreover, plants supplied with 5.0 g fertilizer produced more new bulbs per plant and greater bulb firmness than no fertilizer supply (Table 2). Nevertheless, there was no significant difference in bulb quality between plants supplied with 2.5 and 5.0 g treatments.
At the flowering stage (45 DAP) and early vegetative stage (60 DAP), there were no significant differences in the evapotranspiration rate (ET), WUE, crop evapotranspiration (ETc), and crop coefficient (Kc) among fertilizer rate treatments (Table 3). The averages of ET, WUE, ETc, and Kc at the flowering stage (45 DAP) were 201.2 mm, 1.22 × 10⁻⁴ mg DW mL−1, 120.9 mm, and 2.89, respectively. The average ET, WUE, ETc, and Kc at the early vegetative stage (60 DAP) were 99.8 mm, 9.33 × 10⁻⁴ mg DW mL−1, 59.1 mm, and 1.20, respectively, and all of those parameters had a decreasing trend when compared with the flowering stage (45 DAP). At the late vegetative stage (90 DAP), plants supplied with 5.0 g of fertilizer gave higher results for ET, ETc, and Kc than plants supplied with 0 g fertilizer (Table 3). The average values of ET, WUE, ETc, and Kc of Hippeastrum at the late vegetative stage (90 DAP) were 159.7 mm, 4.2 × 10⁻⁴ mg DW mL−1, 94.3 mm, and 1.53, respectively, which were higher values than at the early vegetative stage (60 DAP) but lower than at the flowering stage (45 DAP).
The diurnal photosynthetic rate of Hippeastrum was affected by different fertilizer rate treatments. Fertilizer deficit (0 g of fertilizer) showed a decreasing trend in the diurnal photosynthetic rate compared with other treatments (Figure 3). The photosynthetic rate (Pn) in all treatments peaked at 11.00 a.m. and declined from the afternoon to the evening (12.00 p.m. to 6.00 p.m.), while the stomatal conductance (Gs) of plants supplied with 2.5 g of fertilizer showed an increasing trend over the other treatment from 6 a.m. to 11 a.m. (Figure 3).

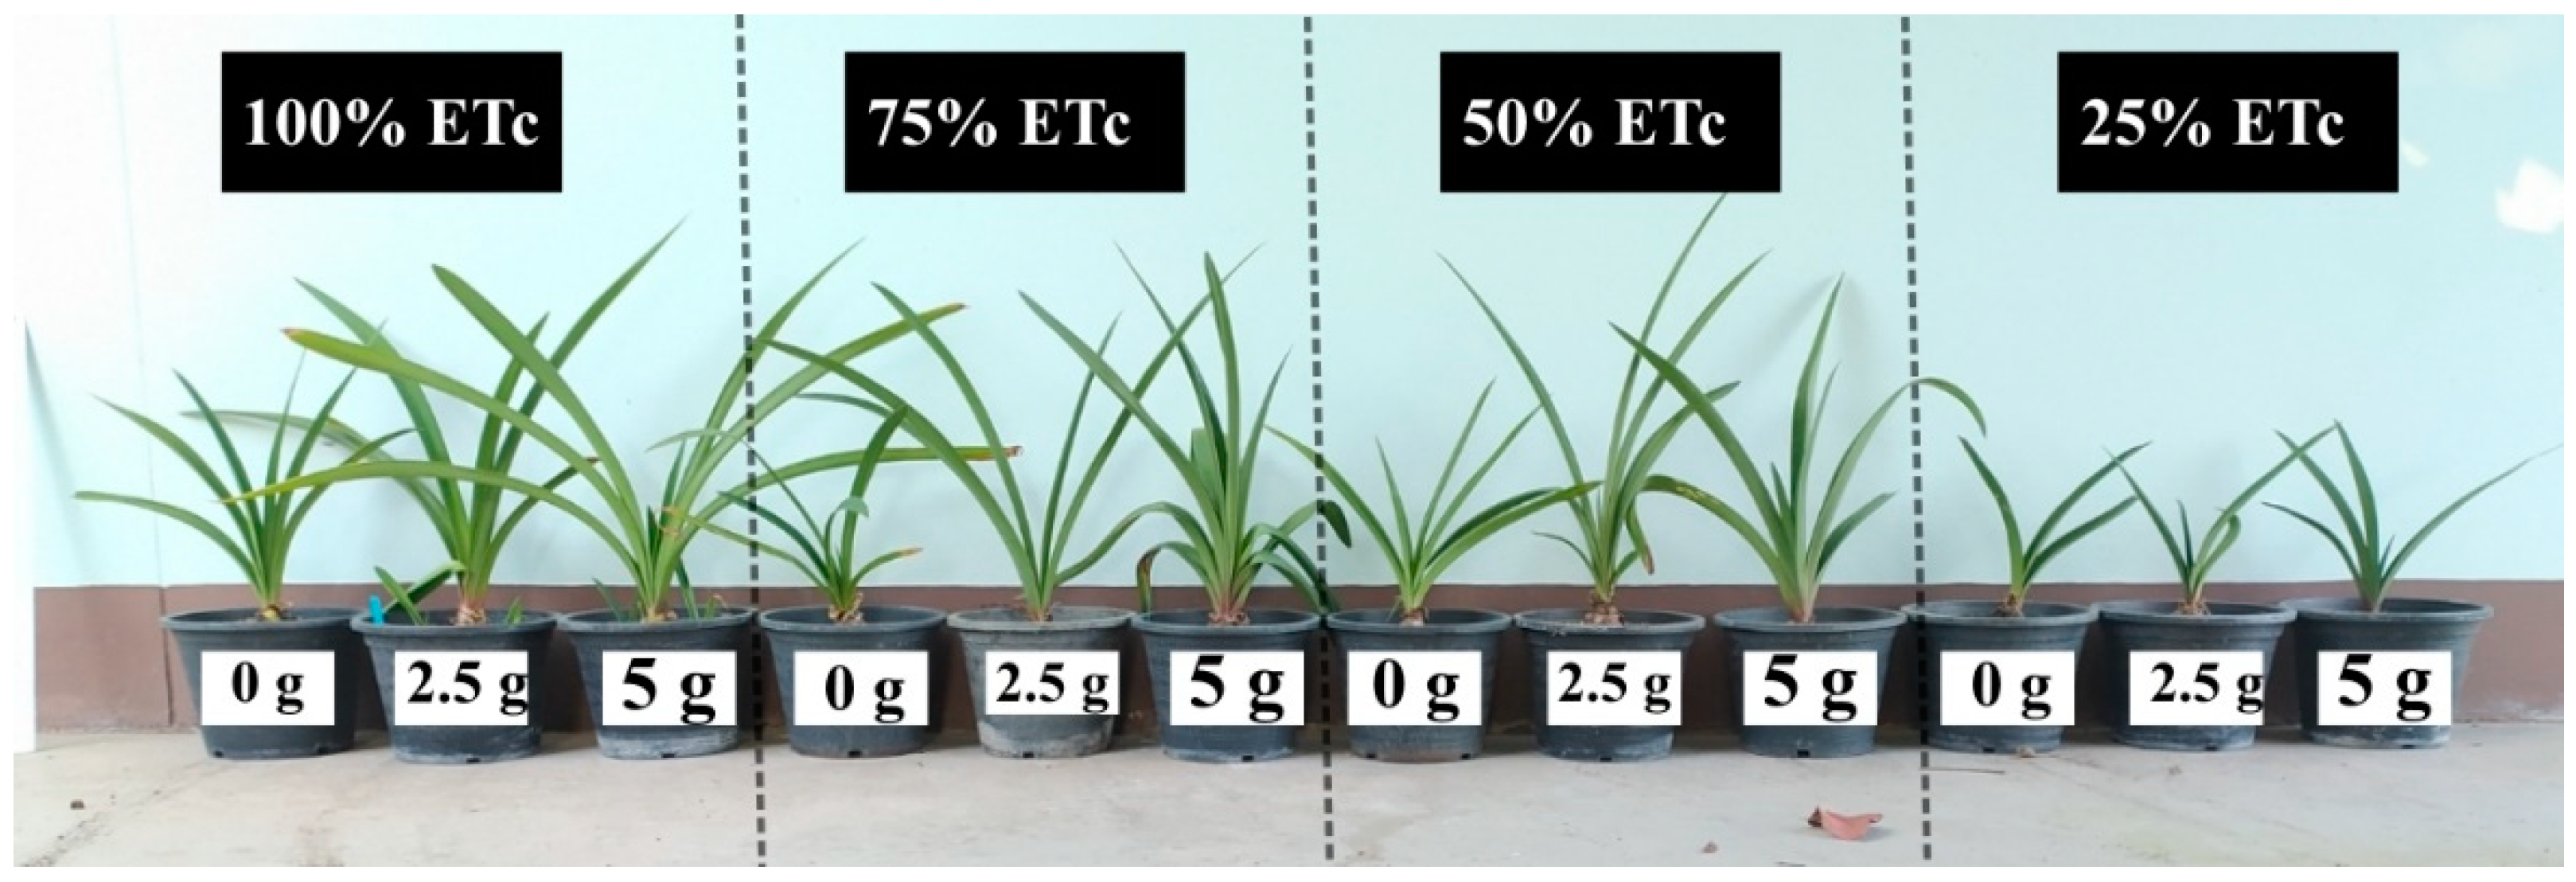
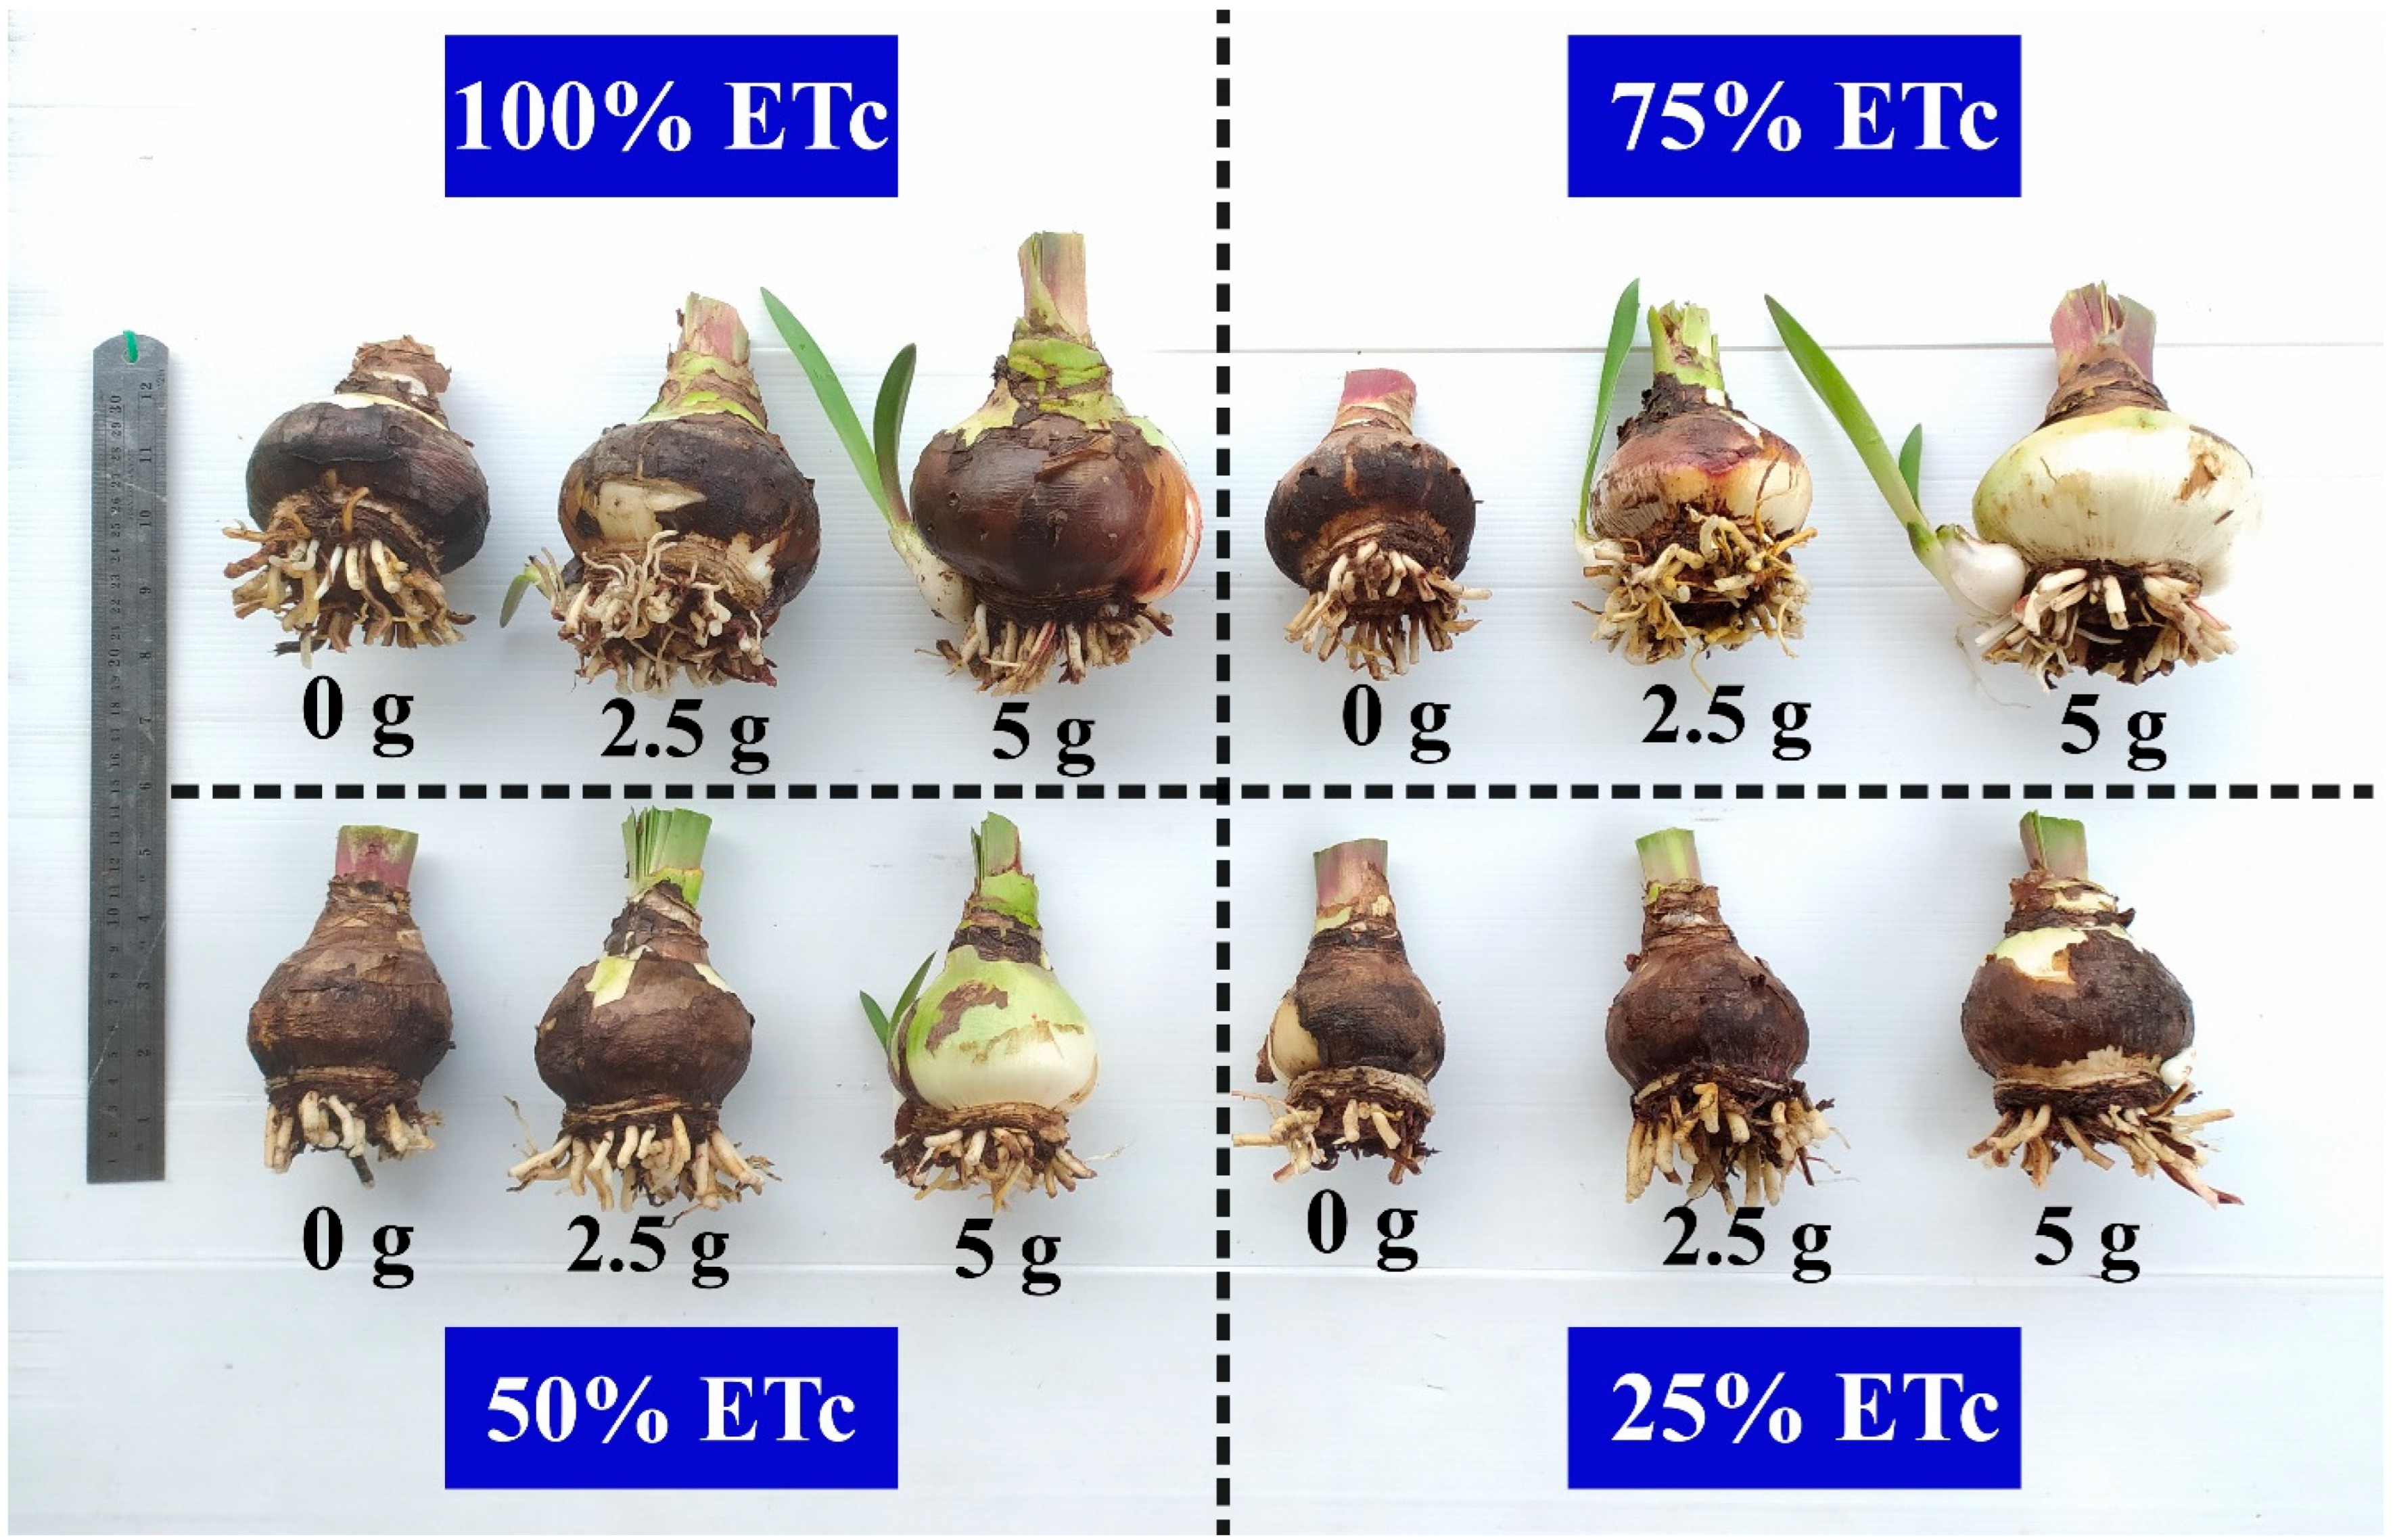
3.2. Experiment 2: Effect of Irrigation Level and Fertilizer Rate on Growth and Yield of Hippeastrum

The effects of irrigation levels and fertilization rates on plant growth, flower quality, and bulb quality of Hippeastrum are shown in Table 4, Figure 4 and Figure 5. The results revealed that flower quality, in terms of flower diameter and stalk length, was not affected by irrigation levels or fertilization rates (Table 4). At 180 DAP, plants supplied with 100% or 75% ETc combined with fertilization rates of 2.5 or 5 g gave higher results for plant height and the number of shoots per plant than plants supplied with irrigation levels at 50% or 25% ETc combined with 0 g fertilizer (Table 4, Figure 4). The number of leaves per plant was not affected by the fertilizer rate factor, but there was a significant difference when the plant was supplied with different irrigation levels. The highest number of leaves per plant was found when the plant was supplied with 100% ETc combined with 5 g of fertilizer. The irrigation level factor did not affect the leaf color intensity (SPAD Unit) of Hippeastrum. No fertilizer supply treatment displayed lower leaf color intensity than plants supplied with 2.5 and 5 g fertilizer treatments (Table 4).
At the bulb harvest stage (180 DAP), the results showed that the fertilizer rate factor did not affect bulb firmness, but bulb fresh weight and circumference increased when plants had higher fertilizer rates. However, a significant interaction between watering and fertilization rates was found in all bulb quality parameters. The highest bulb fresh weight (511.47 g) occurred in the treatment with 100% ETc watering and supplied with 5 g of fertilizer. However, the bulb circumference and firmness of plants supplied with 75% or 100% ETc combined with 5 g of fertilizer were not significantly different (Table 4, Figure 5).
The photosynthetic rate of Hippeastrum, when measured at 11.00 a.m., was in the range of 1.02–3.71 µmol·m−2·s−1 at 180 DAP, and it differed significantly between irrigation level treatments and fertilizer rate treatments (Table 5). The photosynthetic rates were decreased by the reduction in water irrigation levels from 100% ETc to 25% ETc. The highest photosynthetic rates were found when the plant was supplied with a combination of 75% ETc × 5 g of fertilizer and 100% ETc × 2.5 or 5 g of fertilizer (Table 5). Stomatal conductance was not affected by the fertilizer rate factor. However, under a deficit of water supply at 25% ETc, the stomatal conductance was decreased (Table 5).

4. Discussion

4.1. Experiment 1: Effect of Fertilization Rates on Growth and Water Use Efficiency of Hippeastrum

Normally the mother bulb plays a role as a strong source of food reserves at the beginning stage; Hippeastrum utilize food reserves in the mother bulb for flower growth and development. In Easter lily (Lilium longiforum Thunb), food reserves were mobilized from mother bulbs for root and shoot development in the initial period of growth [12]. Thus, in this research, at the flowering stage (45 DAP) and the early vegetative stage (60 DAP), there were no significant differences in flower quality, plant height, and the number of leaves per plant among fertilizer rate treatments (Table 2, Figure 1). However, the different fertilization rates affected plant growth at the late vegetative stage (90 DAP), the results of which clearly showed that the no fertilizer supply treatment reduced plant growth in terms of plant height and the number of leaves per plant than treatment with 2.5 and 5 g (Table 1). This is due to leaves being a major source of plant nutrients and new bulb underground is a strong sink during this period. The translocation of nutrients to stimulate the growth of new bulbs continuously occurred; therefore, fertilizer is the limiting factor to promote growth and development. In Cucuma alismatifolia, the fertilizer application period influences the utilization rate and translocation of N to the sink organs [13]. As Hippeastrum is a bulbous plant, bulb size is a key factor in its growth, flowering, and bulb quality, as a larger size is related to a more abundant food reserve in bulbs. Food reserves from the initial bulb were mostly used at the early stage of plant growth; then, an outside source of fertilizer might be an additional supply to enhance their growth by increasing photosynthetic activity. Similar explanations were given that the growth of bulbous plants typically uses food reserved from mother bulbs first in the initial period of growth, with simultaneous loss of bulb size, weight, and firmness; after that, the bulb weight begins to increase through photosynthesis [12].
Bulb quality at 180 DAP in terms of bulb circumference was higher when the plant was supplied with fertilizer at a rate of 2.5 or 5 g per pot than no fertilizer supply (Table 2). There have been many studies on fertilizer management in bulbous plants. Normally, they suggest that multiple applications of smaller amounts of fertilizer are the most efficient technique for fertilizer regimes in bulb plants. Usually, it is recommended that one-third of the nitrogen (N) fertilizer be applied early in the growing season and the remaining two-thirds in the late part of the growing season. This method ensures N availability during the vegetative and reproductive phases of most bulbous plants [14,15,16].
Hence, the fertilizer regime for Hippeastrum could be manipulated by considering the plant growth stage. From our results, fertilizer supply to Hippeastrum should start after the early vegetative stage (60 DAP) with a supply rate of 2.5 g per pot once a month since there were no significant differences in plant growth during 0–60 DAP, and bulbs were of high quality when supplied with 2.5 g of fertilizers at the bulb harvest stage (180 DAP). High nutrient levels should be avoided mainly at the time of Amaryllis planting because they have a low nutrient requirement at the initial stages [17].
Generally, reference crop evapotranspiration (ETo) expresses the evaporating power of the atmosphere at a specific location and time of the year and does not consider the crop characteristics and soil factors, and this parameter was used for ETc calculation (ETc = Kc × ETo). The WUE parameter is important to quantify water requirements and suggest more appropriate periods for watering. A common problem among growers is determining the optimum irrigation rate at different growth stages. The results of this research revealed that water requirements of Hippeastrum (at 100% ETc) during 0–45 DAP and 45–60 DAP were, on average, 121 and 59 mL per pot per day, respectively (calculated from crop evapotranspiration; ETc). Water usage at the flowering stage (0–45 DAP) was 51% and 22% higher than at the early vegetative stage (45–60 DAP) and late vegetative stage (60–90), respectively. Indicating that the grower should supply sufficient water to the plant to stimulate root emergence and flower blooming. The daily ET of potted marigolds increased slightly in the first two growing stages (pinching and axillary bud growth), increased again in the flowering stage, and reached its highest daily value in the final flowering stage [18]. An important factor affecting WUE of plants is to ensure that a suitable amount of plant nutrients was supplied. When a plant receives sufficient nutrients, this may promote on roots growth and lead to increasing water uptakes. This process increases transpiration and water availability in plants [19]. From this study, we found that the plant supply with 5 g of fertilizer rate had higher crop evapotranspiration (98.2 mm) than those with no fertilizer supply (87.7 mm), and an increasing trend of WUE at 90 DAP is also shown in Table 3. A higher fertilizer supply could increase plant growth and yields, leading to a higher water requirement than a low fertilizer rate supply. In tomato, the lowest WUE was recorded while the plant was grown without fertilizer treatment [20] Fertilizer application is commonly reported to improve the efficiency of water use by increasing yield relative to evapotranspiration. The efficiency of water use by evapotranspiration and transpiration can be increased by increasing nutrient levels in the soil. Adequately fertilized soils promote rapid leaf area expansion, increasing transpiration, and more rapid ground cover, thus reducing evaporation and increasing ET [19]. In our studies, the higher plant growth in terms of plant height and number of leaves per plant (at 90 DAP) were found in plants supplied with 5 g of fertilizer rate than no fertilizer treatment and the same response was observed in ETc values (Table 1 and Table 3). In millet and soybean, the greatest crop yield and WUE were obtained from plants that received a combination of N and P fertilizer followed by a sole of P and N fertilizer application. This indicates that crop yield is likely correlated with WUE [21]. Moreover, an increase in the N fertilizer supply in oriental tobacco caused an increase in WUE [22]. Additionally, the various treatments of the nitrogen source in potato resulted in a significant increase in water use efficiency (WUE) compared to the unfertilized treatment [23].
The photosynthetic rates and stomatal conductance of all fertilizer treatments reached their maximum at 11.00 a.m. A similar response was found that the photosynthetic rates of Hippeastrum increased in the morning from 9.00 a.m. to 11.00 a.m. and reached their maximum at 11.00 a.m., decreasing thereafter [24]. Thus, it might be indicated that the peak photosynthetic rate in the Hippeastrum plant was at 11.00 a.m. Furthermore, a higher fertilizer supply of 2.5 and 5 g could stimulate the photosynthetic rate (Figure 3). High nutritional supplementation led to an increase in the leaf N level and the leaf N is later utilized in the manufacture of thylakoids and the proteins involved in the photosynthetic Calvin cycle [25]. With more N sources added to the plant, there is an increased N availability for biological functions, thus promoting higher photosynthetic efficiency.

4.2. Experiment 2: Effect of Irrigation Level and Fertilization Rate on Growth and Yield of Hippeastrum

Water and fertilizer are the important factors that can be modified by the grower to obtain great quality and yields. When the soil is wet, the water has high potential energy and is easily taken up by roots. In this research, the combination of different irrigation levels (estimated by % ETc) and fertilizer rates had no significant effect on flower quality (Table 4), and the explanation of this issue was given in the discussion of experiment 1. However, there were significant effects of different irrigation levels and fertilization rates on plant growth and bulb quality (Table 4). Plants supplied with 100% ETc combined with 2.5 or 5 g fertilizer and plants supplied with 75% ETc combined with 5 g fertilizer gave greater results for both plant growth (in terms of plant height and the number of shoots per plant) and bulb quality (in terms of bulb circumference) when compared with plants supplied with 50% and 25% ETc combined with all fertilization rates (0, 2.5, and 5 g per pot) (Table 4, Figure 4 and Figure 5). A possible explanation for these results is that a water deficit diminished plant growth, leading to decreased yields. Water deficits lead to the overproduction of reactive oxygen species (ROS), such as hydrogen peroxide (H2O2) and superoxide anion radicals (O2·) [26], which results in growth inhibition, decreases in photosynthetic functions [27], lipid peroxidation, and a higher frequency of programmed cell death processes [28].
The individual factor analysis in this experiment showed that the number of leaves per plant parameter was more sensitive to the irrigation factor than the fertilizer rate factor, whereas leaf color intensity (chlorophyll content in SPAD units) was more sensitive to the fertilizer rate than the irrigation factor (Table 4). This may be because essential elements in fertilizer (especially N, Mg, and Fe) had a high influence on chlorophyll synthesis. Nitrogen is a major component of the photosynthetic apparatus and is widely used as a fertilizer in crops. The specific leaf N was partly related to N partitioning in photosynthetic enzymes, pigment content, and the size, number, and composition of chloroplasts [29].
In our studies, the highest photosynthetic rates were found when plants were supplied with the combination of 100% ETc combined with 2.5 or 5 g fertilizer and 75% ETc combined with 5 g fertilizer. This combination could be the optimum level of irrigation and fertilizer for Hippeastrum since they also gave the greatest results for plant growth and bulb quality. For individual factor analysis, it was shown that the photosynthetic rate and stomatal conductance decreased under the water deficit condition at 25% ETc (Table 5), which was related to decreased plant growth (Table 4). Water stress is problematic for plant growth and development [30], as it limits access to the resources required for photosynthesis due to stomatal closure and the reduction in internal water transport [31]. Furthermore, a water deficit reduces plant growth, primarily due to a reduction in stomatal conductance, which inhibits C assimilation [32,33].

5. Conclusions

In experiment 1, Hippeastrum supplied with 2.5 g 15-15-15 (N-P2O5-K2O) fertilizer per pot per month under 100% ETc exhibited a suitable enhancement for both plant growth and bulb quality. Plants needed water in the range of 96.8–98.2 mL per day per pot for their proper growth. The highest photosynthetic rate of Hippeastrum was detected at 11.00 a.m.
In experiment 2, Hippeastrum supplied with 100% ETc combined with a supplied fertilizer rate of 2.5 g per pot was the optimum level, and increased photosynthetic rate led to an increase in plant growth and bulb quality. However, fertilizer supplied at 5 g per pot could be carried out when a reduction in water supply with 70% ETc was used.

Author Contributions

Conceptualization, C.I. and S.R.; methodology, C.I., K.P. and S.R.; software, C.I.; validation, C.I. and S.R.; formal analysis, C.I., K.P. and S.R.; investigation, C.I., K.P. and S.R.; data curation, C.I., K.P. and S.R.; writing—original draft preparation, C.I., K.P. and S.R.; writing—review and editing, C.I. and S.R.; visualization, C.I.; supervision, C.I. and S.R.; project administration, C.I. and S.R.; funding acquisition, C.I. and S.R. All authors have read and agreed to the published version of the manuscript.

Funding

This research received no external funding.

Institutional Review Board Statement

Not applicable.

Informed Consent Statement

Not applicable.

Data Availability Statement

C.I. and S.R. are responsible for data keeping, and data are available upon request.

Acknowledgments

This research work was partially supported by Chiang Mai University. We thank the Highland Research and Development Institute (Public Organization), Thailand, and H.M. The King’s Initiative Centre for Flower and Fruit Propagation, Chiang Mai, Thailand for their kind support.

Conflicts of Interest

The authors declare no conflict of interest.

References

  1. Bayer, A.; Whitaker, K.; Chappell, M.; Ruter, J.; van Iersel, M.W. Effect of irrigation duration and fertilizer rate on plant growth, substrate solution EC and leaching volume. Acta Hortic. 2014, 1034, 477–484. [Google Scholar] [CrossRef]
  2. Scherer, T.F.; Franzen, D.; Cihacek, L. Soil, Water and Plant Characteristics Important to Irrigation. NDSU Extension Service. Available online: https://www.ag.ndsu.edu/publications/crops/soil-water-and-plant-characteristics-important-to-irrigation (accessed on 13 October 2021).
  3. Edwards, C.E.; Ewers, B.E.; McClung, C.R.; Lou, P.; Weinig, C. Quantitative Variation in water-use efficiency across water regimes and its relationship with circadian, vegetative, reproductive, and leaf gas-exchange traits. Mol. Plant 2012, 5, 653–668. [Google Scholar] [CrossRef] [PubMed] [Green Version]
  4. Wang, Y.; Chen, D.; He, X.; Shen, J.; Xiong, M.; Wang, X.; Zhou, D.; Wei, Z. Revealing the complex genetic structure cultivated amaryllis (Hippeastrum hybridum) using transcriptome-derive microsatellite markers. Sci. Rep. 2018, 8, 10645. Available online: https://www.nature.com/articles/s41598-018-28809-9 (accessed on 13 October 2021). [CrossRef] [PubMed] [Green Version]
  5. AIPH. International Statistics Flowers and Plants; International Association of Horticultural Producers: Oxford, UK, 2020; Volume 68, Available online: www.aiph.org/statistical-yearbook (accessed on 13 October 2021).
  6. Okubo, H. Hippeastrum (Amaryllis). In The Physiology of Flower Bulb; Hertogh, A.D., Le Nard, M., Eds.; Elsevier: Amsterdam, The Netherlands, 1993; pp. 321–334. [Google Scholar]
  7. Jerry, L.; Christian, D. Water-Use Efficiency: Advances and challenges in a changing climate. Front. Plant Sci. 2019, 10, 103. [Google Scholar] [CrossRef] [Green Version]
  8. Pereira, J.S.; Kozlowski, T.T. Leaf anatomy and water relations of Eucalyptus camaldulensis and E. globulus seedlings. Can. J. Bot. 1976, 54, 2868–2880. [Google Scholar] [CrossRef]
  9. Turner, N.C. Crop Water Deficits: A Decade of Progress. Adv. Agron. 1986, 39, 1–51. [Google Scholar] [CrossRef]
  10. Allen, R. Penman–Moteith Equation. In Encyclopedia of Soils in the Environment; Elsevier B.V.: Amsterdam, The Netherlands, 2005; pp. 180–188. [Google Scholar]
  11. Vudhivanich, V. Monthly potential evapotranspiration of Thailand. Kasetsart J. (Nat. Sci.) 1996, 30, 392–399. [Google Scholar]
  12. Roberts, A.N.; Blaney, L.T. Growth and development of the Easter lily bulb, Lilium longiflorum Thunb. ‘Croft’. Proc. Am. Soc. Hortic. Sci. 1996, 89, 643–650. [Google Scholar]
  13. Anuwong, C.; Ohyama, T.; Sueyoshi, K.; Ohtake, N.; Sato, T.; Ruamrungsri, S. Uptake and translocation of nitrogen in patumma (Curcuma alismatifolia) by leaves or root. J. Plant Nutr. 2017, 40, 1204–1212. [Google Scholar] [CrossRef]
  14. Slangen, J.H.G.; Krook, G.J.; Hendriks, C.H.M.; Hof, N.A.A. Nitrogen dressing and nutrient absorption of lilies (Asiatic hybrids) on sandy soils. Neth. J. Agric. Sci. 1989, 37, 269–272. [Google Scholar] [CrossRef]
  15. Batal, K.M.; Bondari, K.; Granberry, D.M.; Mullinix, B.G. Effects of source, rate, and frequency of N application on yield, marketable grades and rot incidence of sweet onion (Allium cepa L. cv. Granex-33). J. Hortic. Sci. 1994, 69, 1043–1051. [Google Scholar] [CrossRef]
  16. Diaz-perez, P.J.; Purvis, A.C.; Paulk, J.T. Bolting, yield, and bulb decay of sweet onion as affected by nitrogen fertilization. J. Am. Soc. Hortic. Sci. 2003, 128, 144–149. [Google Scholar] [CrossRef] [Green Version]
  17. Tombolato, A.F.C. Cultivo Comercial de Plantas Ornamentais; Campinas Instituto Agronômico: Sao Paulo, Brazil, 2004; p. 211. [Google Scholar]
  18. Hongpakdee, P.; Ruamrungsri, S. Water use efficiency, nutrient leaching, and growth in potted marigolds affected by coconut coir dust amended in substrate media. Hortic. Environ. Biotechnol. 2015, 56, 27–35. [Google Scholar] [CrossRef]
  19. Drechsel, P.; Heffer, P.; Magen, H.; Mikkelsen, R.; Wichelns, D. Managing water and fertilizer for sustainable agricultural intensification. In Water Use Efficiency in Agriculture: Measurement, Current Situation and Trends; Sharma, B., Molden, D., Cook, S., Eds.; International Fertilizer Industry Association (IFA);: Paris, France; International Water Management Institute (IWMI): Colombo, Sri Lanka; International Plant Nutrition Institute (IPNI): Peachtree Corners, GA, USA; International Potash Institute (IPI): Zug, Switzerland, 2015; pp. 39–64. [Google Scholar]
  20. Tesfay, T.; Berhane, A.; Gebremariam, M. Optimizing irrigation water and nitrogen fertilizer levels for tomato production. Open Agric. J. 2019, 13, 196–206. [Google Scholar] [CrossRef] [Green Version]
  21. Liu, Q.; Xu, H.; Mu, X.; Zhao, G.; Gao, P.; Sun, W. Effects of Different Fertilization Regimes on Crop Yield and Soil Water Use Efficiency of Millet and Soybean. Sustainability 2020, 12, 4125. [Google Scholar] [CrossRef]
  22. Brueck, H.; Senbayram, M. Low nitrogen supply decreases water-use efficiency of oriental tobacco. J. Plant Nutr. Soil Sci. 2009, 172, 216–223. [Google Scholar] [CrossRef]
  23. Eid, M.A.M.; Abdel-Salam, A.A.; Salem, H.M.; Mahrous, S.E.; Seleiman, M.F.; Alsadon, A.A.; Solieman, T.H.I.; Ibrahim, A.A. Interaction Effects of Nitrogen Source and Irrigation Regime on Tuber Quality, Yield, and Water Use Efficiency of Solanum tuberosum L. Plants 2020, 9, 110. [Google Scholar] [CrossRef] [Green Version]
  24. Inkham, C.; Hongpakdee, P.; Kajornrungsilp, I.; Thanamatee, C.; Ruamrungsri, S. Root-zone cooling by cold energy from LNG regasification process for quality improvement of flower and bulb of Hippeastrum. Hortic. Environ. Biotechnol. 2020, 61, 643–650. [Google Scholar] [CrossRef]
  25. Evans, J.R. Photosynthesis and nitrogen relationships in leaves of C3 plants. Oecologia 1989, 78, 9–19. [Google Scholar] [CrossRef]
  26. Wallace, J.G.; Zhang, X.C.; Beyene, Y.; Semagn, K.; Olsen, M.; Prasanna, B.M.; Buckler, E.S. Genome-wide association for plant height and flowering time across 15 tropical maize populations under managed drought stress and well-watered conditions in sub-Saharan Africa. Crop Sci. 2016, 56, 2365–2378. [Google Scholar] [CrossRef] [Green Version]
  27. Deeba, F.; Pandey, A.K.; Ranjan, S.; Mishra, A.; Singh, R.; Sharma, Y.K.; Shirke, P.A.; Pandey, V. Physiological and proteomic responses of cotton (Gossypium herbaceum L.) to drought stress. Plant Physiol. Biochem. 2012, 53, 6–18. [Google Scholar] [CrossRef] [PubMed]
  28. Gill, S.S.; Tuteja, N. Reactive oxygen species and antioxidant machinery in abiotic stress tolerance in crop plants. Plant Physiol. Biochem. 2010, 48, 909–930. [Google Scholar] [CrossRef] [PubMed]
  29. Laza, R.C.; Bergman, B.; Vergara, B.S. Cultivar differences in growth and chloroplast ultrastructure in rice as affected by nitrogen. J. Exp. Bot. 1993, 44, 1643–1648. [Google Scholar] [CrossRef]
  30. McDowell, N.G.; Beerling, D.J.; Breshears, D.D.; Fisher, R.A.; Raffa, K.F.; Stitt, M. The interdependence of mechanisms underlying climate-driven vegetation mortality. Trends Ecol. Evol. 2011, 26, 523–532. [Google Scholar] [CrossRef]
  31. Breda, N.; Huc, R.; Granier, A.; Dreyer, E. Temperate Forest trees and stands under severe drought: A review of ecophysiological responses, adaptation processes and long-term consequences. Ann. For. Sci. 2006, 63, 625–644. [Google Scholar] [CrossRef] [Green Version]
  32. Greenwood, D.J.; Lemaire, G.; Gosse, G.; Cruz, P.; Draycott, A.; Neeteson, J.J. Decline in percentage N of C3 and C4 crops with in-creasing plant mass. Ann. Bot. 1990, 66, 425–436. [Google Scholar] [CrossRef] [Green Version]
  33. Bradford, K.J.; Hsiao, T.C. Physiological responses to moderate water stress. In Physiological Plant Ecology II. Water Relations and Carbon Assimilation; Lange, O.L., Nobel, P.S., Osmond, C.B., Ziegler, H., Eds.; Springer: Berlin/Heidelberg, Germany, 1982; pp. 263–324. [Google Scholar]
Figure 1. Growth of Hippeastrum ‘Red Lion’ after fertilization at different rates 45 (A), 60 (B), and 90 (C) days after planting.
Horticulturae 08 00345 g001
Figure 2. Bulb quality of Hippeastrum ‘Red Lion’ after fertilization at different rates 180 days after planting.
Horticulturae 08 00345 g002
Figure 3. Diurnal photosynthetic rates (µmol m−2 s−1) and stomatal conductance (mol m−2 s−1) of Hippeastrum ‘Red Lion’ grown under different fertilization rates 90 days after planting.
Horticulturae 08 00345 g003
Figure 4. Plant growth of Hippeastrum ‘Red Lion’ grown under different irrigation level combinations with different fertilization rates 180 days after planting.
Horticulturae 08 00345 g004
Figure 5. Bulb quality of Hippeastrum ‘Red Lion’ grown under different irrigation level combinations with different fertilization rates 180 days after planting.
Horticulturae 08 00345 g005
Table 1. Effect of fertilization rates on growth and Hippeastrum ‘Red Lion’ at different growing stages.
Fertilization Rate
(g per Plant per Month)
Plant Height (cm)Number of Leaves per Plant
45 DAP60 DAP90 DAP45 DAP60 DAP90 DAP
0 gNL31.542.6 bNL4.14.8 b
2.5 gNL31.846.1 aNL4.36.1 a
5.0 gNL30.847.1 aNL4.16.6 a
LSD0.05-NS*-NS*
* Means in the same column followed by different letters are significantly different (p ≤ 0.05) by LSD, NS = not significantly different, NL = no leaves appear, DAP = days after planting.
Table 2. Effects of fertilization rates on flower and bulb qualities of Hippeastrum ‘Red Lion’ at the flowering stage (45 DAP) and bulb harvesting stage (180 DAP).
Fertilizer Rate
(g per Plant per Month)
Flower Quality
(45 DAP)
Bulb Quality
(180 DAP)
Flower Stalk Length (cm)Flower Diameter (cm)Bulb Circumference (cm) Number of New BulbsBulb Firmness (Newtons)
0 g31.812.824.0 b0.0 b2.3 b
2.5 g32.213.128.0 a0.5 ab2.7 ab
5.0 g32.312.728.5 a0.8 a2.9 a
LSD0.05NSNS***
* Means in the same column followed by different letters are significantly different (p ≤ 0.05) by LSD, NS: not significantly different, DAP = days after planting.
Table 3. Effects of fertilization rates on the evapotranspiration rates, water use efficiency, crop evapotranspiration, and crop coefficient of Hippeastrum ‘Red Lion’ at different growing stages.
Fertilizer Rate
(g per Plant per Month)
Evapotranspiration Rate
(ET; mm)
Water Use Efficiency
(WUE; mg DW mL−1)
Crop Evapotranspiration
(ETc; mm)
Crop Coefficient
(Kc)
45 days after planting
0 g2057.88 × 10−5121.32.91
2.5 g207.67.42 × 10−5122.92.94
5.0 g2002.11 × 10−4118.42.83
LSD0.05NSNSNSNS
60 days after planting
0 g1006.95 × 10−459.21.2
2.5 g1011.41 × 10−359.81.21
5.0 g98.46.95 × 10−458.21.18
LSD0.05NSNSNSNS
90 days after planting
0 g148.2 b3.29 × 10−487.7 b1.42 b
2.5 g163.6 ab3.42 × 10−496.8 ab1.57 ab
5.0 g166.0 a5.91 × 10−498.2 a1.59 a
LSD0.05*NS**
* Means in the same column followed by different letters are significantly different (p ≤ 0.05) by LSD, NS = not significantly different.
Table 4. Plant growth, flower quality, and bulb quality of Hippeastrum ‘Red Lion’ grown under different irrigation levels and fertilization rates at the flowering stage (45 DAP), growing stage (180 DAP), and bulb harvest stage (180 DAP).
Irrigation Levels
(% ETc)
Fertilization Rates
(g per Plant per Month)
Flower Quality
(45 Days after Planting)
Flower Quality
(45 Days after Planting)
Bulb Quality
(180 Days after Planting)
Flower Diameter (cm)Stalk Length (cm)Plant Height (cm)No. Shoots
per Plant
No. Leaves per PlantLeaf Color
(SPAD)
Bulb Fresh Weight (g)Bulb Circumference (cm)Bulb Firmness (Newtons)
100011.912.750.3 b0.1 d6.7 bc50.1 c274.9 d25.2 bc2.53 b
2.51314.763.3 a1.4 ab8.0 ab58.4 ab426.1 b29.3 a2.60 b
512.213.763.5 a2.0 a8.2 a63.8 a511.5 a31.9 a2.70 ab
75012.51350.0 b0.1 d6.6 bc49.1 c220.3 f24.5 bc2.66 ab
2.511.812.160.3 a1.1 ab6.8 bc59.1 ab255.4 e24.0 cd2.60 b
511.914.460.8 a1.2 ab7.0 abc55.6 bc401.5 c28.1 ab2.70 ab
50012.515.540.0 c0.1 d6.4 c56.1 bc175.1 h20.5 d2.76 ab
2.512.413.150.0 b0.1 d6.5 c62.2 ab220.7 f23.2 cd2.73 ab
512.313.851.0 b1.0 bc6.8 bc56.3 abc226.8 f23.6 cd2.76 ab
25012.813.235.3 c0.1 d6.3 c58.1 ab170.1 h20.2 d2.76 ab
2.512.614.136.0 c0.1 d6.4 c54.8 bc200.6 g21.8 cd2.90 a
512.41437.0 c0.5 bcd6.6 bc59.5 ab221.3 f23.1 cd2.73 ab
Irrigation × FertilizerNSNS******
Individual factor analysis
Irrigation levels factorNSNS***NS **
Fertilization rates factorNSNS**NS***
* Means in the same column followed by different letters are significantly different (p ≤ 0.05) by LSD, NS: not significantly different.
Table 5. Photosynthetic rates (µmol m−2 s−1) and stomatal conductance (mol m−2 s−1) of Hippeastrum ‘Red Lion’ grown under different irrigation levels and fertilization rates 180 days after planting.
FactorsPhotosynthetic Rates
(µmol m−2 s−1)
Stomatal Conductance
(mol m−2 s−1)
Irrigation level (% ETC)
100% ETc3.04 a0.031 ab
75% ETc2.22 b0.037 a
50% ETc1.37 c0.036 ab
25% ETc1.30 c0.024 b
LSD0.05**
Fertilizer rate (g per plant per month)
0 g1.43 b0.03
2.5 g2.12 a0.028
5.0 g2.41 a0.038
LSD0.05*NS
Irrigation level × Fertilizer rate
100% ETc × 0.0 g2.14 b0.023 bc
100% ETc × 2.5 g3.37 a0.023 bc
100% ETc × 5.0 g3.62 a0.047 a
75% ETc × 0.0 g1.23 bc0.033 abc
75% ETc × 2.5 g1.73 bc0.037 abc
75% ETc × 5.0 g3.71 a0.043 ab
50% ETc × 0.0 g1.31 bc0.043 ab
50% ETc × 2.5 g1.51 bc0.030 abc
50% ETc × 5.0 g1.30 bc0.033 abc
25% ETc × 0.0 g1.03 c0.020 c
25% ETc × 2.5 g1.86 bc0.023 bc
25% ETc × 5.0 g1.02 c0.030 abc
LSD0.05**
* Means in the same column followed by different letters are significantly different (p ≤ 0.05) by LSD, NS = not significantly different.
Publisher’s Note: MDPI stays neutral with regard to jurisdictional claims in published maps and institutional affiliations.

