Abstract
Regionality is a term used in the tea industry to describe the particular style of tea produced by a growing region. Determining the characteristics of the tea of specific regions can help growers predict tea plant quality before harvesting and eventually production. As such, in this study, we collected representative Oolong tea samples from 15 regions in 8 countries. Quantitative description analysis (QDA) and a flavor wheel were used to analyze their sensory characteristics. Chemometrics was used to screen the phytochemical components that significantly contribute to the taste of Oolong tea. We preliminarily obtained 35 sensory characteristic descriptors and constructed a flavor wheel for Oolong tea. We found that Oolong tea in each region has unique sensory quality characteristics. The content of thirteen phytochemical components of Oolong tea in different regions widely varied, and the average coefficient of variation was 45.56%. Among of them, we found the largest difference in free amino acids. We identified the relationship between taste sub-attributes, and the thirteen phytochemical components was found through correlation analysis. Finally, we selected phytochemical components with significant effects on five taste sub-attributes that were selected from the thirteen detected phytochemical components. The construction of the Oolong tea flavor wheel can help realize the qualitative and quantitative sensory evaluation of Oolong tea from different origins and contribute to the quality identification and directional improvement of Oolong tea products.
1. Introduction
Tea (Camellia sinensis) plants are important horticultural plants that are widely grown in China, Japan, India, Sri Lanka, Kenya, Tanzania, and Argentina [1]. Tea is made from the leaves of tea plants and is the second most popular beverage in the world after water [2]. Oolong tea, a semi-fermented tea, was first produced in the early Song Dynasty (960–1279) and originated from the Fujian, Guangdong, and Taiwan provinces of China [2,3]. Different from green and black teas, traditional Oolong tea tastes mellow and refreshing, with an elegant fruity and floral fragrance, and enjoys wide popularity all over the world [4,5]. In the past few decades, the output and consumption of Oolong tea in the world has been increasing, and it is being increasingly produced in various countries, such as Japan, Sri Lanka, Myanmar, Thailand, and South Korea [6,7]. The special aroma and taste of tea are largely determined by its geographical and natural conditions, including growing regions, tea varieties, cultivation methods, and processing techniques [8]. Therefore, most famous teas in the world are named after regions, such as Anxi Tieguanyin, Wuyi rock tea, Xihu Longjing, Dongting Biluochun, Assam black tea, and Dajiling black tea [9]. There are great differences in the quality characteristics of Oolong tea in different regions [10]. Tea flavor experts are often asked some questions about the quality characteristics and flavor formation mechanism of Oolong tea from different regions: What are the quality differences of Oolong tea between Fujian, Guangdong, and Taiwan? What is the difference between China, Japan, and Sri Lankan Oolong tea? What words do we use to describe the taste of Oolong tea? What chemical substance is responsible for the heavy and thick or mellow flavor of Oolong tea? These answers to these questions are still unclear. As such, we must conduct an in-depth analysis of the sensory and phytochemical characteristics of Oolong tea from different regions.
Quantitative description analysis (QDA) is an effective descriptive sensory analysis method [11]. It can be used to effectively mine the flavor vocabulary of food, determine its sensory flavor characteristics, and compare the differences in sensory characteristics between foods [11]. A flavor wheel is a visual and practical tool that can be used to describe different flavor characteristics of food. Through the collection, classification, induction, and sorting of specific sensory attribute descriptors, the flavor characteristics of food are formed [12,13]. Combining QDA and the flavor wheel can not only be used to identify the flavor characteristics of food, but also to visualize the flavor. These technologies are widely used in food and tea. The Specialty Coffee Association of America (SCAA) developed the first coffee flavor wheel in 1995. Recently, the SCAA and World Coffee Research (WCR) jointly developed attribute words and mapped a new flavor wheel to further guide the production and improve the flavor of coffee [12]. The Tea Research Institute of Chinese Academy of Agricultural Sciences also constructed the primitive morpheme and flavor wheel of terms of sensory evaluation of Chinese tea [13]. The sensory descriptors and flavor wheel of alcohol [14], vinegar [15], Pu’er tea [16], Fuzhuan brick Tea [17], Huangdacha [18], and green tea [19] have also been successfully established. However, research on the flavor wheel of Oolong tea in different regions is still lacking. This is not conducive to us to distinguish and understand the quality characteristics of Oolong tea from different regions, which limits us to further explore the flavor formation mechanism of Oolong tea.
The taste of tea is the comprehensive effect of human sensory gustation from water-soluble substances in a tea infusion [20]. The main flavor components are divided into polyphenols, alkaloids, amino acids, carbohydrates, etc., which have different flavor characteristics due to their different compositions, contents and threshold values [20]. Tea polyphenols, catechins, caffeine, and free amino acids are considered to be the important chemical components affecting the taste intensity of Oolong tea [3]. Free amino acids, theanine, and total catechins are significantly correlated with the taste score of Oolong tea [21,22]. Five catechins and catechin gallates, i.e., catechin (C), epicatechin (EC), epigallocatechin (EGC), epigallocatechin gallate (ECG), and epigallocatechin gallate (EGCG), are the major phenolic compounds in Oolong tea [21]. Theanine is the main component of free amino acids [11]. These chemical components affect the taste score in the sensory evaluation of Oolong tea [21,22]. However, whether differences exist in these important chemical components in Oolong tea from different regions around the world and the contribution of these components to the taste sub-attributes of Oolong tea have not been reported. Understanding the contribution of chemical components to taste sub-attributes is very important for the quality control and improvement of Oolong tea products.
Based on this, in this study we used a combination of QDA and the flavor wheel to analyze the quality characteristics of Oolong tea from 15 regions of 8 countries for the first time. Correlation analysis, Dose-over-Threshold (DoT), and partial least square-variable import project (PLS-VIP) were used to screen compounds with important contributions to flavor properties. Our two purposes in this study were to (1) construct the flavor wheel of Oolong tea and clarify the sensory quality characteristics of Oolong tea from different regions and (2) clarify the contribution of thirteen phytochemical components, such as tea polyphenols, catechins, caffeine, and free amino acids, to the taste sub-attributes of Oolong tea. This work will help us to accurately describe and distinguish the quality characteristics of Oolong tea from different origins, and to understand the phytochemical components that have an important contribution to the taste sub-attributes of Oolong tea, so as to provide a reference for the quality improvement and directional regulation of Oolong tea products.
2. Materials and Methods
2.1. Experimental Materials
We collected 171 samples of Oolong tea from 17 regions in 8 countries. Samples from 8 regions in China including different varieties and grades were produced by different manufacturers. We purchased samples from Japan, Sri Lanka, Myanmar, Australia, Germany, Korea, and Thailand from different brands and different types sold in local markets. The sample details are shown in Table S1 in the Supplementary Materials. To prevent changes in the quality and chemical composition of the samples, they were stored in a refrigerator at −80 °C until use. Because the quality characteristics of some Oolong tea samples collected in the same region were relatively similar, we initially evaluated the appearance, infusion color, taste, and aroma of the samples by referring to GB/T 23776–2018 [23]. We excluded samples with similar quality characteristics in the same region. Representative Oolong tea samples from various regions were screened out for sensory quantitative description analysis and the detection of the thirteen phytochemical components. A total of 66 regional representative samples were finally obtained, including 7 from southern Fujian, 8 from northern Fujian, 5 from western Fujian, 8 from Guangdong, 6 from Taiwan, 1 from Hubei, 5 from Zhejiang, 3 from Sichuan, 5 from Japan, 2 from Sri Lanka, 5 from Myanmar, 2 from Australia, 4 from Germany, 2 from Korea, and 3 from Thailand (Table 1, Table S1).

Table 1.
Origin and quantity of Oolong tea samples.
Standards of caffeine (CAF > 99%), catechin (C > 99%), epicatechin (EC > 99%), epigallocatechin (EGC > 99%), epigallocatechin gallate (ECG > 99%), epigallocatechin gallate (EGCG > 99%), theanine (> 99%), glutamic acid (> 99%), and gallic acid (GA > 99%) were purchased from Sigma-Aldrich (Saint Louis, MO, USA).
2.2. Experimental Method
2.2.1. Quantitative Description Analysis (QDA)
We first established a sensory evaluation team: according to the requirements of GB/T 16291.1–2012 (GB/T: national standards of people’s republic of China) [24], five evaluators were selected from the tea science teacher team of Fujian Agriculture and Forestry University based on time, interest, and description ability. The members of the sensory evaluation team had participated in many sensory evaluation experiments for teas such as black, white, and Oolong teas, and all had more than 10 years of experience in tea sensory evaluation.
For descriptor generation and sensory evaluation, the sensory characteristics of Oolong tea were evaluated by referring to the evaluation procedures and requirements of GB/T 23776–2018 (covered-bowl method) [23]. Sensory analysis was performed in the Tea Sensory Evaluation Laboratory of the Horticulture Science and Technology Building, Fujian Agriculture and Forestry University. Samples of 100–200 g were placed in the tea evaluation tray, and the evaluators evaluated the appearance by turning the tea and changing its position. Samples of 5.0 g were weighed and placed in a covered 110 mL bowl; then we filled the bowl with boiling water and capped the bowl. After soaking the samples for 1 min, we opened the lid, and the aroma of tea was evaluated. After soaking for 2 min, we drained the tea infusion into the evaluation bowl for the color to be appraised and the infusion to be tasted. Then, we made the tea for the second brewing, covered it, soaked it for 1–2 min, opened the lid, and the aroma of tea was evaluated. After soaking for 3 min, we drained the tea soup infusion into the evaluation bowl, and the color and taste of the infusion were evaluated. We then made the tea for the third brewing, covered it, and the aroma was evaluated after 2–3 min. Then we drained the tea infusion into the evaluation bowl after 5 min for the evaluation of the color and taste of the infusion. Finally, the evaluators smelled the aroma of the leaves. The evaluators independently described the appearance of dry tea; the color, aroma, and taste characteristics of tea infusion; and we recorded all evaluator’s descriptors. After that, we preliminarily screened the descriptive words and retained the descriptive words used more than 80% of the time. All evaluators discussed and screened descriptors in combination with GB/T 14487–2017 [25] and references [9,10,13,21]. Finally, the descriptors and sensory quality characteristics of Oolong tea samples from different regions were obtained. Every sample was randomly evaluated three times.
For taste sub-attributes evaluation, the method of preparing the method of tea infusion was the same as that mentioned above. The evaluators evaluated the bitterness, astringency, umami, sweet aftertaste, and “heavy and thick” of the tea infusion of all samples. A 0–5 strength scale standard was adopted, where 0 = none and 5 = very. Every sample was randomly evaluated three times.
2.2.2. Quantification of Phytochemical Components
The water content of dry tea was determined by the weight loss method according to ISO 1573: 1980 [26]. Briefly, 5.0 ± 0.001 g of the ground tea sample was put in a prepared weighing bottle and then dried at the bottle at 103 °C for 6 h, which was then cooled in a desiccator and weighed to the nearest 0.005 g. The water extract content was determined by the differential method according to ISO 9768: 1998 [27] with modifications. Briefly, 2.0 ± 0.001 g of the ground tea sample was put in a conical flask, and 300 mL of boiling water was added. After 45 min of brewing, the tea infusion was filtered under a vacuum, and tea residue was dried at 103°C for 16 h. Afterward, the tea residue was cooled in a desiccator and weighed to the nearest 0.001 g. Three biological replicates were performed of the water content and water extract content of every sample.
The tea polyphenols content was determined by Folin-Ciocalteu phenol colorimetry according to ISO 14502.1: 2005 [28]. Briefly, gallic acid was used as a standard. 0.2 ± 0.001 g of the ground tea sample was put into 10 mL centrifuge tube, and then 5 mL of 70% methanol preheated at 70 °C was added. After extraction for 30 min in a 70 °C water bath, the extracting solution was put in a centrifuge. We repeated this procedure once. We combined and fixed the extract to 10 mL. Then, 1 mL of the extract was transferred and fixed to 100 mL. Subsequently, 1 mL of the extract was drawn into a 10 mL calibration tube, 5 mL of 10% Folin-Ciocalteu was added, and after reacting for 3–8 min, 4 mL of 7.5% Na2CO3 was added. After waiting 60 min, the absorbance was determined at 765 nm using a TU-1810PC UV-Vis spectrophotometer (Puxi General Instrument Co., Ltd., Beijing, BJ, China) Three biological replicates were performed for every sample.
The catechins (ECG, C, EGC, EGCG, and EC) and caffeine contents were determined using a Waters 2695 high performance liquid chromatograph (HPLC) (Waters, Milford, MA, USA) according to ISO 14502.1: 2005 [29] with modifications. The method we used for extraction of the tea samples was the same as that used for tea polyphenols. The chromatographic conditions were as follows: 2998 PDA detector (Waters, Milford, MA, USA); X-select-T3 chromatographic column 4.6 mm × 250 mm × 5 μm (Waters, Milford, MA, USA); mobile phase A: 2% formic acid solution; mobile phase B: pure methanol. The gradient change of the mobile phase A was as follows: 0–9 min, 83–73%; 9–15 min, 73–58%; 15–18 min, 58–83%. The flow rate was 1 mL/min; column temperature was 35 °C; injection volume was 10 μL; and UV detection was performed at 278 nm. The ester catechin content was calculated as ECG content + EGCG content, the simple catechin content was calculated as EGC content + C content + EC content, and the total catechin content was calculated as ester catechin content + simple catechin content. Three biological replicates were performed for each sample.
The theanine content was determined by Waters 2695 HPLC (Waters, Milford, MA, USA) according to GB/T 23193-2017 [30]. Briefly, 1.0 ± 0.001 g of the ground tea sample was put in a 200 mL beaker, and then 100 mL of boiling water was added. After extracting for 30 min in 100 °C water bath, we filtered and fixed the sample to a volume in a 100 mL volumetric flask and filtered the sample through a 0.45 μm aperture polyethersulfone filter membrane (Jinteng Co., Ltd., Tianjin, TJ, China) and removed 1 mL for HPLC analysis. The chromatographic conditions were as follows: the chromatographic column was an AccQ·Tag amino acid special analytical chromatographic column 3.9 mm × 150 mm (Waters, Milford, MA, USA); mobile phase A: 100% pure water; mobile phase B: 100% acetonitrile. The gradient change of mobile phase A was 0–10 min, 100%; 10–12 min, 100–20%; 12–20 min, 20%; 20–22 min, 20–100%; 22–40 min, 100%. The injection volume was 10 μL; the column temperature was 35 °C, and the flow rate was 1 mL/min; and the detection wavelength was 210 nm. Three biological replicates were performed for every sample.
The free amino acids content was determined by the ninhydrin colorimetric method according to GB/T 8314-2013 [31]. Glutamic acid was used as a standard. Then, 1.0 ± 0.001 g of the ground tea sample was put into a 500 mL beaker, and then 300 mL of boiling water was added. After extracting for 20 min in a 100 °C water bath, the sample was filtered with 15 cm diameter quantitative filter paper (Tezhong Co., Ltd., Hangzhou, HZ, China) and fixed to volume in a 500 mL volumetric flask. After, 1.0 mL of the extracting solution was placed in a 25 mL colorimetric tube, then 0.5 mL pH 8.0 phosphate buffer and 0.5 mL 2% ninhydrin solution were added. After 15 min of being placed in a water bath in boiling water, we fixed the volume to 25 mL after cooling, and the absorbance was detected at 570 nm by a TU-1810pc UV-Vis spectrophotometer (Puxi General Instrument Co., Ltd., Beijing, BJ, China). Three biological replicates were performed for every sample.
2.2.3. Data Statistics and Analysis
The mean, standard deviation, and coefficient of variation of sensory evaluation data and phytochemical components data were calculated using Microsoft Excel 2019. Correlation analysis and heat map analysis were performed by the hiplot tool (https://hiplot.com.cn, accessed 19 December 2021). PLS-VIP analysis was performed using SIMCA 14.0. The DoT value was calculated by the phytochemical component content/phytochemical component threshold.
3. Results and Discussion
3.1. Descriptors and Flavor Wheel of Sensory Quality of Oolong Tea
We used a total of 35 descriptors to identify the sensory quality characteristics of Oolong tea from different regions, and the constructed flavor wheel was shown in Figure 1: 9 for appearance, 7 for infusion color, 7 for aroma, and 12 for taste. The frequency of descriptors of Oolong tea from different regions is shown in Table S2. The most frequently used appearance descriptors were “tight and heavy” (39.4%) and “round and tight” (28.8%). It indicated that the appearance of Oolong tea samples from different regions were mainly “tight and heavy” and “round and tight”. “Orange red” (53%) and “honey yellow” (34.8%) were frequently used as infusion color descriptors, and so were the main color types of Oolong tea infusions from different regions. The most frequently used aroma descriptors were “flowery” (68.2%), “fruity” (39.4%), “clean and refreshing” (39.4%), and “roasted” (31.8%). The aromas of Oolong tea from different regions were relatively diversified, but with nearly 70% of the samples being described as flowery, this was found to be the main aroma type of Oolong tea. The proportions of “fruity”, “clean and refreshing”, and “roasted” were similar, being evenly distributed among the Oolong tea samples. The most frequently used taste descriptors were “astringent” (92.4%), “bitterness” (80.3%), “umami” (51.5%), “mellow and thick” (43.9%), “sweet aftertaste” (42.4%), “heavy and thick” (28.8%), “mellow” (25.8%), and “brisk and smooth” (21.1%). The descriptors obtained in this study include those reported in previous studies [9,21,32]. This finding showed that the descriptors we obtained were representative and extensive and could be used to realize the qualitative and quantitative sensory evaluation of Oolong tea from different regions.
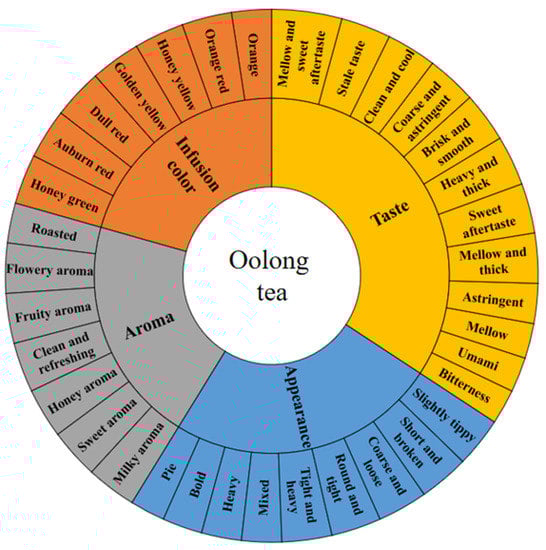
Figure 1.
Flavor wheel of Oolong tea.
3.2. Analysis of Quality Characteristics of Oolong Tea from Different Regions
The quality characteristics of Oolong tea from 15 different regions, as shown in Figure 2 and Table S3, were relatively diversified, and we found that no region had completely consistent quality characteristics was discovered. Southern Fujian, northern Fujian, Guangdong, and Taiwan are the regions with the longest history of Oolong tea production and are the main Oolong tea producers in the world [33]. The Oolong tea is predominantly Tieguanyin tea, Wuyi Rock tea, Fenghuang Dancong tea, and Baozhong tea in the southern Fujian, northern Fujian, Guangdong, and Taiwan, respectively [33]. The quality characteristics of Oolong tea in these four regions were obviously different. Northern Fujian Oolong tea was “tight and heavy”, and its aroma and taste were “flowery-fruity” and “roasted”, and “heavy and hick” with a superior “sweet aftertaste”, respectively. The appearance of Taiwan Oolong tea was mainly “round and tight”, and the taste was “mellow” or “mellow and sweet aftertaste”. Guangdong Oolong tea was mainly strong with a lasting flowery aroma, a taste described as “heavy and thick”, superior “sweet aftertaste”, and “bitter-astringency”. The appearance of Oolong tea in southern Fujian was mainly “round and tight”, the aroma was mainly “clean and refreshing” and “flowery”, and the taste was “mellow” or “mellow and thick” and “umami and brisk”. Cai et al. [9] evaluated the taste and aroma characteristics of Oolong tea from southern Fujian, northern Fujian, Guangdong, and Taiwan and found that the Oolong teas from the four regions have their own taste and aroma characteristics. These conclusions are the same as what we drew. One difference was that we further defined the appearance and infusion color characteristics of Oolong tea from these four regions (Figure 2).
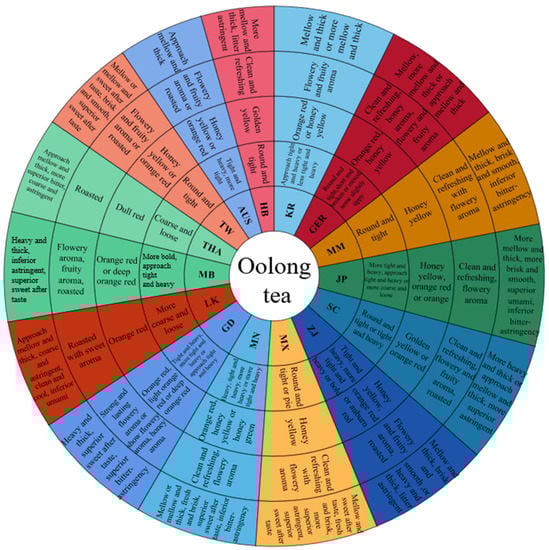
Figure 2.
The quality characteristics of Oolong tea from different regions. From the inside to the outside, the flavor wheel describes the regions, appearance, infusion color, aroma, and taste of Oolong tea. MN, southern Fujian, China; MB, northern Fujian, China; MX, western Fujian, China; GD, Guangdong, China; TW, Taiwan, China; HB, Hubei, China; ZJ, Zhejiang, China; SC, Sichuan, China; JP, Japan; LK, Sri Lanka; MM, Myanmar; AUS, Australia; GER, Germany; KR, Korea; THA, Thailand.
Western Fujian, Zhejiang, Hubei, and Sichuan Oolong tea are increasing in popularity. Due to the different geographical environments and tea varieties, the teas show quality differences. For example, the appearance of some Oolong tea in western Fujian was pie, the infusion color was golden yellow, and the taste was mainly “mellow and sweet aftertaste” and “umami and brisk”. The taste of Zhejiang Oolong tea was described as “mellow and thick”, “smooth and brisk”, or “heavy and thick”; the aroma of Hubei Oolong tea was “clean and refreshing”. Sichuan Oolong tea was more diversified, having varied appearances and aromas: a “round and tight” and “tight and heavy” in appearance and a “clean and refreshing”, “flowery and fruity”, and “roasted” aroma.
Japan, Myanmar, Sri Lanka, Germany, Australia, Korea, and Thailand Oolong teas have appeared in recent years [34]. Oolong tea is locally produced in Japan, Myanmar, Sri Lanka, South Korea, and Thailand [34]. The Oolong tea in Germany and Australia is mainly imported from abroad, and then different types of deep processing applied are carried out to adapt to the flavor for local people [35]. Japan and Myanmar Oolong teas were similar in aroma and taste. The difference was that Japan Oolong tea had a stronger heavy and thick taste. In appearance, Myanmar Oolong tea was “round and tight”, whereas Japan’s was “tight and heavy” or “coarse and loose”. The appearance of Oolong tea sold in the German market was “round and tight”, “short and broken”, or “mixed”, some with tea trichome. Oolong tea sold in Australia market was “flowery and fruity” or “roasted”. Sri Lanka Oolong tea was characterized by a “sweet” aroma and “clean and cool” taste. The aroma of Korean Oolong tea was “flowery and fruity”, and the taste was “mellow and thick”. The sensory characteristics of Thailand Oolong tea included a dull red infusion color and roasted aroma.
3.3. Profile Analysis of Phytochemical Components of Oolong Tea from Different Regions
The average coefficient of variation of the phytochemical components of Oolong tea from the different regions was 45.56% (Figure 3a), which indicated wide differences between Oolong tea samples. Their coefficients of variation from high to low were theanine > free amino acids > ECG > C > EGC > EGCG > ester catechins > simple catechins > EC > total catechins > caffeine > tea polyphenols > water extract. Free amino acids (including theanine) were the most different in the Oolong tea from different regions: their content ranged from 0.41% to 5.39%, and that of theanine was 0.04% to 3.60%. Catechins varied widely between different regions: the content of ester catechins was higher than that of simple catechins, and the content of total catechins was 0.90–12.84%. The differences in the caffeine and tea polyphenols contents in samples from different regions were medium in range. The caffeine content was 1.45–4.36%, and that of tea polyphenols was 6.78–23.18%. The difference in water extract content was the smallest, ranging from 36.59% to 52.67% (Table S4). Previously, researchers compared the differences in the chemical constituent contents of Oolong teas from Fujian, Guangdong, and Taiwan in China and found that the coefficient of variation of the contents of theanine and free amino acids were greater than 50%, and those of water extract, tea polyphenols, total catechins, and caffeine were less than 50% [21,36]. In this study, we found the same law in Oolong tea samples from eight different countries. The free amino acids content in Oolong tea from different regions varied the most. In this study, the coefficient of variation of catechins (ECG, C, EGC, and EGCG) was close to or greater than 50%, indicating large differences. The baking process of Oolong tea promotes the degradation of theanine and produces pyrazine substances, which produce a roasted aroma [37]. The difference in catechins is related to the tea plant variety and the degree of fermentation during processing. With the increase in fermentation time, the catechins content gradually decreases, especially that of ester catechins [38,39]. Therefore, the variety and processing technology may be the reasons for the wide differences in the contents of free amino acids and catechins in Oolong tea. The differences in these phytochemical components led to diversified taste characteristics of Oolong tea.
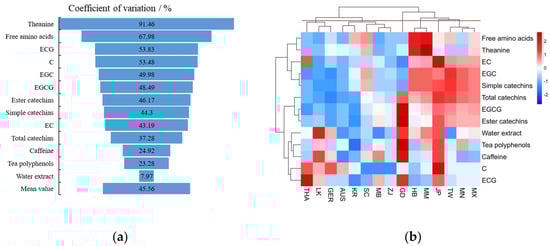
Figure 3.
Coefficient of variation (a) and heat map analysis (b) of phytochemical components of Oolong tea from different regions. (b) Red indicates high content and green indicates low content. MN, southern Fujian, China; MB, northern Fujian, China; MX, western Fujian, China; GD, Guangdong, China; TW, Taiwan, China; HB, Hubei, China; ZJ, Zhejiang, China; SC, Sichuan, China; JP, Japan; LK, Sri Lanka; MM, Myanmar; AUS, Australia; GER, Germany; KR, Korea; THA, Thailand.
From a heat map analysis of the phytochemical components of Oolong tea from different regions, we found that samples could be divided into six categories (Figure 3b). The first category included Oolong tea from Thailand, Sri Lanka, and Germany, which had a higher content of C and the lowest contents of total catechins, ester catechins, and free amino acids. The second category included Oolong tea from Australia, Korea, Sichuan, northern Fujian, and Zhejiang, which had medium contents of free amino acids, catechins, and tea polyphenols. The third category was Oolong tea from Guangdong, which had the highest contents of total catechins, ester catechins, tea polyphenols, and caffeine. The fourth category included Oolong tea from Hubei and Myanmar, which had the highest content of free amino acids and a high content of simple catechins. The fifth category was Japanese Oolong tea, which had the highest contents of EC and C and higher contents of other substances. The sixth category was Oolong tea from Taiwan, southern Fujian, and western Fujian, which had a higher content of catechins.
3.4. Correlation Analysis between Taste Sub-Attributes and Thirteen Phytochemical Components of Oolong Tea
The correlation analysis between sensory taste sub-attributes intensity and phytochemical components of Oolong tea from different regions (Figure 4) showed that “heavy and thick” was significantly positively correlated with “bitterness” and “sweet aftertaste” (p < 0.05). “Astringency” was positively correlated with “bitterness” and negatively correlated with “umami”. We found a significant positive correlation between “sweet aftertaste” and “umami”.
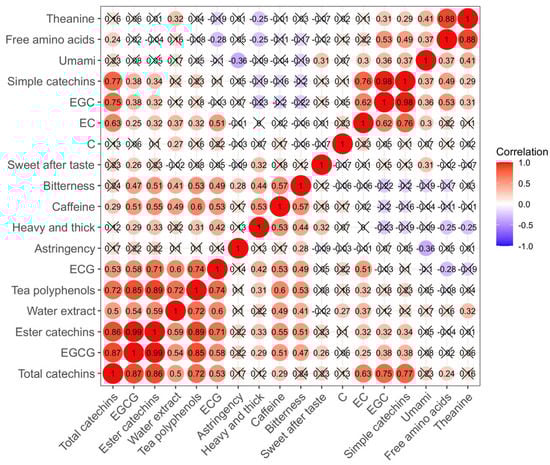
Figure 4.
Correlation between taste sub-attributes and phytochemical compositions of Oolong tea. × indicates that the correlation is not significant at the level of p < 0.05. The numbers indicate the correlation coefficient, where positive numbers indicate positive correlation and negative numbers indicate negative correlation. Red indicates positive correlation, and blue indicates negative correlation.
Caffeine, ECG, ester catechins, tea polyphenols, and EGCG were significantly positively correlated with “heavy and thick”, while free amino acids and theanine were significantly negatively correlated with it. Free amino acids, theanine, EGC, EC, and simple catechins were significantly positively correlated with “umami”. EGCG was significantly positively correlated with “sweet aftertaste”. Caffeine, tea polyphenols, EGCG, ECG, ester catechins, and water extract were significantly positively correlated with “bitterness”. All chemical components were correlated with “astringency”, but a significant level was not reached (p < 0.05). However, “astringency” was significantly correlated with “bitterness” and negatively correlated with “umami”. Therefore, chemical components that have an important impact on bitterness and umami affect the astringency of Oolong tea.
Correlation analysis only provided a preliminary judgment of the relationship between phytochemical components and taste sub-attributes. To understand the contribution of phytochemical components to taste sub-attributes, we performed a further comprehensive analysis by combining PLS-VIP and DoT.
3.5. Contribution of Thirteen Phytochemical Components to Taste Sub-Attributes of Oolong Tea
PLS-VIP can be used to decompose and reduce the dimensions of a huge data system and identify independent variables that have a strong impact on dependent variables among complex data variables. It can effectively avoid the interference of multicollinearity between independent variables [11]. We conducted PLS-VIP analysis with thirteen phytochemical components as the independent variable X and taste sensory sub-attributes as dependent variable Y. In this analysis, the phytochemical components with VIP > 1 were considered to provide an important contribution to each taste sub-attribute. The PLS-VIP results are shown in Figure 5. DoT comprehensively considers the contents and threshold value of taste components in tea: it is a method used to evaluate the importance of the contribution of flavor compounds to tea taste. The flavor compounds with DoT > 1 strongly contribute to the taste of tea infusions [40]. The DoT results are shown in Table S5.
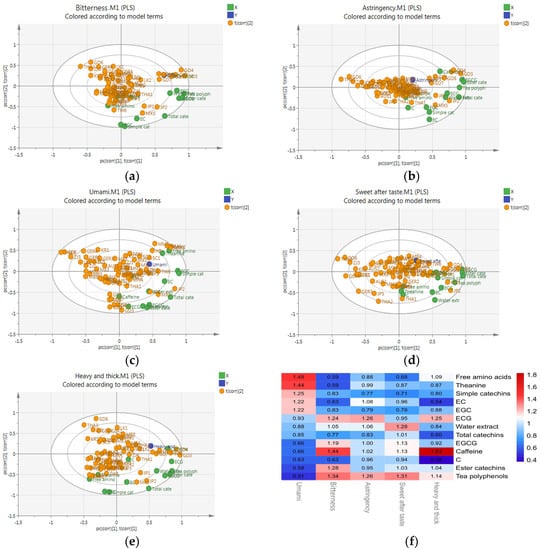
Figure 5.
The contribution of phytochemical components to taste sub-attributes of Oolong tea. PLS-VIP load diagram of (a) bitterness; (b) astringency; (c) umami; (d) sweet aftertaste; and (e) heavy and thick. (f) VIP value of each phytochemical component for five taste sub-attributes. (a) to (e), X (green) indicates the phytochemical composition, Y (blue) indicates the taste powder attribute, and t(corr) [2] (yellow) indicates each Oolong tea sample. (f) Red and blue indicate that the VIP value of phytochemical components is large and small, respectively.
3.5.1. Bitterness
Bitterness is one of the basic tastes [41]. We found that six phytochemical components contributed importantly to the bitterness of Oolong tea (Figure 5a,f): caffeine, tea polyphenols, ester catechins, ECG, EGCG, and water extract. This conclusion was exactly the same as the result of correlation analysis (Figure 4). The taste characteristic of caffeine is bitterness, which has a significant positive correlation with the bitterness intensity of tea infusion [40]. The VIP and mean DoT of caffeine in this study were 1.44 and 2.51, respectively, indicating that caffeine had an important contribution to the bitterness of Oolong tea. The taste characteristics of tea polyphenols, ester catechins, ECG, and EGCG can also be described as bitter [42]. In this study, these components substantially contributed to the bitterness of Oolong tea. The mean DoT of EGCG was greater than one in all samples, and the mean DoT of ECG was greater than one in some samples (Table S5). Both EGCG and ECG are ester catechins, which are also the main components of tea polyphenols [41]. Caffeine and tea polyphenols contribute to the bitterness of green tea [43], yellow tea [20], and black tea [11]: however, caffeine contributes the most to the bitterness of black tea, and EGCG contributes the most to the bitterness of green tea [11,43]. Our findings showed that caffeine contributed the most to the bitterness of Oolong tea. The reason for this difference might be that black tea and Oolong tea are fermented teas, whereas green tea is not fermented. In the fermentation process, ester catechins such as EGCG are degraded more, and caffeine is more stable. Therefore, some differences exist in the contribution to bitterness among different teas. In addition, flavonoids and their glycosides and anthocyanins and their glycosides can also be described as bitter [40], which may have an important impact on the bitterness of Oolong tea.
3.5.2. Astringency
Astringency is the sensation on the surface of the mouth and tongue that includes dryness, roughness, tension, and tearing [41]. Six phytochemical components significantly contributed to the astringency of Oolong tea in this study (Figure 5b,f): ECG, tea polyphenols, EC, water extract, caffeine, and EGCG. Correlation analysis showed that astringency was significantly correlated with bitterness (Figure 4), suggesting that they were promoted by similar promotion factors. Tea polyphenols, ECG, EC, and EGCG are heterogeneous compounds, producing both astringency and bitterness. The relationship between catechins, tea polyphenols, and bitterness is a quadratic curve. Bitterness and astringency also synergistically enhance each other [44]. Caffeine has no astringency, but it can significantly improve the astringency intensity of catechin, and this enhancement effect increases with caffeine concentration [45]. Theaflavins, flavonols and their glycosides, and phenolic acids can be described as astringent [42], and they may have some influence on the astringency of Oolong tea.
3.5.3. Umami
Umami is one of the basic tastes. We found five phytochemical components that significantly contributed to the umami of Oolong tea (Figure 5c,f): free amino acids, theanine, simple catechins, EC, and EGC. This conclusion is exactly the same as the result of correlation analysis (Figure 4). The overall taste of free amino acids in tea is umami and sweet, which is including theanine, glutamate, and aspartic acid. Glutamate is an important contributor to the taste of tea infusions [42]. Theanine is a monomer amino acid with a high content in tea plants, but its threshold to express umami is very high. Therefore, its DoT value is very low (DoT = 0.1 in Oolong tea, in this study) [11]. Therefore, people cannot sense umami-sweetness given the concentration of theanine in tea infusions. The contribution of theanine to umami is mainly reflected in the synergistic effect with other umami substances [46]. EC and EGC are simple catechins with a bitter taste. In this study, EC and EGC were positively correlated with the umami of Oolong tea. EC is positively correlated with the umami of green tea, whereas EGC is significantly negatively correlated with green tea umami [47]. Phenols can be complexed with caffeine and free amino acids to produce an umami and briskness [48]. Therefore, we inferred that simple catechins and umami in Oolong tea were positively correlated, which might have been caused by their complexation or interaction with other substances, but the specific reasons need to be further studied. Glutamate, aspartic acid, proline, alanine, and serine in free amino acids also impact the umami of tea [42], and they may provide an important contribution to the umami of Oolong tea.
3.5.4. Sweet Aftertaste
Sweet aftertaste is the comprehensive effect of various taste sub-attributes [42]. We identified six phytochemical components that provided important contributions to the sweet aftertaste of Oolong tea (Figure 5d,f): tea polyphenols, water extract, caffeine, EGCG, ester catechins, and total catechins. Water extract is the sum of water-soluble compounds in tea, which impacts the overall taste of tea infusions. The taste of tea polyphenols, caffeine, EGCG, ester catechins, and total catechins is bitter and astringent [20]. The sweet aftertaste of tea is caused by the activation of the sweet receptor in the taste bud cells by the promoter molecules and the transmission of information to the brain. The usual tastes of these promoter molecules are umami, sweet, bitter, and astringent [49], among which the bitterness and astringent are the key contributors to the sweet aftertaste [50]. In addition to the thirteen phytochemical components tested, other phytochemical components with a bitter and astringent taste may affect the sweet aftertaste of Oolong tea.
3.5.5. Heavy and Thick
Heavy and thick is the sensation of stickiness produced by a tea infusion in the mouth, which is related to the richness of the contents [51]. We identified five phytochemical components that importantly contributed to the heavy and thick sensation of Oolong tea (Figure 5e,f): caffeine, ECG, tea polyphenols, free amino acids, and ester catechins. The correlation analysis revealed a significant positive correlation between heavy and thick, bitterness, and umami (Figure 4), indicating that substances that contributed to bitterness and umami might also contribute to the heavy and thick sensation. Caffeine, ECG, tea polyphenols, and ester catechins are bitter and astringent; free amino acids are umami and sweet. In addition, among the tea flavor compounds, tea polyphenols, ester catechins, and caffeine are the chemical components with the highest content in Oolong tea [20]. These high-content substances play an important role in the heavy and thick strength of Oolong tea infusions. In addition to the thirteen phytochemical components tested, other phytochemical components with a bitter and astringent taste may contribute to the heavy and thick taste of Oolong tea.
In this section, we focused on the contribution of thirteen main phytochemical components of Oolong tea to its five taste sub-attributes. However, Oolong tea contains many non-volatile compounds, and other components affect the taste of Oolong tea, such as gallic acid affecting its sweetness [52], flavonoid glycosides and proanthocyanidins affecting its bitterness and astringency [52], theaflavins affecting its astringency, and soluble sugar affecting its mellowness [3]. Volatile compounds have interactive effects on the taste of tea infusions, e.g., geraniol and β-ionone can improve the sweetness of tea infusion [53]. Therefore, in future research, we will use widely targeted metabolomics to comprehensively analyze the marker compounds of Oolong tea from different origins and combine molecular sensory science to analyze the formation mechanism of the regional characteristic qualities of Oolong tea.
4. Conclusions
In this study, we established the flavor wheel of Oolong tea from different regions for the first time, systematically reported the sensory quality characteristics of Oolong tea from 15 regions of eight countries, and explored the contribution of phytochemical components to its taste sub-attributes. We preliminarily found that the sensory quality of Oolong tea can be characterized using 35 descriptors. The quality characteristics of Oolong tea in 15 regions were found to be diverse. Among the taste sub-attributes, heavy and thick was significantly positively correlated with bitterness and sweet aftertaste. Astringency was positively correlated with bitterness and negatively correlated with umami. We found a significant positive correlation between sweet aftertaste and umami. The phytochemical composition contents of Oolong tea from different regions widely varied. Among them, free amino acids contents showed the largest differences, followed by catechins, then caffeine and tea polyphenols had medium differences, and water extract showed the smallest differences. Based on the cluster analysis of phytochemical components, we clustered the Oolong tea from 15 regions into six categories. Finally, PLS-VIP was used to screen out the components that provided important contributions to the five taste sub-attributes of Oolong tea from the detected 13 phytochemical components. In the production process of Oolong tea, appropriate processes can be adopted to improve the content of phytochemical components that make an important contribution to its umami, sweet aftertaste, and heavy and thick and reduce the content of chemical components that make an important contribution to bitterness and astringency so as to produce Oolong tea products that consumers prefer more.
The flavor wheel in this study was the first flavor wheel of Oolong tea from different regions, which was preliminarily established on the basis of existing Oolong tea products. With the continuous improvement in the quality of Oolong tea products from different regions and the enrichment of categories, our findings need to be explored and supplemented in the future to ensure the richness and comprehensiveness of the flavor wheel of Oolong tea from different regions. In addition, the focus of this study was to analyze the contribution of the 13 phytochemical components to the taste sub-attributes of Oolong tea, but we did not comprehensively detect all their non-volatile compounds. Therefore, it is necessary to further include the metabolomics method to screen more chemical components that provide important contributions to the taste of Oolong tea.
Supplementary Materials
The data presented in this study are available within the manuscript and the Supplementary Materials. The following supporting information can be downloaded at: https://www.mdpi.com/article/10.3390/horticulturae8040278/s1 Table S1: Information of Oolong tea samples in different regions; Table S2: The frequency of use of descriptors in Oolong tea in different regions; Table S3: The quality characteristics of Oolong tea in different regions; Table S4: Contents of phytochemical components in Oolong tea from different regions (mean ± SD); Table S5: DoT of phytochemical components of Oolong tea in different regions.
Author Contributions
Conceptualization, W.S. and Z.C.; methodology, Z.W. and S.G.; software, Z.W.; validation, W.S. and Z.C.; formal analysis, W.S. and Z.C.; investigation, Z.W. and S.G.; resources, Z.W. and S.G.; data curation, Z.W.; writing—original draft preparation Z.W.; writing—review and editing W.S. and Z.C.; visualization, Z.W.; supervision W.S.; project administration, W.S.; funding acquisition, W.S. and Z.C. All authors have read and agreed to the published version of the manuscript.
Funding
This work was supported by the Special Project of National Key R&D Plan (2018YFF0214203), the Fujian Agriculture and Forestry University Construction Project for Technological Innovation and Service System of Tea Industry Chain (K1520005A04), and the Special Project of National Key R&D Plan (2019YFD1001601).
Institutional Review Board Statement
Not applicable.
Informed Consent Statement
Not applicable.
Data Availability Statement
The data presented in this study are available within the manuscript and the Supplementary Materials (Tables S1–S5).
Conflicts of Interest
The authors declare no conflict of interest.
References
- Dai, Z.; Huang, H.; Zhang, Q.; Bei, J.; Chen, Z.; Liu, Q.; Gao, J.; Zhang, S.; Liu, J. Comparative multi-omics of tender shoots from a novel evergrowing tea cultivar provide insight into winter adaptation mechanism. Plant Cell Physiol. 2020, 62, 366–377. [Google Scholar]
- Zeng, L.T.; Zhou, X.C.; Su, X.G.; Yang, Z.Y. Chinese oolong tea: An aromatic beverage produced under multiple stresses. Trends Food Sci. Technol. 2020, 106, 242–253. [Google Scholar]
- Chen, Y.L.; Duan, J.; Jiang, Y.M.; Shi, J.; Peng, L.; Xue, S.; Kakuda, Y. Production, Quality, and Biological Effects of Oolong Tea (Camellia sinensis). Food Rev. Int. 2010, 27, 1–15. [Google Scholar] [CrossRef]
- Wan, X.C. Tea Biochemistry, 3rd ed.; China Agricultural Press: Beijing, China, 2007; p. 248. [Google Scholar]
- Ma, C.Y.; Li, J.X.; Chen, W.; Wang, W.W.; Qi, D.D.; Pang, S.; Mao, A.Q. Study of the aroma formation and transformation during the manufacturing process of oolong tea by solid-phase micro-extraction and gas chromatography–mass spectrometry combined with chemometrics. Food Res. Int. 2018, 108, 413–422. [Google Scholar] [CrossRef] [PubMed]
- Sun, W.J.; Chen, Z.D.; Shang, H. Ten Years of Standardization of Oolong Tea in China. China Tea Process. 2020, 3, 91–92. [Google Scholar]
- Zhu, S.J. Reasons and enlightenment of the rise of “Oolong tea fever” in Japan. Tea Fujian 2018, 5, 2. [Google Scholar]
- Lin, S.-Y.; Lo, L.-C.; Chen, I.-Z.; Chen, P.-A. Effect of shaking process on correlations between catechins and volatiles in oolong tea. J. Food Drug Anal. 2016, 24, 500–507. [Google Scholar] [CrossRef] [Green Version]
- Cai, L.W.; Xu, Y.Q.; Zhou, Y.H. Analysis of sensory quality and chemical composition of Oolong tea in different producing areas. Tea Fujian 2016, 11, 3. [Google Scholar]
- Wang, C.; Lv, S.D.; Wu, Y.S.; Gao, X.M.; Li, J.B.; Zhang, W.R.; Meng, Q.X. Oolong tea made from tea plants from different locations in Yunnan and Fujian, China showed similar aroma but different taste characteristics. SpringerPlus 2016, 5, 576. [Google Scholar] [CrossRef] [Green Version]
- Yue, C.N.; Yang, P.X.; Qin, D.D.; Cai, H.L.; Wang, Z.H.; Li, C.; Wu, H.L. Identification of volatile components and analysis of aroma characteristics of Jiangxi Congou black tea. Int. J. Food Prop. 2020, 23, 2160–2173. [Google Scholar] [CrossRef]
- Spencer, M.; Sage, E.; Velez, M.; Guinard, J.-X. Using Single Free Sorting and Multivariate Exploratory Methods to Design a New Coffee Taster’s Flavor Wheel. J. Food Sci. 2016, 81, S2997–S3005. [Google Scholar] [CrossRef] [PubMed] [Green Version]
- Zhang, Y.B.; Liu, X.; Lu, C.Y. Study on primitive morpheme in sensory terminology and flavor wheel construction of Chinese tea. J. Tea Sci. 2019, 39, 474–483. [Google Scholar]
- Wu, S.; Wen, L.P.; Ye, Z.H.; Cai, S.; Li, Q.H. Construction of flavor wheel of Te-flavor Baijiu and description of typical sensory characteristics. China Brew. 2021, 40, 148–153. [Google Scholar]
- Kong, X.W.; Zhou, Z.L.; Zheng, F.P.; Liu, S.P.; Han, X.; Mao, J. Construction and application of flavor wheel of Chinese brewing vinegar. J. Food Sci. Biotechnol. 2020, 39, 74–80. [Google Scholar]
- Deng, X.; Huang, G.; Tu, Q.; Zhou, H.; Li, Y.; Shi, H.; Wu, X.; Ren, H.; Huang, K.; He, X.; et al. Evolution analysis of flavor-active compounds during artificial fermentation of Pu-erh tea. Food Chem. 2021, 357, 129783. [Google Scholar] [CrossRef] [PubMed]
- Li, H.-H.; Luo, L.-Y.; Wang, J.; Fu, D.-H.; Zeng, L. Lexicon development and quantitative descriptive analysis of Hunan fuzhuan brick tea infusion. Food Res. Int. 2019, 120, 275–284. [Google Scholar] [CrossRef]
- Dai, Q.Y.; Ye, Y.J.; An, Q.; Zheng, F.L.; Xiao, M.J.; Xiao, M.X.; Wang, H.Q.; Zhang, H.W. Sensory characteristics of yellow large leaf tea by quantitative descriptive analysis and construction of flavor wheel. J. Tea Sci. 2021, 41, 535–544. [Google Scholar]
- Lee, S.M.; Chung, S.-J.; Lee, O.-H.; Lee, H.-S.; Kim, Y.-K.; Kim, K.-O. Development of sample preparation, presentation procedure and sensory descriptive analysis of green tea. J. Sens. Stud. 2008, 23, 450–467. [Google Scholar] [CrossRef]
- Wang, Z.-H.; Yue, C.-N.; Tong, H.-R. Analysis of taste characteristics and identification of key chemical components of fifteen Chinese yellow tea samples. J. Food Sci. Technol. 2021, 58, 1378–1388. [Google Scholar] [CrossRef]
- Wang, K.B.; Liu, F.; Liu, Z.H.; Huang, J.A.; Xu, Z.X.; Li, Y.H.; Chen, J.H.; Gong, Y.S.; Yang, X.H. Analysis of chemical components in oolong tea in relation to perceived quality. Int. J. Food Sci. Technol. 2010, 45, 913–920. [Google Scholar]
- Liu, H.; Zhang, Y.; Fan, Y.H.; Zhang, Q.P.; Luo, Z.G. Simultaneous identification of Oolong tea juice tastes by principal component analysis and ultra-high performance liquid chromatography. Beverage Ind. 2013, 16, 25–31. [Google Scholar]
- GB/T 23776-2018; Methodology of Sensory Evaluation of Tea. Standardization Administration of the People’s Republic of China: Beijing, China, 2018.
- GB/T 16291.1-2012; Sensory Analysis—General Guidance for the Selection, Training and Monitoring of Assessors—Part 1: Selected Assessors. Standardization Administration of the People’s Republic of China: Beijing, China, 2012.
- GB/T 14487-2017; Tea Vocabulary for Sensory Evaluation. Standardization Administration of the People’s Republic of China: Beijing, China, 2017.
- ISO 1573:1980; Tea—Determination of Loss in Mass at 103 °C. International Organization for Standardization: Geneva, Switzerland, 1980.
- ISO 9768:1998; Tea—Determination Water Extracts Content. International Organization for Standardization: Geneva, Switzerland, 1998.
- ISO 14502.1:2005; Determination of Substances Characteristic of Green and Black Tea—Part 1: Content of Total Polyphenols in Tea Col-Orimetric Method Using Folin-Ciocalteu Reagent. International Organization for Standardization: Geneva, Switzerland, 2005.
- ISO 14502.1:2005; Determination of Substances Characteristic of Green and Black Tea—Part 2: Content of Catechins in Green Tea—Method using High-Performance Liquid Chromatography. International Organization for Standardization: Geneva, Switzerland, 2005.
- GB/T 23193-2017; Determination of Theanine in Tea—Using High-Performance Liquid Chromatography. Standardization Administration of the People’s Republic of China: Beijing, China, 2017.
- GB/T 8314-2013; Tea—Determination of Free Amino Acids Content. Standardization Administration of the People’s Republic of China: Beijing, China, 2013.
- Ji, W.B.; Liu, P.P.; Xu, Y.Q.; Jiang, Y.W.; Chen, J.X.; Yin, J.F. Comparative study of the aroma components of several Oolong teas. J. Tea Sci. 2016, 36, 523–530. [Google Scholar]
- Lv, S.D.; Wu, Y.S.; Jiang, Y.F.; Meng, Q.X. Comparative analysis of aroma characteristics of Oolong tea from different geographical regions. Food Sci. 2014, 35, 146–153. [Google Scholar]
- Liu, X.B. The first Zhuang Wanfang Tea Science Forum and International Symposium on Oolong tea innovation in 2017. Int. Acad. Dev. 2018, 3, 46–47. [Google Scholar]
- Cheng, J.B. Australia—A young market where traditional tea and mixed tea coexist. Tea World 2020, 5, 14–15. [Google Scholar]
- Jin, Y.S.; Zheng, J.G.; Yang, J.F.; Sun, W.J. Difference analysis of biochemical quality of Tieguanyin from different producing areas. Jiangsu Agric. Sci. 2013, 41, 325–327. [Google Scholar]
- Guo, X.Y.; Song, C.K.; Ho, C.-T.; Wan, X.C. Contribution of L-theanine to the formation of 2,5-dimethylpyrazine, a key roasted peanutty flavor in Oolong tea during manufacturing processes. Food Chem. 2018, 263, 18–28. [Google Scholar] [CrossRef]
- Liu, P.P.; Zhong, X.Y.; Xu, Y.Q.; Chen, G.H.; Yin, J.F.; Liu, P. Study on organic acids contents in tea leaves and its extracting characteristics. J. Tea Sci. 2013, 33, 405–410. [Google Scholar]
- Cui, J.L. Contribution of Glycoside Aroma Precursors to Aroma Formation of Oolong Tea and Black Tea; Southwest University: Chongqing, China, 2006. [Google Scholar]
- Scharbert, S.; Hofmann, T. Molecular Definition of Black Tea Taste by Means of Quantitative Studies, Taste Reconstitution, and Omission Experiments. J. Agric. Food Chem. 2005, 53, 5377–5384. [Google Scholar] [CrossRef]
- Tong, H.R.; Jin, X.F.; Gong, X.L. Sensory characteristics of tea polyphenols and it’s effects on astringency of tea. J. Tea Sci. 2006, 2, 79–86. [Google Scholar]
- Yue, C.N.; Wang, Z.H.; Mao, S.H.; Li, X.Y.; Tong, H.R. The main taste substances in tea research progress. Food Res. Dev. 2017, 38, 219–224. [Google Scholar]
- Zhang, Y.N.; Chen, G.S.; Liu, Y.; Xu, Y.Q.; Wang, F.; Chen, J.X.; Yin, J.F. Analysis of the bitter and astringent taste of baked green tea and their chemical contributors. J. Tea Sci. 2015, 35, 377–383. [Google Scholar]
- Shi, Z.P.; Liu, Z.H. Discussion on mathematical model of chemical essence of bitter and astringent taste of summer tea. J. Tea Sci. 1987, 2, 7–12. [Google Scholar]
- Xu, W.P.; Li, D.X.; Zhang, Z.Z.; Tang, Q.; Wan, X.C. The nonlinear regression of bitter and astringency of main compounds in green tea and the application in organoleptic tests. J. Tea Sci. 2010, 30, 399–406. [Google Scholar]
- Kaneko, S.; Kumazawa, K.; Masuda, H.; Henze, A.; Hofmann, T. Molecular and Sensory Studies on the Umami Taste of Japanese Green Tea. J. Agric. Food Chem. 2006, 54, 2688–2694. [Google Scholar] [CrossRef]
- Liu, P.P.; Deng, Y.L.; Yin, J.F.; Zhang, Y.N.; Chen, G.S.; Wang, F.; Chen, J.X.; Yuan, H.B.; Xu, Y.Q. Quantitative analysis of the taste and its correlation research of chemical constitutes of green tea. J. Chin. Inst. Food Sci. Technol. 2014, 14, 173–181. [Google Scholar]
- Chen, M.X.; Guo, Y.L.; Guo, X.N. The research situation of tea color and flavor constituents. J. Food Saf. Qual. 2014, 6, 1818–1823. [Google Scholar]
- Zhong, Z.Y.; Zeng, Z.Z. Molecular mechanism of tea rejuvenate. J. Agric. For. 2014, 63, 91–97. [Google Scholar]
- Yue, C.N.; Qin, D.D.; Cai, H.L.; Wang, Z.H.; Li, C.; Li, Y.S.; Yang, P.X. Taste characteristics and key compounds analysis of Congou black tea in northern Jiangxi province. Food Ferment. Ind. 2021, 47, 260–267. [Google Scholar]
- Mao, S.H. Study on Quality Analysis and Control of Congfu Black Tea Based on Flavor Omics; Southwest University: Chongqing, China, 2018. [Google Scholar]
- Cao, Q.-Q.; Fu, Y.-Q.; Wang, J.-Q.; Zhang, L.; Wang, F.; Yin, J.-F.; Xu, Y.-Q. Sensory and chemical characteristics of Tieguanyin oolong tea after roasting. Food Chem. X 2021, 12, 100178. [Google Scholar] [CrossRef]
- Yu, J.Y.; Liu, Y.; Zhang, S.R.; Luo, L.Y.; Zeng, L. Effect of brewing conditions on phytochemicals and sensory profiles of black tea infusions: A primary study on the effects of geraniol and β-ionone on taste perception of black tea infusions. Food Chem. 2021, 354, 129504. [Google Scholar] [PubMed]
Publisher’s Note: MDPI stays neutral with regard to jurisdictional claims in published maps and institutional affiliations. |
© 2022 by the authors. Licensee MDPI, Basel, Switzerland. This article is an open access article distributed under the terms and conditions of the Creative Commons Attribution (CC BY) license (https://creativecommons.org/licenses/by/4.0/).