
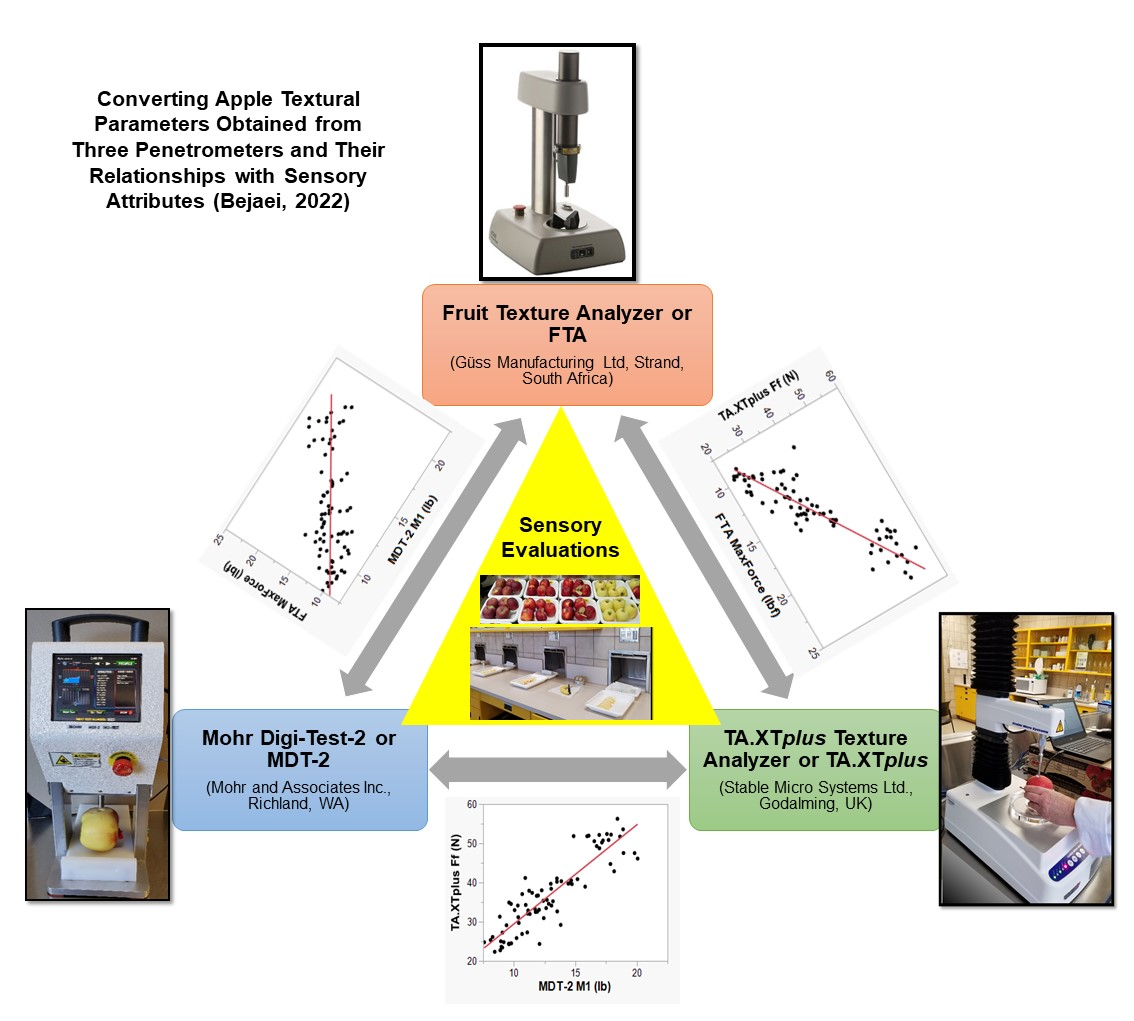
Converting Apple Textural Parameters Obtained from Penetrometers and Their Relationships with Sensory Attributes


Abstract
:
1. Introduction
2. Materials and Methods
2.1. Apple Varieties
2.2. Sensory Assessments
2.3. Instrumental Measurements
2.4. Data Analysis
3. Results and Discussion
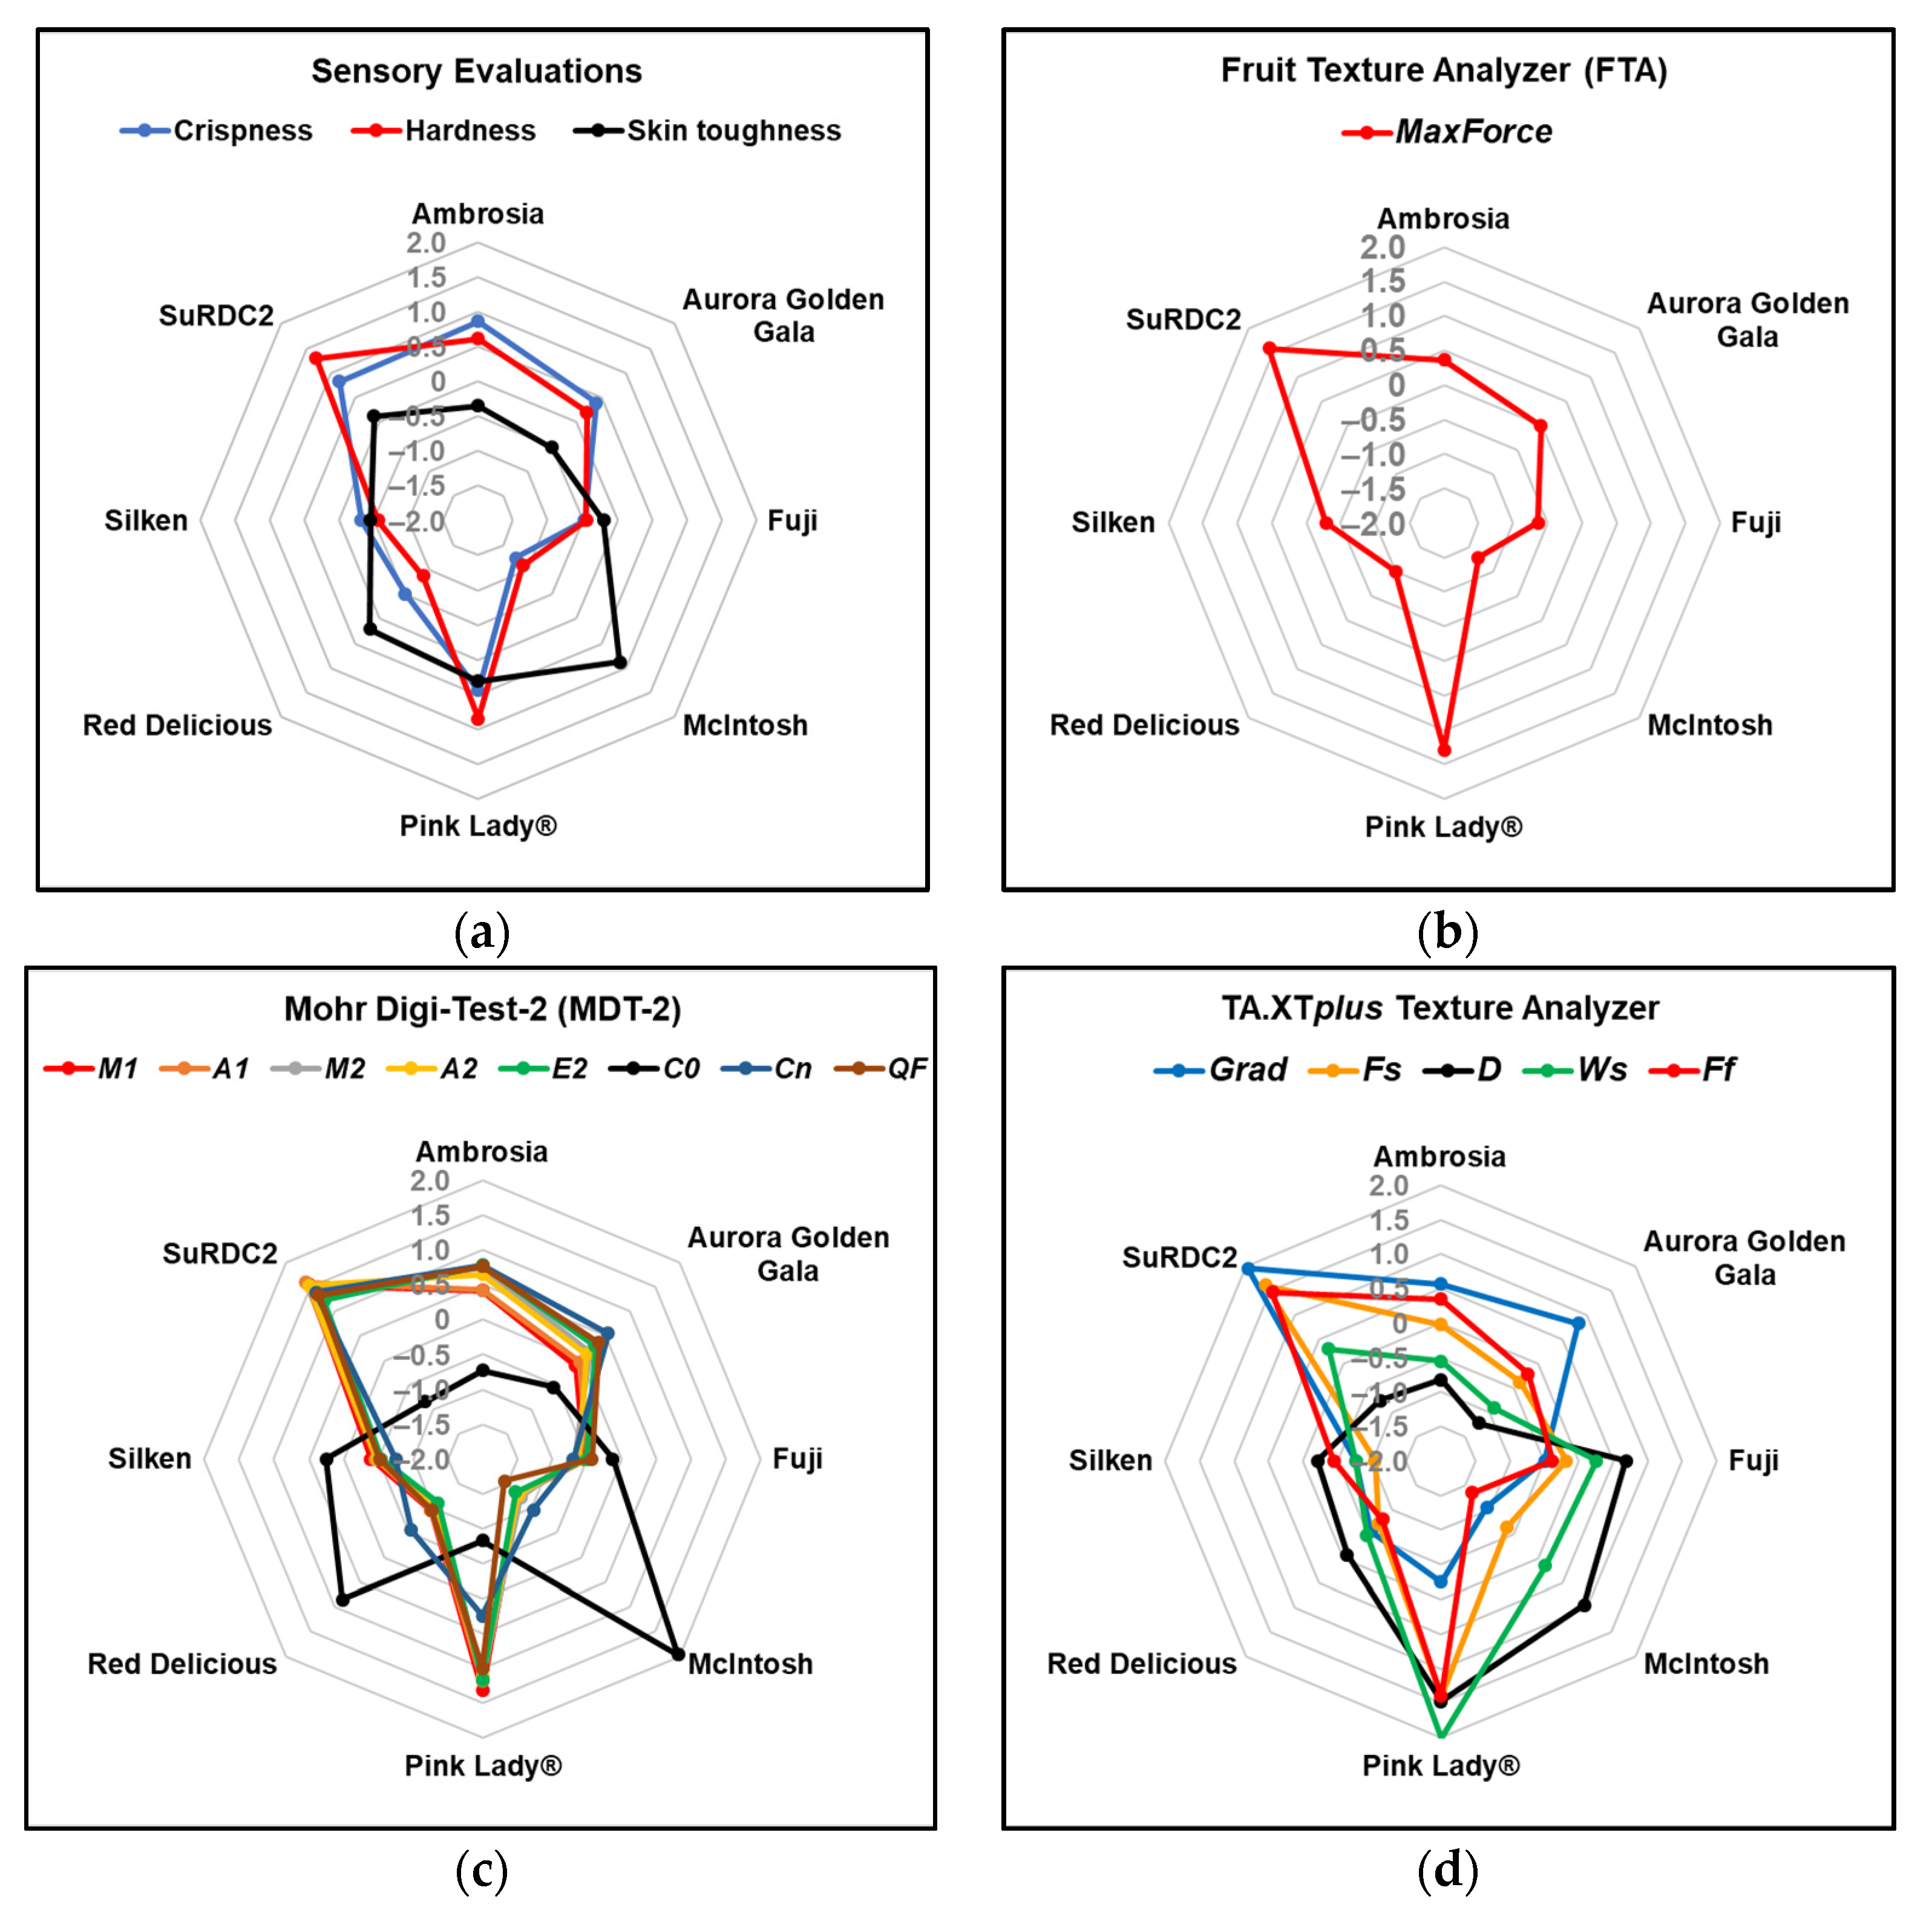
3.1. Descriptive Statistics
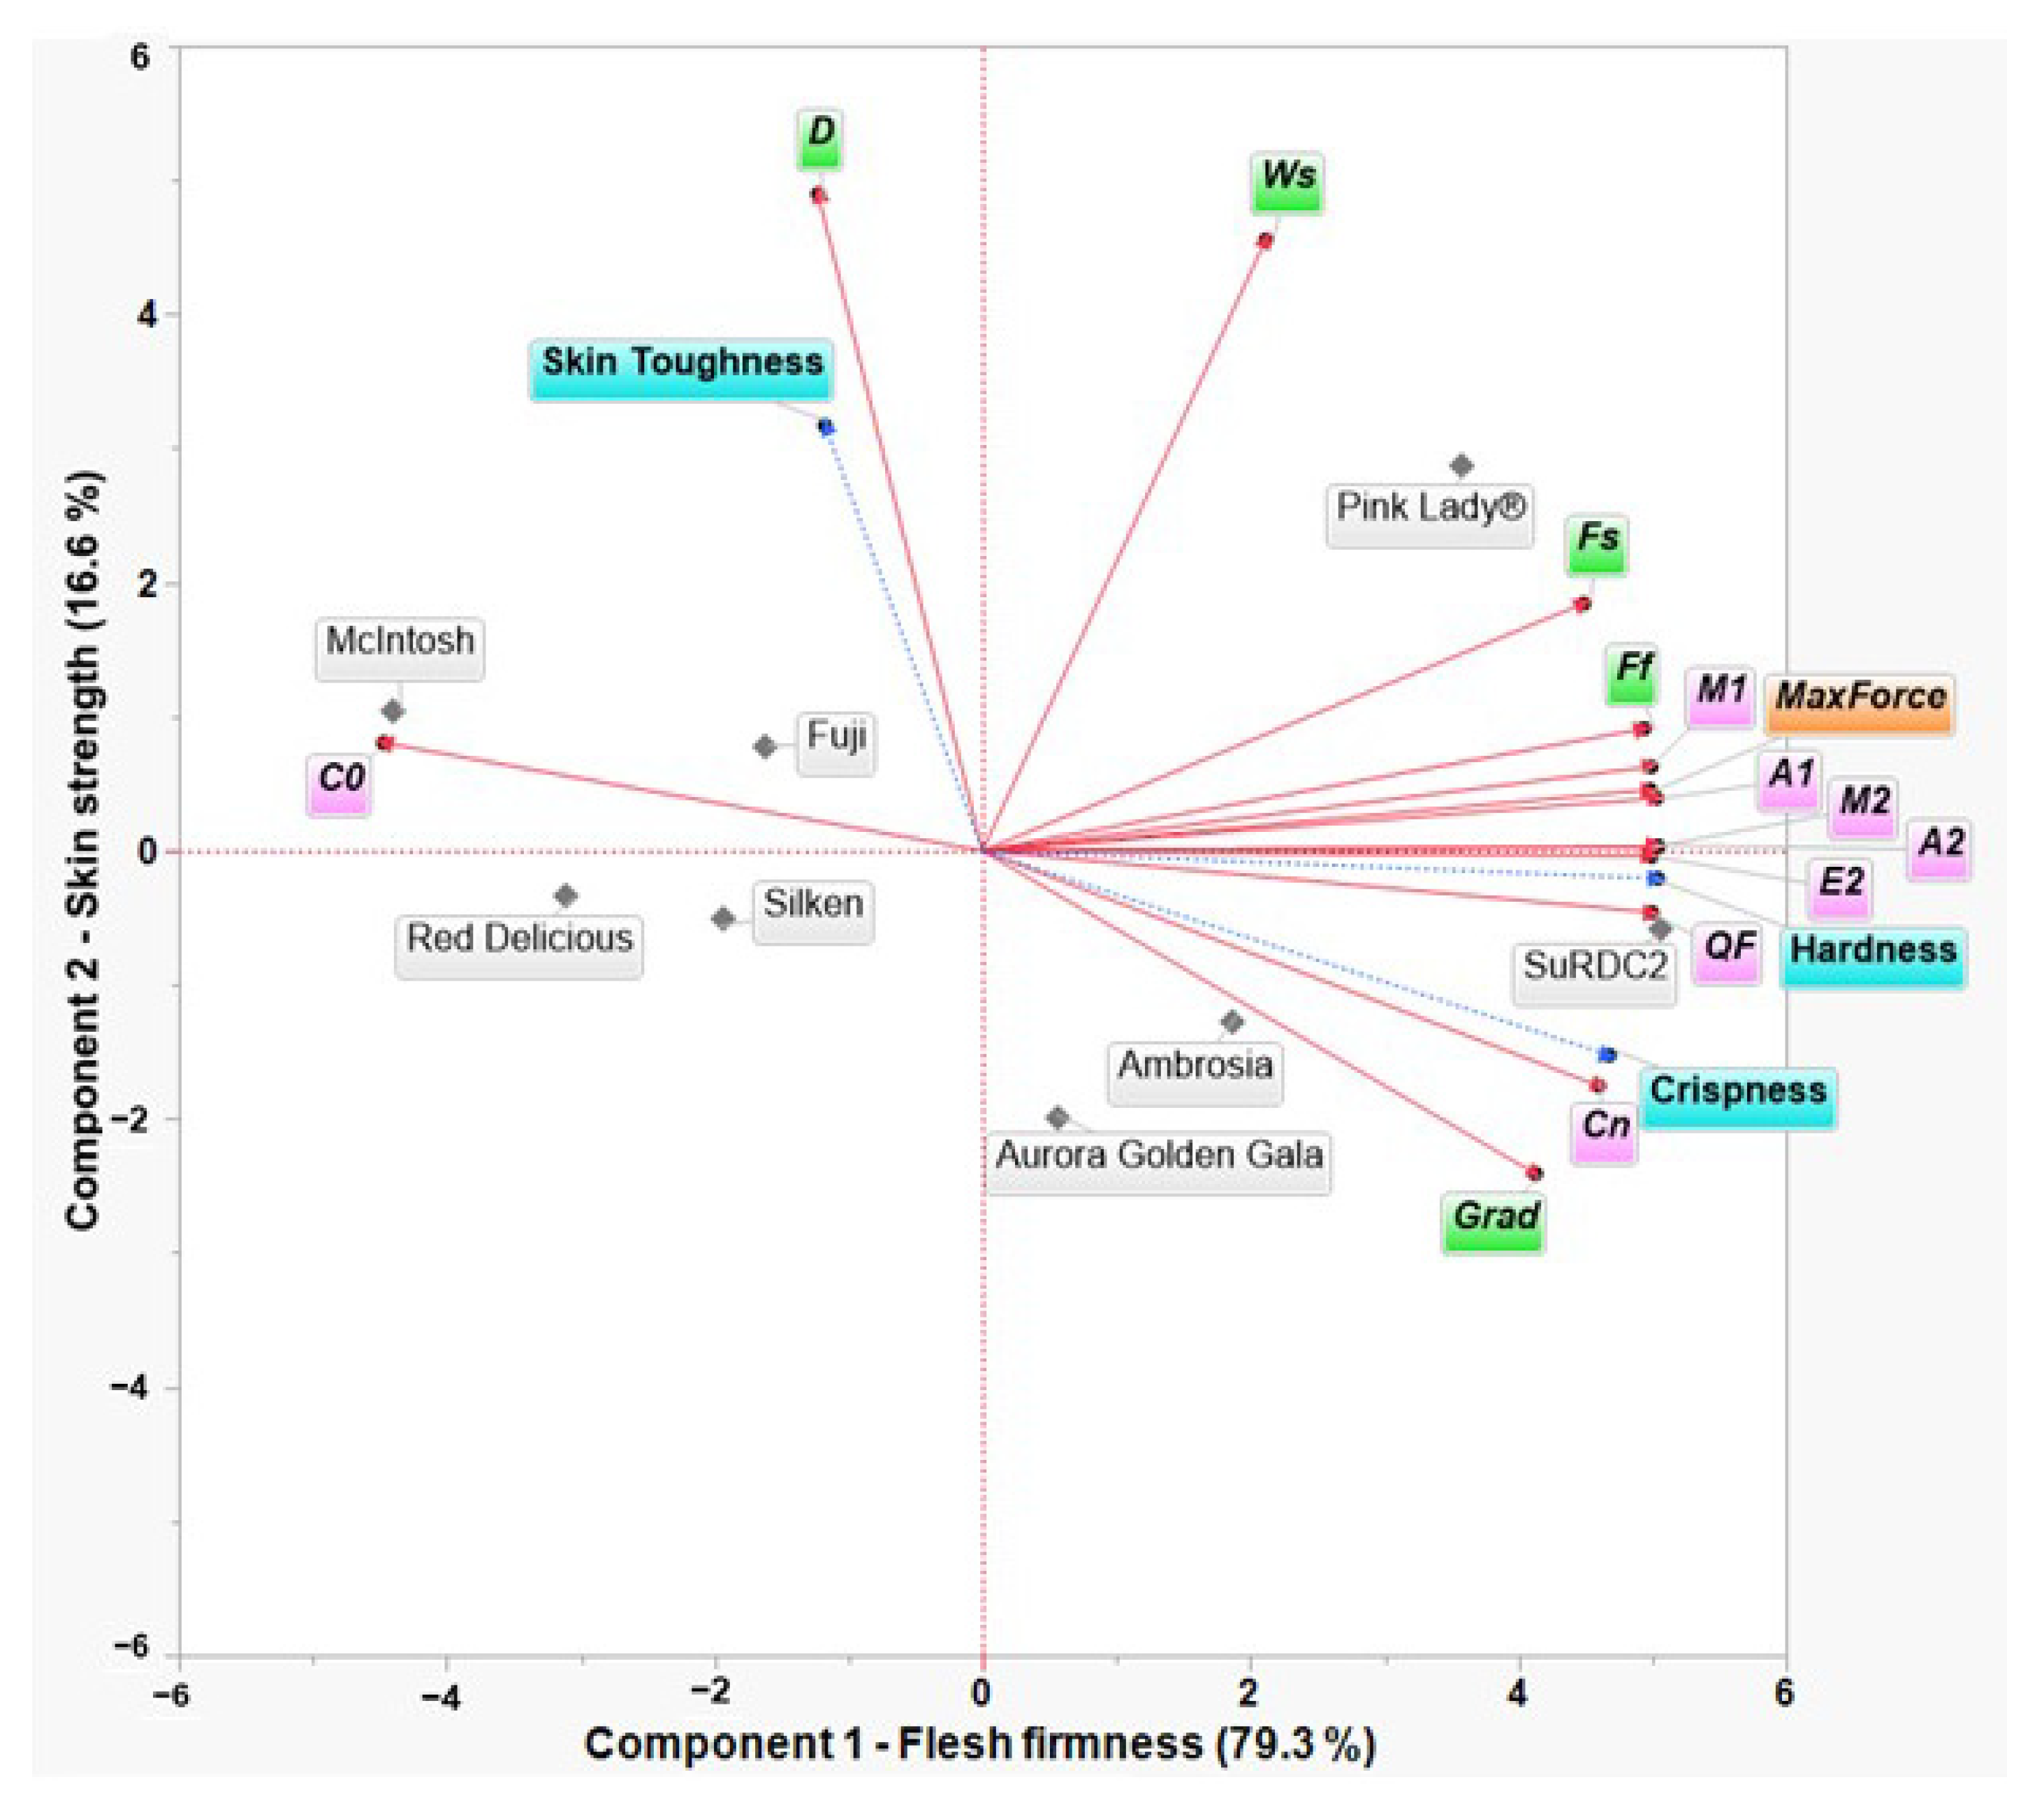
3.2. Principal Component Analysis (PCA)
3.3. Models to Convert MDT-2 and TA.XTplus Data to FTA Data
3.3.1. Converting MDT-2 Data to FTA Data
3.3.2. Converting TA.XTplus Data to FTA Data
3.4. Models to Convert FTA Data to MDT-2 Data
3.4.1. Converting FTA MaxForce Data to MDT-2 M1 Data
3.4.2. Converting FTA MaxForce Data to MDT-2 A1 Data
3.4.3. Converting FTA MaxForce Data to MDT-2 M2 Data
3.4.4. Converting FTA MaxForce Data to MDT-2 A2 Data
3.4.5. Converting FTA MaxForce Data to MDT-2 E2 Data
3.4.6. Converting FTA MaxForce Data to MDT-2 C0 Data
3.5. Models to Convert FTA Data to TA.XTplus Data
3.5.1. Converting FTA Data to TA.XTplus Grad Data
3.5.2. Converting FTA Data to TA.XTplus Fs Data
3.5.3. Converting FTA Data to TA.XTplus Ff Data
3.6. Models to Convert TA.XTplus Data to MDT-2 Data
3.6.1. Converting TA.XTplus Data to MDT-2 M1 Data
3.6.2. Converting TA.XTplus Data to MDT-2 A1 Data
3.6.3. Converting TA.XTplus Data to MDT-2 M2 Data
3.6.4. Converting TA.XTplus Data to MDT-2 A2 Data
3.6.5. Converting TA.XTplus Data to MDT-2 E2 Data
3.6.6. Converting TA.XTplus Data to MDT-2 C0 Data
3.7. Models to Convert MDT-2 Data to TA.XTplus Data
3.7.1. Converting MDT-2 Data to TA.XTplus Grad Data
3.7.2. Converting MDT-2 Data to TA.XTplus Fs Data
3.7.3. Converting MDT-2 Data to TA.XTplus Ff Data
4. Conclusions
Funding
Institutional Review Board Statement
Informed Consent Statement
Data Availability Statement
Acknowledgments
Conflicts of Interest
References
- Harker, F.R.; Kupferman, E.M.; Marin, A.B.; Gunson, F.A.; Triggs, C.M. Eating quality standards for apples based on consumer preferences. Postharvest Biol. Technol. 2008, 50, 70–78. [Google Scholar] [CrossRef]
- Almli, V.L. What Influences Apple Consumers’ Preferences? A Perspective on Intrinsic and Extrinsic Factors. In Proceedings of the Oral Session Presentation at the Meeting of Interpoma, Bolzano, Italy, 24–26 November 2016. [Google Scholar]
- Bejaei, M.; Cliff, M.A.; Singh, A. Multiple correspondence and hierarchical cluster analyses for the profiling of fresh apple customers using data from two marketplaces. Foods 2020, 9, 873. [Google Scholar] [CrossRef] [PubMed]
- Endrizzi, I.; Torri, L.; Corollaro, M.L.; Demattè, M.L.; Aprea, E.; Charles, M.; Biasioli, F.; Gasperi, F. A conjoint study on apple acceptability: Sensory characteristics and nutritional information. Food Qual Prefer. 2015, 40, 39–48. [Google Scholar] [CrossRef]
- Johnston, J.W.; Hewett, E.W.; Hertog, M.L. Postharvest softening of apple (Malus domestica) fruit: A review. N. Zldn. J. Crop. Hortic. Sci. 2002, 30, 145–160. [Google Scholar] [CrossRef]
- Smith, R.B.; Lougheed, E.C.; Franklin, E.W.; McMillan, I. The starch iodine test for determining stage of maturation in apples. Can. J. Plant Sci. 1979, 59, 725–735. [Google Scholar] [CrossRef]
- Evans, K.; Brutcher, L.; Konishi, B.; Barritt, B. Correlation of sensory analysis with physical textural data from a computerized penetrometer in the Washington State University apple breeding program. Horttechnology 2010, 20, 1026–1029. [Google Scholar] [CrossRef] [Green Version]
- Teh, S.L.; Kostick, S.; Brutcher, L.; Schonberg, B.; Barritt, B.; Evans, K. Trends in fruit quality improvement from 15 years of selection in the apple breeding program of Washington State University. Front. Plant Sci. 2021, 12, 714325. [Google Scholar] [CrossRef] [PubMed]
- Musacchi, S.; Serra, S. Apple fruit quality: Overview on pre-harvest factors. Sci. Hortic. 2018, 234, 409–430. [Google Scholar] [CrossRef]
- Lapsley, K.G.; Escher, F.E.; Hoehn, E. The cellular structure of selected apple varieties. Food Struct. 1992, 11, 339–349. [Google Scholar]
- Iglesias, I.; Echeverría, G.; Lopez, M.L. Fruit color development, anthocyanin content, standard quality, volatile compound emissions and consumer acceptability of several ‘Fuji’ apple strains. Sci. Hortic. 2012, 137, 138–147. [Google Scholar] [CrossRef]
- Mann, H.; Bedford, D.; Luby, J.; Vickers, Z.; Tong, C. Relationship of instrumental and sensory texture measurements of fresh and stored apples to cell number and size. HortScience 2005, 40, 1815–1820. [Google Scholar] [CrossRef] [Green Version]
- Buccheri, M.; Di Vaio, C. Relationship among seed number, quality, and calcium content in apple fruits. J. Plant Nutr. 2005, 27, 1735–1746. [Google Scholar] [CrossRef]
- Poles, L.; Gentile, A.; Giuffrida, A.; Valentini, L.; Endrizzi, I.; Aprea, E.; Gasperi, F.; Distefano, G.; Artioli, G.; La Malfa, S.; et al. Role of fruit flesh cell morphology and MdPG1 allelotype in influencing juiciness and texture properties in apple. Postharvest Biol. Technol. 2020, 164, 111161. [Google Scholar] [CrossRef]
- Vanoli, M.; Lovati, F.; Grassi, M.; Buccheri, M.; Zanella, A.; Cattaneo, T.M.; Rizzolo, A. Water spectral pattern as a marker for studying apple sensory texture. Adv. Hort. Sci. 2018, 32, 343–352. [Google Scholar] [CrossRef]
- Kingston, C.M. Maturity indices for apple and pear. In Horticultural Reviews 13; Janick, J., Ed.; John Wiley & Sons, Inc.: Hoboken, NJ, USA, 1992; pp. 407–432. [Google Scholar] [CrossRef]
- Wang, Z.; Lan, P.; Sun, F. Correlation research on the structure of the apple tree vigor and its fruit quality. In New Developments of IT, IoT and ICT Applied to Agriculture; Nakamatsu, K., Kountchev, R., Aharari, A., El-Bendary, N., Hu, B., Eds.; Springer: Singapore, 2021; pp. 55–63. [Google Scholar] [CrossRef]
- Stopar, M.; Bolcina, U.; Vanzo, A.; Vrhovsek, U. Lower crop load for cv. Jonagold apples (Malus × domestica Borkh.) increases polyphenol content and fruit quality. J. Agric. Food Chem. 2002, 50, 1643–1646. [Google Scholar] [CrossRef] [PubMed]
- Serra, S.; Leisso, R.; Giordani, L.; Kalcsits, L.; Musacchi, S. Crop load influences fruit quality, nutritional balance, and return bloom in ‘Honeycrisp’ apple. HortScience 2016, 51, 236–244. [Google Scholar] [CrossRef]
- Fallahi, E.; Simons, B.R. Interrelations among leaf and fruit mineral nutrients and fruit quality in ‘Delicious’ apples. J. Tree Fruit Prod. 1996, 1, 15–25. [Google Scholar] [CrossRef]
- Valverdi, N.A.; Kalcsits, L. Rootstock affects scion nutrition and fruit quality during establishment and early production of ‘Honeycrisp’ apple. HortScience 2021, 56, 261–269. [Google Scholar] [CrossRef]
- Mpelasoka, B.S.; Behboudian, M.H.; Mills, T.M. Effects of deficit irrigation on fruit maturity and quality of ‘Braeburn’ apple. Sci. Hortic. 2001, 90, 279–290. [Google Scholar] [CrossRef]
- Reid, M.N. Timely deficit irrigation as a tool to improve fruit quality and bitter pit incidence in ‘Honeycrisp’ apple. Master’s Thesis, Washington State University, Pullman, WA, USA, 2019. [Google Scholar]
- Sharples, R.O.; Johnson, D.S. Effects of some growth regulators on the ripening and storage quality of apples and pears. Acta Hortic. 1985, 179, 721–730. [Google Scholar] [CrossRef]
- Charles, M.; Corollaro, M.L.; Manfrini, L.; Endrizzi, I.; Aprea, E.; Zanella, A.; Corelli Grappadelli, L.; Gasperi, F. Application of a sensory–instrumental tool to study apple texture characteristics shaped by altitude and time of harvest. J. Sci. Food Agric. 2018, 98, 1095–1104. [Google Scholar] [CrossRef] [PubMed]
- Sugiura, T.; Ogawa, H.; Fukuda, N.; Moriguchi, T. Changes in the taste and textural attributes of apples in response to climate change. Sci. Rep. 2013, 3, 2418. [Google Scholar] [CrossRef] [PubMed] [Green Version]
- Plotto, A.; Bai, J.; Baldwin, E. Effect of CA/MA on sensory quality. In Controlled and Modified Atmospheres for Fresh and Fresh-Cut Produce; Gil, M.I., Beaudry, R., Eds.; Academic Press: London, UK, 2020; pp. 109–130. [Google Scholar] [CrossRef]
- Chang, H.Y.; Vickers, Z.M.; Tong, C.B. The use of a combination of instrumental methods to assess change in sensory crispness during storage of a “Honeycrisp” apple breeding family. J. Texture Stud. 2018, 49, 228–239. [Google Scholar] [CrossRef] [PubMed]
- Gwanpua, S.G.; Dakwa, V.; Verboven, P.; Nicolai, B.M.; Geeraerd, A.H.; Hendrickx, M.; Christiaens, S.; Verlinden, B.E. Relationship between texture analysis and texture attributes during postharvest softening of Jonagold and Kanzi apples. Acta Hortic. 2015, 1079, 279–284. [Google Scholar] [CrossRef]
- Corollaro, M.L.; Endrizzi, I.; Bertolini, A.; Aprea, E.; Demattè, M.L.; Costa, F.; Biasioli, F.; Gasperi, F. Sensory profiling of apple: Methodological aspects, cultivar characterisation and postharvest changes. Postharvest Biol. Technol. 2013, 77, 111–120. [Google Scholar] [CrossRef]
- Bejaei, M.; Stanich, K.; Cliff, M.A. Modelling and classification of apple textural attributes using sensory, instrumental and compositional analyses. Foods 2021, 10, 384. [Google Scholar] [CrossRef] [PubMed]
- Cliff, M.A.; Bejaei, M. Inter-correlation of apple firmness determinations and development of cross-validated regression models for prediction of sensory attributes from instrumental and compositional analyses. Food Res. Int. 2018, 106, 752–762. [Google Scholar] [CrossRef] [PubMed]
- Miller, S.; McNew, R.; Belding, R.; Berkett, L.; Brown, S.; Clement, J.; Cline, J.; Cowoll, W.; Crassweller, R.; Garcia, E.; et al. Performance of apple cultivars in the 1995 NE-183 regional project planting. J. Am. Pomol. Soc. 2004, 58, 65–77. [Google Scholar]
- Harker, F.R.; Maindonald, J.H.; Jackson, P.J. Penetrometer measurement of apple and kiwifruit firmness: Operator and instrument differences. J. Am. Soc. Hortic. Sci. 1996, 121, 927–936. [Google Scholar] [CrossRef] [Green Version]
- Lehman-Salada, L. Instrument and operator effects on apple firmness readings. HortScience 1996, 31, 994–997. [Google Scholar] [CrossRef] [Green Version]
- DeLong, J.M.; Prange, R.K.; Harrison, P.A.; McRae, K.B. Comparison of a new apple firmness penetrometer with three standard instruments. Postharvest Biol. Technol. 2000, 19, 201–209. [Google Scholar] [CrossRef]
- Teh, S.L.; Brutcher, L.; Schonberg, B.; Evans, K. Eleven-year correlation of physical fruit texture traits between computerized penetrometers and sensory assessment in an apple breeding program. Horttechnology 2020, 30, 719–724. [Google Scholar] [CrossRef]
- BC Fruit Growers Association. Apple Varieties. BC Tree Fruit Production Guide—Your One Stop Guide for Managing Your Crops. 2021. Available online: https://www.bctfpg.ca/horticulture/varieties-and-pollination/apple-varieties/ (accessed on 7 February 2022).
- Lawless, H.T.; Heymann, H. Sensory Evaluation of Food: Principles and Practices, 2nd ed.; Springer: New York, NY, USA, 2010. [Google Scholar] [CrossRef]
- Stone, H.; Bleibaum, R.N.; Thomas, H.A. Strategic applications. In Sensory Evaluation Practices; Academic Press: London, UK, 2021; pp. 337–415. [Google Scholar]
- Mohr, B.C. The Mohr Digi-Test (MDT) Computerized Agricultural Penetrometer as an Apple Maturity Tool. 2002. Available online: http://thinghiem.vn/media/uploads/mdtposterpaper.pdf (accessed on 6 December 2021).
- Næs, T.; Brockhoff, P.B.; Tomic, O. Statistics for Sensory and Consumer Science; John Wiley and Sons Ltd.: Chichester, UK, 2011. [Google Scholar]
- Gomez, K.A.; Gomez, A.A. Statistical Procedures for Agricultural Research; John Wiley and Sons: Hoboken, NJ, USA, 1984. [Google Scholar]
- Koul, A.; Becchio, C.; Cavallo, A. Cross-validation approaches for replicability in psychology. Front. Psychol. 2018, 9, 1117. [Google Scholar] [CrossRef] [PubMed]
- JMP Statistical Discovery from SAS. 2021. Available online: https://www.jmp.com/support/help/en/16.1/index.shtml#page/jmp/centering-and-scaling.shtml# (accessed on 6 December 2021).
- Faul, F.; Erdfelder, E.; Lang, A.G.; Buchner, A. G* Power 3: A flexible statistical power analysis program for the social, behavioral, and biomedical sciences. Behav. Res. Methods 2007, 39, 175–191. [Google Scholar] [CrossRef] [PubMed]
- Cohen, J. A power primer. Psychol. Bull. 1992, 112, 155–159. [Google Scholar] [CrossRef] [PubMed]
- da Silva, S.M.A.; Seixas, T.M. The role of data range in linear regression. Phys. Teach. 2017, 55, 371–372. [Google Scholar] [CrossRef]
- Cliff, M.A.; Stanich, K.; Lu, R.; Hampson, C.R. Use of descriptive analysis and preference mapping for early-stage assessment of new and established apples. J. Sci. Food Agric. 2016, 96, 2170–2183. [Google Scholar] [CrossRef]
- Harker, F.R.; Gunson, F.A.; Jaeger, S.R. The case for fruit quality: An interpretive review of consumer attitudes, and preferences for apples. Postharvest Biol. Technol. 2003, 28, 333–347. [Google Scholar] [CrossRef]
- Pramudya, R.C.; Seo, H.S. Hand-feel touch cues and their influences on consumer perception and behavior with respect to food products: A review. Foods 2019, 8, 259. [Google Scholar] [CrossRef] [PubMed] [Green Version]
- Toivonen, P.M.; Brummell, D.A. Biochemical bases of appearance and texture changes in fresh-cut fruit and vegetables. Postharvest Biol. Technol. 2008, 48, 1–14. [Google Scholar] [CrossRef]
- Jarvis, M.C.; Briggs, S.P.H.; Knox, J.P. Intercellular adhesion and cell separation in plants. Plant Cell Environ. 2003, 26, 977–989. [Google Scholar] [CrossRef]
- Ng, J.K.; Schröder, R.; Sutherland, P.W.; Hallett, I.C.; Hall, M.I.; Prakash, R.; Smith, B.G.; Melton, L.D.; Johnston, J.W. Cell wall structures leading to cultivar differences in softening rates develop early during apple (Malus × domestica) fruit growth. BMC Plant Biol. 2013, 13, 183. [Google Scholar] [CrossRef] [PubMed] [Green Version]
- Grotte, M.; Duprat, F.; Loonis, D.; Piétri, E. Mechanical properties of the skin and the flesh of apples. Int. J. Food Prop. 2001, 4, 149–161. [Google Scholar] [CrossRef]
- Archontoulis, S.V.; Miguez, F.E. Nonlinear regression models and applications in agricultural research. J. Agron. 2015, 107, 786–798. [Google Scholar] [CrossRef] [Green Version]
- Harker, F.R.; Stec, M.G.H.; Hallett, I.C.; Bennett, C.L. Texture of parenchymatous plant tissue: A comparison between tensile and other instrumental and sensory measurements of tissue strength and juiciness. Postharvest Biol. Technol. 1997, 11, 63–72. [Google Scholar] [CrossRef]
- Mead, R.; Curnow, R.N.; Hasted, A.M. Statistical Methods in Agriculture and Experimental Biology; Chapman and Hall/CRC: Boca Raton, FL, USA, 2017. [Google Scholar] [CrossRef]
- Stone, H.; Bleibaum, R.N.; Thomas, H.A. Descriptive analysis. In Sensory Evaluation Practices; Academic Press: London, UK, 2021; pp. 235–295. [Google Scholar]

| Variety | Harvest Timing Group | Appearance of Sorted Fruit |
|---|---|---|
| McIntosh | Early | 25–75% red over-color with green ground-color |
| Silken | Early | 0–5% red over-color with yellow/green ground-color, and russet filled stem bowl |
| SuRDC2 1 | Early | 60–90% red over-color with slight greenish to yellow ground-color, and russet filled stem bowl |
| Aurora Golden Gala | Early | Slightly greenish to yellow color, and russet filled stem-bowl |
| Ambrosia | Mid/late | 60–90% red over-color with yellow ground-color |
| Fuji | Mid/late | 80–95% red over-color with yellow ground-color, and russet |
| Red Delicious | Mid/late | 95% red over-color with yellow ground-color, and slight stripe |
| Pink Lady® | Mid/late | 70–95% red over-color with slight greenish to yellow ground-color |
| Attribute | Definition | Food Standard |
|---|---|---|
| Crispness | The amount of sound produced by the apple flesh when the sample is first bitten with the front teeth. | Banana at 0 units; celery at 90 units |
| Hardness | The resistance to compression by the apple flesh when the sample is placed on the back teeth and the teeth are compressed. Assess after repeated chewing. | Medjool date at 10 units; carrot at 90 units |
| Skin toughness | The relative ease of breakdown of skin in the mouth during chewing with the back teeth to prepare the apple for swallowing. | Green pepper at 50 units |
| Instrument | Parameter | Unit | Description |
|---|---|---|---|
| Fruit Texture Analyzer (FTA) 1 | MaxForce | Pound-force (lbf) | The maximum flesh firmness |
| Mohr Digi-Test-2 (MDT-2) 2 | M1 | lbf | Maximum firmness for region 1 2 |
| A1 | lbf | Average force for region 1 | |
| M2 | lbf | Maximum firmness for region 2 2 | |
| A2 | lbf | Average force for region 2 | |
| E2 | lbf | Average force of last 20 readings in region 2 | |
| C0 | Inch (in) | Creep deformation or relaxation rate of fruit material measured at the beginning of region 2 | |
| Cn | Unit less | Crispness measurement (a composite variable) | |
| QF | Unit less | Quality factor (weighted some of several MDT-2 parameters) | |
| TA.XTplus Texture Analyzer 3 | Fs | Newton (N) | The maximum force required to rupture apple skin and flesh |
| Ws | Nmm | Work to rupture skin and flesh | |
| Grad | N/mm | The gradient on the force-distance curve between 20% and 80% of Fs to measure the slope of the firmness | |
| D | mm | The probe position at Fs | |
| Ff | N | The average force required to puncture the flesh between 4.5 mm and 9.5 mm a |
| Data Source | Parameter | Minimum | Maximum | Mean | SD |
|---|---|---|---|---|---|
| Sensory evaluations 1 (n = 264) | Crispness | 11 | 87.5 | 53.18 | 20 |
| Hardness | 2 | 87 | 40.84 | 23.23 | |
| Skin toughness | 16 | 94 | 49.73 | 14.81 | |
| Fruit Texture Analyzer (FTA) 2 (n = 80) | MaxForce | 9.04 | 23.69 | 15.01 | 4.01 |
| Mohr Digi-Test-2 (MDT-2) 3 (n = 80) | M1 | 7.59 | 20.07 | 12.95 | 3.27 |
| A1 | 5.54 | 13.72 | 9.07 | 2.1 | |
| M2 | 11.27 | 27.84 | 18.39 | 4.9 | |
| A2 | 9.66 | 22.41 | 15.1 | 3.75 | |
| E2 | 9.35 | 25.64 | 16.7 | 4.7 | |
| C0 | 0 | 0.09 | 0.02 | 0.02 | |
| Cn | 59.32 | 534.04 | 217.03 | 106.96 | |
| QF | −102.44 | 145.14 | 30.88 | 66.94 | |
| TA.XTplus Texture Analyzer 4 (n = 80) | Fs | 15.28 | 43.63 | 25.36 | 7.02 |
| Ws | 43.89 | 100.66 | 64.57 | 15.43 | |
| Grad | 1.98 | 4.16 | 2.99 | 0.58 | |
| D | 51.11 | 198.8 | 95.47 | 34.13 | |
| Ff | 22.35 | 56.26 | 36.9 | 9.29 |
| Output 1 | Predictor 1 | Model | Standard Error | Std Beta 2 | t-Statistics | Prob > |t| | Lower 95% CI 3 | Upper 95% CI |
|---|---|---|---|---|---|---|---|---|
| MaxForce | Intercept | 0.75 | 0 | 0.68 | 0.5 | −0.99 | 2.01 | |
| M1 | 0.06 | 0.91 | 19.86 | <0.0001 | 1.01 | 1.23 |
| Output 1 | Parameter 1 | Model | Standard Error | Std Beta 2 | t-Statistics | Prob > |t| | Lower 95% CI 3 | Upper 95% CI | VIF 4 |
|---|---|---|---|---|---|---|---|---|---|
| MaxForce | Intercept | 1.09 | 0.00 | 2.81 | 0.006 | 0.89 | 5.21 | ||
| D (mm) | 0.28 | −0.12 | −3.00 | 0.004 | −1.41 | −0.28 | 1.00 | ||
| Ff (N) | 0.02 | 0.92 | 22.47 | <.0001 | 0.36 | 0.43 | 1.00 |
| Output 1 | Parameter 1 | Model | Standard Error | Std Beta 2 | t-Statistics | Prob > |t| | Lower 95% CI 3 | Upper 95% CI |
|---|---|---|---|---|---|---|---|---|
| M1 | Intercept | 0.58 | 0 | 3.01 | 0 | 0.59 | 2.92 | |
| MaxForce | 0.04 | 0.91 | 19.86 | <0.0001 | 0.67 | 0.82 | ||
| A1 | Intercept | 0.41 | 0 | 5 | <0.0001 | 1.22 | 2.84 | |
| MaxForce | 0.03 | 0.9 | 17.92 | <0.0001 | 0.42 | 0.52 | ||
| M2 | Intercept | 0.93 | 0 | 1.98 | 0.05 | −0.01 | 3.67 | |
| MaxForce | 0.06 | 0.9 | 18.5 | <0.0001 | 0.98 | 1.22 | ||
| A2 | Intercept | 0.68 | 0 | 3.41 | 0 | 0.97 | 3.69 | |
| MaxForce | 0.04 | 0.91 | 19.34 | <0.0001 | 0.76 | 0.94 | ||
| E2 | Intercept | 1.03 | 0 | 1.45 | 0.15 | −0.56 | 3.56 | |
| MaxForce | 0.07 | 0.86 | 15.2 | <0.0001 | 0.88 | 1.15 | ||
| C0 | Intercept | 0.0251 | 0 | 8.22 | <0.0001 | 0.1565 | 0.2565 | |
| MaxForce | 0.0033 | −3.48 | −6.24 | <0.0001 | −0.0273 | −0.0141 | ||
| (MaxForce) 2 | 0.0001 | 2.76 | 4.95 | <0.0001 | 0.0003 | 0.0007 |
| Output 1 | Parameter 1 | Model | Standard Error | Std Beta 2 | t-Statistics | Prob > |t| | Lower 95% CI 3 | Upper 95% CI |
|---|---|---|---|---|---|---|---|---|
| Grad | Intercept | 2.29 | 0.00 | 3.37 | 0.001 | 3.15 | 12.28 | |
| MaxForce | 0.15 | 0.67 | 7.97 | <0.0001 | 0.89 | 1.48 | ||
| Fs | Intercept | 4.12 | 0.00 | 4.56 | <0.0001 | 10.58 | 26.99 | |
| MaxForce | 0.27 | 0.79 | 11.50 | <0.0001 | 2.52 | 3.58 | ||
| Ff | Intercept | 1.57 | 0.00 | 2.70 | 0.01 | 1.12 | 7.38 | |
| MaxForce | 0.10 | 0.93 | 21.45 | <0.0001 | 1.96 | 2.36 |
| Output 1 | Parameter 1 | Model | Standard Error | Std Beta 2 | t-Statistics | Prob > |t| | Lower 95% CI 3 | Upper 95% CI | VIF 4 |
|---|---|---|---|---|---|---|---|---|---|
| M1 | Intercept | 0.68 | 0 | 1.51 | 0.14 | −0.33 | 2.37 | ||
| Grad | 0.03 | 0.17 | 2.68 | 0.01 | 0.02 | 0.13 | 1.68 | ||
| Ff | 0.02 | 0.78 | 12.18 | <0.0001 | 0.22 | 0.31 | 1.68 | ||
| A1 | Intercept | 0.47 | 0 | 2.91 | 0.00 | 0.43 | 2.32 | ||
| Grad | 0.02 | 0.18 | 2.65 | 0.01 | 0.01 | 0.09 | 1.64 | ||
| Ff | 0.02 | 0.77 | 11.38 | <0.0001 | 0.14 | 0.20 | 1.64 | ||
| M2 | Intercept | 1.12 | 0 | 0.11 | 0.91 | −2.11 | 2.35 | ||
| Grad | 0.05 | 0.22 | 3.23 | 0.00 | 0.06 | 0.25 | 1.64 | ||
| Ff | 0.04 | 0.74 | 10.90 | <0.0001 | 0.32 | 0.46 | 1.64 | ||
| A2 | Intercept | 0.80 | 0 | 1.22 | 0.23 | −0.62 | 2.58 | ||
| Grad | 0.03 | 0.23 | 3.54 | 0.00 | 0.05 | 0.19 | 1.64 | ||
| Ff | 0.03 | 0.74 | 11.69 | <0.0001 | 0.25 | 0.35 | 1.64 | ||
| E2 | Intercept | 1.85 | 0 | 2.82 | 0.01 | 1.54 | 8.91 | ||
| D | 0.48 | −0.17 | −2.85 | 0.01 | −2.33 | −0.41 | 1.00 | ||
| Ff | 0.03 | 0.83 | 14.09 | <0.0001 | 0.36 | 0.48 | 1.00 | ||
| C0 | Intercept | 0.0270 | 0 | 7.27 | <0.0001 | 0.1427 | 0.2504 | ||
| D | 0.0024 | 0.1896 | 3.28 | 0.0016 | 0.0031 | 0.0128 | 1.15 | ||
| Ff | 0.0013 | −3.4347 | −6.98 | <0.0001 | −0.0115 | −0.0064 | 83.65 | ||
| Ff2 | 0.0000 | 2.6733 | 5.43 | <0.0001 | 0.0001 | 0.0001 | 83.87 |
| Output 1 | Parameter 1 | Model | Standard Error | Std Beta 2 | t-Statistics | Prob > |t| | Lower 95% CI 3 | Upper 95% CI | VIF 4 |
|---|---|---|---|---|---|---|---|---|---|
| Grad | Intercept | 2.41 | 0.00 | 2.39 | 0.02 | 0.96 | 10.56 | ||
| A2 | 0.16 | 0.69 | 8.37 | <0.0001 | 0.99 | 1.61 | 1.00 | ||
| Fs | Intercept | 8.30 | 0.00 | −0.32 | 0.75 | −19.15 | 13.91 | ||
| M1 | 0.54 | 1.04 | 9.08 | <0.0001 | 3.82 | 5.97 | 3.02 | ||
| C0 | 73.99 | 0.29 | 2.56 | 0.01 | 42.32 | 336.98 | 3.02 | ||
| Ff | Intercept | 1.94 | 0.00 | 2.14 | 0.04 | 0.29 | 8.03 | ||
| M1 | 0.15 | 0.89 | 17.37 | <0.0001 | 2.24 | 2.82 | 1.00 |
Publisher’s Note: MDPI stays neutral with regard to jurisdictional claims in published maps and institutional affiliations. |
© 2022 by the author. Licensee MDPI, Basel, Switzerland. This article is an open access article distributed under the terms and conditions of the Creative Commons Attribution (CC BY) license (https://creativecommons.org/licenses/by/4.0/).
Share and Cite
Bejaei, M. Converting Apple Textural Parameters Obtained from Penetrometers and Their Relationships with Sensory Attributes. Horticulturae 2022, 8, 269. https://doi.org/10.3390/horticulturae8030269
Bejaei M. Converting Apple Textural Parameters Obtained from Penetrometers and Their Relationships with Sensory Attributes. Horticulturae. 2022; 8(3):269. https://doi.org/10.3390/horticulturae8030269
Chicago/Turabian StyleBejaei, Masoumeh. 2022. "Converting Apple Textural Parameters Obtained from Penetrometers and Their Relationships with Sensory Attributes" Horticulturae 8, no. 3: 269. https://doi.org/10.3390/horticulturae8030269
APA StyleBejaei, M. (2022). Converting Apple Textural Parameters Obtained from Penetrometers and Their Relationships with Sensory Attributes. Horticulturae, 8(3), 269. https://doi.org/10.3390/horticulturae8030269