Communication

A Preliminary Study for Identifying Quantitative Trait Loci Associated with Seed Production in Radish Using Genotyping-by-Sequencing

1
Vegetable Division, National Institute of Horticultural & Herbal Science, RDA, Wanju 55365, Korea
2
Highland Agriculture Research Institute, National Institute of Crop Science, Rural Development Administration (RDA), Pyeongchang 25342, Korea
3
Department of Environmental Horticulture, Dankook University, Cheonan 31116, Korea
*
Author to whom correspondence should be addressed.
These authors contributed equally to this work.
Horticulturae 2022, 8(3), 268; https://doi.org/10.3390/horticulturae8030268
Submission received: 13 February 2022 / Revised: 10 March 2022 / Accepted: 18 March 2022 / Published: 20 March 2022
(This article belongs to the Section Propagation and Seeds)

Abstract

:
The high yield of seeds can reduce the cost of seed production for parental lines, as well as F1 cultivars in radish. The number of seeds per silique and silique length are two important traits among traits determining seed yield, but no study has been conducted on their quantitative trait loci (QTLs) in radish. A high-density linkage map was constructed, based on genotyping-by-sequencing (GBS) of the F2 population, derived from two parental lines, significantly differed by the two traits, which were grown in a controlled environment to minimize the environmental effects. Using the map with 848 SNPs, three significant QTLs were identified, two and one of which were associated with the number of seeds per silique and silique length, respectively. Ortholog analysis was conducted with Arabidopsis thaliana genes, related to the number of seeds per silique, and revealed five radish putative candidate genes. These putative candidate genes appear to be related to ovule, embryo sac, embryo, pollen and seed development, as well as a double fertilization process. The method to pollinate the F2 population, as well as preliminary QTLs and SNPs therein, can be helpful for future QTL studies to improve seed production in radish breeding programs.

1. Introduction

Radish (Raphanus sativus L.; 2n = 18) is a biennial, insect-pollinated and self-incompatible plant, and one of the major vegetables cultivated globally, in Asia, Europe, America and Africa. The genus Raphanus includes two species, R. sativus and R. raphanistrum, the latter of which has three [1,2] or five [3] subspecies, depending on researchers. Most cultivated radishes belong to R. sativus, and various types have been diversified since its domestication. In Korea, for example, many cultivars have been established for spring, summer (highland), autumn and winter cultivation, as well as for leaves, small roots, salad and pickled radish (Danmuji) and others.
Seed yield is an important trait in radish breeding programs, since high seed yield can reduce the cost and increase the efficiency in the seed production of F1 cultivars and their parental lines. Many traits are related to the seed yield. For example, major determinants for seed yield in cabbage are the numbers of branches, siliques and seeds per plant, branch and silique, respectively, and seed weight, all of which are controlled by quantitative trait loci (QTLs) [4]. However, little is known about seed production traits and no study has been conducted to identify QTLs on seed-related traits in radish.
The number of seeds per silique may be the most important trait related to the seed production in radish, since it is significantly lower than other related Brassica species. For example, the number of seeds per silique was more than 24 and 10, on average, for high- and low-seed-yielding lines, respectively, in B. napus [5]. However, it is, on average, less than eight in most radish accessions or landraces [6], and less than four in most parental lines used in commercial radish breeding programs. Therefore, the efficiency for seed production in radish can be significantly improved by increasing the number of seeds per silique.
Silique length can be also a good indicator for high-seed production in radish, since it is closely and positively correlated with the number of seeds per silique [6]. Besides, this trait has an advantage in the selection process for high-seed yield, since it can be easily done by optical observation for long siliques in field. In addition, the silique length has importance as a vegetable in those countries, where immature green pods are used as an ingredient, such as in India, Pakistan, Malaysia, Indonesia and Sri Lanka [7,8]. To date, no study has been conducted in radish to identify QTLs associated with the number of seeds per silique and silique length, although many studies identified QTLs associated with the number of seeds per silique in B. napus [9,10] and B. oleracea [4], and with silique length in B. napus [11,12].
As a preliminary study to investigate the QTLs related to the number of seeds per silique and silique length, we generated an F2 population, derived from parental lines, which were significantly different on the two traits. The F2 population and their parental lines were grown in a controlled environment to minimize the environmental effects. QTL analysis was performed, based on the F2 population, by generating a linkage map with the large number of single nucleotide polymorphisms (SNPs) obtained from genotyping-by-sequencing (GBS). Putative candidate genes, related to the number of seeds per silique in radish, were also identified.

2. Materials and Methods

2.1. Plant Materials and Genomic DNA Extraction

An F2 population with 92 individuals was derived from a cross between ‘WK39-2-1’ (P1) and ‘FG26-1-1-1-1’ (P2), which significantly differed in the number of seeds per silique (2.1 and 13.7, respectively) and silique length (3.8 and 17.3 cm, respectively). S haplotypes for P1 and P2 were s1 and s16, respectively. Two radish cultivars were employed as pollinizers, which have s10, s18 and s5 haplotypes, and bumblebees were used as pollinators. The 92 F2 population, two parental lines and 12 pollinizers which were evenly distributed at the experimental plot, were grown in a greenhouse at the National Institute of Horticultural and Herbal Science, Korea, to minimize environmental effects. The minimum and maximum temperature of the greenhouse was maintained between approximately 25 and 32 °C, respectively, and the humidity was approximately 60% throughout growing period. The seeds were sowed in the greenhouse on 6 April 2020. Phenotypic observation for the number of seeds and silique length was performed from 30 June to 3 July. Fifteen siliques per plant were randomly chosen and observed for phenotyping of the two traits.
The genomic DNA samples of two parental lines and their 92 F2 population were extracted from young and fresh leaf tissues using the cetyltrimethylammonium bromide (CTAB) method. The extracted DNA samples were diluted in 20 ng/µL for library preparation. DNA concentration and purity were determined using an Assay-Nano drop (Denovix Inc., Wilmington, DE, USA) and gel electrophoresis.

2.2. Genotyping-by-Sequencing Library Preparation

A GBS library was constructed using a restriction enzyme ApeKI according to a protocol modified from Elshire et al., 2011 [13]. The library was prepared by restriction digestion of DNA for each parental line and F2 population, followed by ligation with barcoded adapters. Ninety-four different barcode sequences were used to tag the samples. The library was pooled and sequenced using Illumina TrueSeq Ver3.0 paired-end sequencing with 151-bp read lengths on the Illumina HiSeq X platform. A total of 94 samples were sequenced in a lane. Uploading the sequencing data to NCBI database is in process.

2.3. Sequencing Data Analysis and Single Nucleotide Polymorphism Calling

Raw reads were aligned based on reference genome de-multiplexed and then their barcode sequences were removed. Sequences not containing the expected restriction sites for the enzyme were removed. To align the clean reads to the reference genome, the Burrows–Wheeler Aligner (BWA, 0.6.1-r104) program [14] were applied. The mapped reads were then extracted from the resulting BAM file using SAMtools v.0.1.16 [15] for further analyses. Since the high mapping quality ensures reliable mapping of the reads, which is important for variant calling, SNPs were called only for variable positions with a minimal mapping quality (-Q) of 30 using the varFilter command. The minimum and maximum of read depths were set 3 and 177, respectively. An in-house script considering biallelic loci was used to select significant site in the called SNPs positions [16].

2.4. Linkage Map Consturction and QTL Analysis

The F2 individuals were genotyped and the marker segregation data were analyzed with JOINMAP Version 4.1 by treating the segregation data of the markers as an “F2” population. The significance of each allele was tested and further filtered for independence of segregation with logarithm of odds (LOD) threshold of 2.0 and 10.0. Chi-square tests were performed to test for deviation from the expected Mendelian segregation ratio of 1:2:1 (p > 0.01) for each marker. SNP markers with more than 95% of similarity between two markers were removed from the analysis. The regression algorithm and Kosambi mapping function were used in the marker distance calculation, expressed in centiMorgans (cM). Maps were viewed using MapChart 2.32.
QTL mapping for the two traits was conducted using the composite interval mapping method with Windows QTL cartographer v2.5 program [17]. The LOD thresholds for QTL significance were determined by a 1000-permutation test with the significance level = 0.05. The percentage of phenotypic variance, and additive and dominance effects, explained by each QTL for each trait were estimated. The gene action was determined by calculating the dominance to additive effect ratio as described by Stuber et al., 1987 [18].

2.5. The Prediction of Orthologous Genes

To predict orthologous genes related to the number of seeds per silique in R. sativus, BLASTX was performed with an E-value cutoff of <10−10 on the NCBI protein database. Protein sequences of 276 genes in Arabidopsis thaliana, which were related to the number of seeds per pod (NSPP) in B. napus and obtained from Yang et al., 2016 [19], were compared with five R. sativus genes located within 100 kb of upstream and downstream of the QTL positions related to the number of seeds per silique.

3. Results

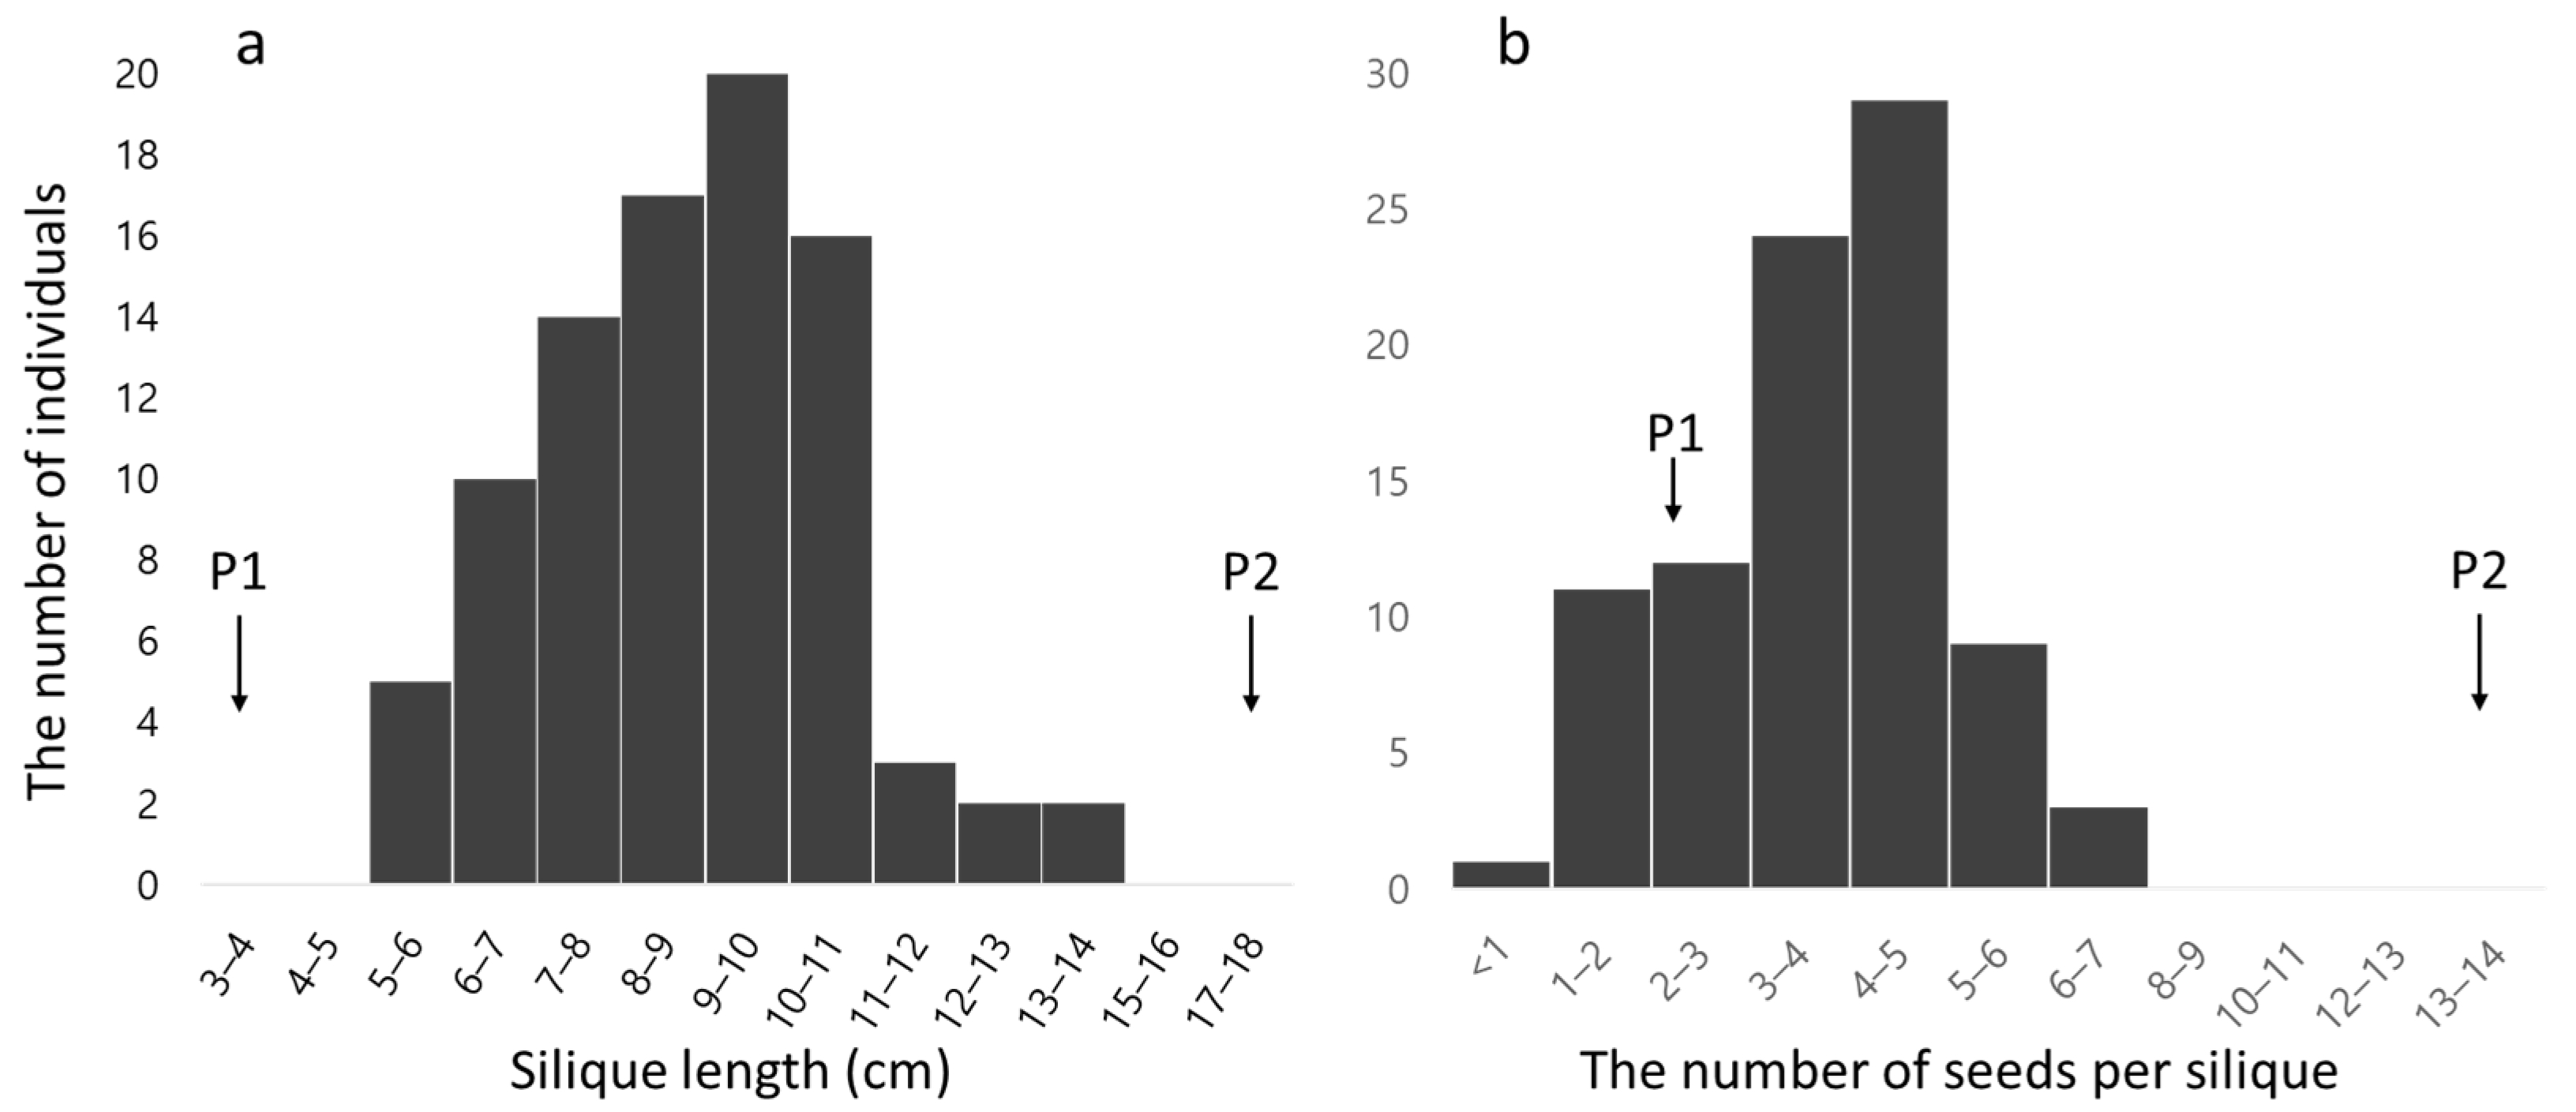
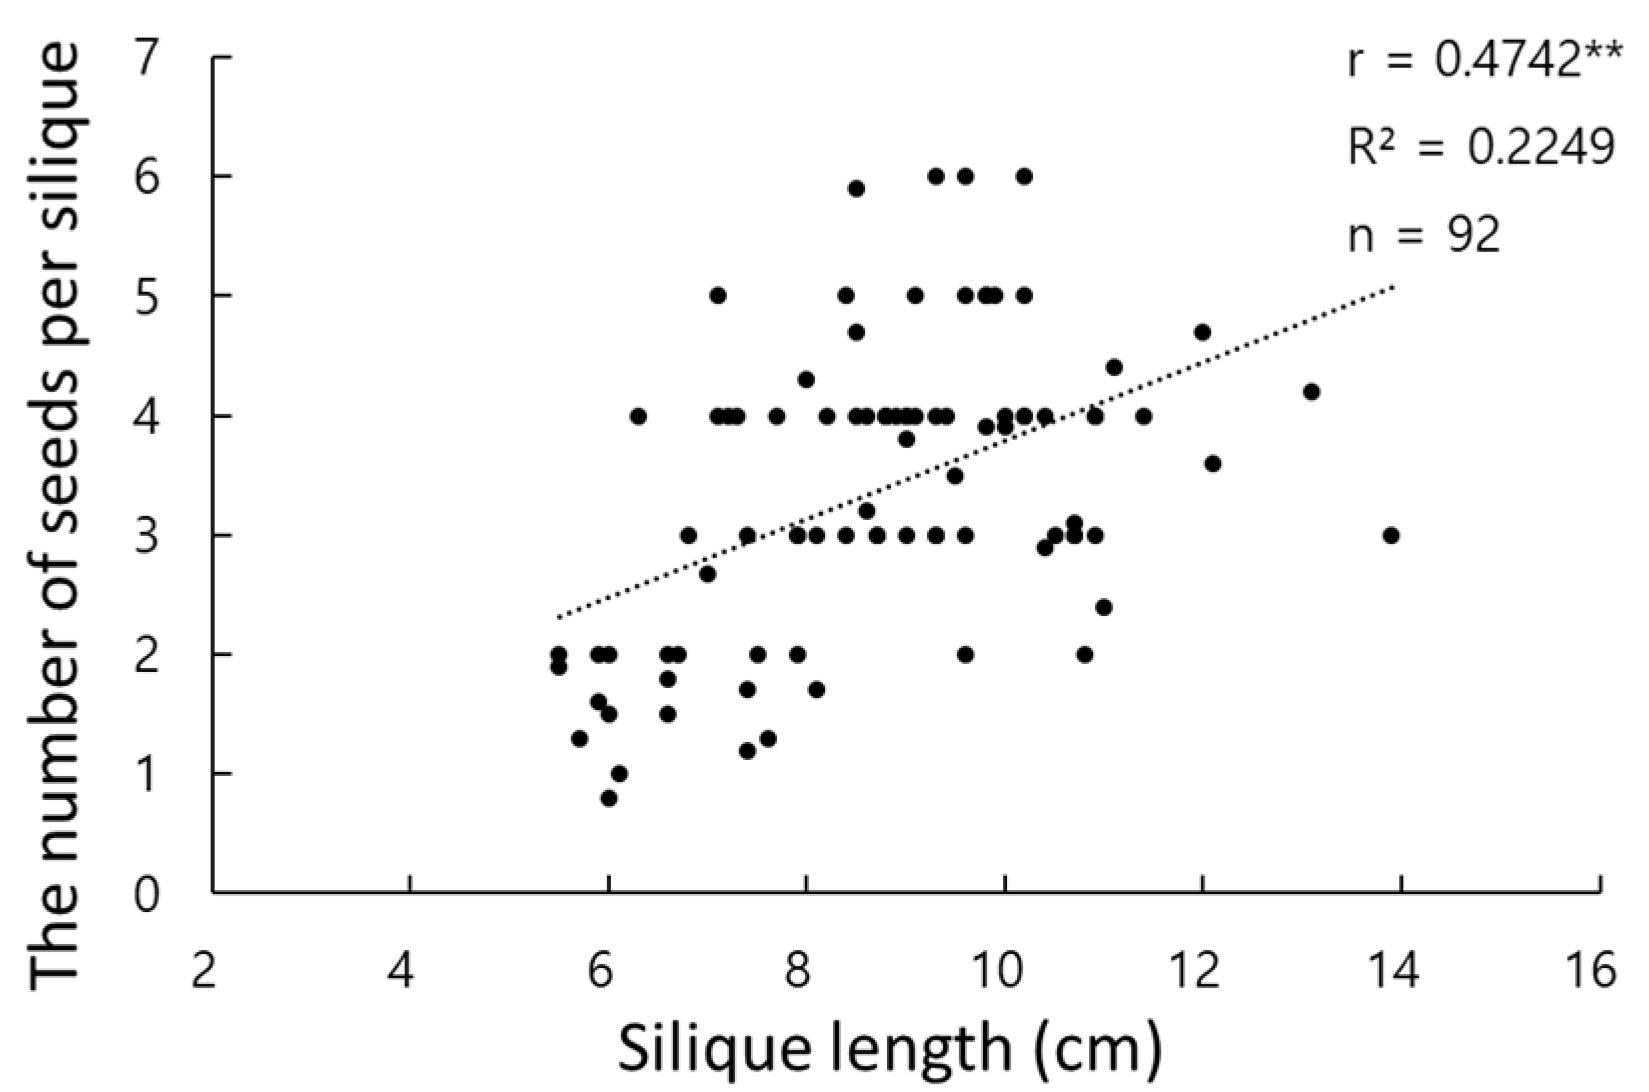
3.1. Evaluation of Phenotypic Data

Significant phenotypic variations were observed among F2 individuals, in silique length (Figure 1a; Figure S1) and the number of seeds per silique (Figure 1b), showing continuous variations, similar to normal distributions for both traits. None of the F2 population showed any transgressive segregation in silique length (Figure 1a), other than in the number of seeds per silique (Figure 1b).
The number of seeds per silique was positively correlated with silique length (r = 0.4742 **) among 92 F2 individuals (Figure 2). The silique length explained approximately 22.5% of phenotypic variation in the number of seeds per silique (Figure 2).

3.2. Identification of Single Nucleotide Polymorphisms Using Gentyping-by-Sequencing

The DNA samples were sequenced in a lane on 103.1 Gbp (682,846,340 reads) with an Illumina HiSeq X platform. A total of 619,369,808 (90.7%) of the sequencing reads were de-multiplexed and 571,300,728 (92.2%) of high-quality trimmed reads had a Phred quality score ≥20, after removing ambiguous nucleotides. The trimmed data were aligned to R. sativus L. genome (RSAskr r1.0) sequence [20]. SNP mining from the sequence data [16] identified 51,345 raw SNPs, common in both parental lines and the 92 F2 population. A total of 6193 SNPs were filtered through the criteria of missing data <30% and minor allele frequency (MAF) >0.05, and 1077 SNPs, showing polymorphism between parental lines, were used for constructing a linkage map.

3.3. Linkage Map Construction

The linkage analysis was conducted with 89 of the 92 F2 population, where three F2 individuals were excluded because of too many missing markers. Among 1077 SNPs obtained through the GBS analysis, 848 SNPs were mapped into nine linkage groups (LG), spanning 870.6 centimorgans (cM) (Table 1). The order of LGs was based on the Radish Genome Database (https://plantgarden.jp/ja/index, assessed on 22 September 2021). LG-R2 was fragmented due to the lack of recombination between the two parental genomes. LG-R7 was missing, since most of the SNPs in this region were filtered out by the criteria of missing data > 30% and MAF < 0.05. LG-R6 (149.7 cM) was the largest and LG-R1 (51.8 cM) was the smallest linkage group. The number of SNPs per LG varied from 23 to 159, and the average intervals between SNPs were from 0.86 (LG-R5) to 2.25 cM (LG-R1), and 1.20 cM in total. A summary of the linkage groups is presented in Table 1.

3.4. QTL Analysis

QTL analysis was performed for the two seed production-related traits on the integrated genotype and phenotype data. A total of three QTL regions were identified; a region for silique length on LG-R4 (Figure 3a) and two for the number of seeds per silique on LG-R3 and -R6 (Figure 3b,c, respectively). The LOD thresholds were 3.9 and 4.1 for silique length and the number of seeds per silique, respectively. The information on identified QTLs is summarized in Table 2 and Table S1.
A QTL was detected for silique length on LG-R4, with LOD thresholds of 9.59 (qSLr4) (Figure 3a; Table 2), which explained 29.6% of the phenotypic variance (Table 2). There were eight SNPs in qSLr4, which spans from 48.781 to 55.211 cM in LG-R4 (Table S1), and negative overdominance was observed in qSLr4 for silique length. Two QTLs for the number of seeds per silique were also detected on LG-R3 and LG-R6, with LOD thresholds of 4.47 (qNSPSr3) and 4.30 (qNSPSr6), respectively (Figure 3b,c; Table 2). These QTLs explained 18.4% (qNSPSr3) and 14.4% (qNSPSr6) of the phenotypic variance and negative additive effects were observed in both QTLs for the number of seeds per silique (Table 2).

3.5. The Prediction of Orthologs

Five genes, near qNSPSr3 and qNSPSr6, located in LG-R3 and LG-R6, respectively, were aligned to 276 A. thaliana genes by BLASTX, to find putative candidate genes related to the number of seeds per silique in radish. Of these, three genes for qNSPSr3, such as RSAskr1.0R3g41067, RSAskr1.0R3g41068 and RSAskr1.0R3g41071, and two genes for qNSPSr6, such as RSAskr1.0R6g71396 and RSAskr1.0R6g71397, were found to be orthologous to 15 A. thaliana genes and, therefore, considered as putative candidate genes for the number of seeds per siliques in radish (Table 3).

4. Discussion

This study is the first report to identify QTLs and SNPs involved in silique length and the number of seeds per silique in radish, based on the sequence information from GBS. The GBS method in this study, on the F2 population and their parental lines, enabled the identification of a sufficient number of polymorphic SNPs and, therefore, can be considered an effective and applicable method for genotyping in radish. The length of the constructed linkage map was 870.6 cM, with 848 SNPs, which has higher and similar density to recent linkage maps used in QTL studies for microspore culture [21], and clubroot resistance [22], respectively, but significantly lower than ultra-high density maps [23,24] in radish. In our linkage map, LG-R7 was not constructed because most of the SNPs in this region had missing data > 30% and MAF < 0.05 and the reasons remain unknown.
The number of seeds per silique is especially important, because it affects the seed production cost and commercialization of new cultivars, not only in radish, but also other Brassica vegetables [4,9]. The two traits, the number of seeds per silique and silique length were positively correlated (Figure 2), which was also reported in a previous study [6]. Therefore, silique length can be regarded as one of the major determinants of radish seed yield, similar to cabbage [4] and rapeseed [11,12]. The two traits also showed continuous variation (Figure 1) and could be considered as QTLs.
A QTL for silique length and two QTLs for the number of seeds per silique were detected in this study (Figure 3; Table 2), but the number of QTLs detected for the two traits were relatively low, compared to cabbage [4] and rapeseed [9,10,11,12]. This may be due to the incomplete genetic map and insufficient number in the F2 population. LG-R7 was missing, as described above, and LG-R1 and R2 were small-sized and fragmented, respectively, possibly due to the limited recombination between the two parental genomes. The number of QTLs was also possibly affected by population size, since the detection power of QTLs decreases as population size decreases. In simulation studies, the low limits of QTL heritability, in population sizes of N = 200, 100 and 50, were about 0.10, 0.14 and 0.30, respectively [25]. Our study was incongruent with the previous study, showing no detection of QTLs with a smaller effect than 0.144 (Table 2), with a population size of N = 89. Besides, the relatively small number of QTLs resulted in no pleiotropic QTLs between the two seed production traits, which were often observed in other Brassica crops. For example, silique-related traits, including silique length, the number of seeds per silique, thousand seed weight and seed density, were co-resided in throughout the genome in B. napus [26]. Further studies should be conducted using different parental lines, with sufficient progeny population size, in order to detect additional QTLs for silique length and the number of seeds per silique in radish.
Five radish genes near QTLs, associated with the number of seeds per silique, were orthologous to 15 A. thaliana genes (Table 3). These putative candidate genes were also found in B. napus [18] and related to the development of embryo sac, ovule, embryo and pollen, as well as the double fertilization process [18], all of which are related to the pollination, fertilization and seed development. For example, mitogen-activated protein (MAP) kinase 6, which is involved in seed formation in A. thaliana [27], was orthologous to RSAskr1.0R6g71397 in radish located in qNSPSr6, the QTL associated with the number of seeds per silique in radish (Table 2 and Table 3).
The limitation of the present study is that the results were based on a single investigation, although the F2 population was grown in a controlled environment to minimize the environmental effects, and further studies are necessary to confirm these results and to find additional QTLs for both seed production traits. Nevertheless, the present study can be useful as a guideline for the future QTL studies for seed production in radish, by suggesting the experimental plot design with pollinators and pollinizers having different S haplotypes, appropriate population size, and potential QTL positions, related to seed production.

Supplementary Materials

The following are available online at https://www.mdpi.com/article/10.3390/horticulturae8030268/s1, Table S1: Summary of the QTL regions related to silique length including linkage groups (LGs), single nucleotide polymorphism (SNP), position, logarithm of the odds (LOD). Figure S1: An example of phenotypic observation of silique length. From the left, two siliques from paternal and maternal lines, and 15 siliques from an F2 individual no. ‘52’.

Author Contributions

Conceptualization, W.C. and S.P.; data curation, J.L., K.H. and Y.J.; formal analysis, K.H. and J.K.; funding acquisition, W.C.; investigation, S.P.; methodology, W.C. and S.P.; project administration, S.P. and J.K.; supervision, J.K. and S.P.; writing—original draft preparation, W.C.; writing—review and editing, W.C. and J.K. All authors have read and agreed to the published version of the manuscript.

Funding

This research was supported by the Golden Seed Project (Center for Vegetable Seed Development, No. 213006--05-5-SBJ20.

Institutional Review Board Statement

Not applicable.

Data Availability Statement

The datasets generated during the current study are available from the corresponding author upon reasonable request.

Conflicts of Interest

The authors declare no conflict of interest.

References

  1. Muuoz, M.C.; Bermejo, J.E.H. La corola en la tribu Brassiceae. Anales Inst. Bot. Cavanilles 1978, 35, 297–334. [Google Scholar]
  2. Kaneko, Y.; Kimizuka-Takagi, C.; Bang, S.; Matsuzawa, Y. Radish. In Genome Mapping and Molecular Breeding in Plants; Kole, C., Ed.; Springer: Berlin/Heidelberg, Germany, 2007; Volume 5, pp. 141–160. [Google Scholar]
  3. Go’mez-Campo, C. (Ed.) Taxonomy. In Biology of Brassica Coenospecies; Elsevier: New York, NY, USA, 1999; pp. 3–32. [Google Scholar]
  4. Li, X.; Kong, C.; Yu, H.; Liu, X.; Fang, Z.; Liu, Y.; Yang, L.; Zhuang, M.; Wang, Y.; Lv, H.; et al. Identification of a major QTL for seed number per silique in cabbage (Brassica oleracea L. var. capitata) using genotyping by sequencing. Euphytica 2019, 215, 133. [Google Scholar] [CrossRef]
  5. Yang, Y.; Wang, Y.; Zhan, J.; Shi, J.; Wang, X.; Liu, X.; Wang, H. Genetic and cytological analyses of the natural variation of seed number per pod in rapeseed (Brassica napus L.). Front. Plant Sci. 2017, 8, 1890. [Google Scholar] [CrossRef] [PubMed] [Green Version]
  6. Kang, E.; Ha, S.; Ko, H.; Yu, H.; Chae, W. Reproductive traits and molecular evidence related to the global distribution of cultivated radish (Raphanus sativus L.). Plant Syst. Evol. 2016, 302, 1367–1380. [Google Scholar] [CrossRef]
  7. Bonnema, G.; Del Carpio, D.P.; Zhao, J. Diversity analysis and molecular taxonomy of Brassica vegetable crops. In Genetics, Genomics and Breeding of Vegetable Brassicas; Sadowski, J., Kole, C., Eds.; CRC Press: Boca Raton, FA, USA, 2011; pp. 81–124. [Google Scholar]
  8. Jatoi, S.A.; Javaid, A.; Iqbal, M.; Sayal, O.U.; Masood, M.S.; Siddiqui, S.U. Genetic diversity in radish germplasm for morphological traits and seed storage proteins. Pak. J. Bot. 2011, 43, 2507–2512. [Google Scholar]
  9. Zhang, L.W.; Li, S.P.; Chen, L.; Yang, G.S. Identification and mapping of a major dominant quantitative trait locus controlling seeds per silique as a single Mendelian factor in Brassica napus L. Theor. Appl. Genet. 2012, 125, 695–705. [Google Scholar] [CrossRef] [PubMed]
  10. Zhu, Y.; Ye, J.; Zhan, J.; Zheng, X.; Zhang, J.; Shi, J.; Wang, X.; Liu, G.; Wang, H. Validation and characterization of a seed number per silique quantitative trait locus qSN.A7 in rapeseed (Brassica napus L.). Front. Plant Sci. 2020, 11, 68. [Google Scholar] [CrossRef] [PubMed]
  11. Yang, P.; Shu, C.; Chen, L.; Xu, J.; Wu, J.; Liu, K. Identification of a major QTL for silique length and seed weight in oilseed rape (Brassica, napus, L.). Theor. Appl. Genet. 2012, 125, 285–296. [Google Scholar] [CrossRef] [PubMed]
  12. Li, N.; Shi, J.; Wang, X.; Liu, G.; Wang, H. A combined linkage and regional association mapping validation and fine mapping of two major pleiotropic QTLs for seed weight and silique length in rapeseed (Brassica napus L.). BMC Plant Biol. 2014, 14, 1–14. [Google Scholar] [CrossRef] [Green Version]
  13. Elshire, R.J.; Glaubitz, J.C.; Sun, Q.; Poland, J.A.; Kawamoto, K.; Buckler, E.S.; Mitchell, E.S. A Robust, Simple Genotyping-by-Sequencing (GBS) Approach for High Diversity Species. PLoS ONE 2011, 6, e19379. [Google Scholar] [CrossRef] [Green Version]
  14. Li, H.; Durbin, R. Fast and accurate short read alignment with Burrows-Wheeler transform. Bioinformatics 2009, 25, 1754–1760. [Google Scholar] [CrossRef] [PubMed] [Green Version]
  15. Li, H.; Handsaker, B.; Wysoker, A.; Fennell, T.; Ruan, J.; Homer, N.; Marth, G.; Abecasis, G.; Durbin, R. The Sequence Alignment/Map format and SAMtools. Bioinformatics 2009, 25, 2078–2079. [Google Scholar] [CrossRef] [PubMed] [Green Version]
  16. Kim, J.E.; Oh, S.K.; Lee, J.H.; Lee, B.M.; Jo, S.H. Genome-wide SNP calling using next generation sequencing data in tomato. Mol. Cells 2014, 37, 36–42. [Google Scholar] [CrossRef] [PubMed]
  17. Wang, S.; Basten, C.J.; Zeng, Z.B. Windows QTL Cartographer 2.5. Department of Statistics; North Carolina State University: Raleigh, NC, USA, 2012; Available online: http://statgen.ncsu.edu/qtlcart/WQTLCart.htm (accessed on 22 September 2021).
  18. Stuber, C.W.; Edwards, M.D.; Wendel, J.F. Molecular marker-facilitated investigations of quantitative trait loci in maize. II. Factors influencing yield and its component traits 1. Crop. Sci. 1987, 27, 639–648. [Google Scholar] [CrossRef] [Green Version]
  19. Yang, Y.; Shi, J.; Wang, X.; Liu, G.; Wang, H. Genetic architecture and mechanism of seed number per pod in rapeseed: Elucidated through linkage and near-isogenic line analysis. Sci. Rep. 2016, 6, 24124. [Google Scholar] [CrossRef] [PubMed] [Green Version]
  20. Shirasawa, K.; Hirakawa, H.; Fukino, N.; Kitashiba, H.; Isobe, H. Genome sequence and analysis of a Japanese radish (Raphanus sativus) cultivar named ‘Sakurajima Daikon’ possessing giant root. DNA Res. 2020, 27, dsaa010. [Google Scholar] [CrossRef] [PubMed]
  21. Kim, K.; Kang, Y.; Lee, S.; Choi, S.; Jeon, D.; Park, M.; Park, S.; Lim, Y.; Kim, C. Quantitative trait loci (QTLs) associated with microspore culture in Raphanus sativus L. (radish). Genes 2020, 11, 337. [Google Scholar] [CrossRef] [Green Version]
  22. Gan, C.; Deng, X.; Cui, L.; Yu, X.; Yuan, W.; Dai, Z.; Yao, M.; Pang, W.; Ma, Y.; Yu, X.; et al. Construction of a high-density genetic linkage map and identification of quantitative trait loci associated with clubroot resistance in radish (Raphanus sativus L.). Mol. Breed. 2019, 39, 116. [Google Scholar] [CrossRef]
  23. Mun, J.; Chung, H.; Chung, W.; Oh, M.; Jeong, Y.; Kim, N.; Ahn, B.; Park, B.; Park, S.; Lim, K.; et al. Construction of a reference genetic map of Raphanus sativus based on genotyping by whole-genome resequencing. Theor. Appl. Genet. 2015, 128, 259–272. [Google Scholar] [CrossRef]
  24. Luo, X.; Xu, L.; Wang, Y.; Dong, J.; Chen, Y.; Tang, M.; Fan, L.; Zhu, Y.; Liu, L. An ultra-high-density genetic map provides insights into genome synteny, recombination landscape and taproot skin colour in radish (Raphanus sativus L.). Plant Biotechnol. J. 2020, 18, 274–286. [Google Scholar] [CrossRef] [PubMed] [Green Version]
  25. Charmet, G. Power and accuracy of QTL detection: Simulation studies of one-QTL models. Agronomie 2000, 20, 309–323. [Google Scholar] [CrossRef] [Green Version]
  26. Wang, X.; Chen, L.; Wang, A.; Wang, H.; Tian, J.; Zhao, X.; Chao, H.; Zhao, Y.; Zhao, W.; Xiang, J.; et al. Quantitative trait loci analysis and genome-wide comparison for silique related traits in Brassica napus. BMC Plant Biol. 2016, 16, 71. [Google Scholar] [CrossRef] [PubMed] [Green Version]
  27. López-Bucio, J.S.; Dubrovsky, J.G.; Raya-González, J.; Ugartechea-Chirino, Y.; López-Bucio, J.; de Luna-Valdez, L.A.; Ramos-Vega, M.; León, P.; Guevara-García, A.A. Arabidopsis thaliana mitogen-activated protein kinase 6 is involved in seed formation and modulation of primary and lateral root development. J. Exp. Bot. 2014, 65, 169–183. [Google Scholar] [CrossRef] [PubMed] [Green Version]
Figure 1. The distributions of silique length (a) and the number of seeds per silique (b) in radish among 92 F2 individuals.
Horticulturae 08 00268 g001
Figure 2. The correlation between the number of seeds per silique and silique length in radish among 92 F2 individuals. ** indicates significant at p ≤ 0.01 level.
Horticulturae 08 00268 g002
Figure 3. Logarithm of odds (LOD) score plots for linkage groups (LG) containing QTLs associated with silique length in LG-R4 (a) and the number of seeds per silique in LG-R3 (b) and LG-R6 (c) of radish. The horizontal lines indicate the thresholds for the LOD scores.
Horticulturae 08 00268 g003
Table 1. The number of single nucleotide polymorphisms (SNPs), genetic distance and average intervals of nine radish linkage groups.
Linkage GroupsNo. SNPsGenetic Distance (cM)Average Interval
Genetic Map (cM)Physical Map (kb) 1
R12351.82.251205.2
R2-15088.01.76346.3
R2-274111.51.51
R3127119.90.94247.3
R4126116.90.93448.4
R58875.90.86481.3
R6159149.70.94339.2
R810066.30.66283.2
R910190.60.90381.4
Total848870.61.20379.4
1 Average interval in physical map was calculated based on Shirasawa et al., 2020 [20].
Table 2. Summary of the QTL regions related to seed production traits in radish, including linkage groups (LGs), single nucleotide polymorphism (SNP), position in LG, logarithm of the odds (LOD) score, values for additive or dominant effect, proportion of variance explained by each QTL (R2) and estimated gene action (|d/a|).
TraitsQTL NamesLGsSNPsPosition in LGLODAdditiveDominantR2|d/a|Value 1
Silique lengthqSLr4R4R4_38169053–R4_4052029148.781–55.2119.591.061−1.6470.296OD
No. seeds per siliqueqNSPSr3R3R3_2723507595.0924.47−0.6110.1320.184A
qNSPSr6R6R6_5226134493.3234.30−0.614−0.9530.144A
1 Estimation of gene action: A (additive effect) 0–0.20, PD (partial dominance) 0.21–0.80, D (dominance) 0.81–1.20, and OD (overdominance).
Table 3. The list of Arabidopsis orthologs related to the two QTL regions for the number of seeds per silique in radish. Traits related to genes were based on Yang et al., 2019 [19].
QTL NamesGene IDA.T. OrthologsGene NameTraits Related
qNSPSr3RSAskr1.0R3g41067AT1G07890APX1Embryo Development
RSAskr1.0R3g41068AT3G11440ATMYB65pollen development
RSAskr1.0R3g41068AT4G18770ATMYB98Embryo Sac Development
RSAskr1.0R3g41068AT1G14350ATMYB124Embryo Sac Development
RSAskr1.0R3g41071AT1G09100RPT5BEmbryo Sac Development
RSAskr1.0R3g41071AT3G05530ATS6A.2Embryo Sac Development
qNSPSr6RSAskr1.0R6g71396AT5G57800CER3Double Fertilization
RSAskr1.0R6g71397AT1G71830ATSERK1Embryo development ending in seed dormancy
RSAskr1.0R6g71397AT3G02130CLI1Embryo development ending in seed dormancy
RSAskr1.0R6g71397AT5G44700EDA23Embryo Sac Development
RSAskr1.0R6g71397AT1G08590ATPXL1Embryo Development
RSAskr1.0R6g71397AT1G11130SCMOvule development
RSAskr1.0R6g71397AT1G63700EMB71Embryo development ending in seed dormancy
RSAskr1.0R6g71397AT2G43790ATMAPK6Ovule development
RSAskr1.0R6g71397AT5G20930TSLOvule development
Publisher’s Note: MDPI stays neutral with regard to jurisdictional claims in published maps and institutional affiliations.

